Mapping the Dabus Wetlands, Ethiopia, Using Random Forest Classification of Landsat, PALSAR and Topographic Data


Abstract
:
1. Introduction
2. Materials and Methods
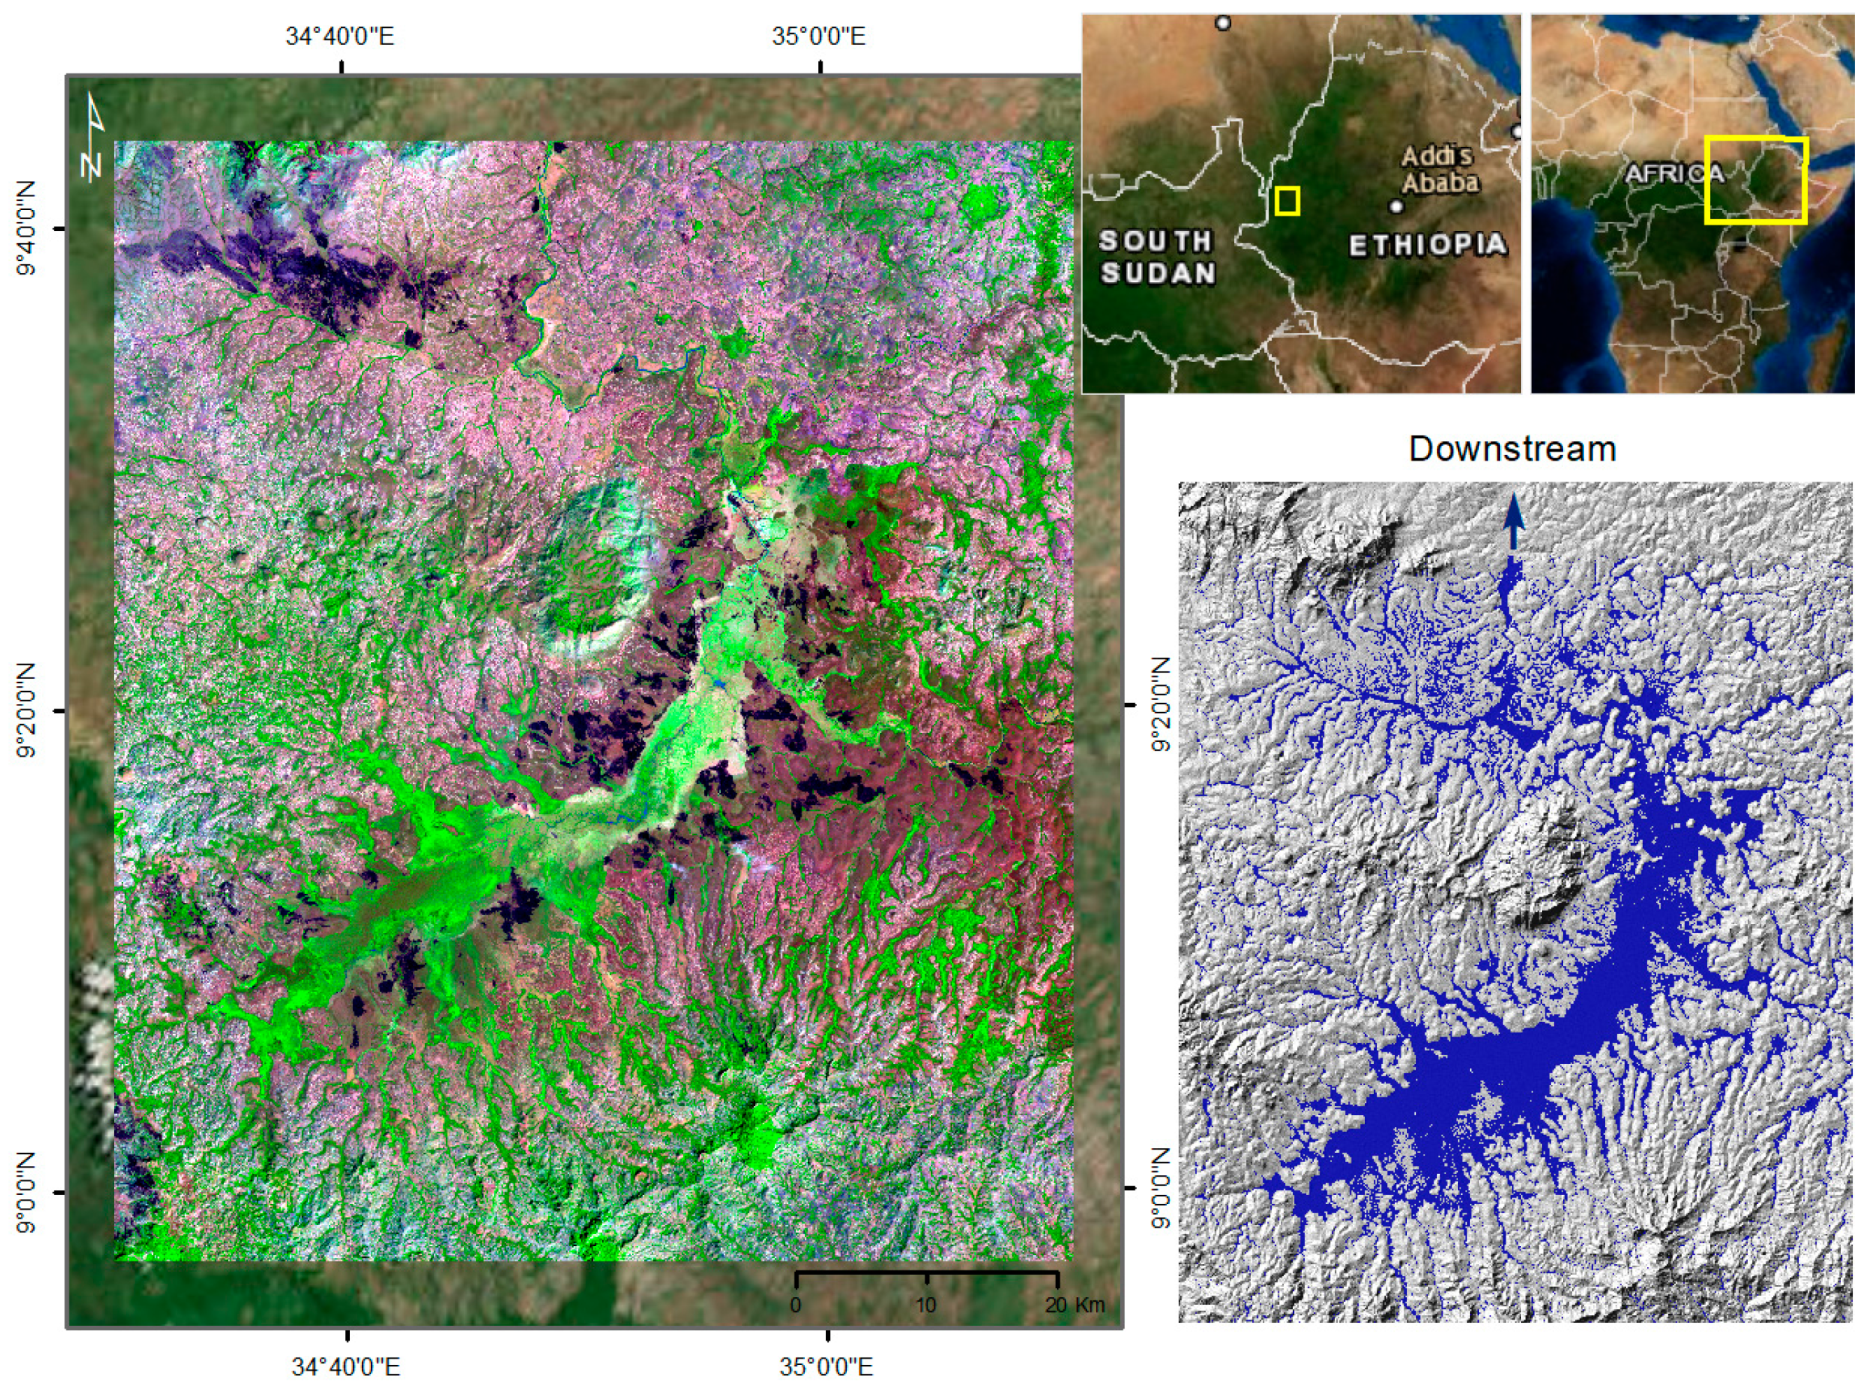
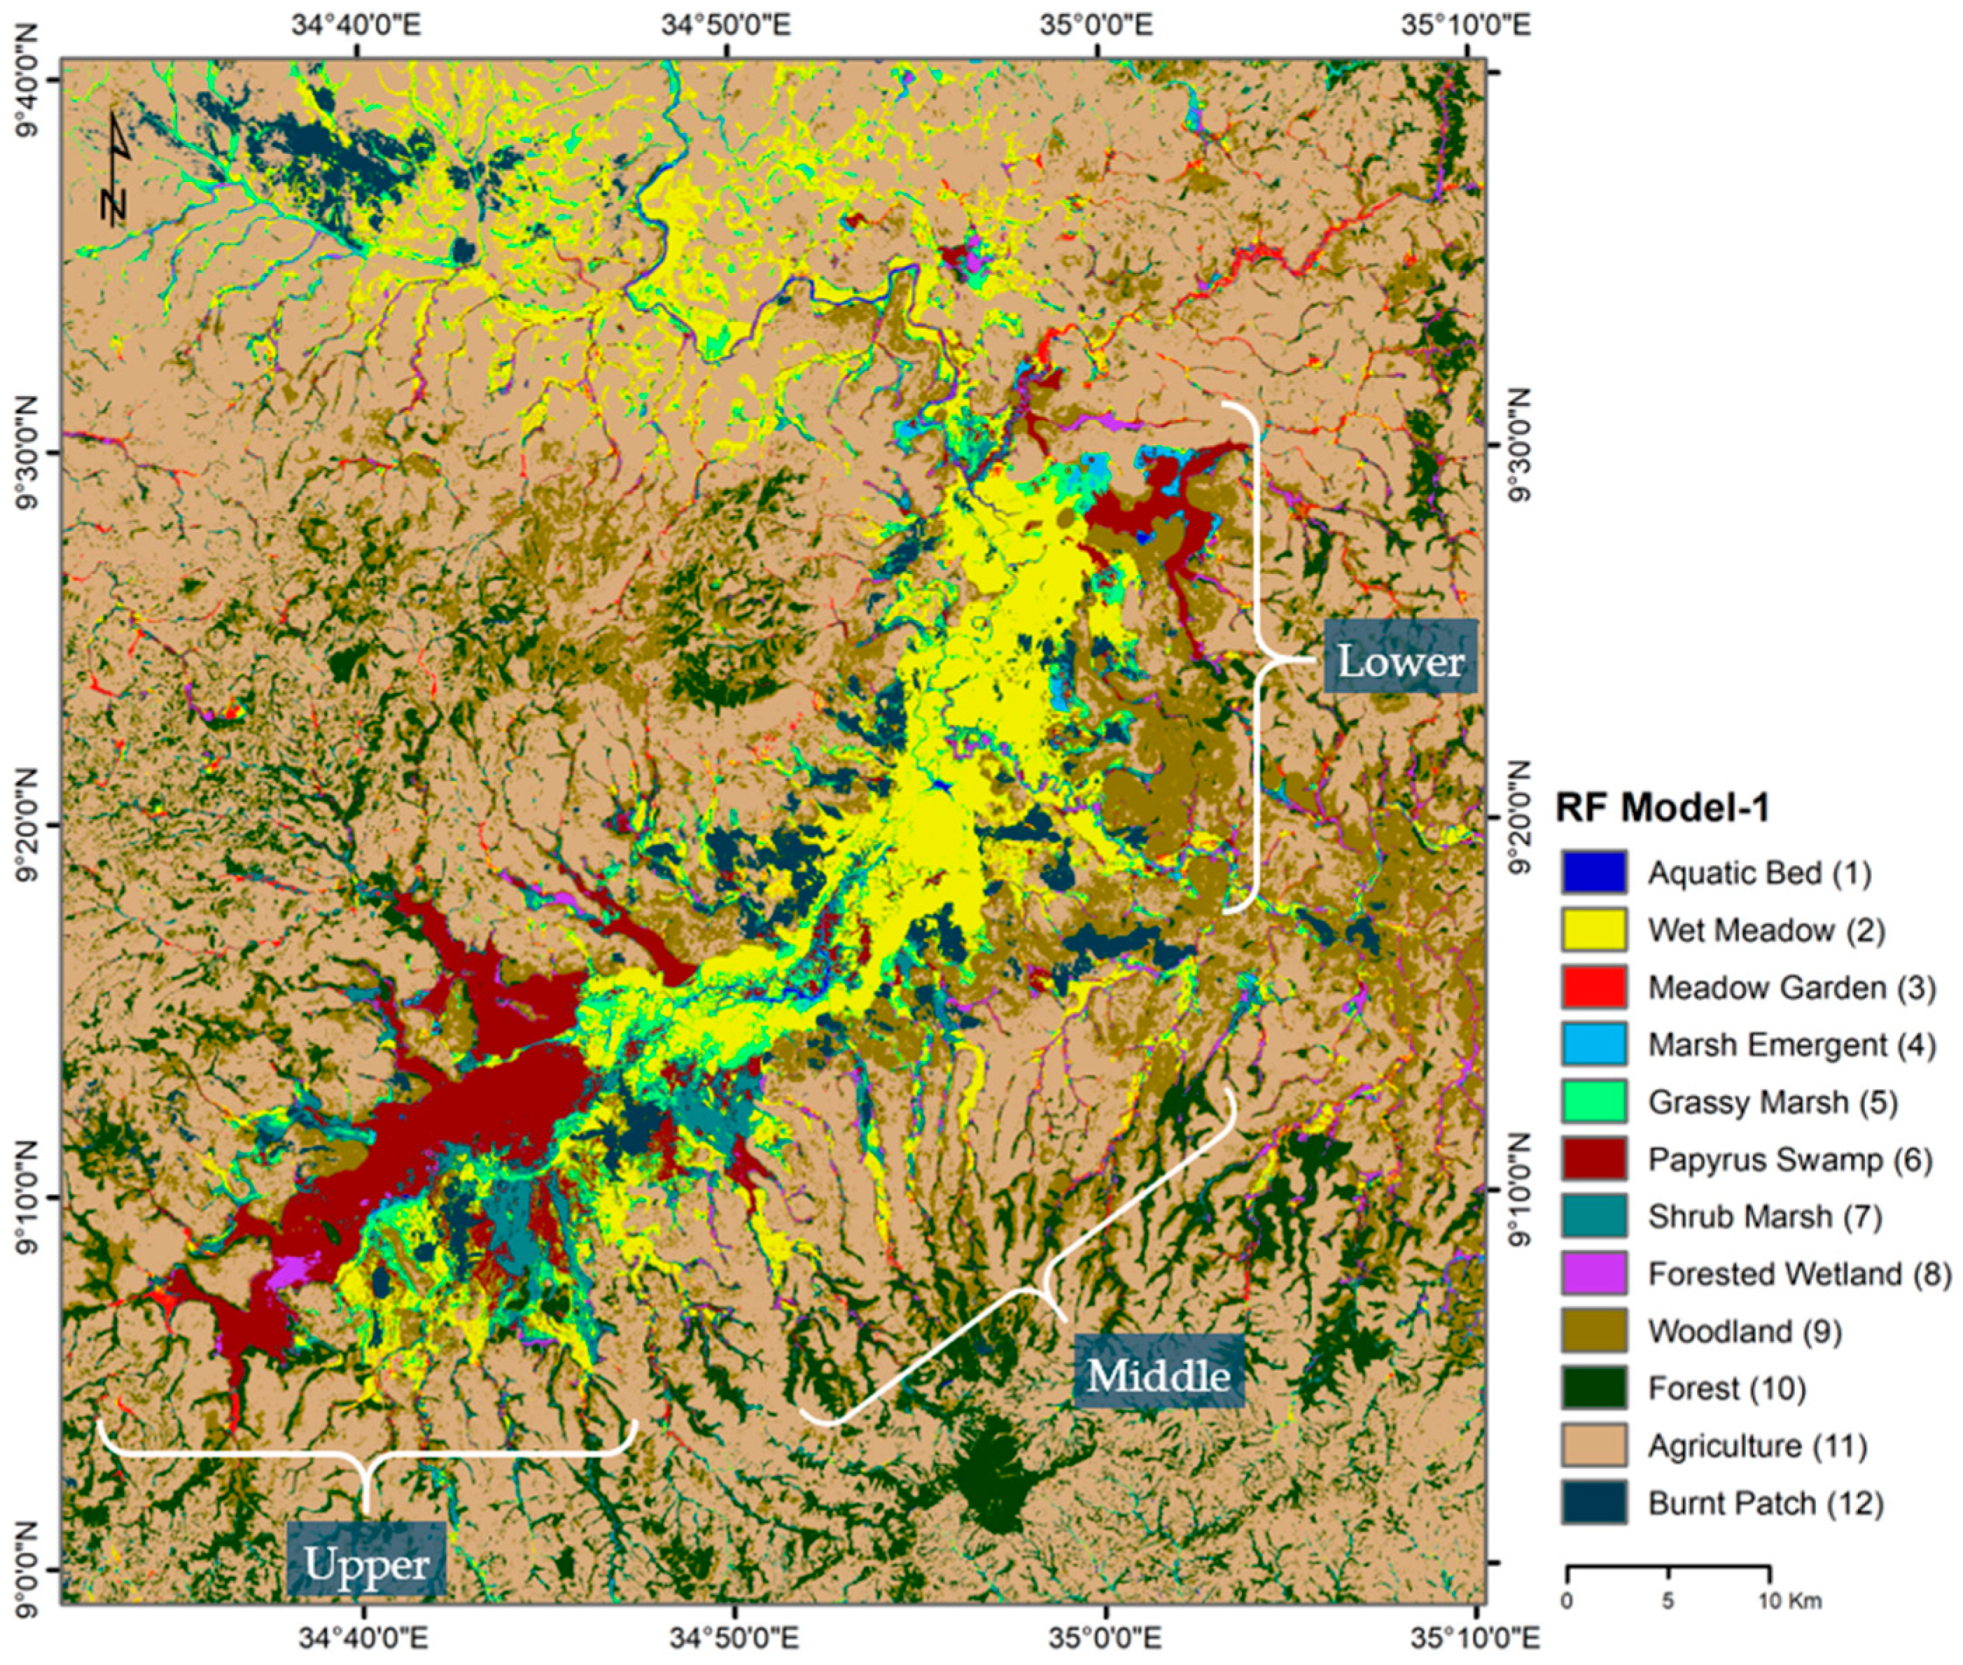
2.1. Study Area
2.2. Wetland Classes and Reference Data Collection
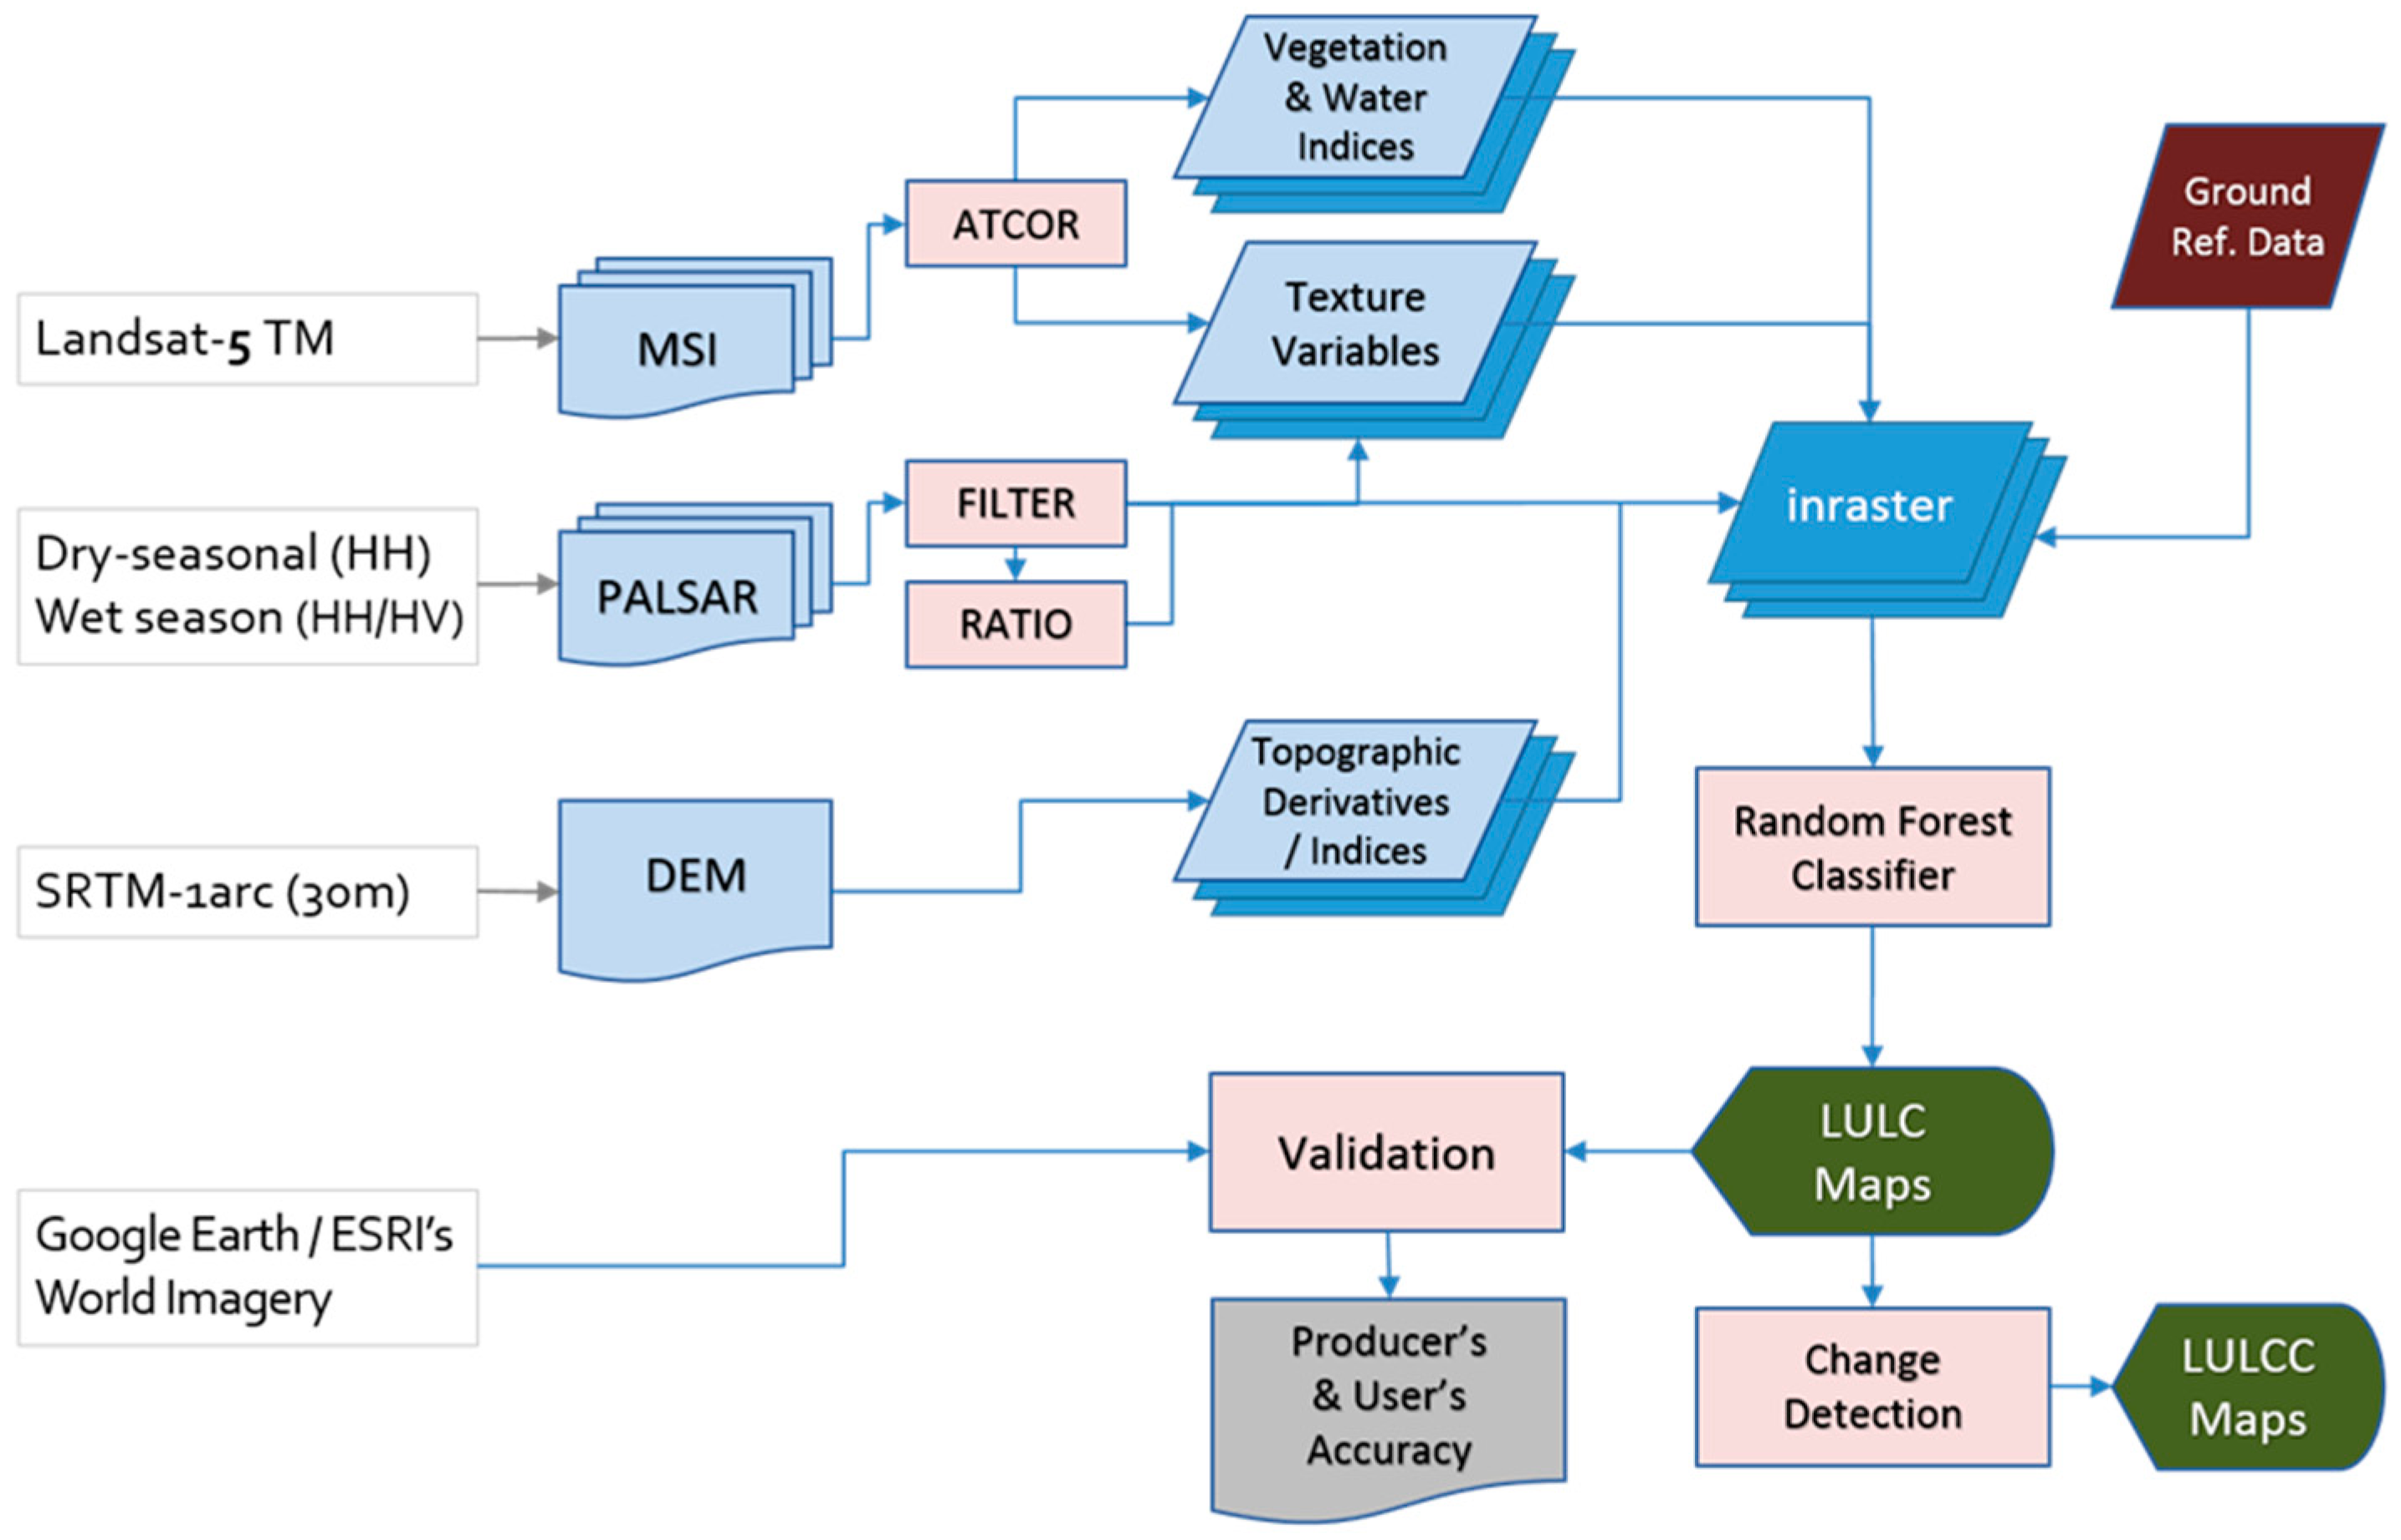
2.3. Remotely Sensed Data Acquisition and Processing
2.3.1. Landsat
2.3.2. PALSAR
2.4. Variables Derived from the Landsat, PALSAR and DEM Data
2.5. Image Classification
3. Results
3.1. Evaluation of Classification Models—Overall Accuracy
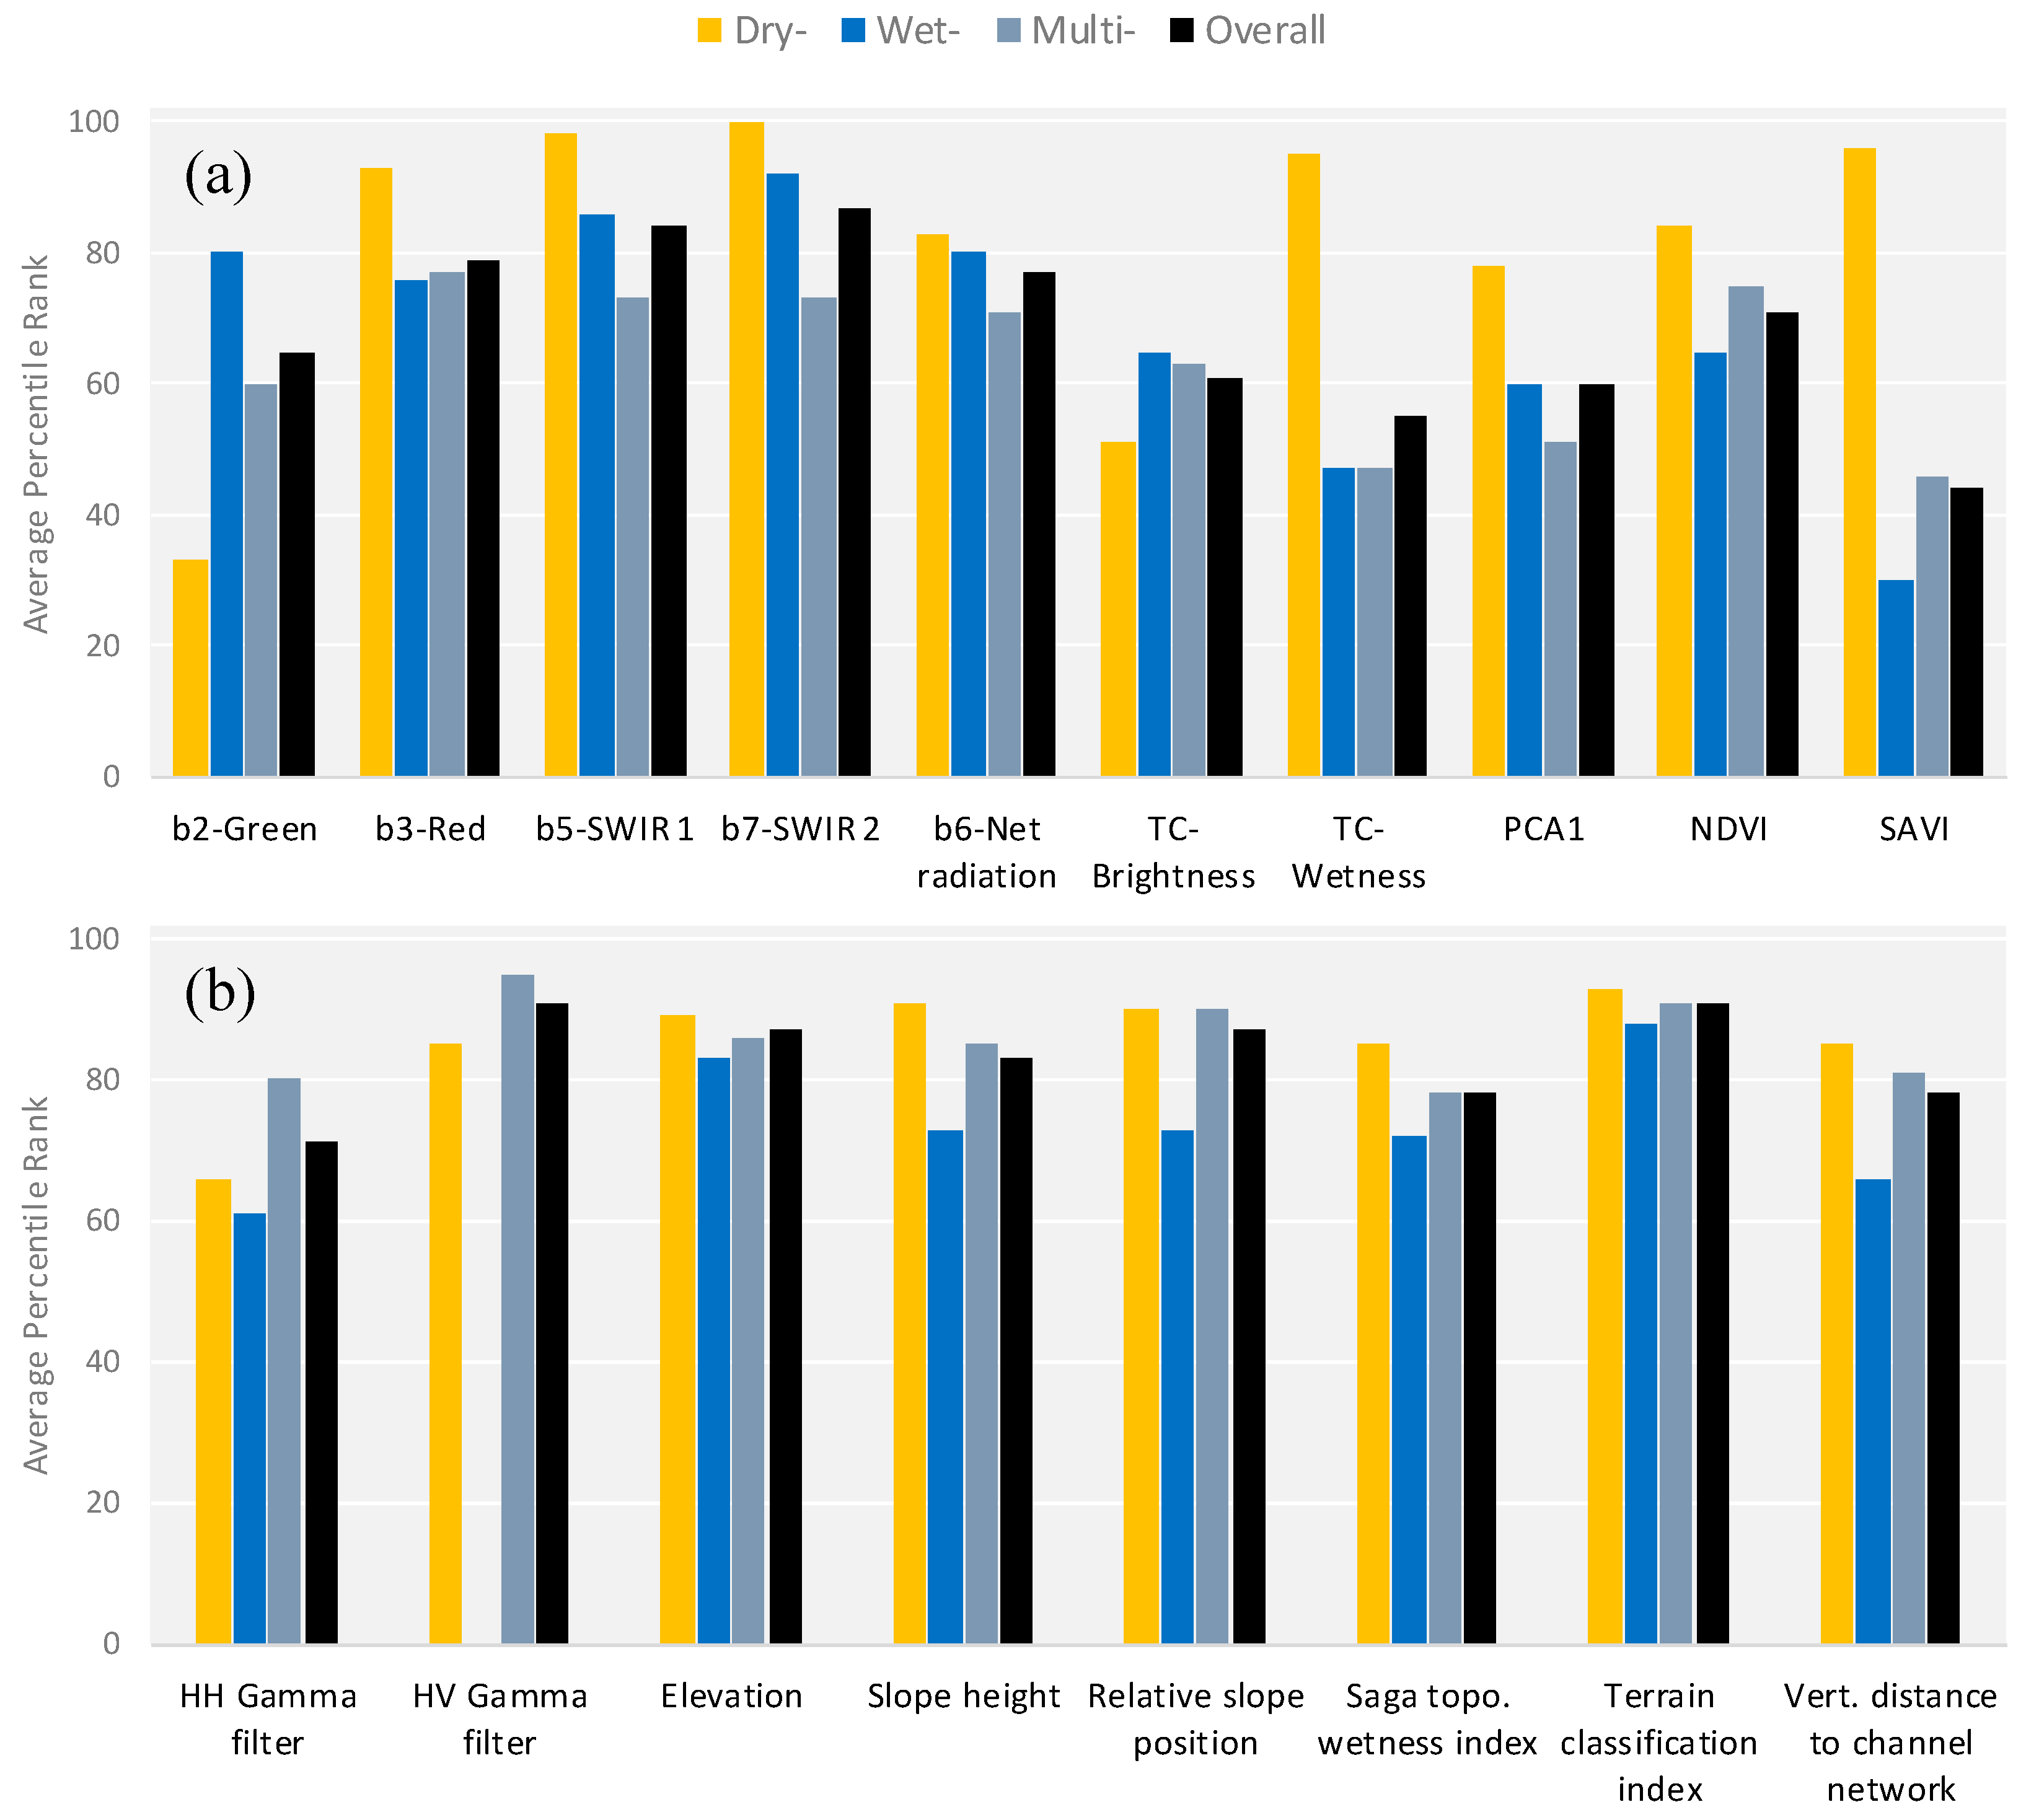
Analysis of Variable Contributions to Overall Classification Accuracy
3.2. Analysis of Individual Class Accuracies
Seasonal Differences in Individual Class Accuracies
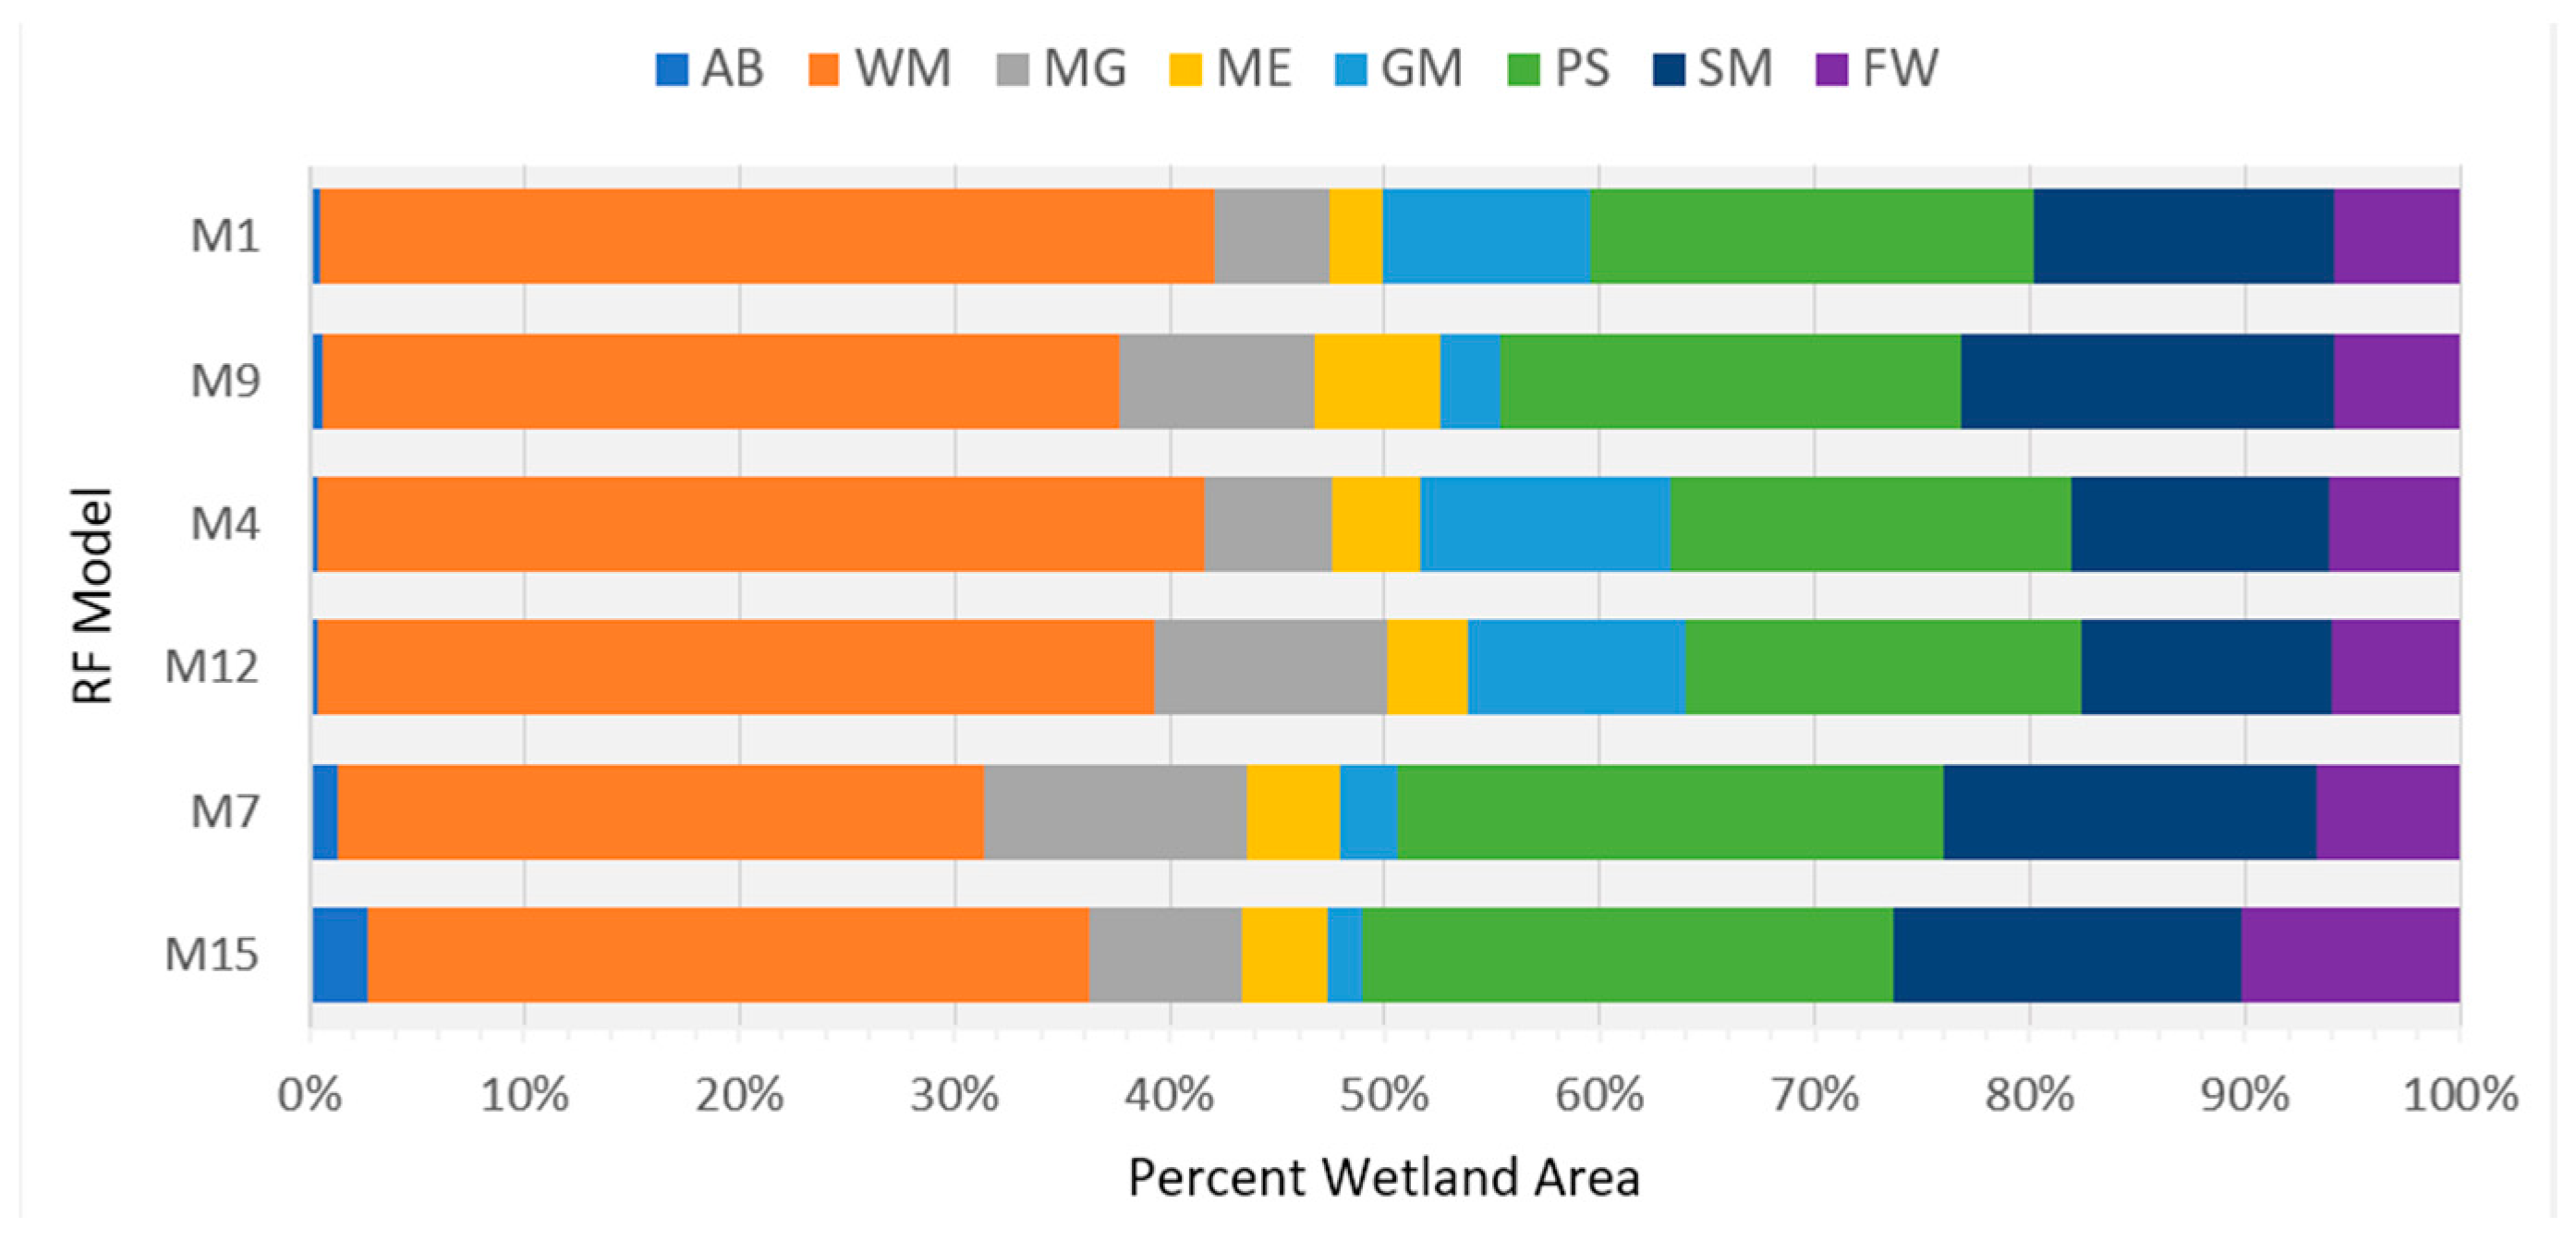
3.3. Analysis of Differences in Class Extent between RF Models
4. Discussion
4.1. Interpretation of Main Findings and Relations to Previous Studies
Random Forest Classifier Performance and Variable Importance
4.2. Limitations and Recommendations for Future Mapping of Wetlands
5. Conclusions
Acknowledgments
Author Contributions
Conflicts of Interest
References
- Mitsch, W.J.; Gosselink, J.G. Wetlands, 4th ed.; John Wiley & Sons: New York, NY, USA, 2007; p. 582. ISBN 978-0-471-69967-5. [Google Scholar]
- Chapman, L.J.; Balirwa, J.; Bugenyi, F.W.B.; Chapman, C.A.; Crisman, T.L. Wetlands of East Africa: Biodiversity, exploitation, and policy perspectives. In Biodiversity in Wetland: Assessment, Function and Conservation; Gopal, B., Junk, W.J., Davis, J.A., Eds.; Backhuys Publishers: Leiden, The Netherlands, 2001; Volume 2, pp. 101–131. [Google Scholar]
- Hughes, R.H.; Hughes, J.S. A Directory of African Wetlands; IUCN—The World Conservation Union: Gland, Switzerland; Cambridge, UK; United Nations Environment Programme: Nairobi, Kenya; World Conservation Monitoring Centre: Cambridge, UK, 1992; p. 819. ISBN 978-2880329495. [Google Scholar]
- Jones, M.B. The photosynthetic characteristics of papyrus in a tropical swamp. Oecologia 1987, 71, 355–359. [Google Scholar] [CrossRef] [PubMed]
- Betbeder, J.; Gond, V.; Frappart, F.; Baghdadi, N.N.; Briant, G.; Bartholome, E. Mapping of Central Africa forested wetlands using remote sensing. IEEE J. Sel. Top. Appl. Earth Obs. Remote Sens. 2014, 7, 531–542. [Google Scholar] [CrossRef] [Green Version]
- Finlayson, C.M.; Davidson, N.C.; Spiers, A.G.; Stevenson, N.J. Global wetland inventory–current status and future priorities. Mar. Freshw. Res. 1999, 50, 717–727. [Google Scholar] [CrossRef]
- McCartney, M.; de Silva, S.; Rebelo, L.-M.; Greatrix, E.; Mapedza, E.; Morardet, S.; Murgue, C.; Noble, A. Wetlands and People; IWMI International Water Management Institute: Colombo, Sri Lanka, 2014; p. 32. ISBN 978-92-9090-784-8. [Google Scholar]
- Coughanowr, C. Wetlands of the Humid Tropics: Water Related Issues and Problems of the Humid Tropic and Other Warm Humid Regions; UNESCO: Paris, France, 1998; p. 47. [Google Scholar]
- Finlayson, C.M.; D’Cruz, R.; Aladin, N.; Barker, D.; Beltram, G.; Brouwer, J.; Davidson, N.; Duker, L.; Junk, W.; Kaplowitz, M. Inland water systems. In Ecosystems and Human Well-Being: Current State and Trends; Hassan, R., Scholes, R.J., Ash, N., Eds.; Island Press: Washington, DC, USA, 2005; Volume 1, pp. 553–583. [Google Scholar]
- Environment Protection Authority (EPA). National Report on the 43 Surveyed Wetlands; The Ecosystem Department of the Environment Protection Authority (EPA): Addis Ababa, Ethiopia, 2003; p. 122.
- Geheb, K.; Yilma, D.A. Wetlands of Ethiopia: Proceedings of a Seminar on the Resources and Status of Ethiopia’s Wetlands; Abebe, Y.D., Geheb, K., Eds.; IUCN—The World Conservation Union: Addis Ababa, Ethiopia, 2003; p. 116. [Google Scholar]
- Ozesmi, S.L.; Bauer, M.E. Satellite remote sensing of wetlands. Wetl. Ecol. Manag. 2002, 10, 381–402. [Google Scholar] [CrossRef]
- Rosenqvist, A.; Shimada, M.; Milne, A.K. The ALOS Kyoto & Carbon Initiative. In Proceedings of the International Geoscience and Remote Sensing Symposium (IGARSS 2007), Barcelona, Spain, 23–28 July 2007; IEEE: Barcelona, Spain, 2007; pp. 3614–3617. [Google Scholar]
- Adam, E.; Mutanga, O.; Rugege, D. Multispectral and hyperspectral remote sensing for identification and mapping of wetland vegetation: A review. Wetl. Ecol. Manag. 2010, 18, 281–296. [Google Scholar] [CrossRef]
- Belgiu, M.; Drăguţ, L. Random Forest in remote sensing: A review of applications and future directions. ISPRS J. Photogramm. Remote Sens. 2016, 114, 24–31. [Google Scholar] [CrossRef]
- Dingle Robertson, L.; King, D.J.; Davies, C. Object-based image analysis of optical and radar variables for wetland evaluation. Int. J. Remote Sens. 2015, 36, 5811–5841. [Google Scholar] [CrossRef]
- Dingle Robertson, L.; King, D.J.; Davies, C. Assessing land cover change and anthropogenic disturbance in wetlands using vegetation fractions derived from Landsat 5 TM imagery (1984–2010). Wetlands 2015, 35, 1077–1091. [Google Scholar] [CrossRef]
- Henderson, F.M.; Lewis, A.J. Radar detection of wetland ecosystems: A review. Int. J. Remote Sens. 2008, 29, 5809–5835. [Google Scholar] [CrossRef]
- Jones, K.; Lanthier, Y.; van der Voet, P.; van Valkengoed, E.; Taylor, D.; Fernández-Prieto, D. Monitoring and assessment of wetlands using Earth Observation: The GlobWetland project. J. Environ. Manag. 2009, 90, 2154–2169. [Google Scholar] [CrossRef] [PubMed]
- Klemas, V. Remote sensing of emergent and submerged wetlands: An overview. Int. J. Remote Sens. 2013, 34, 6286–6320. [Google Scholar] [CrossRef]
- Millard, K.; Richardson, M. Wetland mapping with LiDAR derivatives, SAR polarimetric decompositions, and LiDAR–SAR fusion using a Random Forest classifier. Can. J. Remote Sens. 2013, 39, 290–307. [Google Scholar] [CrossRef]
- Wolf, B. GlobWetland II: Wetland mapping in North Africa. In Proceedings of the 2011 GEOSS Workshop XLI, Vancouver, BC, Canada, 24 July 2011; pp. 1–40. [Google Scholar]
- Jensen, J.R. Remote Sensing of the Environment: An Earth Resource Perspective, 2nd ed.; Pearson Prentice Hall: Upper Saddle River, NJ, USA, 2007; p. 592. ISBN 978-0131889507. [Google Scholar]
- Kumar, L.; Schmidt, K.; Dury, S.; Skidmore, A. Review of hyperspectral remote sensing and vegetation science. In Imaging Spectrometry: Basic Principles and Prospective Applications; van der Meer, F.D., de Jong, S.M., Eds.; Kluwer Academic: Dordrecht, The Netherlands, 2001; Volume 4, pp. 111–155. [Google Scholar]
- Silva, T.S.F.; Costa, M.P.F.; Melack, J.M. Spatial and temporal variability of macrophyte cover and productivity in the eastern Amazon floodplain: A remote sensing approach. Remote Sens. Environ. 2010, 114, 1998–2010. [Google Scholar] [CrossRef]
- Töyrä, J.; Pietroniro, A. Towards operational monitoring of a northern wetland using geomatics-based techniques. Remote Sens. Environ. 2005, 97, 174–191. [Google Scholar] [CrossRef]
- Ouchi, K. Recent trend and advance of Synthetic Aperture Radar with selected topics. Remote Sens. 2013, 5, 716–807. [Google Scholar] [CrossRef]
- Hengl, T.; Reuter, H.I. Geomorphometry: Concepts, Software, Applications; Elsevier Scientific Publishing: Oxford, UK, 2009; p. 765. ISBN 978-0-12374345-9. [Google Scholar]
- Wilson, J.P.; Gallant, J.C. Digital terrain analysis. In Terrain Analysis: Principles and Applications; Wilson, J.P., Gallant, J.C., Eds.; John Wiley and Sons: New York, NY, USA, 2000; pp. 87–131. [Google Scholar]
- Bwangoy, J.-R.B.; Hansen, M.C.; Roy, D.P.; Grandi, G.D.; Justice, C.O. Wetland mapping in the Congo Basin using optical and radar remotely sensed data and derived topographical indices. Remote Sens. Environ. 2010, 114, 73–86. [Google Scholar] [CrossRef]
- Adam, E.; Mutanga, O.; Abdel-Rahman, E.M.; Ismail, R. Estimating standing biomass in papyrus (Cyperus papyrus L.) swamp: Exploratory of In Situ hyperspectral indices and random forest regression. Int. J. Remote Sens. 2014, 35, 693–714. [Google Scholar] [CrossRef]
- Adam, E.; Mutanga, O.; Odindi, J.; Abdel-Rahman, E.M. Land-use/cover classification in a heterogeneous coastal landscape using RapidEye imagery: Evaluating the performance of Random Forest and Support Vector Machines classifiers. Int. J. Remote Sens. 2014, 35, 3440–3458. [Google Scholar] [CrossRef]
- Evans, T.L.; Costa, M.; Tomas, W.M.; Camilo, A.R. Large-scale habitat mapping of the Brazilian Pantanal wetland: A synthetic aperture radar approach. Remote Sens. Environ. 2014, 155, 89–108. [Google Scholar] [CrossRef]
- Hess, L.L.; Melack, J.M.; Affonso, A.G.; Barbosa, C.; Gastil-Buhl, M.; Novo, E.M.L.M. Wetlands of the Lowland Amazon Basin: Extent, vegetative cover, and dual-season inundated area as mapped with JERS-1 Synthetic Aperture Radar. Wetlands 2015, 35, 745–756. [Google Scholar] [CrossRef]
- Tilahun, S.; Edwards, S.; Egziabher, T.B.G. Important Bird Areas of Ethiopia: A First Inventory; Ethiopian Wildlife and Natural History Society: Addis Ababa, Ethiopia, 1996; p. 300. [Google Scholar]
- Gamachu, D. Aspects of Climate and Water Budget in Ethiopia; Addis Ababa University Press: Addis Ababa, Ethiopia, 1977; p. 49. [Google Scholar]
- Ethiopian Meteorological Service Agency (EMSA). Available online: https://www.ethiomet.gov.et/ (accessed on 30 September 2016).
- Muthuri, F.M.; Jones, M.B. Nutrient distribution in a papyrus swamp: Lake Naivasha, Kenya. Aquat. Bot. 1997, 56, 35–50. [Google Scholar] [CrossRef]
- IUCN—The World Conservation Union. 2016-1 IUCN Red List of Threatened Species, (Version 2.1). Available online: http://www.iucnredlist.org (accessed on 4 March 2016).
- Dixon, A.B.; Wood, A.P. Wetland cultivation and hydrological management in eastern Africa: Matching community and hydrological needs through sustainable wetland use. Nat. Resour. Forum 2003, 27, 117–129. [Google Scholar] [CrossRef]
- Spasojevic, M.J.; Aicher, R.J.; Koch, G.R.; Marquardt, E.S.; Mirotchnick, N.; Troxler, T.G.; Collins, S.L. Fire and grazing in a mesic tallgrass prairie: Impacts on plant species and functional traits. Ecology 2010, 91, 1651–1659. [Google Scholar] [CrossRef] [PubMed]
- Cowardin, L.M.; Carter, V.; Golet, F.C.; LaRoe, E.T. Classification of Wetlands and Deepwater Habitats of the United States; FWS/OBS-79/31; USDI Fish and Wildlife Service: Washington, DC, USA, 1979; p. 103.
- Farr, T.G.; Rosen, P.A.; Caro, E.; Crippen, R.; Duren, R.; Hensley, S.; Kobrick, M.; Paller, M.; Rodriguez, E.; Roth, L.; et al. The shuttle radar topography mission. Rev. Geophys. 2007, 45, RG2004. [Google Scholar] [CrossRef]
- Chander, G.; Markham, B.L.; Barsi, J.A. Revised Landsat-5 Thematic Mapper radiometric calibration. IEEE Geosci. Remote Sens. Lett. 2007, 4, 490–494. [Google Scholar] [CrossRef]
- Zhu, Z.; Woodcock, C.E. Object-based cloud and cloud shadow detection in Landsat imagery. Remote Sens. Environ. 2012, 118, 83–94. [Google Scholar] [CrossRef]
- Richter, R.; Schläpfer, D.; Müller, A. An automatic atmospheric correction algorithm for visible/NIR imagery. Int. J. Remote Sens. 2006, 27, 2077–2085. [Google Scholar] [CrossRef]
- De Grandi, G.D.; Bouvet, A.; Lucas, R.M.; Shimada, M.; Monaco, S.; Rosenqvist, A. The K & C PALSAR mosaic of the African continent: Processing issues and first thematic results. IEEE Trans. Geosci. Remote Sens. 2011, 49, 3593–3610. [Google Scholar] [CrossRef]
- Rebelo, L.M. Mapping inland wetlands in Africa using long waveband radar: The ALOS Kyoto and Carbon Initiative. In Proceedings of the WaterNet/WARFSA/GWP-SA Symposium, Entebbe, Uganda, 28–30 October 2009; pp. 1–7. [Google Scholar]
- Bruniquel, J.; Lopes, A. Multi-variate optimal speckle reduction in SAR imagery. Int. J. Remote Sens. 1997, 18, 603–627. [Google Scholar] [CrossRef]
- ITT Visual Information Solutions. The Environment for Visualizing Images ENVI Version 5.0 and SARScape Version 5.1; ITT Visual Information Solutions: Boulder, CO, USA, 2012; p. 64. [Google Scholar]
- Sarmap SA. Synthetic Aperture Radar and SARscape: SAR-Guidebook; Sarmap SA: Purasca, Switzerland, 2009; p. 274. [Google Scholar]
- Lopes, A.; Nezry, E.; Touzi, R.; Laur, H. Structure detection and statistical adaptive speckle filtering in SAR images. Int. J. Remote Sens. 1993, 14, 1735–1758. [Google Scholar] [CrossRef]
- Ulaby, F.T.; Dobson, M.C. Handbook of Radar Scattering Statistics for Terrain; Artech House, Inc.: Norwood, MA, USA, 1989; p. 357. ISBN 978-0-89006-336-1. [Google Scholar]
- Rosenqvist, A.; Shimada, M.; Ito, N.; Watanabe, M. ALOS PALSAR: A pathfinder mission for global-scale monitoring of the environment. IEEE Trans. Geosci. Remote Sens. 2007, 45, 3307–3316. [Google Scholar] [CrossRef]
- Dubeau, P. Mapping and Characterizing Wetlands and Wetland Dynamics in the Highlands of Ethiopia Using Random Forest Classification. Master’s Thesis, Carleton University, Ottawa, ON, Canada, 2016. [Google Scholar]
- Bannari, A.; Morin, D.; Huete, A.R.; Bonn, F. A review of vegetation indices. Remote Sens. Rev. 1995, 13, 95–120. [Google Scholar] [CrossRef]
- Conrad, O.; Bechtel, B.; Bock, M.; Dietrich, H.; Fischer, E.; Gerlitz, L.; Wehberg, J.; Wichmann, V.; Böhner, J. System for automated geoscientific analyses (SAGA) v. 2.1.4. Geosci. Model Dev. 2015, 8, 1991–2007. [Google Scholar] [CrossRef]
- Clewley, D.; Whitcomb, J.; Moghaddam, M.; McDonald, K.; Chapman, B.; Bunting, P. Evaluation of ALOS PALSAR data for High-Resolution mapping of vegetated wetlands in Alaska. Remote Sens. 2015, 7, 7272–7297. [Google Scholar] [CrossRef]
- Simard, M.; Saatchi, S.S.; De Grandi, G.D. The use of decision tree and multiscale texture for classification of JERS-1 SAR data over tropical forest. IEEE Trans. Geosci. Remote Sens. 2000, 38, 2310–2321. [Google Scholar] [CrossRef]
- Brisco, B.; Kapfer, M.; Hirose, T.; Tedford, B.; Liu, J. Evaluation of C-band polarization diversity and polarimetry for wetland mapping. Can. J. Remote Sens. 2011, 37, 82–92. [Google Scholar] [CrossRef]
- Rodriguez-Galiano, V.F.; Ghimire, B.; Rogan, J.; Chica-Olmo, M.; Rigol-Sanchez, J.P. An assessment of the effectiveness of a Random Forest classifier for land-cover classification. ISPRS J. Photogramm. Remote Sens. 2012, 67, 93–104. [Google Scholar] [CrossRef]
- Waske, B.; Braun, M. Classifier ensembles for land cover mapping using multitemporal SAR imagery. ISPRS J. Photogramm. Remote Sens. 2009, 64, 450–457. [Google Scholar] [CrossRef]
- Gislason, P.O.; Benediktsson, J.A.; Sveinsson, J.R. Random Forests for land cover classification. Pattern Recog. Lett. 2006, 27, 294–300. [Google Scholar] [CrossRef]
- Sonobe, R.; Tani, H.; Wang, X.; Kobayashi, N.; Shimamura, H. Parameter tuning in the Support Vector Machine and Random Forest and their performances in cross- and same-year crop classification using TerraSAR-X. Int. J. Remote Sens. 2014, 35, 7898–7909. [Google Scholar] [CrossRef]
- Duro, D.C.; Franklin, S.E.; Dubé, M.G. A comparison of pixel-based and object-based image analysis with selected machine learning algorithms for the classification of agricultural landscapes using SPOT-5 HRG imagery. Remote Sens. Environ. 2012, 118, 259–272. [Google Scholar] [CrossRef]
- Pal, M.; Mather, P.M. An assessment of the effectiveness of decision tree methods for land cover classification. Remote Sens. Environ. 2003, 86, 554–565. [Google Scholar] [CrossRef]
- Joshi, N.; Baumann, M.; Ehammer, A.; Fensholt, R.; Grogan, K.; Hostert, P.; Jepsen, M.; Kuemmerle, T.; Meyfroidt, P.; Mitchard, E.; et al. A Review of the application of optical and radar remote sensing data fusion to land use mapping and monitoring. Remote Sens. 2016, 8, 70. [Google Scholar] [CrossRef]
- Abdikan, S.; Bilgin, G.; Sanli, F.B.; Uslu, E.; Ustuner, M. Enhancing land use classification with fusing dual-polarized TerraSAR-X and multispectral RapidEye data. J. Appl. Remote Sens. 2015, 9, 096054. [Google Scholar] [CrossRef]
- Banks, S.; Millard, K.; Pasher, J.; Richardson, M.; Wang, H.; Duffe, J. Assessing the potential to operationalize shoreline sensitivity mapping: Classifying multiple wide fine quadrature polarized RADARSAT-2 and Landsat 5 scenes with a single Random Forest model. Remote Sens. 2015, 7, 13528–13563. [Google Scholar] [CrossRef]
- Corcoran, J.; Knight, J.; Brisco, B.; Kaya, S.; Cull, A.; Murnaghan, K. The integration of optical, topographic, and radar data for wetland mapping in northern Minnesota. Can. J. Remote Sens. 2011, 37, 564–582. [Google Scholar] [CrossRef]
- Balzter, H.; Cole, B.; Thiel, C.; Schmullius, C. Mapping CORINE land cover from sentinel-1A SAR and SRTM digital elevation model data using Random Forests. Remote Sens. 2015, 7, 14876–14898. [Google Scholar] [CrossRef]
- Frazier, R.J.; Coops, N.C.; Wulder, M.A.; Kennedy, R. Characterization of aboveground biomass in an unmanaged boreal forest using Landsat temporal segmentation metrics. ISPRS J. Photogramm. Remote Sens. 2014, 92, 137–146. [Google Scholar] [CrossRef]
- Midekisa, A.; Senay, G.B.; Wimberly, M.C. Multisensor earth observations to characterize wetlands and malaria epidemiology in Ethiopia. Water Resour. Res. 2014, 50, 8791–8806. [Google Scholar] [CrossRef] [PubMed]
- Whiteside, T.; Bartolo, R. Mapping aquatic vegetation in a tropical wetland using high spatial resolution multispectral satellite imagery. Remote Sens. 2015, 7, 11664–11694. [Google Scholar] [CrossRef]
- Breiman, L. Random Forests. Mach. Learn. 2001, 45, 5–32. [Google Scholar] [CrossRef]
- Liaw, A.; Wiener, M. Classification and regression by randomForest. R News 2002, 2, 18–22. [Google Scholar]
- Bivand, R.S.; Keitt, T.; Rowlingson, B. rgdal: Bindings for the Geospatial Data Abstraction Library, R Package Version 0.8-16. Available online: https://cran.r-project.org/web/packages/rgdal/index.html (accessed on 7 July 2017).
- R Development Core Team. R: A Language and Environment for Statistical Computing. 2014. Available online: http://www.R-projec.org/ (accessed on 30 September 2016).
- Liaw, A. Package “randomForest”. Available online: http://cran.r-project.org/web/packages/randomForest/randomForest.pdf (accessed on 30 September 2016).
- Millard, K.; Richardson, M.C. On the importance of training data sample selection in RF classification: A case study in peatland ecosystem mapping. Remote Sens. 2015, 7, 8489–8515. [Google Scholar] [CrossRef]
- Congalton, R.G.; Green, K. Assessing the Accuracy of Remotely Sensed Data: Principles and Practices, 2nd ed.; Taylor & Francis: Didcot, UK, 2009; p. 192. ISBN 978-1-4200-5512-2. [Google Scholar]
- Foody, G.M. Sample size determination for image classification accuracy assessment and comparison. Int. J. Remote Sens. 2009, 30, 5273–5291. [Google Scholar] [CrossRef]
- Dingle Robertson, L.; King, D.J. Comparison of pixel- and object-based classification in land cover change mapping. Int. J. Remote Sens. 2011, 32, 1505–1529. [Google Scholar] [CrossRef]
- Foody, G.M. Thematic map comparison: Evaluating the statistical significance of differences in classification accuracy. Photogramm. Eng. Remote Sens. 2004, 70, 627–633. [Google Scholar] [CrossRef]
- Hapfelmeier, A.; Ulm, K. A new variable selection approach using Random Forests. Comput. Stat. Data Anal. 2013, 60, 50–69. [Google Scholar] [CrossRef]
- Strobl, C.; Zeileis, A. Exploring the statistical properties of a test for Random Forest variable importance. In COMPSTAT 2008—Proceedings in Computational Statistics; Springer Science+Business Media: Berlin, Germany, 2008; pp. 59–66. [Google Scholar]
- Pantaleoni, E.; Wynne, R.H.; Galbraith, J.M.; Campbell, J.B. Mapping wetlands using ASTER data: A comparison between classification trees and logistic regression. Int. J. Remote Sens. 2009, 30, 3423–3440. [Google Scholar] [CrossRef]
- Skidmore, E.L.; Dickerson, J.D.; Schimmelpfennig, H. Evaluating surface-soil water content by measuring reflectance. Soil Sci. Soc. Am. J. 1975, 39, 238–242. [Google Scholar] [CrossRef]
- Dronova, I. Object-Based image analysis in wetland research: A review. Remote Sens. 2015, 7, 6380–6413. [Google Scholar] [CrossRef]
- Collins, S.L.; Knapp, A.K.; Briggs, J.M.; Blair, J.M.; Steinauer, E.M. Modulation of diversity by grazing and mowing in native tallgrass prairie. Science 1998, 280, 745–747. [Google Scholar] [CrossRef] [PubMed]
- Heisler, J.L.; Briggs, J.M.; Knapp, A.K. Long-term patterns of shrub expansion in a C4-dominated grassland: Fire frequency and the dynamics of shrub cover and abundance. Am. J. Bot. 2003, 90, 423–428. [Google Scholar] [CrossRef] [PubMed]
- Jones, J.W.; Hall, A.E.; Foster, A.M.; Smith, T.J.I. Wetland fire scar monitoring and analysis using archival landsat data for the everglades. Fire Ecol. 2013, 9, 133–150. [Google Scholar] [CrossRef]
- Li, G.; Lu, D.; Moran, E.; Dutra, L.; Batistella, M. A comparative analysis of ALOS PALSAR L-band and RADARSAT-2 C-band data for land-cover classification in a tropical moist region. ISPRS J. Photogramm. Remote Sens. 2012, 70, 26–38. [Google Scholar] [CrossRef]
- Mayaux, P.; Grandi, G.F.D.; Rauste, Y.; Simard, M.; Saatchi, S. Large-scale vegetation maps derived from the combined L-band GRFM and C-band CAMP wide area radar mosaics of Central Africa. Int. J. Remote Sens. 2002, 23, 1261–1282. [Google Scholar] [CrossRef]
- Corcoran, J.M.; Knight, J.F.; Gallant, A.L. Influence of multi-source and multi-temporal remotely sensed and ancillary data on the accuracy of Random Forest classification of wetlands in northern Minnesota. Remote Sens. 2013, 5, 3212–3238. [Google Scholar] [CrossRef]
- Na, X.; Zang, S.; Wang, J. Evaluation of Random Forest ensemble classification for land cover mapping using TM and ancillary geographical data. In Proceedings of the Sixth International Conference on Fuzzy Systems and Knowledge Discovery, Tianjin, China, 14–16 August 2009; pp. 89–93. [Google Scholar]
- Davranche, A.; Lefebvre, G.; Poulin, B. Wetland monitoring using classification trees and SPOT-5 seasonal time series. Remote Sens. Environ. 2010, 114, 552–562. [Google Scholar] [CrossRef] [Green Version]
- Baker, C.; Lawrence, R.L.; Montagne, C.; Patten, D. Change detection of wetland ecosystems using Landsat imagery and change vector analysis. Wetlands 2007, 27, 610–619. [Google Scholar] [CrossRef]
- Wright, C.; Gallant, A. Improved wetland remote sensing in Yellowstone National Park using classification trees to combine TM imagery and ancillary environmental data. Remote Sens. Environ. 2007, 107, 582–605. [Google Scholar] [CrossRef]
- Souza-Filho, P.W.M.; Paradella, W.R.; Rodrigues, S.W.P.; Costa, F.R.; Mura, J.C.; Gonçalves, F.D. Discrimination of coastal wetland environments in the Amazon region based on multi-polarized L-band airborne Synthetic Aperture Radar imagery. Estuar. Coast. Shelf Sci. 2011, 95, 88–98. [Google Scholar] [CrossRef]
- Bourgeau-Chavez, L.L.; Kowalski, K.P.; Carlson Mazur, M.L.; Scarborough, K.A.; Powell, R.B.; Brooks, C.N.; Huberty, B.; Jenkins, L.K.; Banda, E.C.; Galbraith, D.M.; et al. Mapping invasive Phragmites australis in the coastal Great Lakes with ALOS PALSAR satellite imagery for decision support. J. Great Lakes Res. 2013, 39, 65–77. [Google Scholar] [CrossRef]
- Koch, M.; Schmid, T.; Reyes, M.; Gumuzzio, J. Evaluating full polarimetric C- and L-band data for mapping wetland conditions in a semi-arid environment in Central Spain. IEEE J. Sel. Top. Appl. Earth Obs. Remote Sens. 2012, 5, 1033–1044. [Google Scholar] [CrossRef]
- Touzi, R.; Deschamps, A.; Rother, G. Wetland characterization using Polarimetry RADARSAT-2 capability. Can. J. Remote Sens. 2007, 33, S56–S67. [Google Scholar] [CrossRef]
- Brisco, B.; Schmitt, A.; Murnaghan, K.; Kaya, S.; Roth, A. SAR polarimetric change detection for flooded vegetation. Int. J. Digit. Earth 2013, 6, 103–114. [Google Scholar] [CrossRef]
- Strobl, C.; Malley, J.; Tutz, G. An introduction to recursive partitioning: Rationale, application, and characteristics of classification and regression trees, bagging, and Random Forests. Psychol. Methods 2009, 14, 323–348. [Google Scholar] [CrossRef] [PubMed] [Green Version]
- Bernard, S.; Adam, S.; Heutte, L. Dynamic Random Forests. Pattern Recog. Lett. 2012, 33, 1580–1586. [Google Scholar] [CrossRef]
- Janitza, S.; Strobl, C.; Boulesteix, A.-L. An AUC-based permutation variable importance measure for random forests. BMC Bioinform. 2013, 14, 119. [Google Scholar] [CrossRef] [PubMed] [Green Version]
- Castilla, G. We must all pay more attention to rigor in accuracy assessment: Additional comment to “The improvement of land cover classification by thermal remote sensing”. Remote Sens. 2016, 8, 8368–8390. [Google Scholar] [CrossRef]


| Class Name | Class Code | Description | Optical/SAR (dB) Spectral Characteristics | Ref. N (%) |
|---|---|---|---|---|
| 1. Aquatic Bed | AB | Vegetation growing on or below the surface, and areas of open water. | Lowest surface reflectance and backscatter intensity, across all classes. | 78 (2.6%) |
| 2. Wet Meadow | WM | Grass dominated but mixed with forbs and sedges; mostly found in low-lying areas; seasonally flooded (<3 months). | NDVI (0.4) with moderate-low variance; low backscatter intensity (−22). | 90 (48%) |
| 3. Meadow Garden | MG | Cultivated wetlands along narrow drainage channels formerly occupied by Wet Meadow, but also found in areas of drained/converted marshes. | Lowest NDVI (0.4) among wetlands, but very-high variance; 2nd highest backscatter intensity (−16) among wetland classes. | 55 (15%) |
| 4. Emergent Marsh | EM | Sedge dominated but mixed with grasses and forbs. | Moderate-high NDVI (0.5) and very-low backscatter (−23); low variance for both variables. | 76 (24%) |
| 5. Grass Marsh | GM | Mixed Grass/Sedge with forbs; seasonally flooded (<6 months). | Moderate NDVI (0.45) with very-low variance; lowest backscatter (−24) among herbaceous wetlands. | 64 (67%) |
| 6. Papyrus Swamp | PS | Papyrus cyperus dominated with ferns and other forbs. | Second highest NDVI (0.6) among wetlands with moderate variance (Q1–Q3: 0.52–0.63); high backscatter (−17). | 99 (33%) |
| 7. Shrub Marsh | SM | Fabaceae-shrub dominated marsh often associated with Papyrus Swamp. | High NDVI (0.55), backscatter moderate-high (−19) and shows clear separation with PS. | 87 (8%) |
| 8. Forested Wetland | FW | Woody forest seasonally inundated; dominated by Syzygium guineense with Ficus sur generally found along drainage channels. | Highest NDVI (0.65), also shared with Forest, and highest backscatter (−14) among all classes; very low variance. | 98 (32%) |
| 9. Woodland | WDL | Open/sparse canopy woody savannah-like vegetation with shrubs and scattered trees up to 10 m tall on grassy/herbaceous sub-layer | Moderate-low NDVI (0.45), markedly lower compared to Forested classes (FW and for); high backscatter (−16); low variance for both variables. | 152 (17%) |
| 10. Forest | FOR | Closed canopy broadleaf forest | Highest NDVI and backscatter (0.65 and −15, respectively), also shared with Forested Wetland; very low variance. | 121 (12%) |
| 11. Agriculture | AGR | Cropland, cultivated pasture, and homestead areas | Lowest NDVI (0.3) and backscatter (−19) among the terrestrial classes, excluding Burnt areas. | 156 (19%) |
| Year | Season | Landsat 1 | ALOS/PALSAR (Level 1.1/1.5) | ALOS/PALSAR 25-m Mosaic | Polarization |
|---|---|---|---|---|---|
| 2011 | Wet | 14 October | |||
| Dry | 10–27 January 2 | HH | |||
| 2010 | Wet | 12 November | 10–27 July 2 | 10 October (East) and 27 July (West) | HH and HV |
| Dry | 12 January | 7–24 January | HH | ||
| 2009 | Wet | 9 November | 7–24 July | 7–24 July | HH and HV |
| Dry |
| Vegetation/Water Indices | Terrain Parameters/Indices |
|---|---|
| Normalized Difference Vegetation Index (NDVI) | Slope (radians) |
| Enhanced Vegetation Index (EVI) | Catchment slope (radians) |
| Soil Adjusted Vegetation Index (SAVI) | Slope height (m) |
| Modified Soil Adjusted Vegetation Index-2 (MSAVI2) | Length slope factor |
| Normalized Difference Moisture Index (NDMI) | Standardized height (m) |
| Normalized Burn Ratio (NBR) | Mid-Slope position (n-dimensional) |
| Normalized Burn Ratio-2 (NBR2) | Relative slope position |
| Modified Normalized Difference Water Index (MNDWI) | Topographic wetness index |
| Atmospheric Resistant Vegetation Index (ARVI) | SAGA Topographic wetness index |
| Soil and Atmospheric Resistant Vegetation Index (SARVI) | Terrain classification index for lowland (TCIlow) |
| Thiam’s Transformed NDVI (TTVI) | Topographic position index |
| Global Environmental Monitoring Index (GEMI) | Morphometric protection index |
| Principal Component Transform (PC1) | Melton ruggedness number |
| PC2 | Terrain ruggedness index |
| PC3 | Terrain surface texture |
| Tasseled-cap Transformation (TC-Brightness) | Valley depth (m) |
| TC-Greenness (TCG) | Valley depth [relative height] (m) |
| TC-Wetness (TCW) | Vertical distance to channel network (m) |
| TCW-TCG | |
| PALSAR L-band derived variables | |
| SAR HH Texture (CV 3 × 3 window) | |
| SAR HV Texture (CV 3 × 3 window) |
| RF Model | Landsat TM-5 1 | PALSAR/L-Band 2 | No. of Variables | OOB Accuracy (%) | OA | ||
|---|---|---|---|---|---|---|---|
| Wetland | Upland | (%) | 95% CIs | ||||
| 1. Multi-year–Bi-seasonal–Multi-source | 2009 w + 2010 d + 2011 w | 2009 w + 2010 wd + 2011 d | 103 | 98.8 | 99.3 | 99.0 | (97.6–100.0) |
| 2. Multi-year–Bi-seasonal–Spectral | 2009 w + 2010 d + 2011 w | 83 | 97.4 | 99.3 | 98.1 | (97.4–98.9) | |
| 3. Multi-year–Bi-seasonal–SAR | 2009 w + 2010 wd + 2011 d | 47 | 89.3 | 90.4 | 89.8 | (88.0–91.5) | |
| 4. Single year–Dry Season–Multi-source | 2010 | 2010 | 41 | 92.7 | 97.0 | 94.4 | (93.7–95.0) |
| 5. Multi-year–Wet Season–Multi-source | 2009 + 2011 | 2009 + 2010 | 72 | 94.7 | 95.3 | 95.0 | (94.4–95.6) |
| 6. Multi-year–Wet Season–Spectral | 2009 + 2011 | 62 | 92.1 | 94.6 | 93.1 | (92.5–93.7) | |
| 7. Multi-year–Wet Season–SAR | 2009 + 2010 | 28 | 85.2 | 89.5 | 86.9 | (86.1–87.7) | |
| 8. Multi-year–Dry Season–Multi-source | 2010 | 2010 + 2011 | 43 | 93.2 | 97.9 | 95.0 | (94.4–95.6) |
| 9. Single-year–Wet Season–Multi-source | 2009 | 2009 | 45 | 91.5 | 95.1 | 92.9 | (92.3–93.6) |
| 10. Single-year–Wet Season–Spectral | 2009 | 40 | 88.3 | 93.9 | 90.5 | (89.9–91.2) | |
| 11. Single-year–Wet Season–Spectral | 2011 | 40 | 88.1 | 86.7 | 87.5 | (86.6–88.5) | |
| 12. Single year–Dry Season–Spectral | 2010 | 39 | 92.7 | 95.6 | 93.8 | (93.1–94.4) | |
| 13. Multi-year–Wet Season–Multi-source | 2009 | 2010 | 45 | 91.3 | 94.4 | 92.6 | (91.9–93.3) |
| 14. Multi-year–Wet Season–Multi-source | 2011 | 2010 | 45 | 91.5 | 90.4 | 91.1 | (90.3–91.9) |
| 15. Multi-year–Dry Season–SAR | 2010 + 2011 | 22 | 85.5 | 86.5 | 85.9 | (84.8–86.9) | |
| 16. Single-year–Wet Season–SAR | 2009 | 23 | 83.9 | 87.2 | 85.2 | (84.3–86.1) | |
| 17. Single-year–Wet Season–SAR | 2010 | 23 | 83.6 | 79.5 | 82.0 | (81.0–83.0) | |
| 18. Topographic (only) | 18 | 75.7 | 64.8 | 71.4 | (70.2–72.5) | ||
| RF Models: | M1 | M2 | M3 | M4 | M5 | |||||
| Classes | UA | PA | UA | PA | UA | PA | UA | PA | UA | PA |
| 1_Aquatic Bed | 100.0 | 100.0 | 100.0 | 100.0 | 96.2 | 96.3 | 100.0 | 98.7 | 100.0 | 98.7 |
| 2_Wet Meadow | 97.8 | 97.8 | 97.8 | 96.7 | 91.1 | 91.1 | 96.6 | 95.6 | 90.3 | 93.3 |
| 3_Meadow Garden | 100.0 | 95.5 | 98.0 | 89.1 | 97.7 | 97.7 | 92.3 | 81.8 | 97.7 | 95.5 |
| 4_Marsh Emergent | 97.4 | 100.0 | 94.8 | 96.1 | 82.7 | 88.2 | 91.9 | 89.5 | 80.4 | 97.4 |
| 5_Grass Marsh | 96.8 | 95.3 | 95.5 | 98.4 | 83.6 | 71.9 | 83.1 | 92.2 | 97.9 | 73.4 |
| 6_Papyrus Swamp | 98.0 | 100.0 | 96.0 | 98.0 | 86.0 | 92.9 | 90.2 | 92.9 | 95.1 | 97.0 |
| 7_Shrub Marsh | 100.0 | 98.85 | 96.6 | 96.6 | 90.1 | 94.3 | 88.0 | 83.9 | 96.6 | 98.9 |
| 8_Forested Wetland | 100.0 | 100.0 | 100.0 | 100.0 | 89.4 | 84.4 | 97.8 | 97.8 | 98.9 | 98.9 |
| 9_Woodland | 99.3 | 98.03 | 100.0 | 98.0 | 87.8 | 85.5 | 95.4 | 96.1 | 94.1 | 94.7 |
| 10_Forest (mature) | 100.0 | 100.0 | 100.0 | 100.0 | 87.5 | 86.8 | 97.5 | 98.4 | 99.1 | 94.2 |
| 11_Agriculture | 98.7 | 100.0 | 97.5 | 100.0 | 94.9 | 96.2 | 96.8 | 96.8 | 96.8 | 96.8 |
| 12_Burned Patch | 100.0 | 100.0 | 100.0 | 100.0 | n/a | n/a | 97.9 | 100.0 | n/a | n/a |
| Overall Accuracy (%) (95% CIs) | 99.0 (97.6–100.0) | 98.1 (97.38–98.88) | 89.8 (88.03–91.53) | 94.4 (93.74–95.0) | 95.0 (94.37–95.60) | |||||
| RF Models: | M6 | M7 | M8 | M9 | M10 | |||||
| Classes | UA | PA | UA | PA | UA | PA | UA | PA | UA | PA |
| 1_Aquatic Bed | 100.0 | 98.7 | 93.7 | 94.9 | 100.0 | 98.7 | 100.0 | 98.7 | 100.0 | 98.7 |
| 2_Wet Meadow | 87.2 | 91.1 | 85.4 | 84.4 | 94.5 | 95.6 | 90.3 | 93.3 | 87.0 | 88.9 |
| 3_Meadow Garden | 93.7 | 81.8 | 88.5 | 83.6 | 92.1 | 79.5 | 100.0 | 90.9 | 91.5 | 78.2 |
| 4_Marsh Emergent | 77.5 | 90.8 | 75.0 | 78.9 | 94.7 | 93.4 | 79.1 | 89.5 | 75.3 | 88.2 |
| 5_Grass Marsh | 92.4 | 76.6 | 75.4 | 67.2 | 83.8 | 89.1 | 87.2 | 64.1 | 86.7 | 60.9 |
| 6_Papyrus Swamp | 92.1 | 93.9 | 82.9 | 87.9 | 92.2 | 96.0 | 88.7 | 94.9 | 85.6 | 89.9 |
| 7_Shrub Marsh | 92.3 | 96.5 | 84.0 | 90.8 | 87.9 | 83.9 | 86.5 | 95.4 | 81.8 | 93.1 |
| 8_Forested Wetland | 99.0 | 99.0 | 88.7 | 87.8 | 97.8 | 97.8 | 100.0 | 96.9 | 100.0 | 96.9 |
| 9_Woodland | 92.4 | 95.4 | 86.8 | 86.8 | 96.7 | 97.4 | 93.4 | 92.8 | 90.3 | 92.1 |
| 10_Forest (mature) | 99.1 | 94.2 | 92.2 | 88.4 | 97.5 | 98.3 | 99.1 | 95.9 | 98.3 | 95.9 |
| 11_Agriculture | 96.1 | 94.2 | 93.5 | 92.9 | 98.1 | 98.1 | 95.6 | 96.8 | 94.8 | 94.2 |
| 12_Burned Patch | n/a | n/a | n/a | n/a | 97.8 | 100.0 | n/a | n/a | n/a | n/a |
| Overall Accuracy (%) (95% CIs) | 93.1 (92.51–93.74) | 86.9 (86.11–87.68) | 95.0 (94.36–95.65) | 92.9 (92.30–93.57) | 90.5 (89.87–91.17) | |||||
© 2017 by the authors. Licensee MDPI, Basel, Switzerland. This article is an open access article distributed under the terms and conditions of the Creative Commons Attribution (CC BY) license (http://creativecommons.org/licenses/by/4.0/).
Share and Cite
Dubeau, P.; King, D.J.; Unbushe, D.G.; Rebelo, L.-M. Mapping the Dabus Wetlands, Ethiopia, Using Random Forest Classification of Landsat, PALSAR and Topographic Data. Remote Sens. 2017, 9, 1056. https://doi.org/10.3390/rs9101056
Dubeau P, King DJ, Unbushe DG, Rebelo L-M. Mapping the Dabus Wetlands, Ethiopia, Using Random Forest Classification of Landsat, PALSAR and Topographic Data. Remote Sensing. 2017; 9(10):1056. https://doi.org/10.3390/rs9101056
Chicago/Turabian StyleDubeau, Pierre, Douglas J. King, Dikaso Gojamme Unbushe, and Lisa-Maria Rebelo. 2017. "Mapping the Dabus Wetlands, Ethiopia, Using Random Forest Classification of Landsat, PALSAR and Topographic Data" Remote Sensing 9, no. 10: 1056. https://doi.org/10.3390/rs9101056
APA StyleDubeau, P., King, D. J., Unbushe, D. G., & Rebelo, L.-M. (2017). Mapping the Dabus Wetlands, Ethiopia, Using Random Forest Classification of Landsat, PALSAR and Topographic Data. Remote Sensing, 9(10), 1056. https://doi.org/10.3390/rs9101056