Article

Multi Parameter Flow Meter for On-Line Measurement of Gas Mixture Composition †

by
Egbert Van der Wouden
1,*,
Jarno Groenesteijn
2,
Remco Wiegerink
2 and
Joost Lötters
1,2
1
Bronkhorst High-Tech BV, Nijverheidsstraat 1A, 7261 AK Ruurlo, The Netherlands
2
MESA+ Institute for Nanotechnology, University of Twente, P.O. Box 217, 7500 AE Enschede, The Netherlands
*
Author to whom correspondence should be addressed.
This paper is an extended version of our paper published in the 2nd International Conference on Microfluidic Handling Systems, Freiburg, Germany, 8–10 October 2014.
Micromachines 2015, 6(4), 452-461; https://doi.org/10.3390/mi6040452
Submission received: 2 March 2015 / Revised: 25 March 2015 / Accepted: 31 March 2015 / Published: 10 April 2015

Abstract

:
In this paper we describe the development of a system and model to analyze the composition of gas mixtures up to four components. The system consists of a Coriolis mass flow sensor, density, pressure and thermal flow sensor. With this system it is possible to measure the viscosity, density, heat capacity and flow rate of the medium. In a next step the composition can be analyzed if the constituents of the mixture are known. This makes the approach universally applicable to all gasses as long as the number of components does not exceed the number of measured properties and as long as the properties are measured with a sufficient accuracy. We present measurements with binary and ternary gas mixtures, on compositions that range over an order of magnitude in value for the physical properties. Two platforms for analyses are presented. The first platform consists of sensors realized with MEMS fabrication technology. This approach allows for a system with a high level of integration. With this system we demonstrate a proof of principle for the analyses of binary mixtures with an accuracy of 10%. In the second platform we utilize more mature steel sensor technology to demonstrate the potential of this approach. We show that with this technique, binary mixtures can be measured within 1% and ternary gas mixtures within 3%.

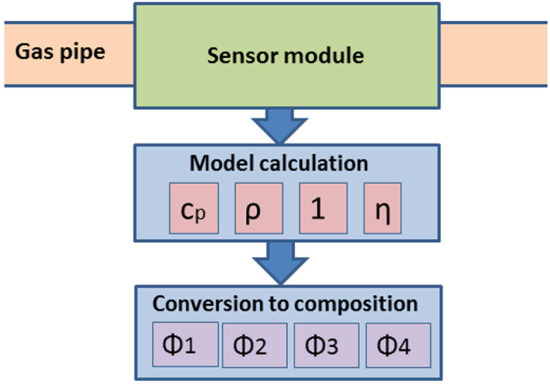
Graphical Abstract

1. Introduction

In flow dosing systems there is a demand to not just measure or control flowrate, but also measure the type or composition of the flow. For instance, in biogas production; here the measurement of methane and inert gas fractions can give information about the energy content and in this way serve as a quality control [1,2,3,4]. This information can be used as feedback on the production process; for instance regulating biomass input, but can also be used as an economic feedback in the case of fiscal metering.
A second example is purging of reaction chambers in semiconductor industry. Many processes here involve toxic, explosive or environmentally harmful gasses, so proper purging is essential before equipment can be opened. A real-time monitoring system of gas composition can help to indicate threshold levels for harmful gasses and signal when it is save to open a reaction chamber. In this way such a system can facilitate a reduction of costly equipment down time and aid in operator safety.
For dedicated gas component detection many different sensor techniques are available in a variety of classes. Sensor principles include electrical techniques, like electrochemical detection, or electrical detection of adsorption by induced capacitance changes, optical techniques; for instance infrared (IR) adsorption or Raman spectroscopy, chromatography, calorimetry and acoustic analyses. Many excellent reviews on the topic of gas sensing have been published with detailed analysis of the performance, flexibility, strengths and weaknesses of the techniques [5,6,7].
What most sensor techniques have in common is that their applicability into real time monitoring systems is limited, either because sensors are hard to integrate based on practical considerations like, size, cost or response time, or because the sensors rely on principles that generally do not apply to all gasses.
For instance, Raman spectroscopy relies on the polarizability of a molecule, while IR spectroscopy makes use of induced dipoles; this makes these techniques, at least for simple atom structures, mutually exclusive and limits applicability of both techniques to a range of gasses. Electrochemical detection is limited to gasses exhibiting redox behavior, while electrical detection in many cases depends on specific adsorption and is hindered by interfering compounds and hence lacks sensor specificity. Gas chromatography and to a lesser extent gas calorimetry does not suffer from these limitations, gasses can be analyzed over a broad range with limited or no limitations of interfering compounds. However, these systems have slow response, typically in the order of several minutes, are costly and bulky and hence, in a continuous flow process, hard to integrate.
Here we propose a system that analyses the composition of binary of ternary gas mixtures based on physical properties of a gas, which can be measured with standard flow sensors. With the combining of a medium independent Coriolis mass flow meter with thermal and pressure sensors, we can measure physical properties of the medium. In a second calculation step, the composition can be calculated based on the measured medium properties. Since such a system utilizes standard flow measurement components the system can be kept fast, relatively low cost, easy to integrate in gas or fluid transport networks.

2. System and Model

The system that was used to measure flow and physical properties is shown schematically in Figure 1. The model links a pressure, density, thermal and Coriolis flow sensor. The latter one acts as a medium independent mass flow sensor, while the former measures the product of mass flow and heat capacity. Linking the two sensors yields an independent measurement of the heat capacity. Secondly, with an independent measurement of the medium density, the volume flow can be determined by combining density and mass flow. This finally gives the viscosity, when the pressure needed to drive the volume flow through a fixed flow obstruction is measured in the laminar flow regime.
Figure 1. Schematic of the sensors, their relations and their transfer function.
Micromachines 06 00452 g001
In Figure 1 the different sensors, their output and their transfer functions are summarized, together with the relationship between sensors and the physical constants of the medium.
In the thermal sensor, heat is generated at the sensor wall. The flow is kept sufficiently low to keep the condition that the residence time of the medium is sufficient for the temperature profile to completely penetrate the medium. Under this condition the temperature difference that arises between an upstream and downstream sensor is proportional to the mass flow (Φm), heat capacity (cp) and a sensor function (S) that describes offset and nonlinear behavior [8].
In the Coriolis sensor a free hanging tube is exited at or near the resonance frequency of the tube, when a mass flow is applied the sensor tube experiences a Coriolis force which leads to a wobbling movement in the excitation plane. The amplitude of the Coriolis force induced motion (∆Θ) is directly proportional to the mass flow through the tube and the proportionality factor (C) that only depends on sensor constants; detector position, stiffness of the tube, etc. When the tube’s resonance frequency is measured the medium density can be calculated by approximating the tube by a second-order mass-spring system. The resonance frequency is then determined by the square root of the ratio between the resonator stiffness (κ) and the mass; in this case the sum of the sensor mass (m0) and the medium mass, which is determined by the product of sensor volume (V0) and medium density (ρ). In practice, this approach requires that the sensor mass is small or comparable to the medium mass. This limits the application of steel tube Coriolis sensors to fluids, since typically steel sensor tubes have thick walls and a high density compared to the sensor medium. MEMS technology allows the fabrication of thin walled sensor tubes so that also gasses can be measured [9]. Finally, with the aid of a differential pressure sensor the viscosity of the medium can be assessed. In the Hagen-Poiseuille regime, e.g. under laminar flow conditions, the viscosity can be calculated based on the measured pressure difference (∆P), the volume flow, or equivalently the ratio between mass flow and density and a resistance factor (Ro) that includes the sensor specific, medium independent, factors.
When a gas mixture is composed of a limited number of components, the measured physical properties can be used to analyze this composition.
Equation (1) illustrates how the total heat capacity is the sum of the contribution of the two components. Since the total fraction is equal to one, this equation can be solved, if the heat capacity of the two components is known and the total heat capacity is measured to yield the composition of the medium. In the formula cp, cp1, cp2, φ1 and φ2 are respectively the total heat capacity, the heat capacity of component one and two and the mass fraction of the two components.
c p = c p 1 m 1 + c p 2 m 2
Rewriting this equation gives the fraction of the gas components assuming that the sum of the two gas fractions is equal to 1 as shown in Equation (2).
φ m 1 = c p c p 2 c p 1 c p 2
Equation (1) can be expanded to include all the parameters measured in the system. When written as a function of the volume fraction and put into matrix form, this results in Equation (3).
In Equation (3) cp, φm, φ, η and ρ are respectively the heat capacity at constant pressure, mass fraction, volume fraction, viscosity and the density, subscripts indexes indicate mixture components.
( ρ 1 ρ 2 ρ 3 ρ 4 η 1 η 2 η 3 η 4 1 1 1 1 c p 1 . ρ 1 c p 2 . ρ 2 c p 3 . ρ 3 c p 4 . ρ 4 ) . ( φ 1 φ 2 φ 3 φ 4 ) = ( ρ η 1 c p . ρ )
It becomes clear from Equation (3), that with the described system we are able to analyse gas mixtures of up to four components. For this analysis it is necessary that the physical constants of the gasses are known and at least one constant makes a component distinguishable from the other constituents.
The sensor concept is illustrated in Figure 2; the sensors can be installed as bypass or flow through module. The output of the model in Figure 1 is used as input for Equation (3), solving this equation results in the gas composition.
Figure 2. Sketch of the proposed system.
Micromachines 06 00452 g002

3. Results and Discussion

Figure 3 shows an illustrative sketch of the measurement setup. Tests were performed on two different systems, a steel sensor platform and MEMS fabricated silicon chip. In the steel sensor version the medium mass is negligible with respect to the Coriolis sensor mass when measuring gasses; this impedes the density measurement in the steel sensor setup. To obtain a reliable density measurement for gasses, a separate dedicated density sensor was integrated in the setup. The sensor scheme for the MEMS version varies slightly with respect to the steel sensor setup. As discussed, the MEMS version has thin silicon nitride sensor walls; hence the resonance frequency can be used to measure gas density. Secondly, the differential pressure sensor is not integrated in the chip; therefore, pressure is measured over both the thermal and the Coriolis flow sensor.
Figure 3. Schematic of the measurement setup.
Micromachines 06 00452 g003

3.1. MEMS Sensor

The fabrication of MEMS thermal and Coriolis flow sensors has been described elsewhere with an application in the field of flow metering [10]. The purpose here was to reach a large as possible turnover ratio. By designing two different sensors principles with complementary flow range, in this case the thermal sensor could be operated in a lower flow regime than the Coriolis flow sensor. Here, we designed the sensor in such a way that both flow ranges overlap. This was achieved by increasing the thermal flow sensor channel diameter with respect to that of the Coriolis flow sensor.
In Figure 4, the MEMS multiparameter system, used to analyse mixture composition, is shown. Details on the fabrication process and sensor detection principles can be found in [11,12]. Both the thermal and Coriolis sensors consist of a silicon nitride tube with a wall thickness of roughly 1 μm. A pressurized vessel was used to generate air, hydrogen, helium, argon and nitrogen flows in the range of 1 to 20 mLn/min. Gas mixtures where provided at a constant flow rate of 10 mLn/min by two F-201CV flow controllers obtained from Bronkhorst High-Tech B.V. (Ruurlo, The Netherlands).
Figure 4. Fabricated system, showing the thermal (left) and Coriolis (right) flow sensors.
Micromachines 06 00452 g004
When the output signal of the thermal flow sensor is plotted against the output signal of the Coriolis flow sensor, the slope of the curve at low flows is a measure for the heat capacity of the medium that is inside both sensors. The resulting curve can be described by a third order polynomial function:
S = C 1 y 3 + C 2 y 2 + C 3 y + C 4
The constants C1–4 are medium independent sensor parameters, their value is determined with air as a reference medium, y is the output signal of the Coriolis flow sensor, and S the output signal of the thermal flow sensor. When another medium is present in the system, we can solve Equation (1) for a certain value of S. The ratio of the solved value for y and the measured value for y, multiplied with the value of the heat capacity of the reference medium provides the value of the heat capacity of the actual medium. In Figure 5a the raw measurement data is shown, with in the inset the resulting heat capacities. The measured values correspond within 3% to the literature values.
Figure 5. (a) Thermal flow sensor output as a function of the Coriolis sensor output, figure inset shows the resulting measured heat capacity as a function of literature values (b) measured volume fraction of nitrogen in argon based on heat capacity data.
Micromachines 06 00452 g005
A mixture of nitrogen and argon gas was fed into the chip at a constant flow, according to a calibration curve and the measured ratio between the Coriolis and thermal flow sensor the heat capacity of the mixture is determined. Based on Equation (2) and assuming that the sum of the two gas fractions is one, the fraction of nitrogen in argon can be calculated. Based on this approach the composition can be determined within 10%. The flow through time at 1 mL/min is below 100 ms, so it is expected that for the transient response of the sensor the sampling frequency of 2 s is the limiting factor. However, at the moment the 90% settling time after application of a step in the mixture composition is approximately 20 s at a flow rate of 10 mL/min. This response time is not limited by the sensor but by the dead volume and tubing of the dosing system. At low flow rates proper dosing of a mixture becomes increasingly difficult and even a small internal volume of the tubing can already be detrimental to a fast stable mixture delivery.
The results presented in Figure 5 indicate that it is feasible to analyze mixture compositions based on the heat capacity. However, at this point the sensor design and measurement techniques have to be further developed to be able to apply this approach to mixtures of 3 or more components. To investigate the possible accuracy and applicability of this approach, a more mature sensor technology was utilized.

3.2. Steel Sensor Technology

A schematic drawing of the setup is shown in Figure 3. The Coriolis, thermal and pressure sensor are respectively an M13, F-111AC and P-502C all manufactured by Bronkhorst High-Tech B.V. Density was measured with a northdome sensor, purchased from Avenisense, France. Mixtures where supplied by controlling the gas flow of the individual components with thermal mass flow sensors at a constant total volume flow of 1 L/min. The pressure is measured over the Coriolis flow sensor, since over this sensor the flow is in the laminar Hagen-Poiseuille regime, where there is a linear relation between pressure and volume flow. In the schematic of Figure 3 an extra temperature and absolute pressure sensor is integrated within the density meter to be able to correct for pressure and temperature variations. During experiments the signal of each sensor was logged at a sampling frequency of 1 Hz and subsequently processed in the software package Matlab.
The first result shown in Figure 6a gives the volume fraction of an air hydrogen mixture based on the measured heat capacity, Figure 6b gives a result for a methane nitrogen mixture. In the figure the measured heat capacity and the heat capacity calculated based on the applied flow rate of the components is plotted. The inset of the picture shows the calculated and applied volume flow fraction. The fractions are calculated with Equations (1) and (2); this results in the mass fractions, based on the known densities of the components the volume fractions are calculated. In all measurements, the volume flow fractions could be calculated with an error of less than 1%. The response time of the system is currently in the order of 2 s and is limited by the sampling frequency of the Coriolis- and the thermal sensor. The flow through time of the entire system is below 1 s, however, mixing effects, especially at low flow, in combination with the dead volume of the tubing cause a slower transient response that is maximum 5 s for the tested flows.
The measured heat capacity for the hydrogen air mixture shows deviations for 100% hydrogen, this is most likely caused by a slight contamination with air, due to the large difference in density and heat capacity the difference between theory and measurement can already be accounted for by a 0.1% v/v air fraction in the hydrogen flow. Figure 7 gives two results on ternary gas mixtures. Figure 7a shows measured and applied volume fraction of a nitrogen, hydrogen and argon mixture. The physical constants of the components are listed in Table 1 [13], mainly the heat capacity and density of the mixture can differ strongly depending on composition as the properties differ more than an order of magnitude. Figure 7b shows a mixture of methane, nitrogen and carbon dioxide, the composition of this gas was chosen to mimic the output of biogas fermentation processes. Based on measured sensor signals and the model of Figure 1, gas properties were calculated. The gas properties are then used as input for Equation (3). Solving this equation finally results in the volume fractions.
Figure 6. (a) Volume fraction of a hydrogen/air mixture based on the measured heat capacity. (b) Volume fraction of methane/carbon dioxide mixture.
Micromachines 06 00452 g006
Figure 7. (a) Applied and measured volume fractions for a mixture composed of nitrogen, hydrogen and argon. (b) Applied and measured volume fractions for a mixture of methane, carbon dioxide and nitrogen.
Micromachines 06 00452 g007
Table 1. Physical properties of gasses applied in the described experiments.
Property/ComponentNitrogenCarbon-dioxideHydrogenMethaneArgon
Density (kg/m3)1.1501.8150.0830.6591.64
Heat capacity (J/kg·K)1040846.9143002204521.9
Viscosity (Pa·s)1.75 × 10−51.45 ×·10−58.8 ×·10−61.10 ×·10−52.26 ×·10−5
Heat conductivity (W/(m·K))0.02600.01650.17600.03270.01763
Density × heat capacity (J/m3·K)1196153711871452856
The result of Figure 7a indicates a good correlation between the measurements and the applied volume fractions. However, significant deviation is measured after transient steps are applied in the gas concentration. This effect is caused by the response of the density sensor, while the Coriolis and thermal sensor are flow through and have a response time in the order of a second; the density senor is placed in a dead end part of the flow path to prevent influence of the flow on the measurement. This, however, results in a response time that depends on both the flow rate and diffusion, at a flow rate of 1 L/min the response time is approximately 10–20 s. To reduce the transient effects a moving average filter was applied. The absolute deviation for the gas components is within 3% for the steady state values and within 5% for the cumulative error. From the figure it can be noticed that argon is measured with a higher accuracy than nitrogen and hydrogen. This is most likely caused by two effects; first of all, a least square fit is performed on both the density and heat capacity. However, as can be seen in Table 1 the product of both properties is nearly equal for hydrogen and nitrogen. This is caused by the similar atom structure for both molecules. Secondly, the Coriolis sensor, that provides the medium independent mass flow measurement, is applied close to the lower end of its operating range; small variations in stability have a more pronounced effect on the mass flow for a light gas as hydrogen than for a relativity heavy gas like argon. Figure 7b gives results for longer time durations. The measured and applied concentrations match within 3%. The results indicate a systematic error for mainly CO2 and methane; at this point it is unclear what causes this variation. A possible reason is cooling of the gas during expansion; the Joule Thomson coefficients for carbon dioxide, methane and nitrogen are respectively 1.1, 0.45 and 0.27. So during expansion temperature differences can arise that influence the measured physical properties. The influence of temperature or pressure variation of physical properties will be a topic of future study.

4. Conclusions

We have designed and realized a system and model with which we can determine the composition of gas mixtures based on the combination of a pressure, density, Coriolis and thermal flow sensor. Two platforms are presented; an integrated MEMS sensor chip containing a Coriolis sensor for mass flow and density measurement and a thermal mass flow sensor. With this setup we showed that we can analyze binary mixture composition based on the heat capacity with an accuracy of better than 10%.
The seconds approach utilized a more robust technology composed of the same components. Based on commercially available steel sensors, binary mixtures have been measured with accuracy of better than 1%. Ternary mixtures could be analyzed within 3% accuracy. The analyses of ternary mixtures shows that systematic errors occur that can be caused by temperature or pressure influences on the physical properties. Further research will be performed to study these effects in more detail.

Acknowledgments

This research was partly financed by the Dutch SBIR and NanoNextNL programs. The authors would like to thank the industrial partners in this project for their in-kind contributions and many fruitful discussions.

Author Contributions

Experiments where designed by Egbert van der Wouden, he also provided the manuscript draft. Jarno Groenesteijn designed and fabricated the MEMS chips and was responsible for the MEMS measurement setup and interfacing. Remco Wiegerink helped design microfluidic sensors and measurement electronics, Joost Lotters was the principal investigator of the project.

Conflicts of Interest

The authors declare no conflict of interest.

References

  1. Mouris, A.J. Optimized Fired Heater Control; Hydrocarbon Processing: Houston, TX, USA, 2010; pp. 65–68. [Google Scholar]
  2. Ulbig, P.; Hoburg, D. Determination of the calorific value of natural gas by different methods. Thermochim. Acta 2002, 382, 27–35. [Google Scholar] [CrossRef]
  3. Udina, S.; Carmona, M.; Pardo, A.; Calaza, C.; Santander, J.; Fonseca, L.; Marco, S. A micromachined thermoelectric sensor for natural gas analysis: Multivariate calibration results. Sens. Actuators B Chem. 2012, 551–558. [Google Scholar]
  4. Sparks, D.; Smith, R.; Riley, D.; Tran, N.; Patel, J.; Chimbayo, A.; Najafi, N. Monitoring and Blending Biofuels Using a Microfluidic Sensor. J. ASTM Int. 2010, 7, 1–9. [Google Scholar] [CrossRef]
  5. Harsányi, G. Polymer films in sensor applications: A review of present uses and future possibilities. Sens. Rev. 2000, 20, 98–105. [Google Scholar] [CrossRef]
  6. Arshak, K.; Moore, E.; Lyons, G.M.; Harris, J.; Clifford, S. A review of gas sensors employed in electronic nose applications. Sens. Rev. 2004, 24, 181–198. [Google Scholar] [CrossRef]
  7. Liu, X.; Cheng, S.; Liu, H.; Hu, S.; Zhang, D.; Ning, H. A survey on gas sensing technology. Sensors 2012, 127, 9635–9665. [Google Scholar] [CrossRef]
  8. Baker, R.C. Flow Measurement Handbook: Industrial Designs, Operating Principles, Performance, and Applications; Cambridge University Press: Cambridge, UK, 2005. [Google Scholar]
  9. Lötters, J.C.; van der Wouden, E.; Groenesteijn, J.; Sparreboom, W.; Lammerink, T.S.J.; Wiegerink, R.J. Integrated multi-parameter flow measurement system. In Proceedings of the 27th International Conference on Micro Electro Mechanical Systems (MEMS 2014), San Francisco, CA, USA, 26–30 January 2014; pp. 975–978.
  10. Lammerink, T.S.J.; Lötters, J.C.; Wiegerink, R.J.; Groenesteijn, J.; Haneveld, J. Single chip flow sensing system with a dynamic flow range of more than 4 decades. In Proceedings of the 16th International Solid-State Sensors, Actuators and Microsystems Conference (Transducers 2011), Beijing, China, 5–9 June 2011; pp. 890–893.
  11. Haneveld, J.; Lammerink, T.S.J.; De Boer, M.J.; Sanders, R.G.P.; Mehendale, A.; Lötters, J.C.; Dijkstra, M.; Wiegerink, R.J. Modeling, design, fabrication and characterization of a micro Coriolis mass flow sensor. J. Micromechanics Microeng. 2010, 20, 125001. [Google Scholar] [CrossRef]
  12. Sparreboom, W.; van de Geest, J.; Katerberg, M.; Postma, F.; Haneveld, J.; Groenesteijn, J.; Lammerink, T.; Wiegerink, R.; Lötters, J. Compact mass flow meter based on a micro Coriolis flow sensor. Micromachines 2013, 4, 22–33. [Google Scholar] [CrossRef]
  13. Reid, R.C.; Prausnitz, J.M.; Poling, B.E. The Properties of Gases and Liquids; McGraw-Hill: New York, NY, USA, 1987. [Google Scholar]