1. Introduction
People living in cities spend up to ninety percent of their time indoors unaware that indoor air pollution levels often exceed those of outdoors. Many of the pollutants cause symptoms which may not occur for many years, and as such, make it difficult to discover the cause. Asthma, other breathing disorders, and even cancer are examples of potentially serious effects caused by exposure to indoor air pollutants [
1]. Volatile organic compounds (VOCs) are the major components in air pollutants. VOCs are organic compounds with boiling points in the range of 50–260 °C at room temperature and atmospheric pressure of 133 Pa. There is a growing concern to monitor and efficiently eliminate harmful volatile organic compounds emitted by the many new building materials, furnishings, printers, pressed wood, wood stoves, and household products in indoor spaces. For example, there is a series of harmful chemical substances, such as VOCs, present in indoor air following the use of air freshers. The air fresheners category includes incenses, natural products, scented candles, and aerosols, to name a few [
1]. Eggert and Hansen measured total VOCs emission from one stick or cone of incense, which “varied between 6 and 121 mg [
2]. If those amounts were evenly distributed in a 20 m
3 room without ventilation it would result in 300 to 6000 μg/m
3” [
1]. Similar results were obtained by Manoukian et al. [
3].
There are a variety of approaches for controlling VOCs in indoor environments such as source control, ventilation, and air cleaning. At present, air purification remains one of the most promising air-cleaning methods that involves diverse control techniques, e.g., adsorption by activated carbon, photocatalytic oxidation, biological treatment, catalytic oxidation, absorption, and ionization methods, to mention a few [
4,
5,
6].
Among the technologies available to clean-up indoor VOCs, the total oxidation to less harmful compounds (CO
2, H
2O, and HCl) by heterogeneous catalysis offers the best potential to eliminate VOCs even at very low concentrations, i.e., parts per billion (ppb) levels, peculiar to indoor air. What is more, catalytic oxidation technology is regarded as an efficient method because of its effectiveness against low levels of the generation of secondary pollutants and possibility to control the selectivity of the by-products [
7]. The main challenge is the development of active and stable catalysts that can operate at temperatures as low as ambient temperatures, in order to reduce the high costs of running indoor catalytic air clean-up systems and avoid the formation of unwanted by-products such as NOx produced by high temperature oxidation reactions. Since VOCs are stable organic compounds, it is extremely difficult to carry out the total catalytic oxidation of most of them below 200 °C.
Selection of the catalytic materials for various organic pollutants is a very challenging task, due to the large variety of VOCs and the complex nature of VOCs mixtures [
8]. Catalysts used for complete oxidation of VOCs are classified into three main groups: noble metal-based catalysts, transition metal oxide catalysts, and alloy catalysts [
9]. Regarding metal oxide catalysts, in particular Co, Mn, Cu, Ni, Mo, and V oxides, although they show significant activity and are cheap, they are not sufficiently stable [
10]. However, increased stability was shown by CuxCeMgAlO mixed oxide catalysts derived from multicationic LDH (Layered Double Hydroxide) precursors for methane total oxidation [
11]. Though noble metal catalysts are expensive, they are still largely preferred because they show lower light off temperatures in complete oxidation of VOCs. Their catalytic activity depends on the noble metal and varies with the nature of VOC [
12]. Mostly studied so far are Pt or Pd or both, supported on γ-Al
2O
3 or CeO
2–Al
2O
3 mixed oxides [
13]. However, the most noble of all, Au in bulk form, was for a long time the exception. It was not until the unprecedented discovery by Haruta [
14,
15] that supported gold nanoparticle (1–5 nm) catalysts exhibited the lowest temperature CO total oxidation, i.e., −77 °C, compared to any other catalyst, which suggested that gold could possibly be the answer for low temperature total oxidation of VOCs as well. More than 30 years on, although there is an agreement on the high catalytic activity of gold nanoparticles, there is still a scientific debate encompassing the nature of the active sites. Despite extensive research, no unambiguous identification of the active site’s nature in CO oxidation has been reported to date [
16,
17,
18,
19]. However, it has been reported that the activity of gold-based catalysts depends on the size of the gold nanoparticles on the support (the smaller the gold, the more active the catalyst), on the degree of dispersion of gold onto support, on gold–support interaction, on oxidation state (s) of gold, and on the nature of the catalyst support [
20,
21,
22,
23].
Typically, the active phases are deposited on a suitable support. Several types of supports with good thermal stability and high surface area have been used, such as, Al
2O
3, ZrO
2, CeO
2, SiO
2, TiO
2, SnO
2, CuO, Fe
2O
3, La
2O
3, MgO, montmorillonite, zeolites, and carbon-based materials. The use of nanotubular materials as catalyst supports, in which the active centres are nanoparticles inside the tubes, has also been investigated. Carbon nanotubes, boron nitride nanotubes, and halloysite nanotubes are some typical examples of the nanotubular supports reported [
6].
Among them, SBA-15 mesoporous silica has the potential to become an excellent support for gold nanoparticles as it offers a very high surface area for gold dispersion, with ordered mesopores large enough to accommodate gold nanoparticles in its internal and external surfaces, as well as allowing easy access of reactant molecules to the active sites. In addition, SBA-15 has high structural, thermal, and hydrothermal stability [
24,
25,
26].
As for the VOCs total oxidation on supported gold nanoparticles, the literature data is scarce and even scarcer for VOCs oxidation on Au/SBA-15 [
27]. The few examples are as follows: Walters et al. [
28] reported the high activity of Au/Co
3O
4 for the combustion of methane, whereas Haruta et al. [
29] reported the high activity of Au/αFe
2O
3 for the combustion of methanol, formaldehyde, and formic acid. A recently published review by Kim et al. [
30] deals with trends for VOC removal on noble-metal-based catalysts. Ag, Au, Pd, Pt, and Pd-Ce catalysts supported on different supports were considered for the total oxidation of toluene, benzene, xylene, and cyclooctane, respectively, focusing mainly on the mechanism and kinetics. However, the most recent review on acetone catalytic removal [
31] lists manganese-based catalysts as the more used ones, followed by cerium-based, cobalt-based, platinum-based, and palladium-based ones. There is no mention of gold-based catalysts at all.
Minicò et al. [
32] studied the complete oxidation of 2-propanol, ethanol, methanol, acetone, and toluene over an Au/iron oxide. As for acetone, the complete conversion was observed at around 300 °C. Scirè et al. [
33] studied the complete methanol, acetone, and toluene oxidation over an Au/CeO
2 catalyst. The temperature required for the complete oxidation of acetone was around 300 °C and slightly varied with the preparation method of the catalysts, i.e., deposition precipitation or coprecipitation.
Au/oxide catalysts, where is the oxides are MgO, Y
2O
3, CuO and NiO, were used to study the total oxidation of acetyl acetate and toluene. As such, the relationship between catalytic activity and the support reducibility was established [
34].
To the best of our knowledge, there is no published data on developed Au/SBA-15 catalysts tested for VOCs oxidation.
Therefore, the aim of this study is to undoubtedly clarify the nature of gold active sites, to determine their size and dispersion, and also to give insights into the VOCs total oxidation mechanism using acetone as the model molecule over the in-house designed and prepared Au/SBA-15 catalyst’s samples. Acetone was chosen as the model molecule because it is one of the most abundant oxygen-containing VOCs in the atmosphere, and it is also one of the most widely present indoor VOCs species [
31].
2. Results and Discussion
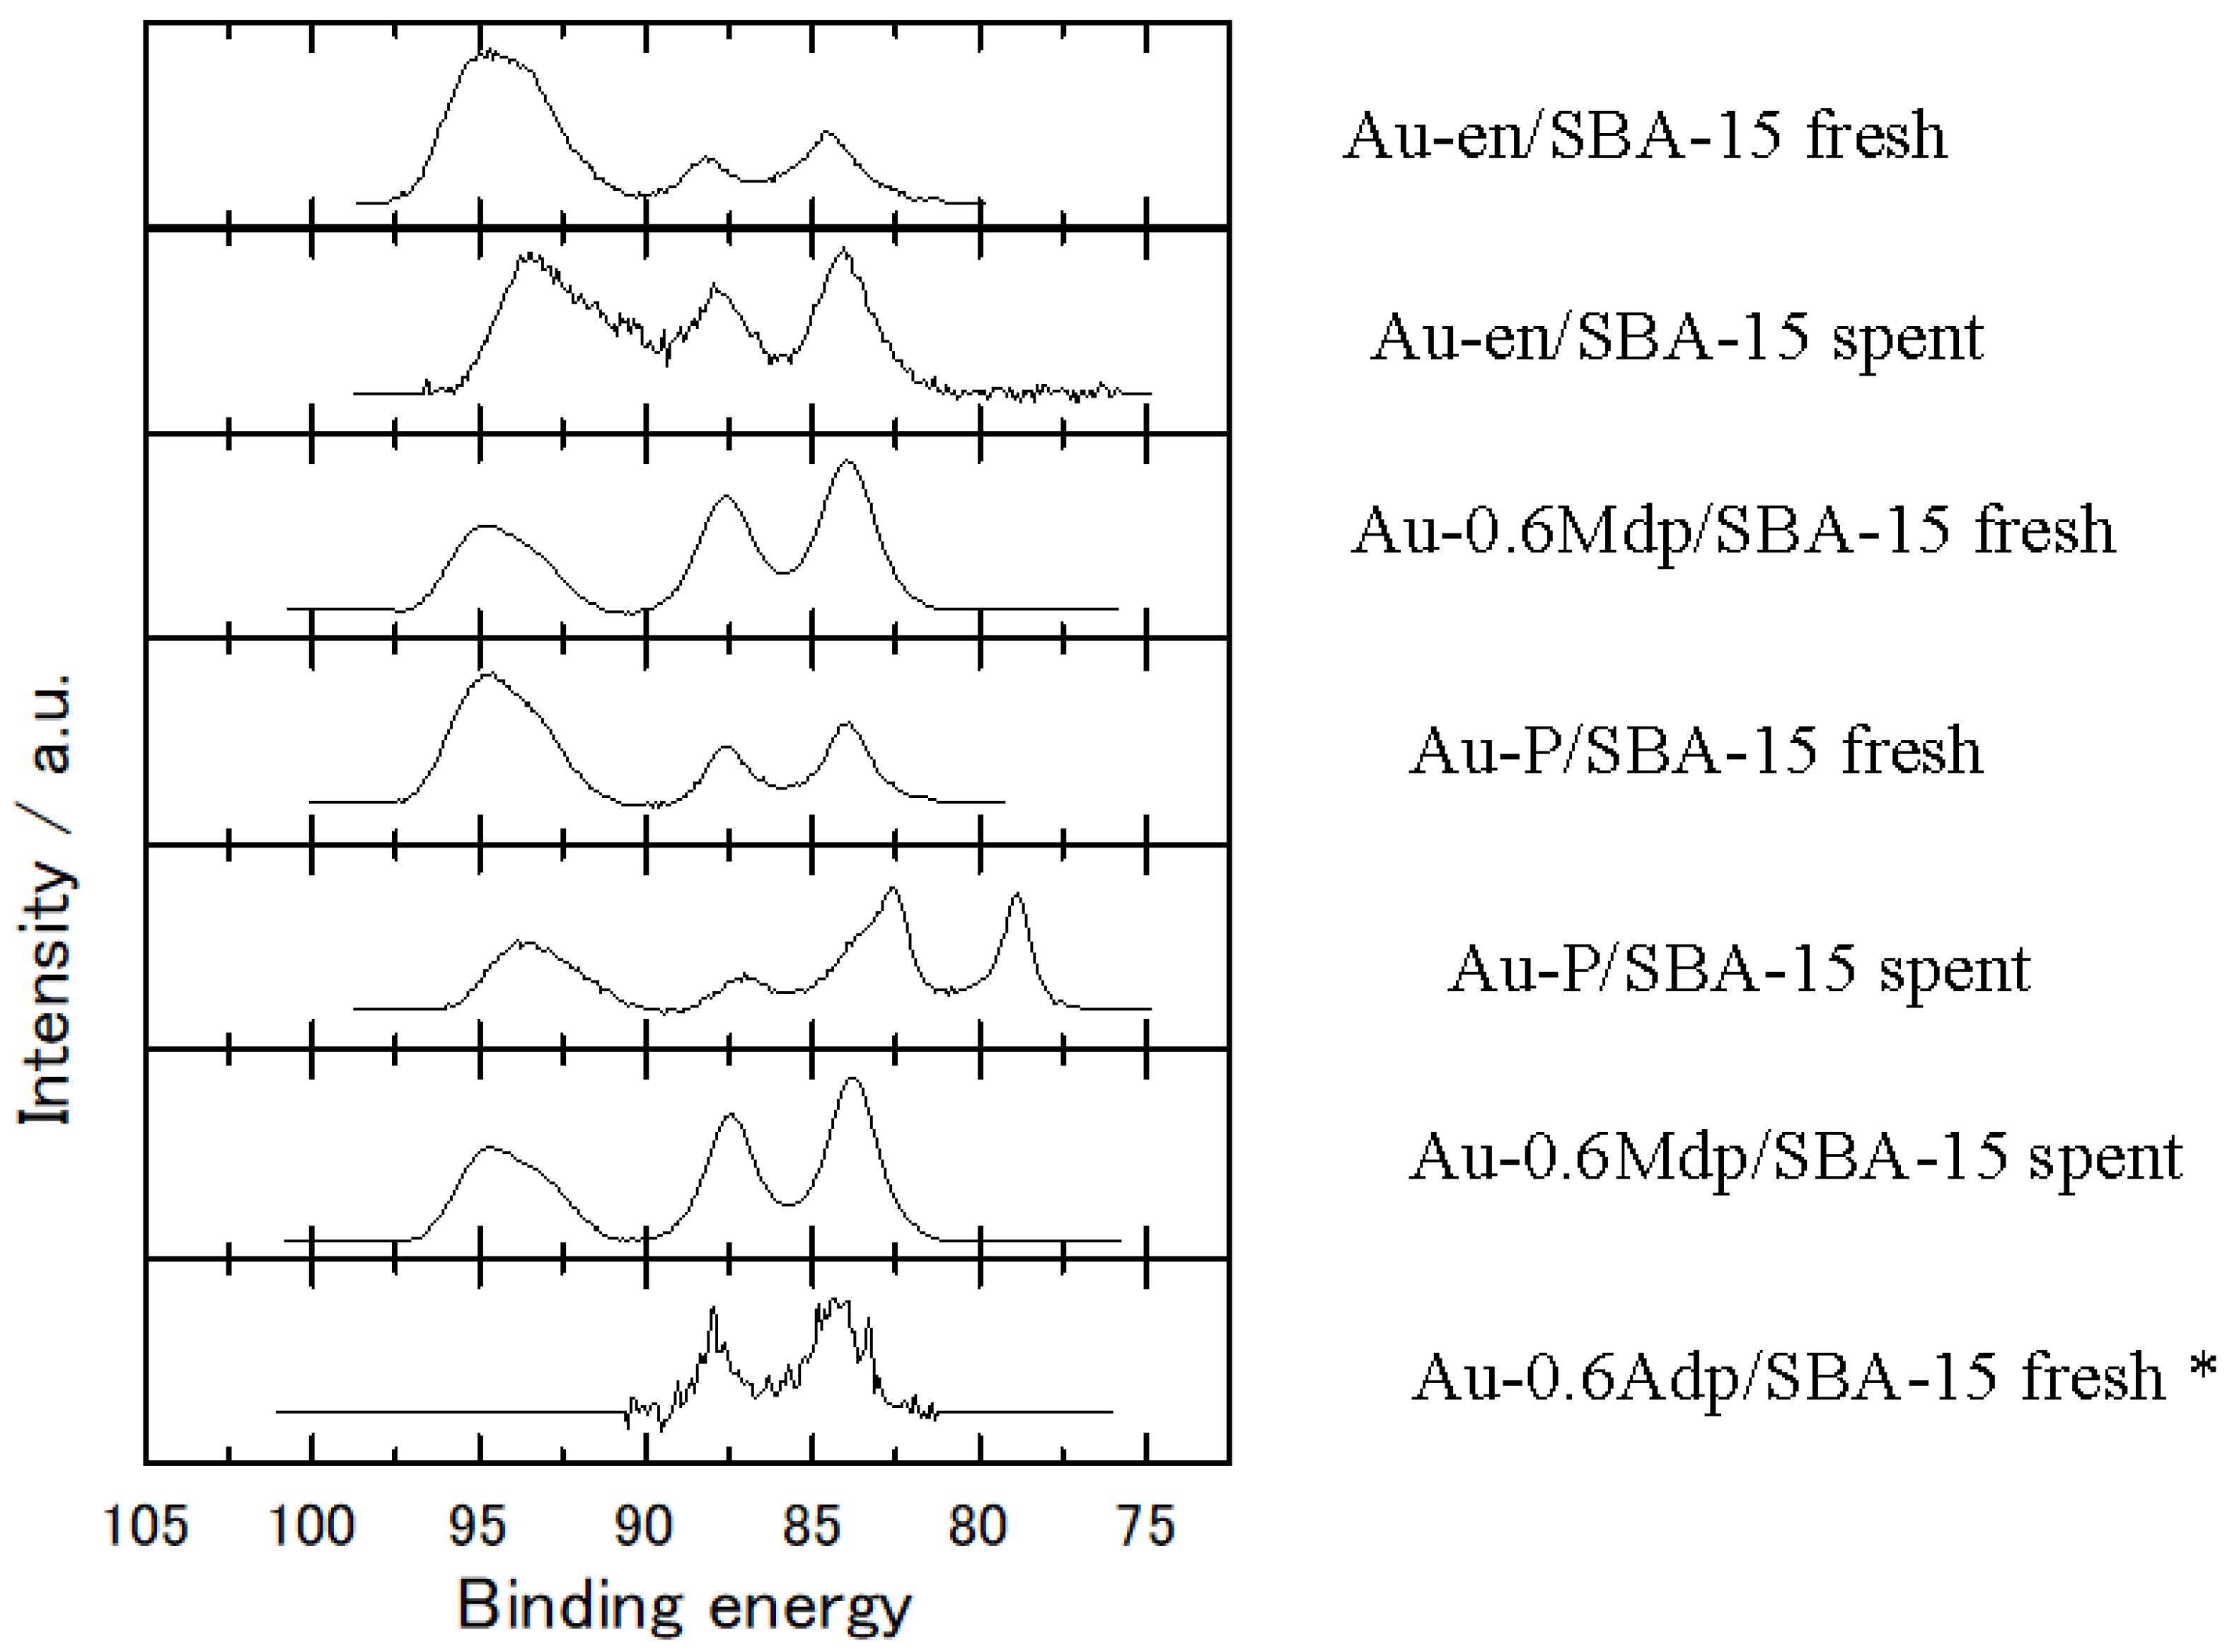
The nature of the gold species on SBA-15 was investigated through XPS and TPR measurements and data analysis. The oxidation state of gold was undoubtedly assessed by means of X-ray photoelectron spectroscopy. As seen in
Figure 1, all fresh samples show Au (4f
7/2) BE values at 84.3 ± 0.3 eV and FWHM in the range of 1.8–2.3 eV. As for the spent samples, Au-en/SBA-15 and Au-0.6Mdp/SBA-15 show similar features as the fresh ones, with Au (4f
7/2) BE values at 84.1 and 83.8 eV and FWHM of 2.1 and 1.8 eV, respectively. The spent Au-P/SBA-15 sample shows a rather different feature. Another clearly resolved Au 4f
7/2,5/2 doublet is observed on the lower binding energy side, which can be attributed to two chemically Au environments [
35]. In other words, Au clusters in different positions have different charge effects to make the shift. This finding is supported by the TEM images, which show that there are gold nanoparticles grown on the surface (Au-Silica environment) of the support along with gold nanoparticles grown on top of each other (Au-Au environment).
Compared to the Au (4f) region recorded on Au foil which showed an Au (4f
7/2) BE value of 84.0 eV and FWHM of 1.8 eV, three of the four as-made samples, namely Au-en/SBA-15, Au-0.6Mdp/SBA-15 and Au-0.6Adp/SBA-15, show a slightly broader feature; the full width at half maximum was 2.3 eV for the first one and 2.0 eV for the last two. In accordance with the literature, peak broadening could be attributed either to a differential charging effect arising from the insulating nature of the support suggesting the presence of gold species with inhomogeneous cluster size distribution [
36] or to different oxidation state [
32]. The peak broadening is most probably due to the presence of gold clusters with different sizes. TEM measurements support this statement, as seen below. The Au-P/SBA-15 spent catalyst shows abnormal XPS spectra; two pairs of Au peaks with further lower energy are discussed below.
Table 1 presents the XPS features of all samples.
For all samples except the Au-P/SBA-15 spent one, the peaks of Au (4f
5/2) and Au (4f
7/2) are centered at 87.7 ± 0.4 eV and 84.2 ± 0.4 eV, respectively, indicating the presence of gold in the metallic state. These results are in good agreement with the literature. It was found that gold is present just as Au
0 at calcination temperatures higher than 300 °C [
32]. For all our samples, the calcination temperature was 500 °C.
The peak appearing between 90 and 96 eV for all samples but the Au-0.6Adp/SBA-15 fresh one was assigned to Si (2p), which was excited by Mg Kα3,4.
As seen in
Figure 1, the Au (4f) peaks for the Au-0.6Adp/SBA-15 fresh sample are weaker than that of all other measured samples since its Au/Si surface ratio is the lowest one among the samples studied.
As seen in
Table 1, the Au/Si ratio (surface) is slightly different between the fresh and spent samples. Whereas the Au/Si ratio increases from fresh to spent Au-en/SBA-15 catalyst, the Au/Si ratio decreases from the fresh to spent Au-0.6Mdp/SBA-15 catalyst. A possible explanation for their different behaviour lies on the different particle size of the fresh samples and their different susceptibility to sintering. The particle size for the fresh catalyst’s samples was determined via TEM and XRD (see
Table 2). The average particle size for the Au-en/SBA-15 sample was 60 Å, whereas for the Au-0.6Mdp/SBA-15 one, it was 19 Å. As claimed in the literature [
37], particles with a very small size (diameter < 30 Å) are expected to be mobile and to migrate through surface diffusion when the temperature increases, leading to coalescence when particles come in close proximity to each other. As such, some of the small surface Au particles of the Au-0.6Mdp/SBA-15 sample will disappear, leading to a decrease in the Au/Si surface ratio. As for the particles with a diameter between 30 and 100 Å, their mobility decreases with the increase in size, which slows down the sintering process, and subsequently, the Au/Si surface ratio would not be affected in a negative way. What is more, some of the smaller particles can migrate from the pores to the surface during reaction. Consequently, the Au/Si surface ratio for the spent Au-en/SBA-15 sample was slightly higher than the one for the fresh sample.
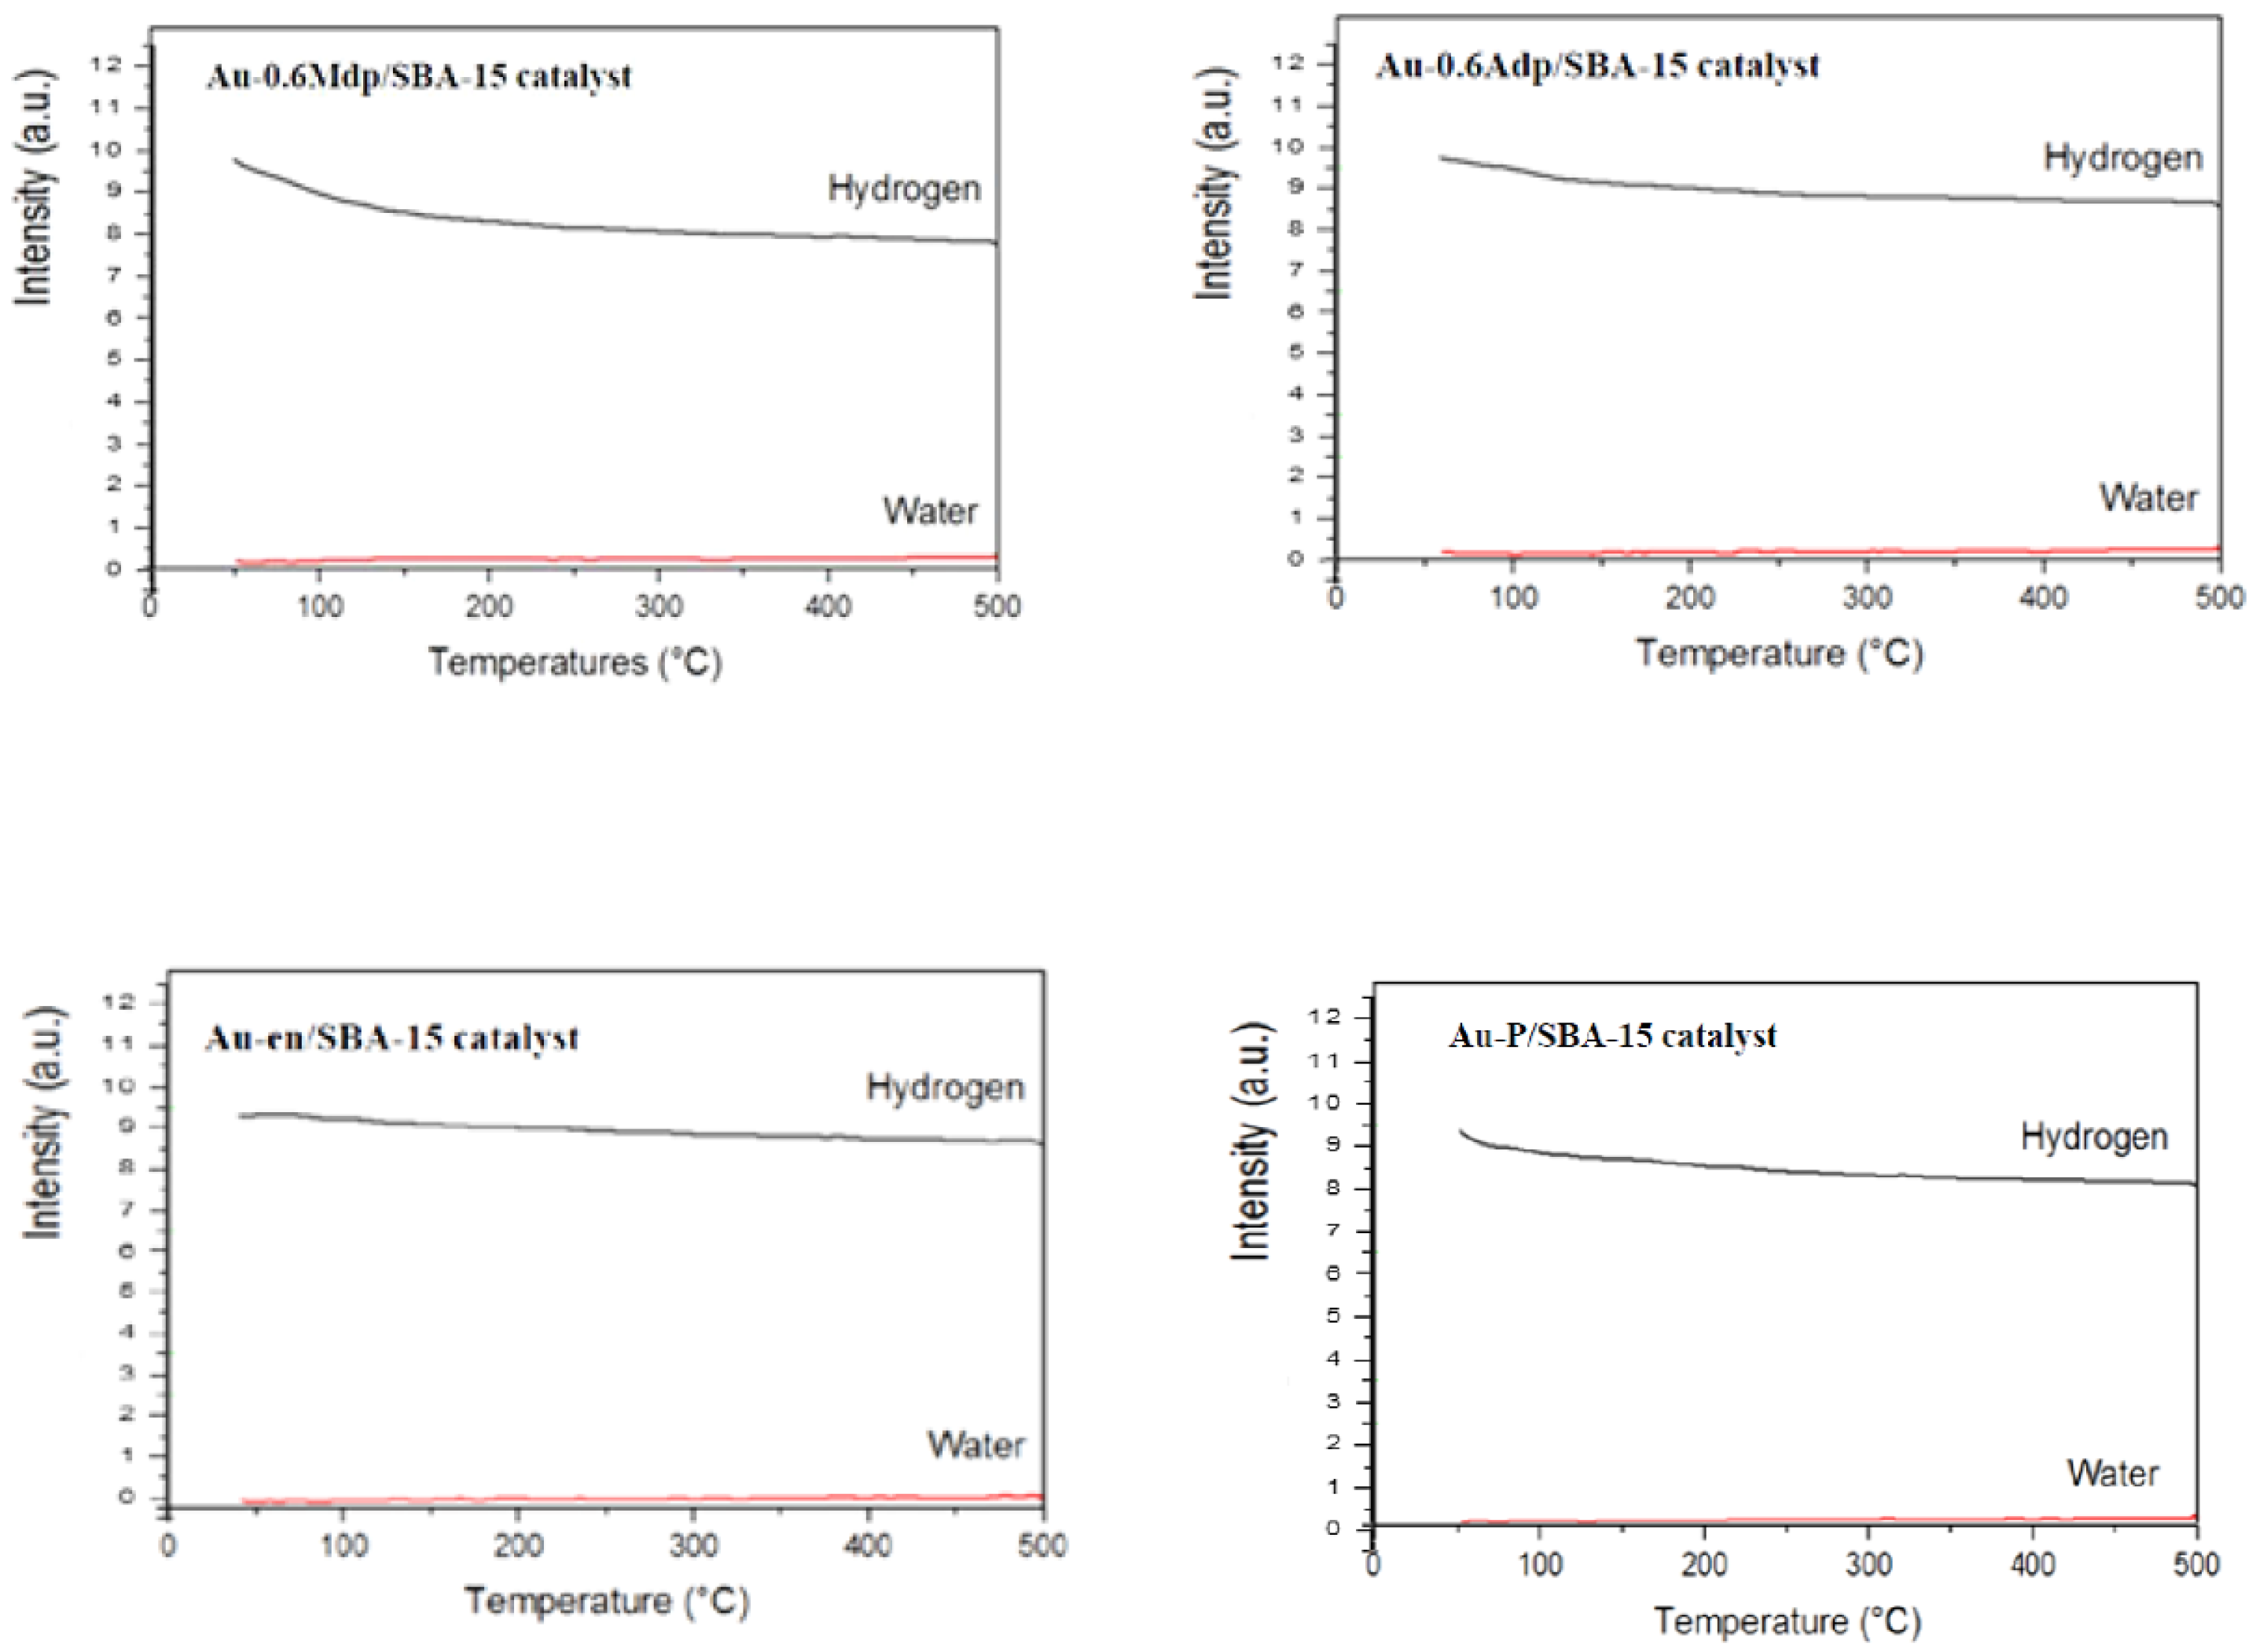
The H2-TPR for all the fresh samples started off at room temperature, with readings measured from around 50 °C, and gradually rose to 500 °C at the 10 °C/min ramp rate. Hydrogen and water MS partial pressures signals drifted continuously with no observed hydrogen consumption peak with corresponding water formation peak, which suggests that no observable reduction occurred between 50–500 °C for all Au/SBA-15 samples.
H
2-TPR measurements (see
Figure 2) however, show some hydrogen consumption but only at temperatures lower than 150 °C, which could be due to the physical adsorption of hydrogen. The amount of effluent H
2 stays constant for temperatures higher than 150 °C. This behaviour could be attributed to the incomplete evacuation of hydrogen, a very small molecule, from the ionisation chamber of the mass spectrometer. As no hydrogen consumption was observed at higher temperatures and almost no water was formed, one can conclude that no reduction of the gold species occurred, or, in other words, the gold species were already reduced, i.e., Au
0 at room temperature.
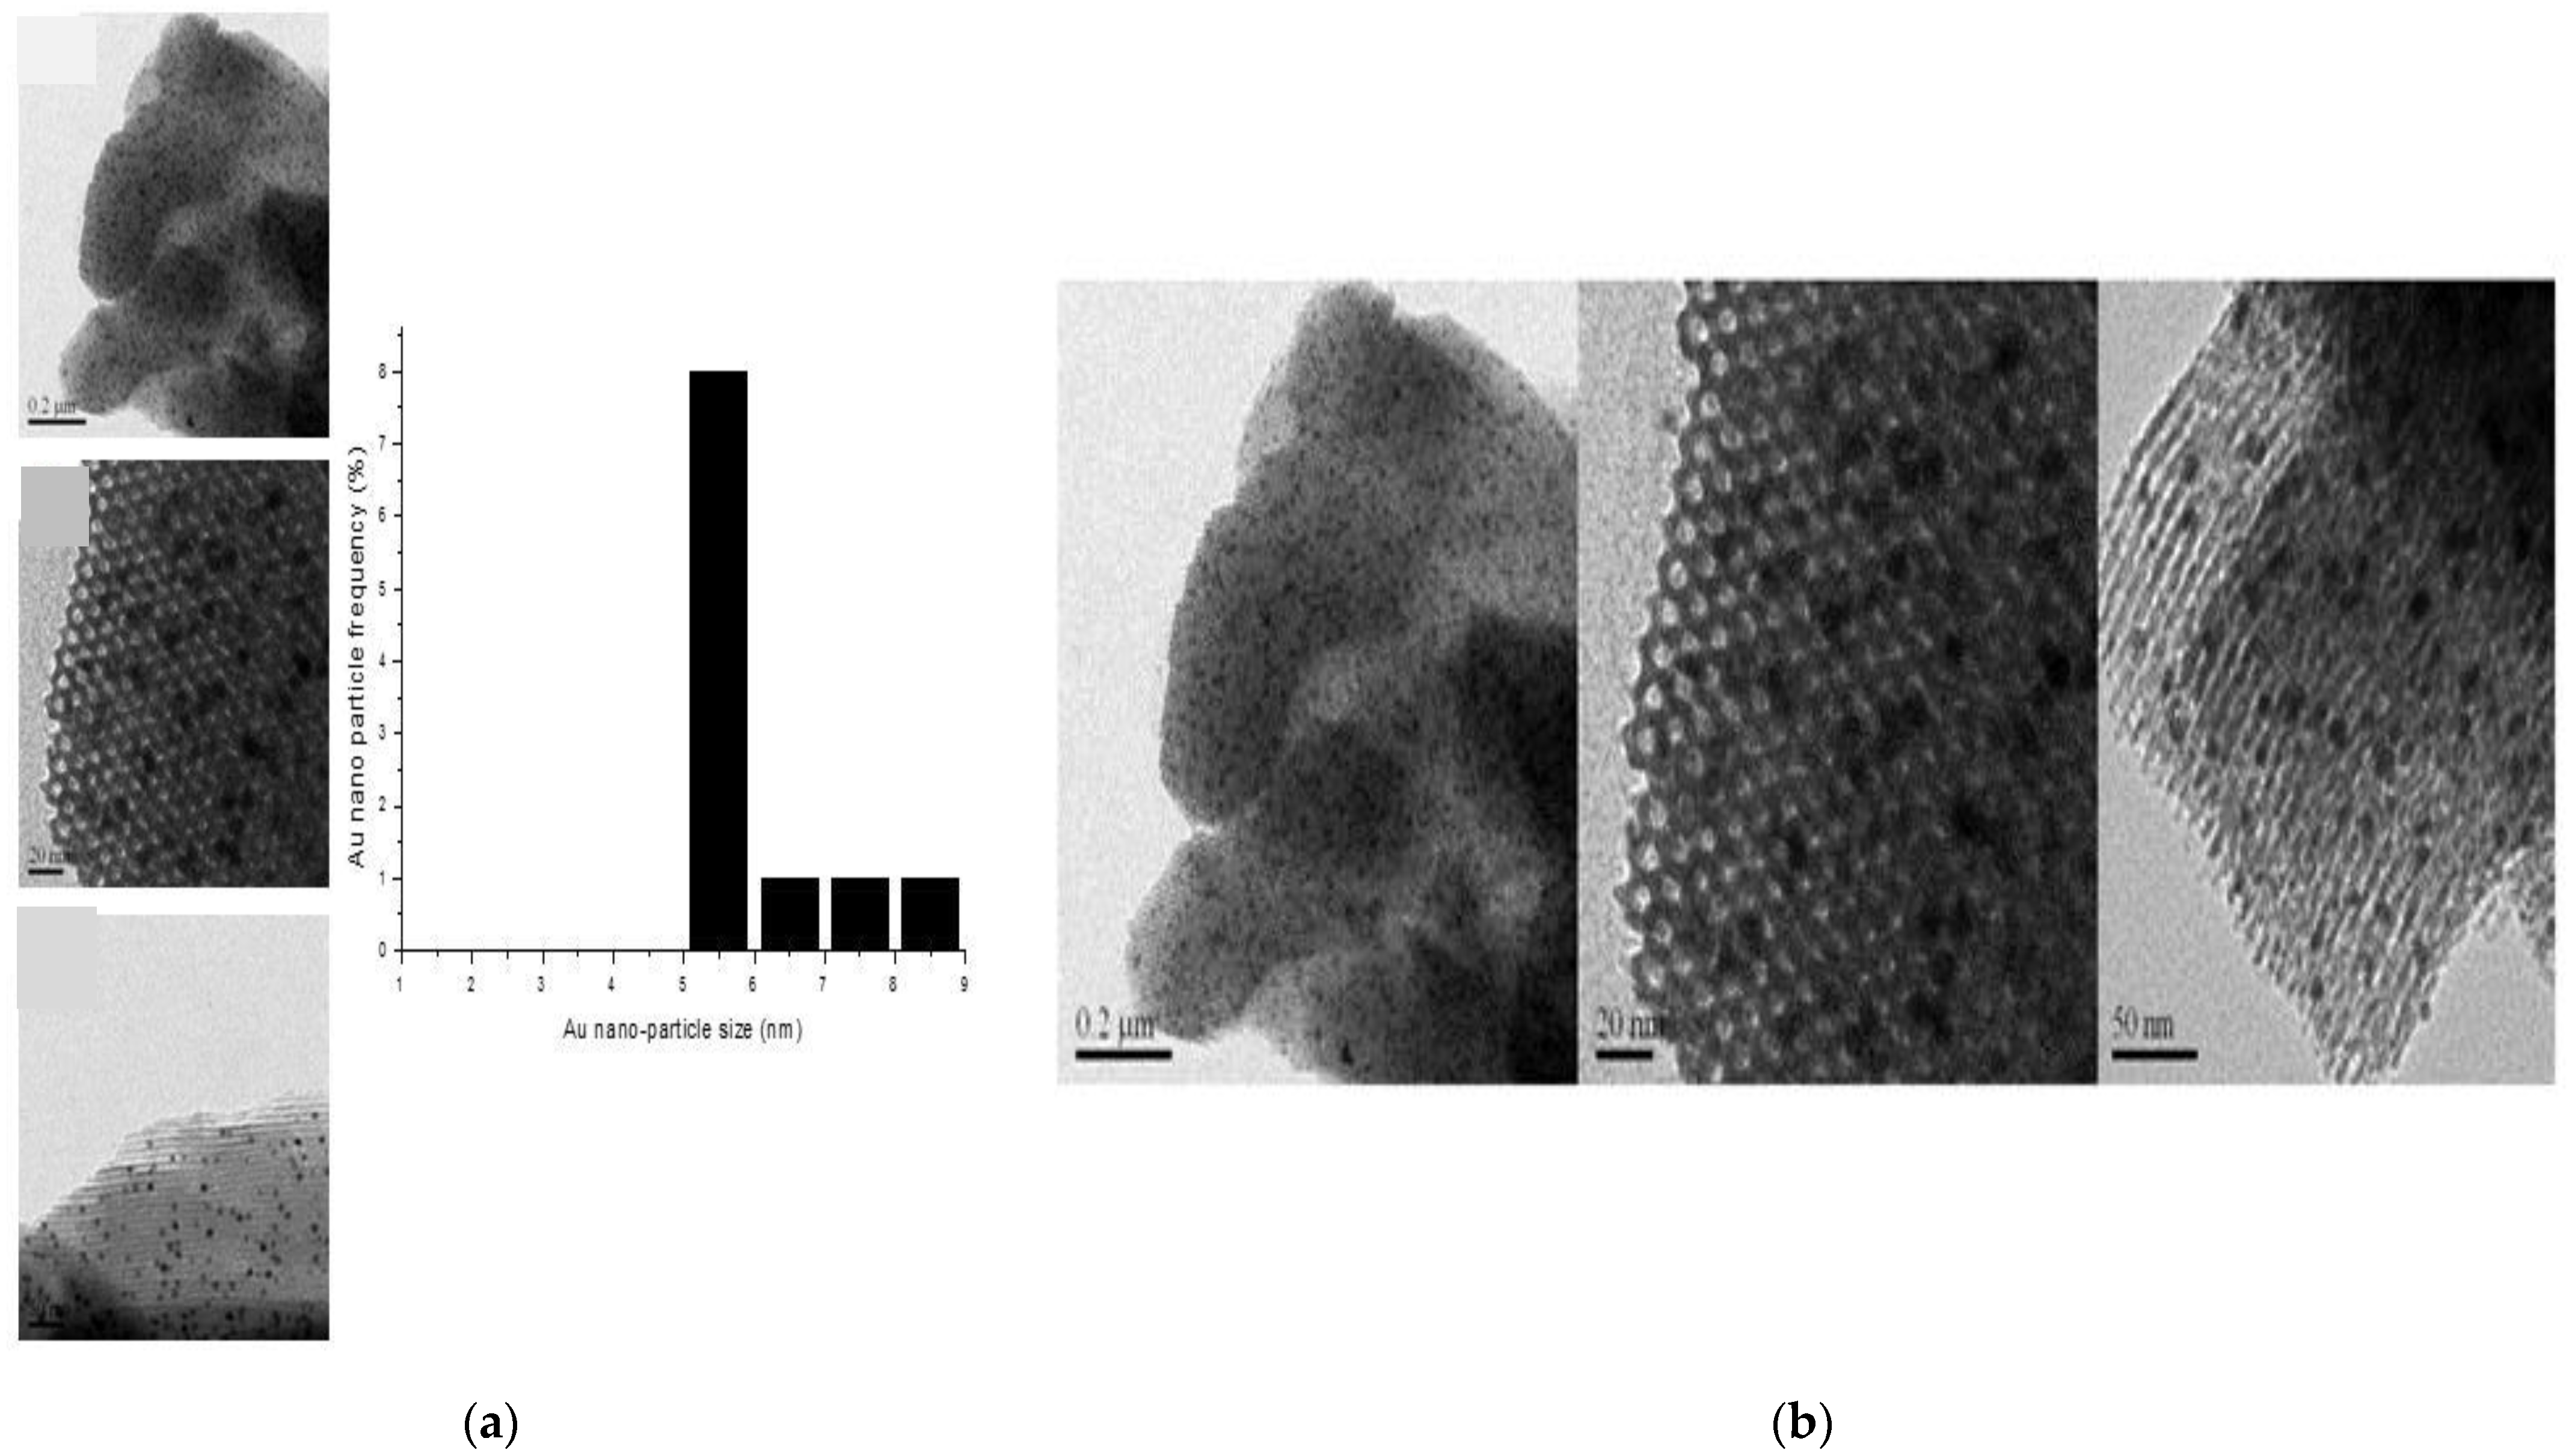
The size of the gold particles and their dispersion on SBA-15 was assessed by TEM measurements and data analysis.
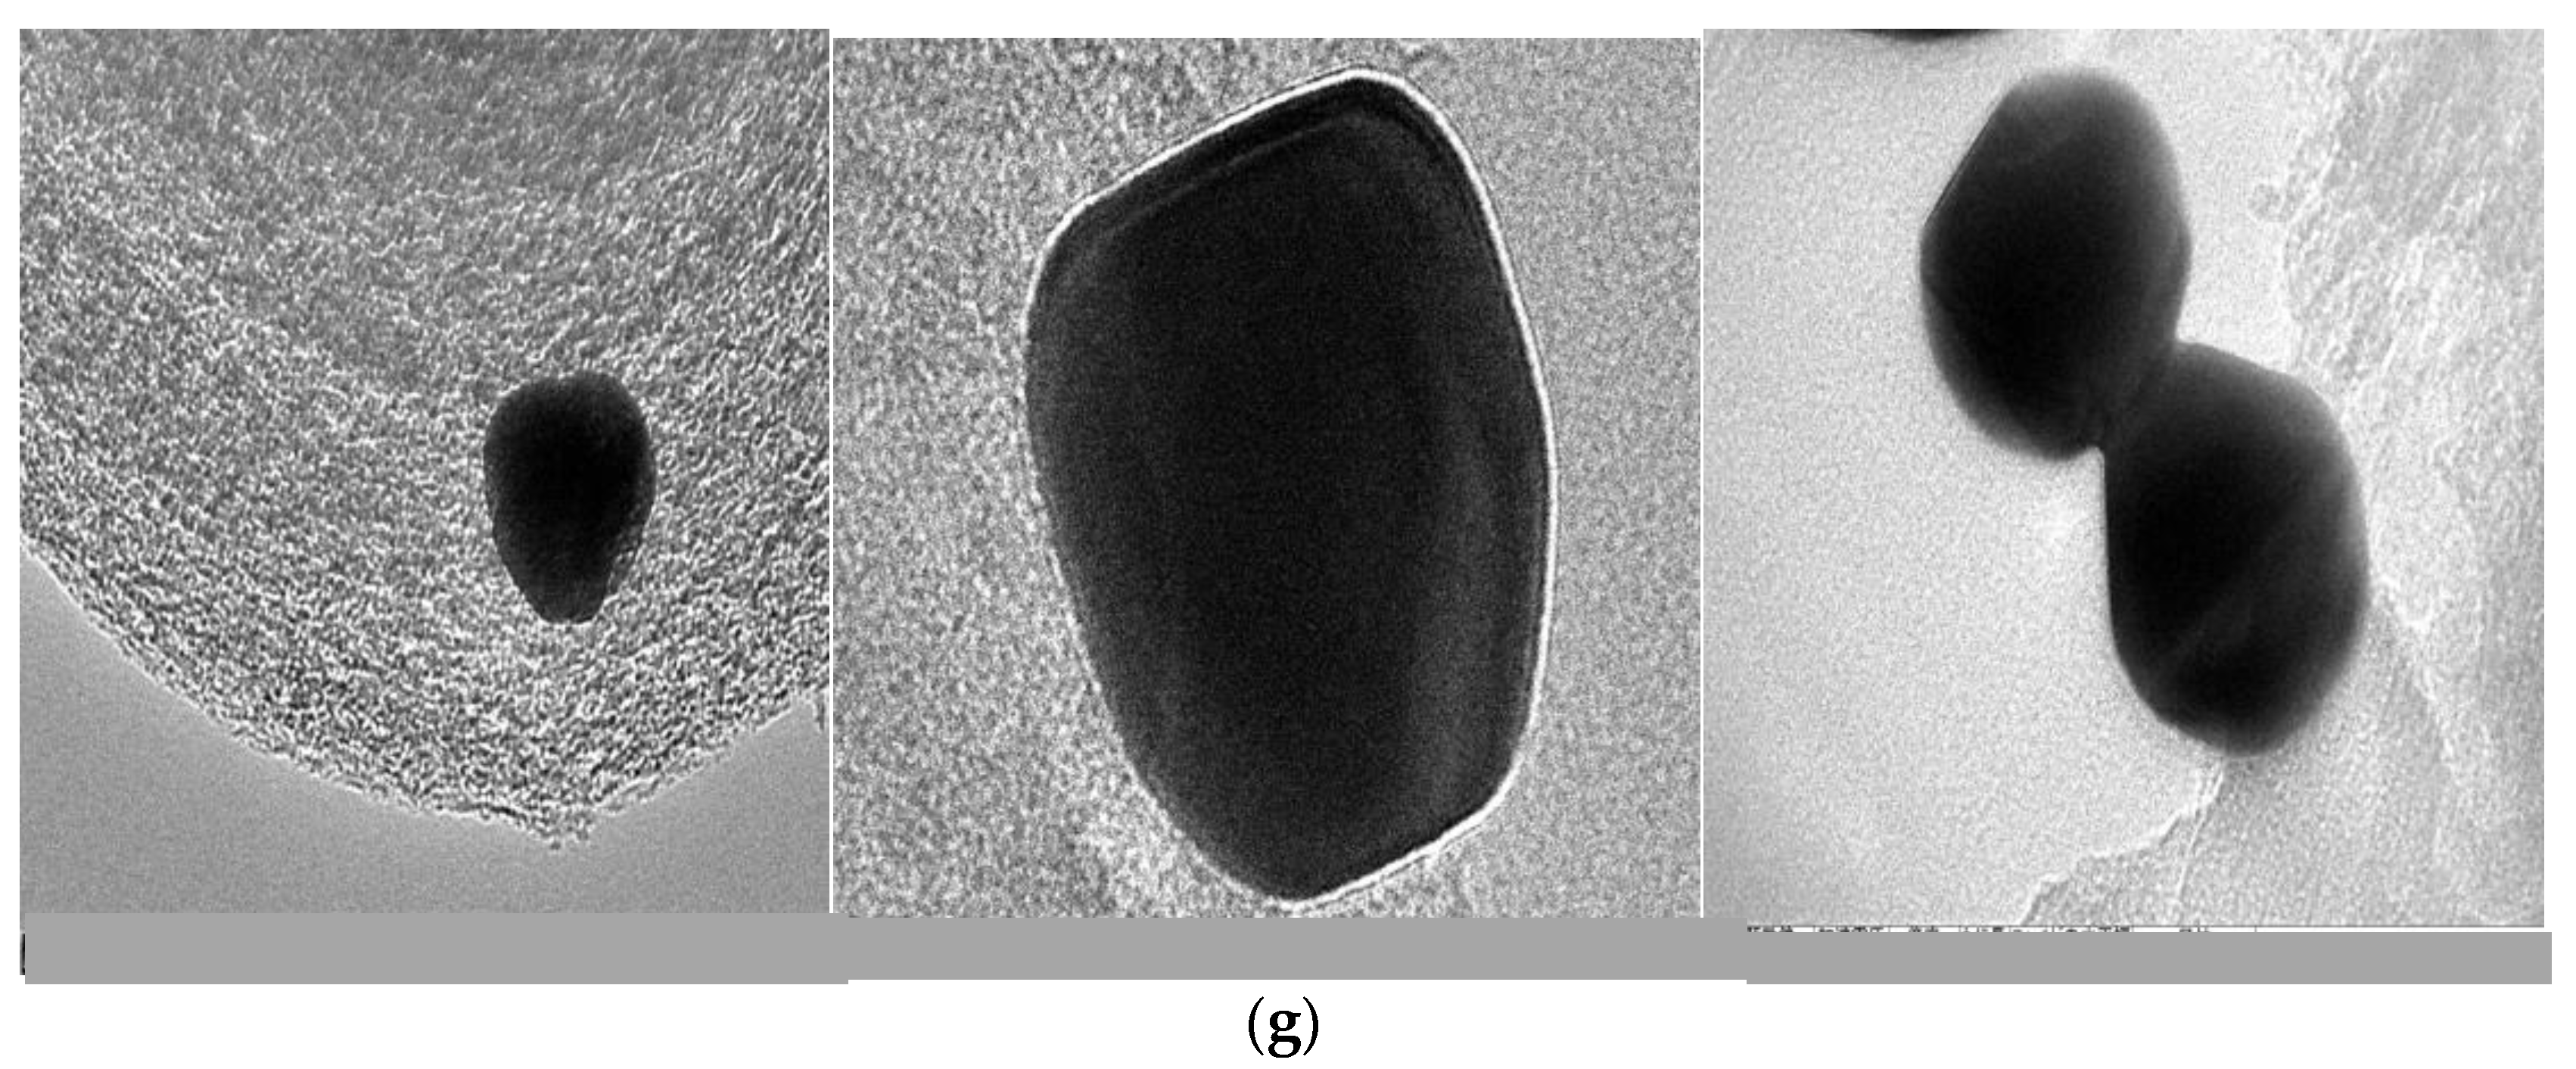
Figure 3a–g presents the TEM images taken on the fresh and spent samples. Each histogram was obtained by measuring the particle size for more than 1000 particles from 30 to 40 TEM images for each sample. The diameter of the gold nanoparticles was analysed using the image analysis software, ImageJ (NIH).
TEM micrographs clearly reveal the size, shape, and location of the gold nanoparticles.
For the Au-en/SBA-15 and Au-0.6Mdp/SBA-15 fresh samples, a great majority of the particles have been successfully entrapped inside the SBA-15 channels and show spherical morphology (
Figure 3a,c).
The smallest gold particles were observed for the Au-0.6Mdp/SBA-15 fresh sample (
Figure 3c). They were well-dispersed and very stable as the TEM taken after their use in the acetone oxidation reaction showed no significant sintering (
Figure 3d). Furthermore, no significant changes of the size and the shape of the gold particles were observed for the used Au-en/SBA-15 sample (
Figure 3b).
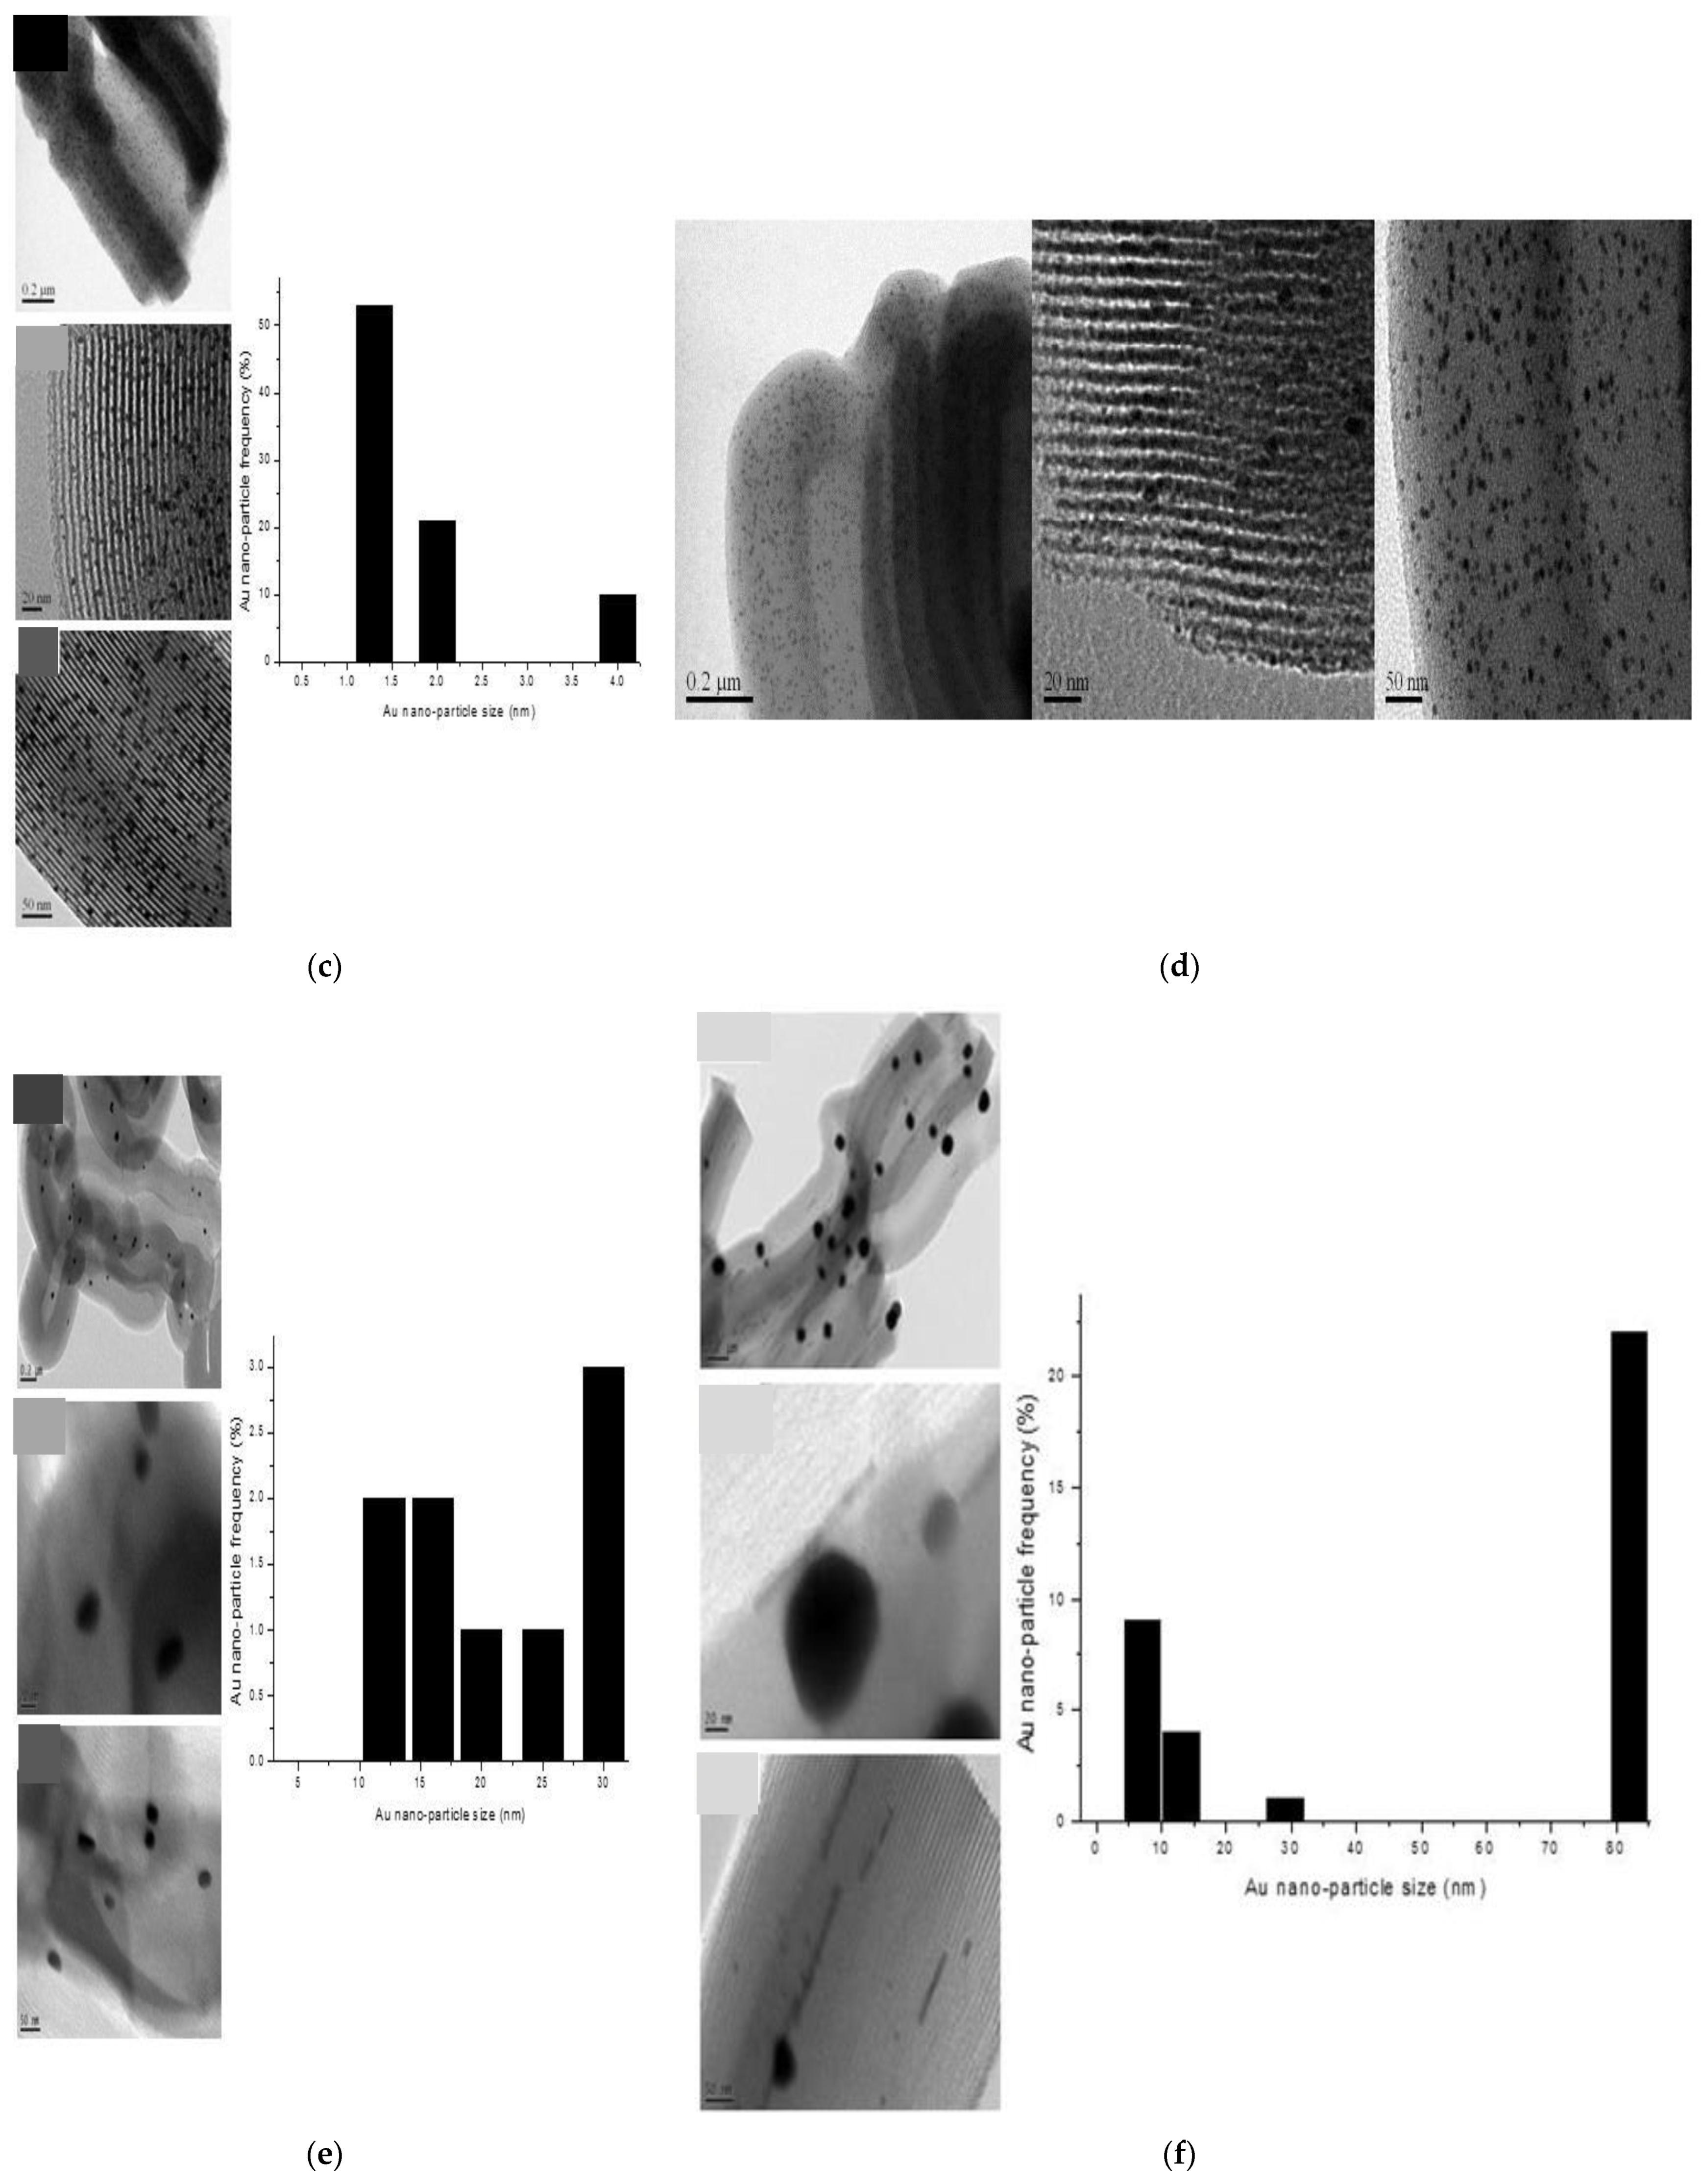
For the Au-0.6Adp/SBA-15 fresh sample, TEM micrographs show bigger gold particles, some still spherical, some oval-shaped, and with the majority of them at the external surface of the support.
TEM images of the Au-P/SBA-15 fresh sample (
Figure 3f) reveal the formation of rather elongated 1D particles inside the pores along with bigger irregularities in shape 3D particles, and on the surface of the support. As for the Au-P/SBA-15 spent sample (
Figure 3g), TEM micrographs show mostly bigger 3D surface particles.
TEM images taken over the Au-P/SBA-15 spent sample (
Figure 3g) confirmed that the two chemical environments for Au
0, Au-Au clusters were on top of each other and on the surface of the support, as predicted by XPS measurements.
The mean particle size was calculated and the results are presented in
Table 2.
As shown by the TEM images (
Figure 3a,b), the hexagonal ordered mesoporous structure of SBA-15 was not altered, neither by gold loading nor by an oxidation reaction. Dispersion is slightly different from sample to sample as it depends on the particle size, which in turn depends on the number of gold atoms in the clusters. The total number of gold atoms,
NAu, is commonly calculated assuming a quasi-spherical gold nanoparticle shape using Equation (1) [
38,
39]:
where
D is the diameter of the gold nanoparticle in Å.
The number of gold atoms at the surface is calculated from the volume difference between the particle and the particle with one surface layer less, which has the radius to be (D/2–d). d and has a layer spacing of Au 2.38 Å.
Table 2 presents the calculated total number of gold atoms for each of the samples, along with the calculated dispersion.
As the SBA-15 average pore diameter was 54 Å, and as gold loading did not affect the pore size, one can conclude that the prepared samples can be divided into two groups: (i) small Au particles inside the support’s pores, and (ii) with large Au particles (clusters) on the external surface of the support.
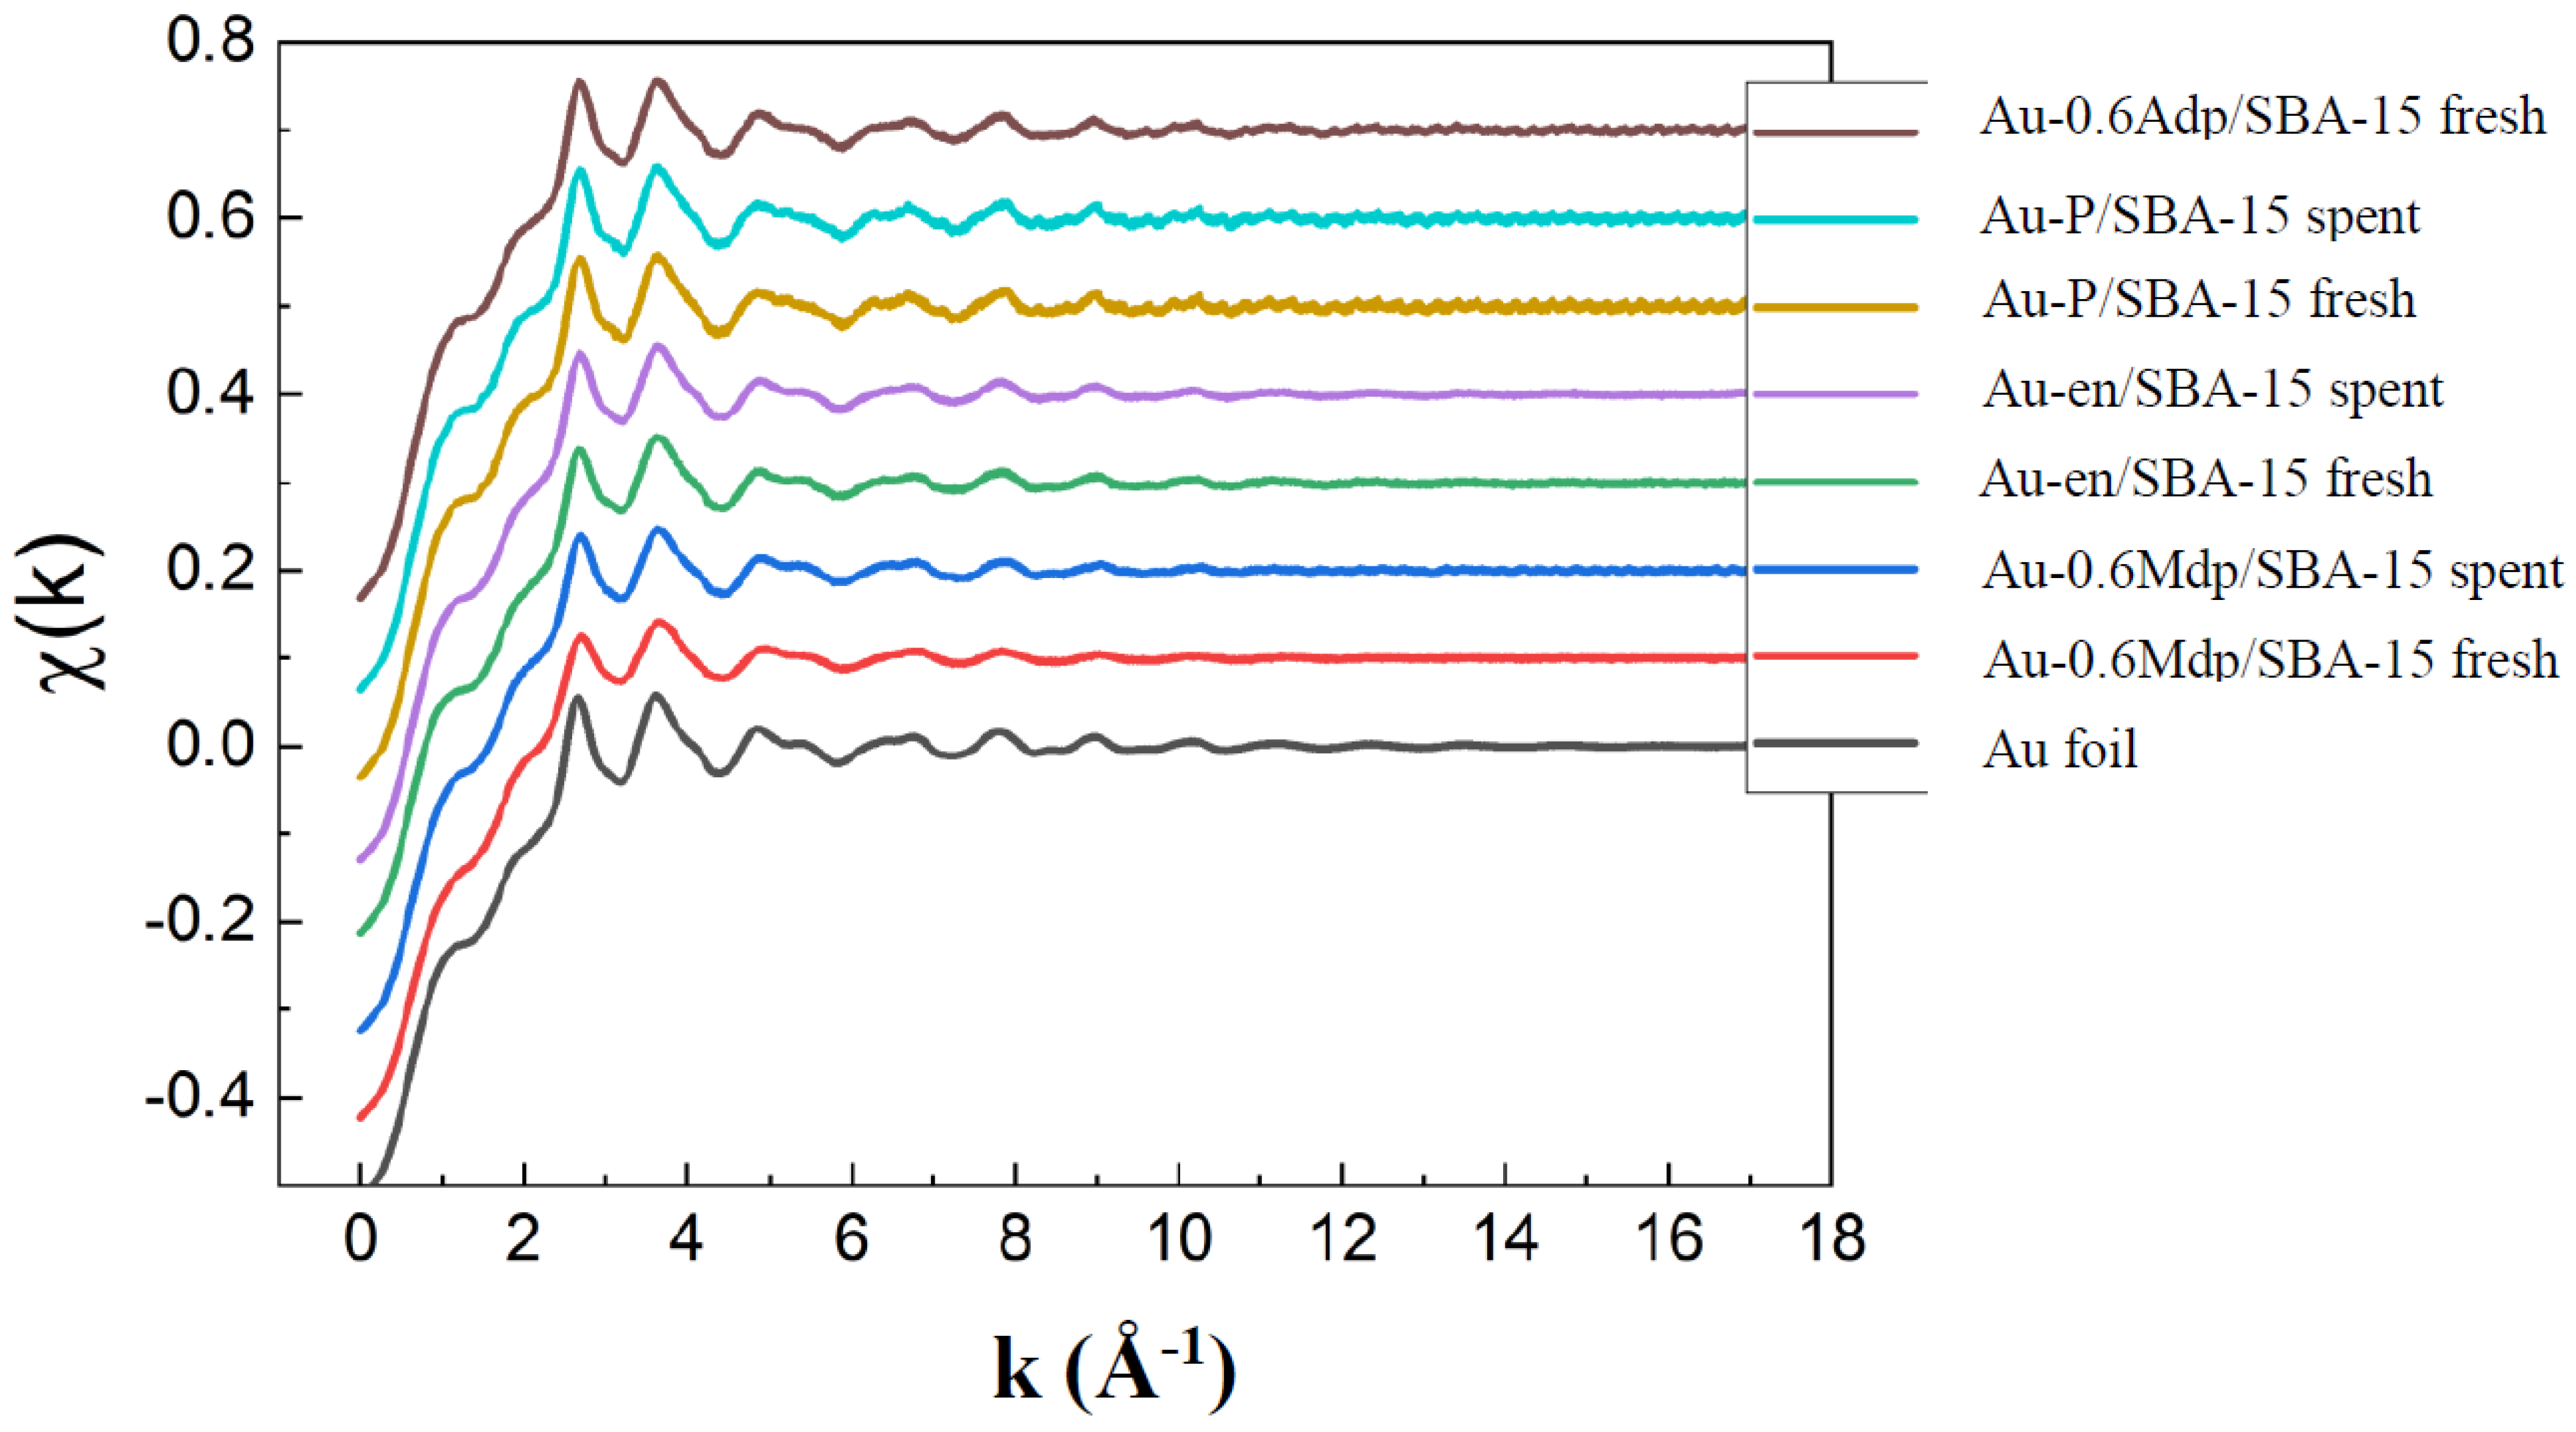
The nature and the size of the Au nanoparticles along with Au dispersion were also assessed through EXAFS and XRD measurements and data analysis. As seen in
Figure 4, for all tested samples, metallic gold only was identified from the EXAFS spectra taken against the Au foil.
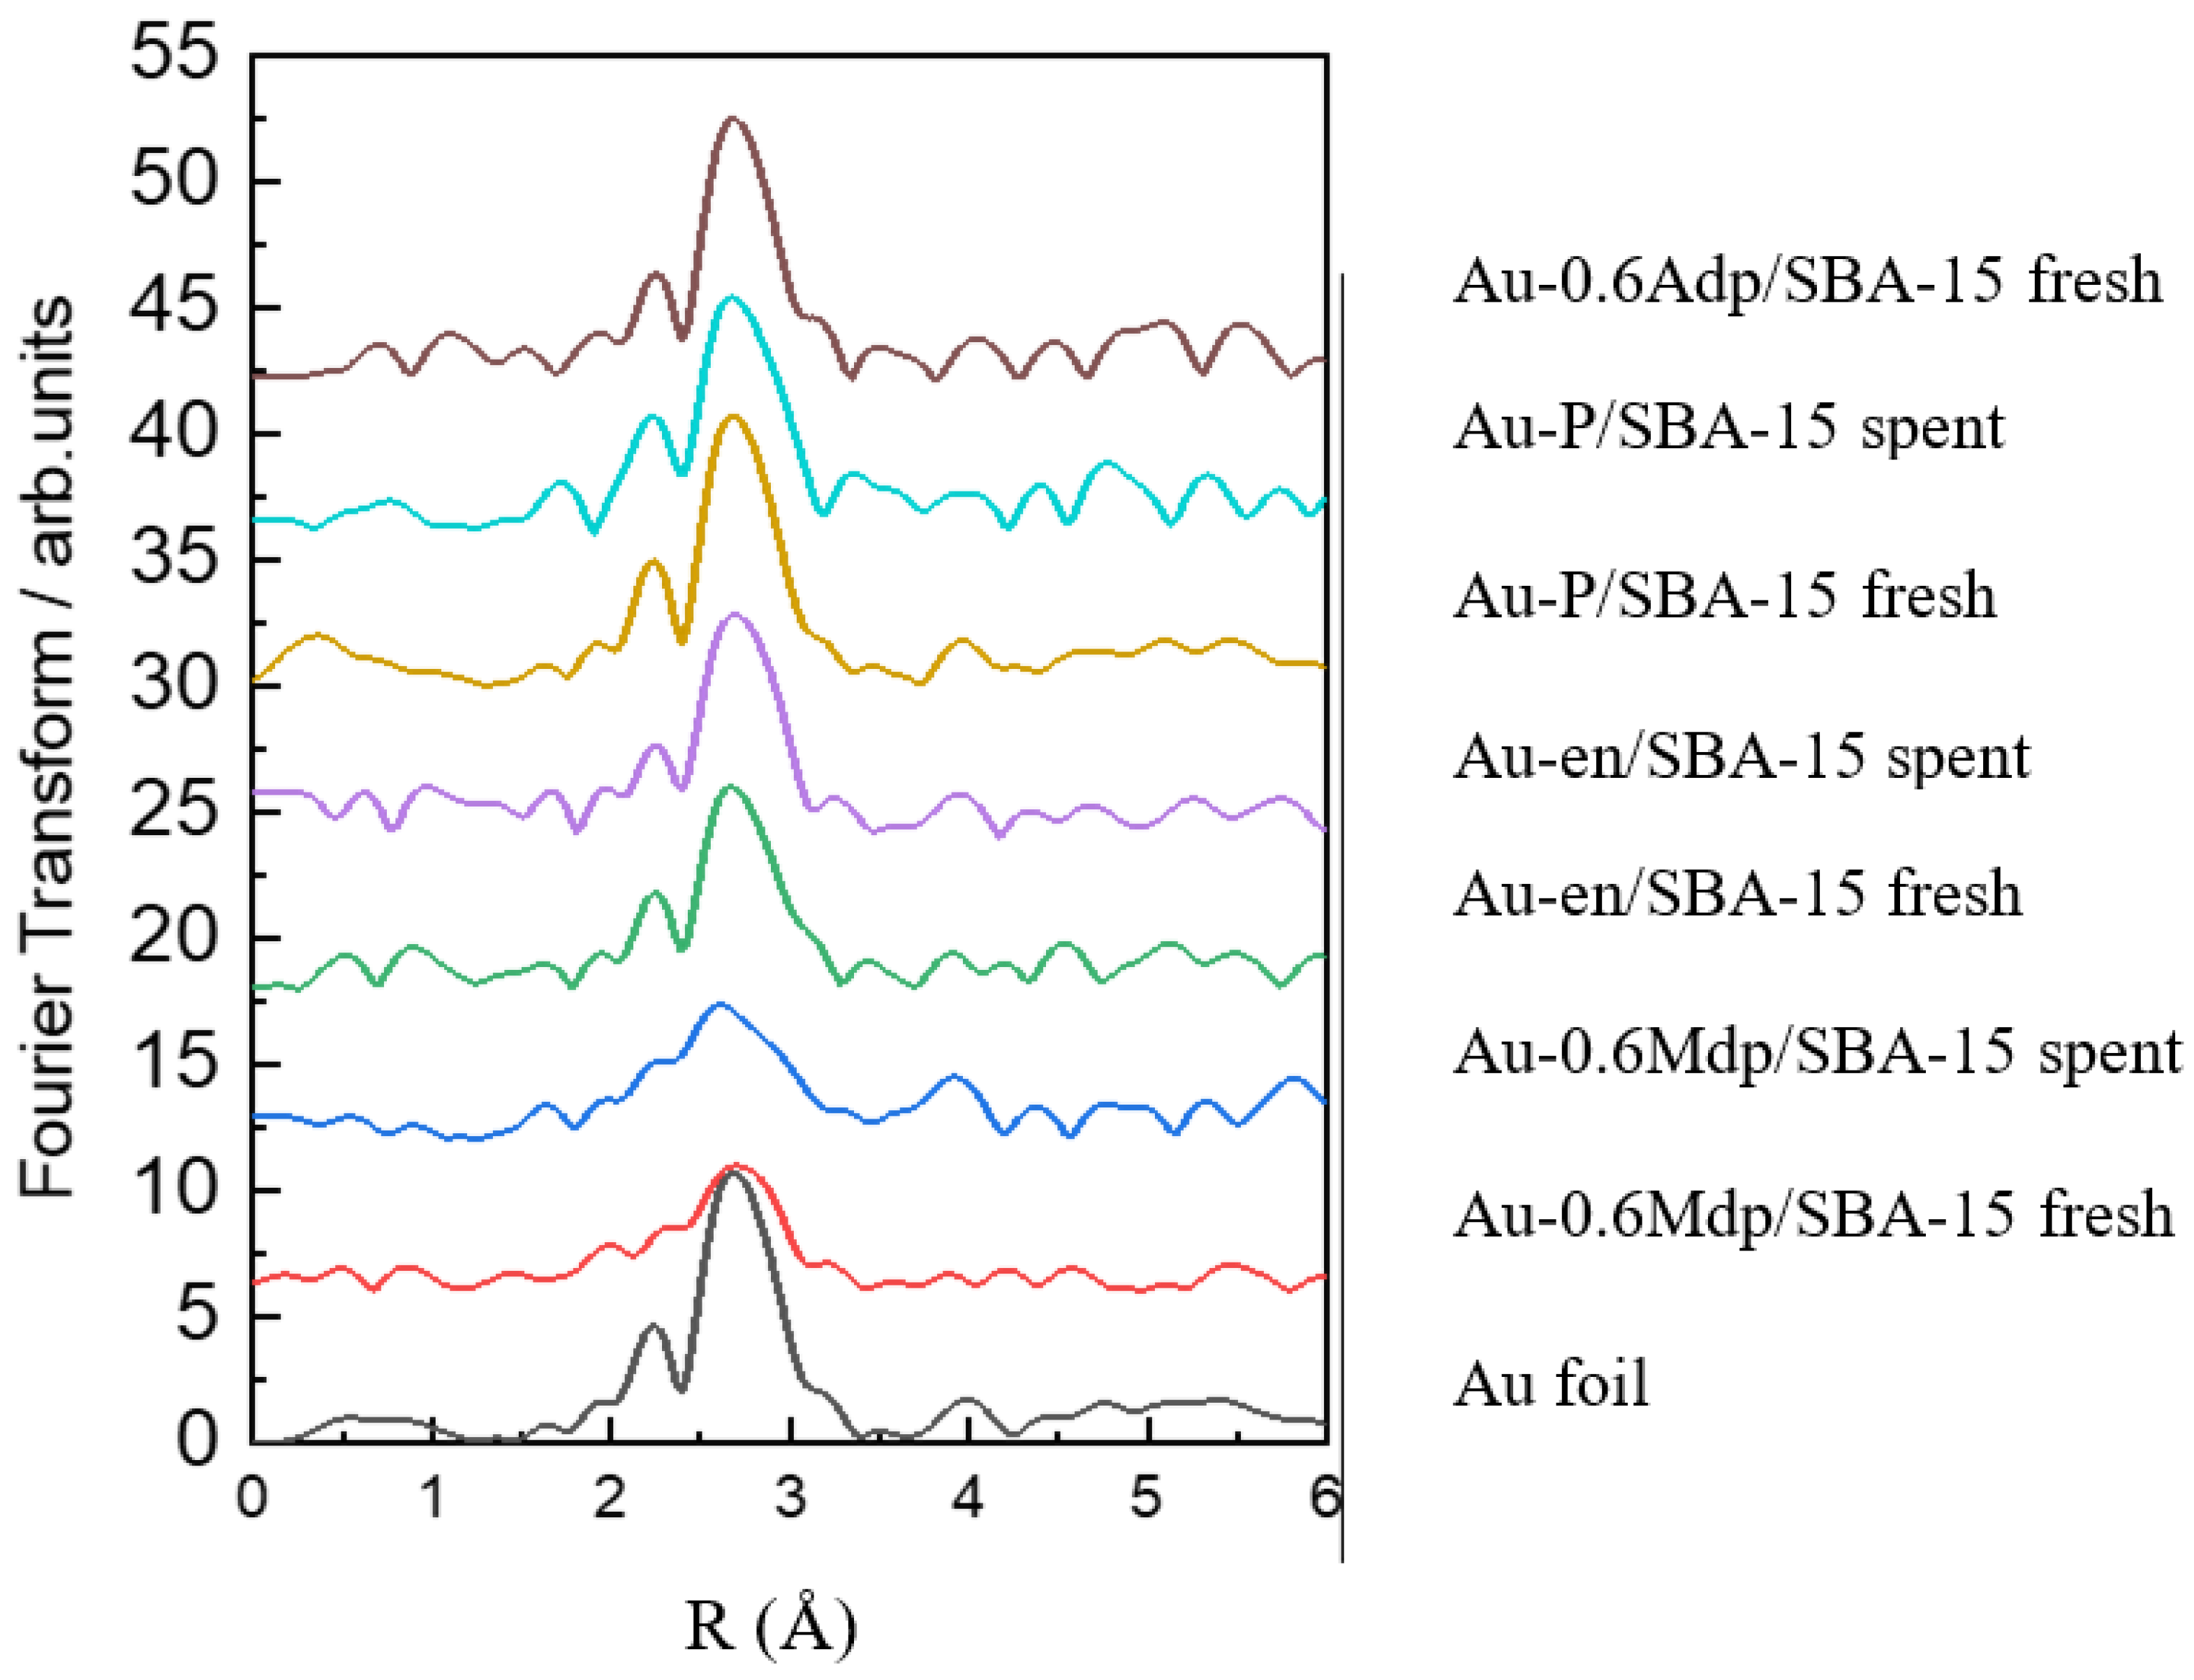
For all samples, the typical features for Au-Au peaks were observed between 2 and 4 Å (
Figure 5). However, the features are largely distorted for the Au-0.6Mdp/SBA-15 samples. This is mostly likely due to a stronger interaction with the support. During the preparation of the Au-0.6Mdp/SBA-15 sample, Au first interacted strongly with the -SH function on the SBA-15 inner wall, which regulated the migration of Au to reduce the aggregation. It was found that on the -SH modified oxide surfaces, Au was atomically dispersed, as sulphur atoms formed strong covalent bonds with Au to produce stable surface complexes. Consequently, the size of the Au particles was the smallest. The similar kind of retardation of Au aggregation was seen for the Au-en/SBA-15 sample where Au was attached to the oxygen atoms on the surface, -O-Si. However, the Au-O interaction was much weaker than the Au-S one. As a result, Au was able to migrate more easily and to aggregate to larger particles. One can conclude that the Au structure can be controlled by the surface modification method [
40,
41].
Moreover, there are slight changes in the Au-Au distance from sample to sample. The shortest R
Au-Au seems to be for the samples with the smallest particle size, i.e., the Au-0.6Mdp/SBA-15 ones. Our finding is in good agreement with the literature data. Miller et al. [
42] established a relationship between the gold particle size and the Au-Au bond length. The smaller the particle size, the shorter the Au-Au bond length. Theoretical calculations for small Au clusters sustain the shortening of the Au-Au distance with decreasing cluster size [
43].
In Figure 10 [
42], for a particle size of 19 Å (Au-0.6Mdp/SBA-15 fresh), the Au-Au bond length is 2.85 Å, whereas for a particle size of 60 Å (Au-en/SBA-15 fresh), the Au-Au bond length is about 2.87 Å, results that are in good agreement with the EXAFS fitting data (
Table 3).
The Au particle size for all samples was calculated using the correlation between the coordination number and the particle size, following the method described by [
44]. The average particle size calculated for the Au-0.6Mdp/SBA-15 fresh sample is in good agreement with the values determined from XRD and TEM measurements, i.e., 14 Å compared to 19 Å.
As expected, the dispersion increases with the decrease in particle size (
Table 2). For Au catalysts with dispersion lower than 50%, almost no changes in the bond length relative to Au foil occurred (
Table 2 and
Table 3). For the Au-0.6Mdp/SBA-15 fresh sample, for which the calculated dispersion was higher than 50%, i.e., 53%, the maximum contraction of the Au bond distance was significantly larger, e.g., about 0.03 Å.
Data analysis through fitting in
k-space, with fixed E
0 and Au foil as references, generated the following results (
Table 3).
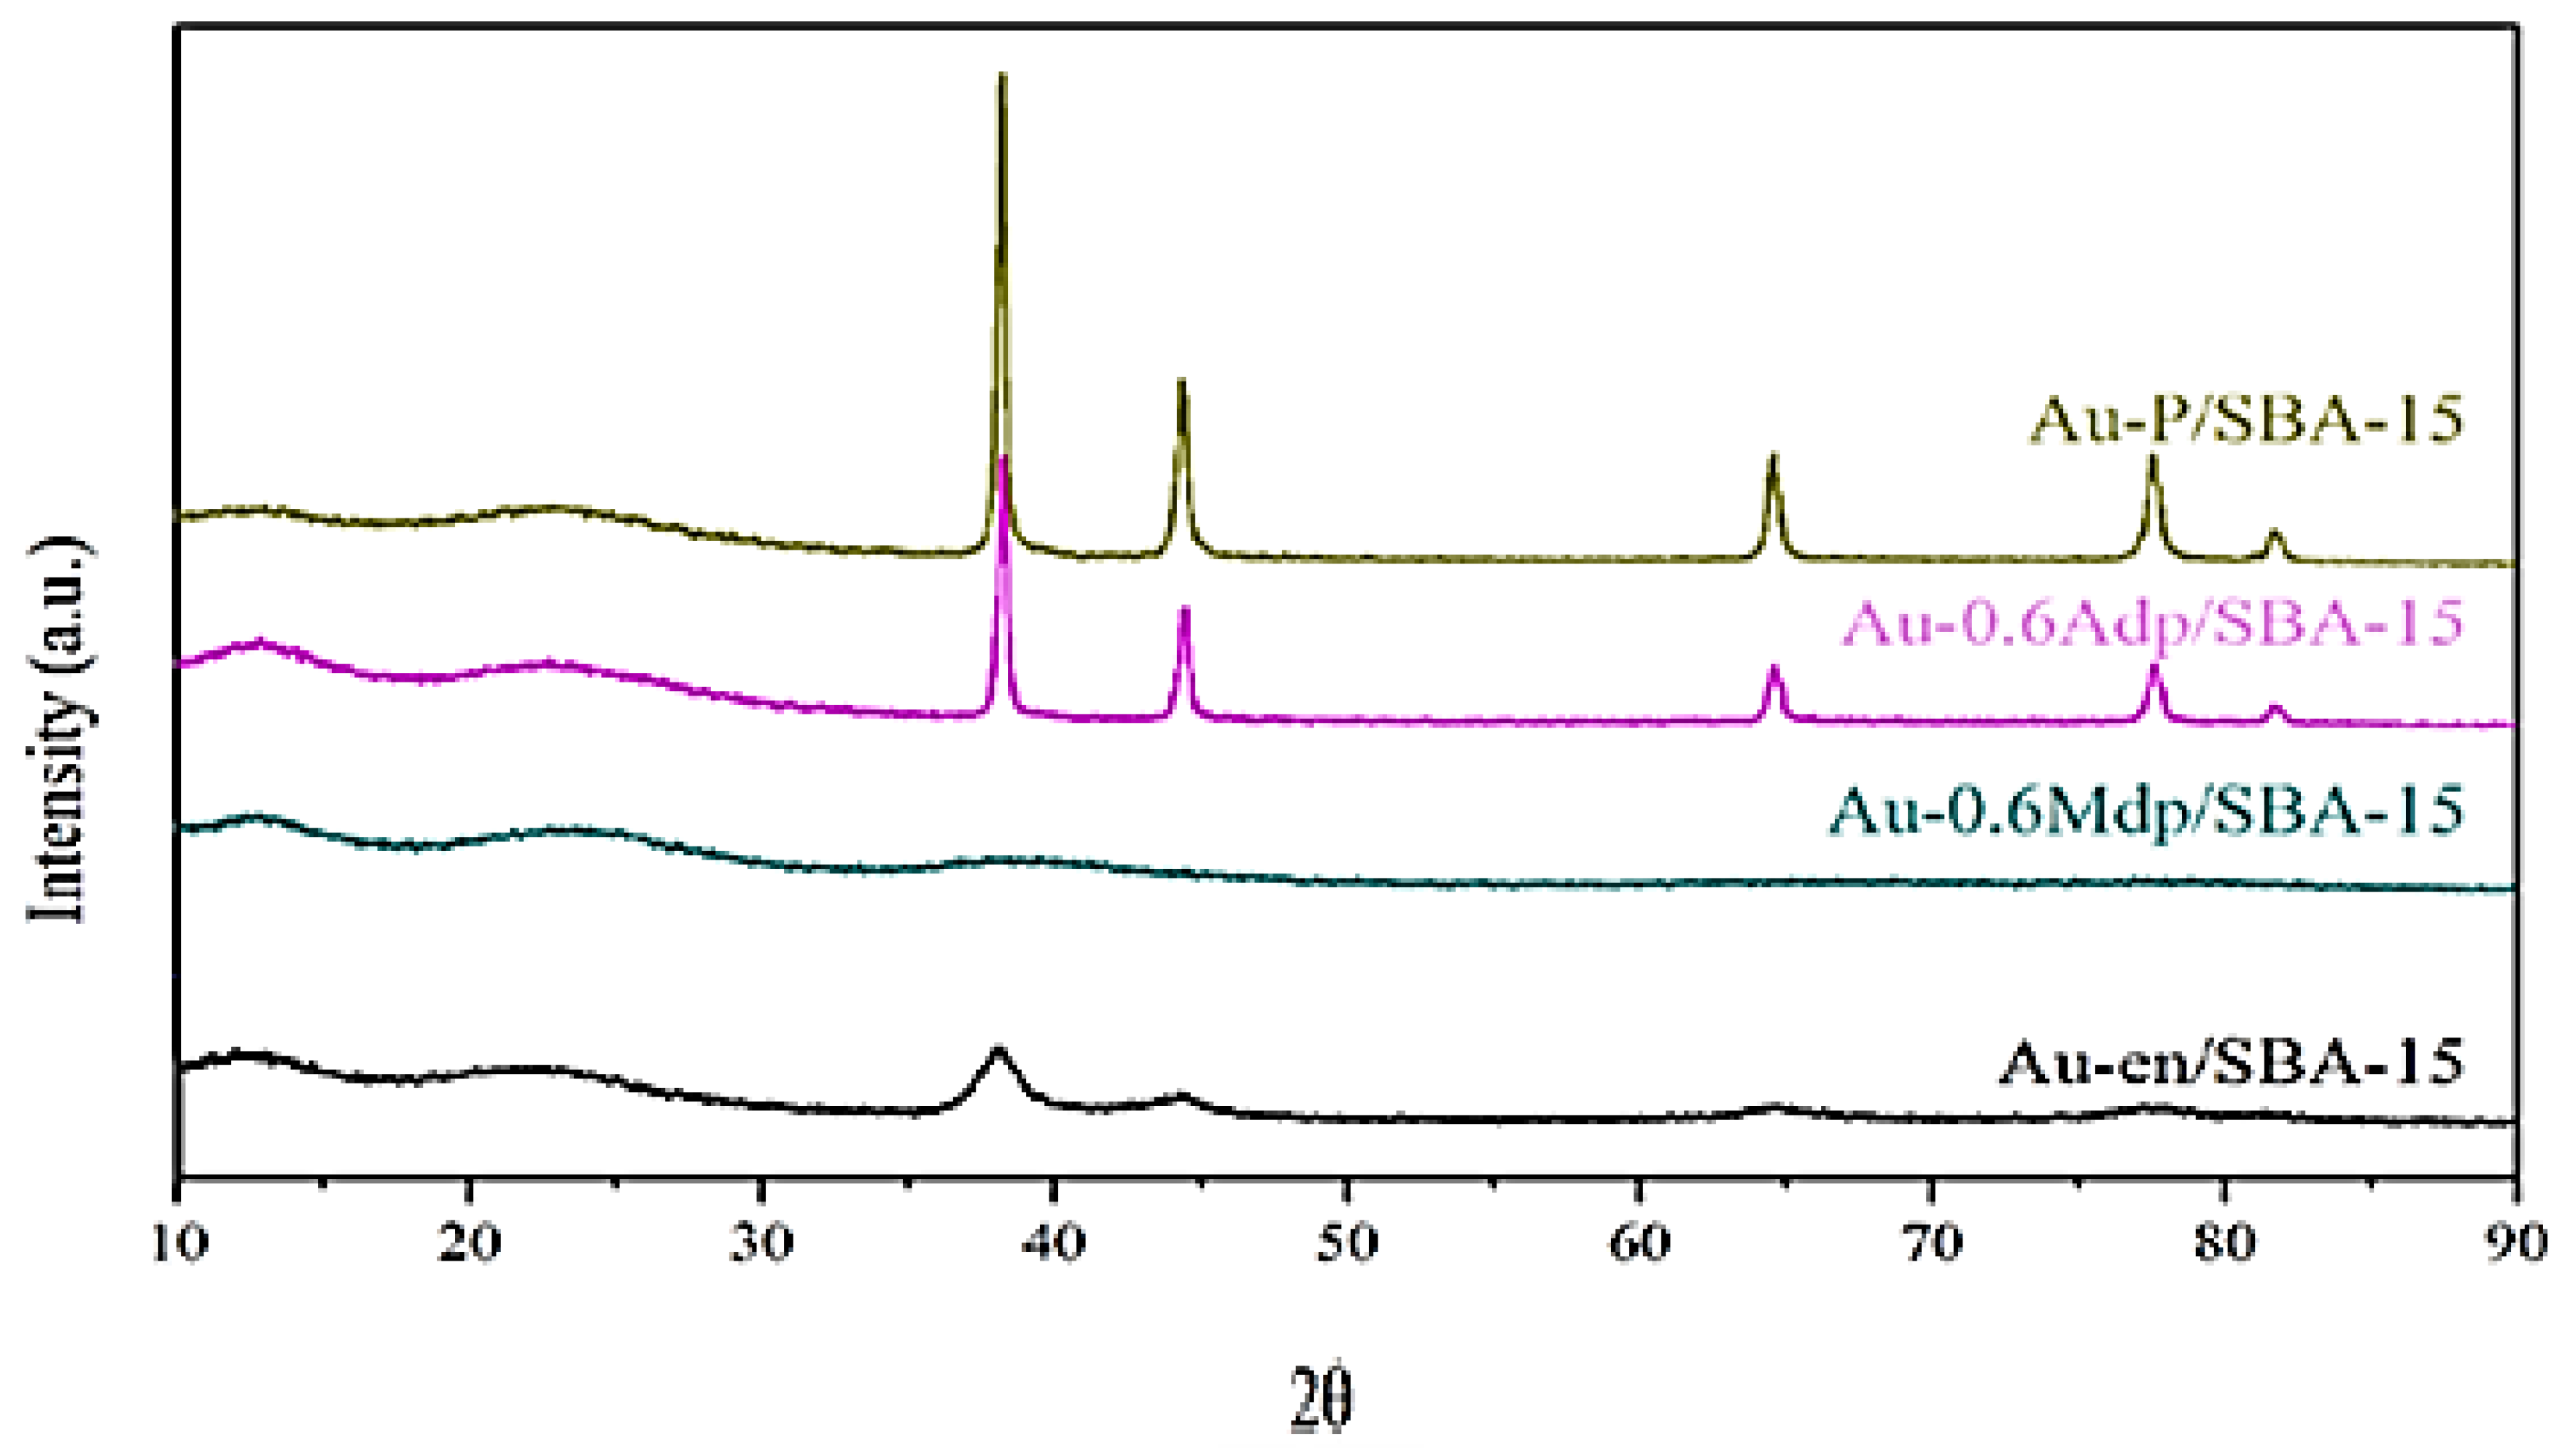
The wide-angle XRD patterns of the four fresh catalysts are shown in
Figure 6. The catalysts exhibit four diffraction peaks at 2
θ~38.2°, 44.3°, 64.5°, and 77.5°, which are indexed to Au (111), Au (200), Au (220), and Au (311) reflections, respectively, for the face-centred cubic (FCC) lattice structure of Au (JCPDS file number: 04-0784). The Au-0.6Mdp/SBA-15 catalyst shows only a small broad peak at 38.2°, an indication that the gold nanoparticles are very small. For the other three samples, the peaks are sharp and intense, indicating good crystallinity of metallic Au. The crystallite size for all samples was calculated from Scherrer’s equation and is reported in
Table 2. As expected, there are no significant differences between the gold particles’ size measured by TEM and XRD.
For TAP experiments, only the Au-0.6Mdp/SBA-15 catalyst sample was chosen.
TAP measurements were employed to study the reducibility of the sample, the adsorption of active species, i.e., acetone and oxygen, the catalytic activity, if any, the lifetime of adsorbed intermediates, and to propose the reaction mechanism.
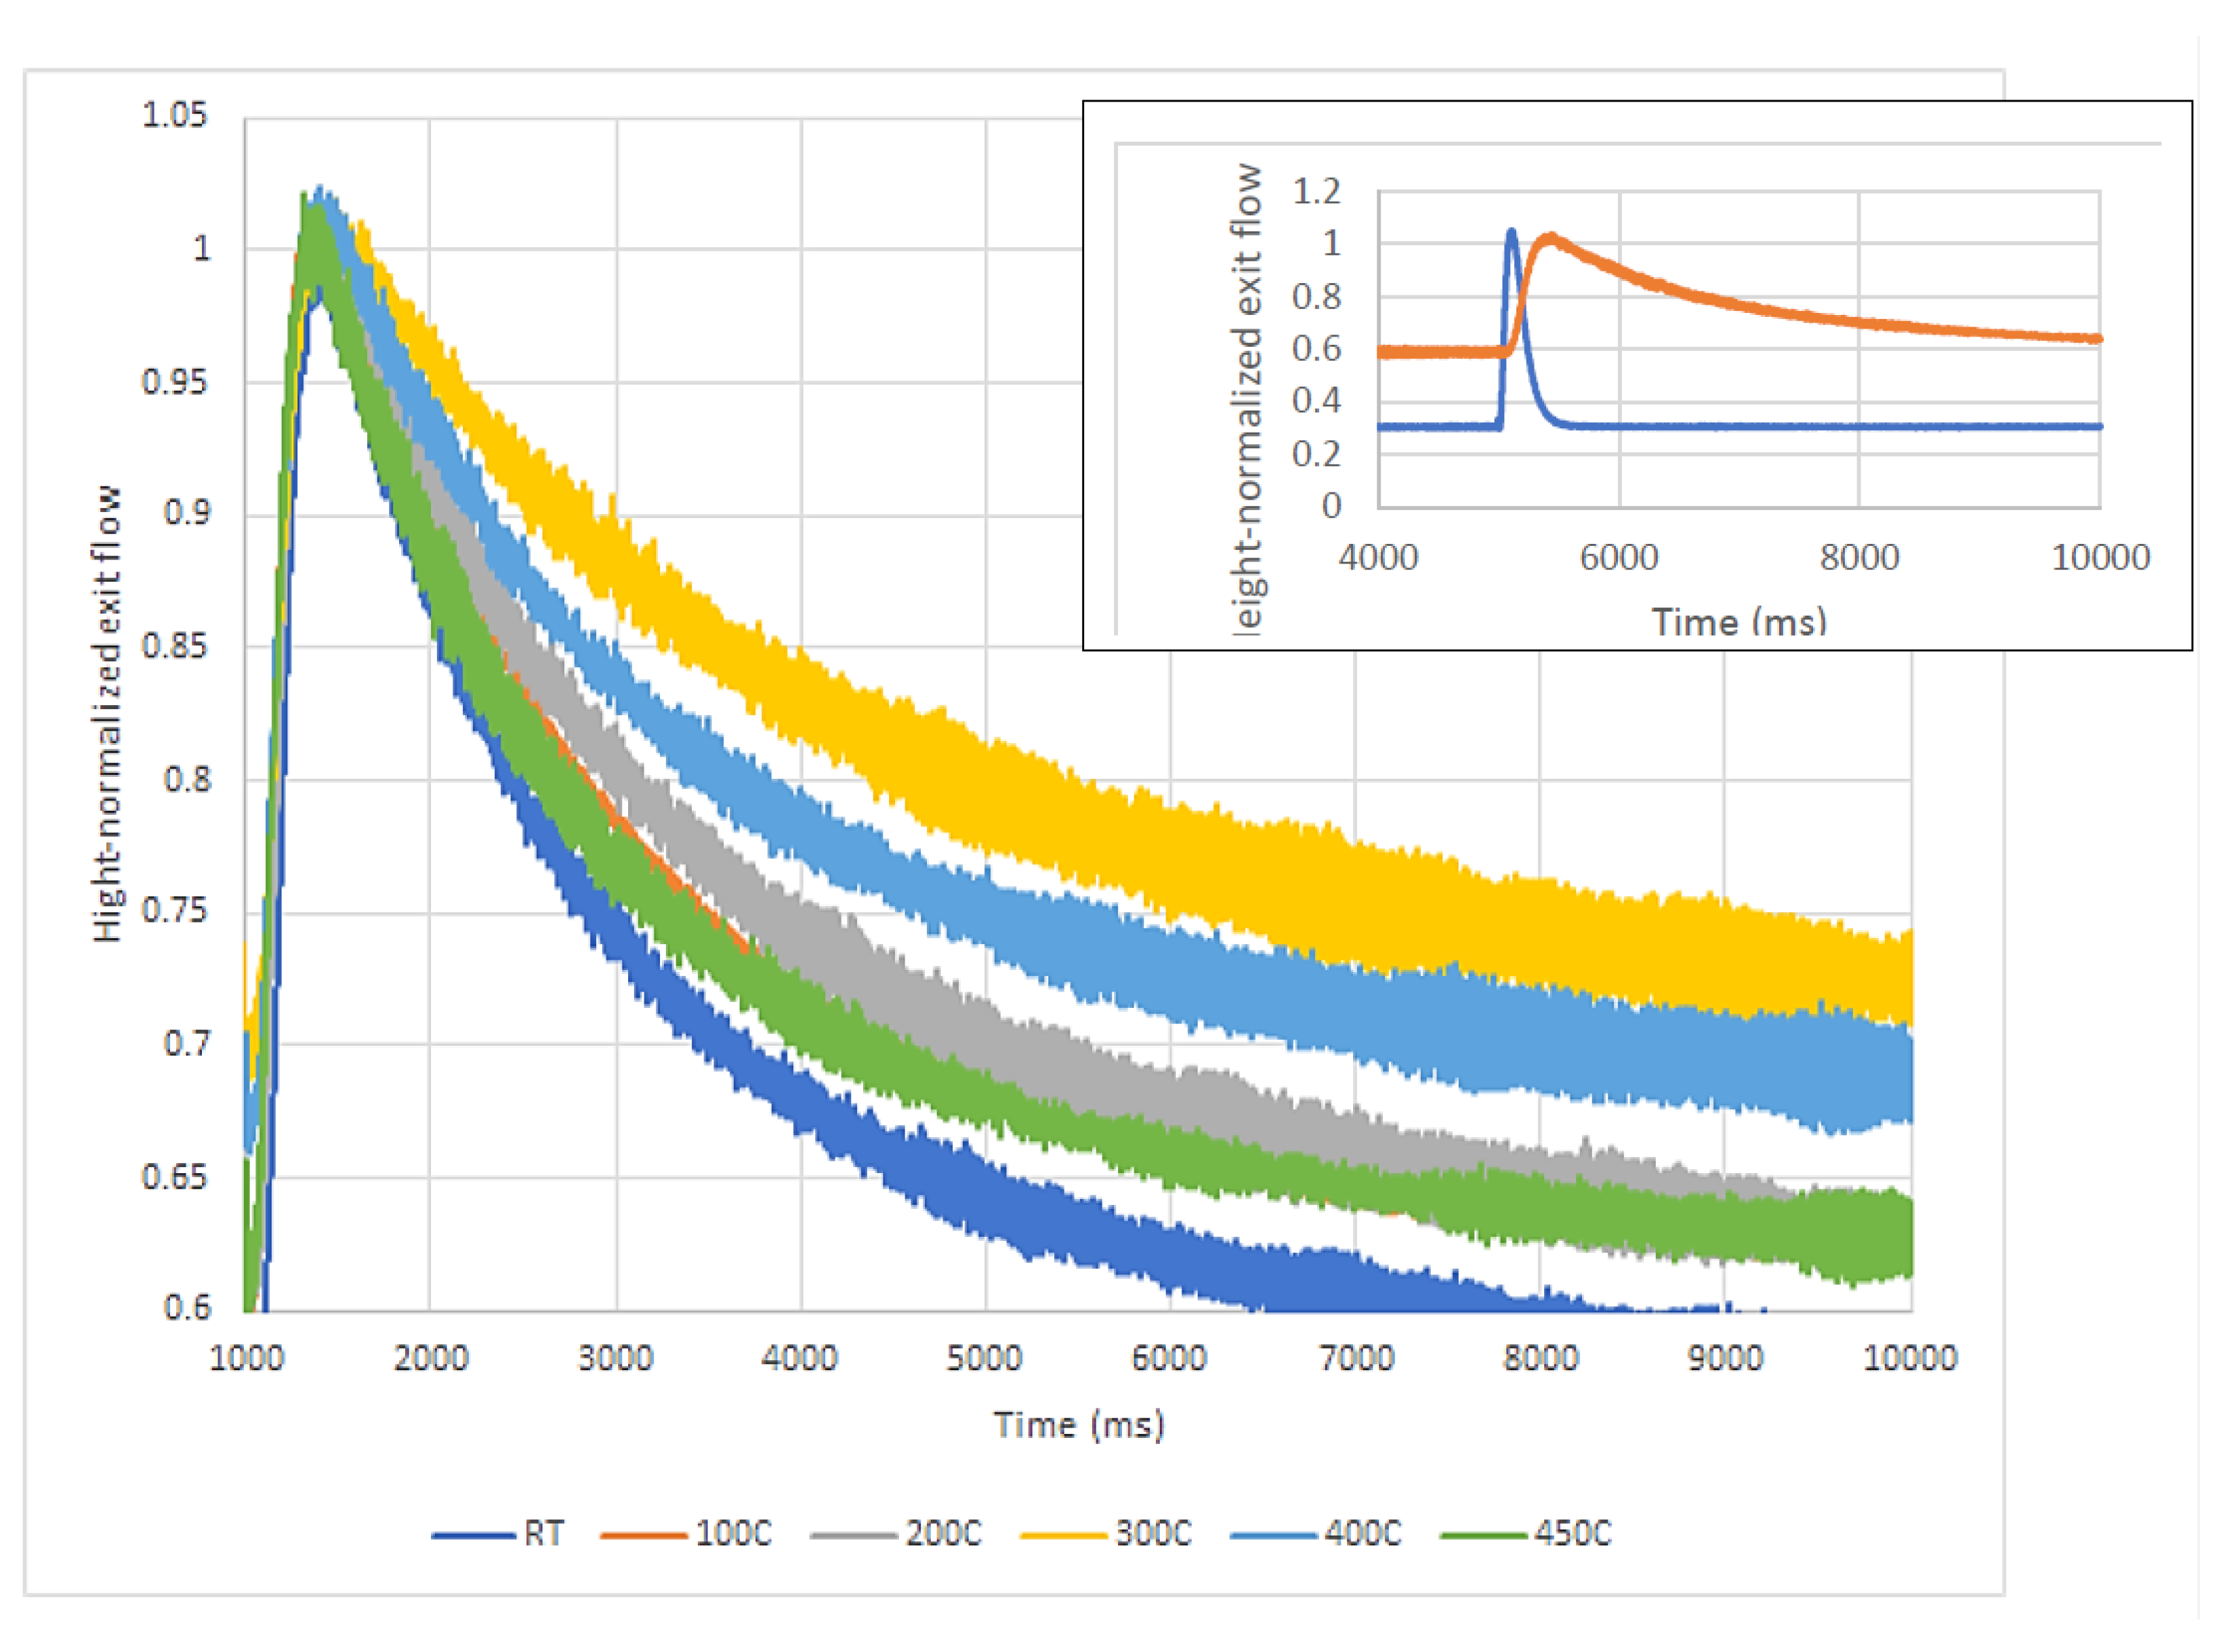
Firstly, the reducibility of the gold species was qualitatively assessed after sending several pulses of H
2 over the catalyst at RT, 100, 200, 300, 400, and 450 °C. As seen in
Figure 7, there is some interaction between the hydrogen and the catalyst, and it was slightly different from temperature to temperature. Conclusive evidence that there is indeed a H
2–catalyst interaction is obtained by comparing the H
2 response when pulsed in an empty microreactor with that of H
2 response over the catalyst (see
Figure 7-Inset). If oxidized gold species were present and chemical adsorption leading to the reduction of these gold species occurred, then the H
2 response curves would be broader as the temperature of measurements was increased (activated adsorption). The higher the temperature, the stronger the interaction and the broader the response curve. However, as the response curves does not broaden after 300 °C, one can conclude that weak (physical) adsorption mainly occurred. As no chemisorption leading to the reduction of the gold species occurred validates the TPR and XRD findings that the active site is metallic gold (Au
0). As observed in
Figure 2, there is a slight H
2 consumption over the Au-0.6Mdp/SBA-15 sample, increasing as the temperature is increased from RT to 300 °C, most probably due to physical adsorption on the catalyst’s pores, but levelling up as temperature is increased from 300 to 450 °C. No H
2 consumption at temperatures higher than 300 °C means there was no chemical or activated adsorption, therefore there was no reduction of the catalyst.
Along with the H
2 interaction with the catalyst, the acetone interaction was studied as well, from acetone response to acetone/Ar single-pulse experiments at RT, 100, 200, 300, 400, and 450 °C. The acetone in the Ar mixture was obtained by flowing pure Ar over a small cylinder containing acetone at RT and the composition was determined from the responses of acetone and Ar at RT in an empty tube, as there was 10% acetone in Ar.
Figure 8 shows all acetone responses. At RT and 100 °C, the acetone responses are very broad; there is almost no acetone leaving the microreactor. The acetone responses become narrower, and the peak appears earlier as the measurement temperature increased.
The quantitative analysis of the H
2 and acetone responses was performed using the moment-based approach [
45]. One of the main features of the TAP curves, the mean residence time,
tres, was calculated as the ratio between the first and zero-th moment (area under the curve).
Table 4 presents the calculated values of
tres at measurement temperatures.
The quantitative results confirm the qualitative ones regarding the interaction between the active gases and the catalyst; the longer the residence time, the stronger the interaction of the gases with the catalyst. For hydrogen, the residence time increases as temperature is increased up to 300 °C, and then decreases as temperature is increased further. This pattern can be explained again by weak hydrogen-catalyst interactions, through physical adsorption mainly and some possible surface OH- reduction.
For acetone, the time spent in the TAP reactor increases as the temperature is increased up to 100 °C, and then decreases as the temperature is increased step-by-step up to 450 °C. One can conclude that there is some adsorption of acetone on the catalyst at low temperatures, which is most probably due to the weak, physical adsorption. As the pulse size was extremely narrow, i.e., around 1 × 10
15 molecules/pulse, the gas transport inside the microreactor is assured by Knudsen diffusion [
46]. In this situation, the ratio between the residence time of acetone and the residence time of Ar is inversely proportional to the ratio between their respective diffusion coefficients, which is directly proportional to the square root of their respective molecular mass ratio [
47,
48].
If only Knudsen diffusion occurs, then the = 1.2.
However, as seen in
Table 1, for low temperatures, RT and 100 °C, the above ratio is much higher than 1.2, which means that acetone spends more time in the microreactor because of weak (most probably physical) adsorption. For higher temperatures, this ratio approaches the one calculated based on Knudsen diffusion only, which supports the assumption that acetone is not strongly adsorbed on the surface.
Following the same reasoning, if only Knudsen diffusion occurs when hydrogen is passed over the catalyst, then the ratio between the hydrogen residence time and argon residence time should be 0.22. However, at RT, the ratio is much higher, whereas at higher temperatures than RT, the ratio stays almost constant, which corroborates the TPR results, which showed some hydrogen “consumption” from RT to 100 °C, which is most probably due to physical adsorption.
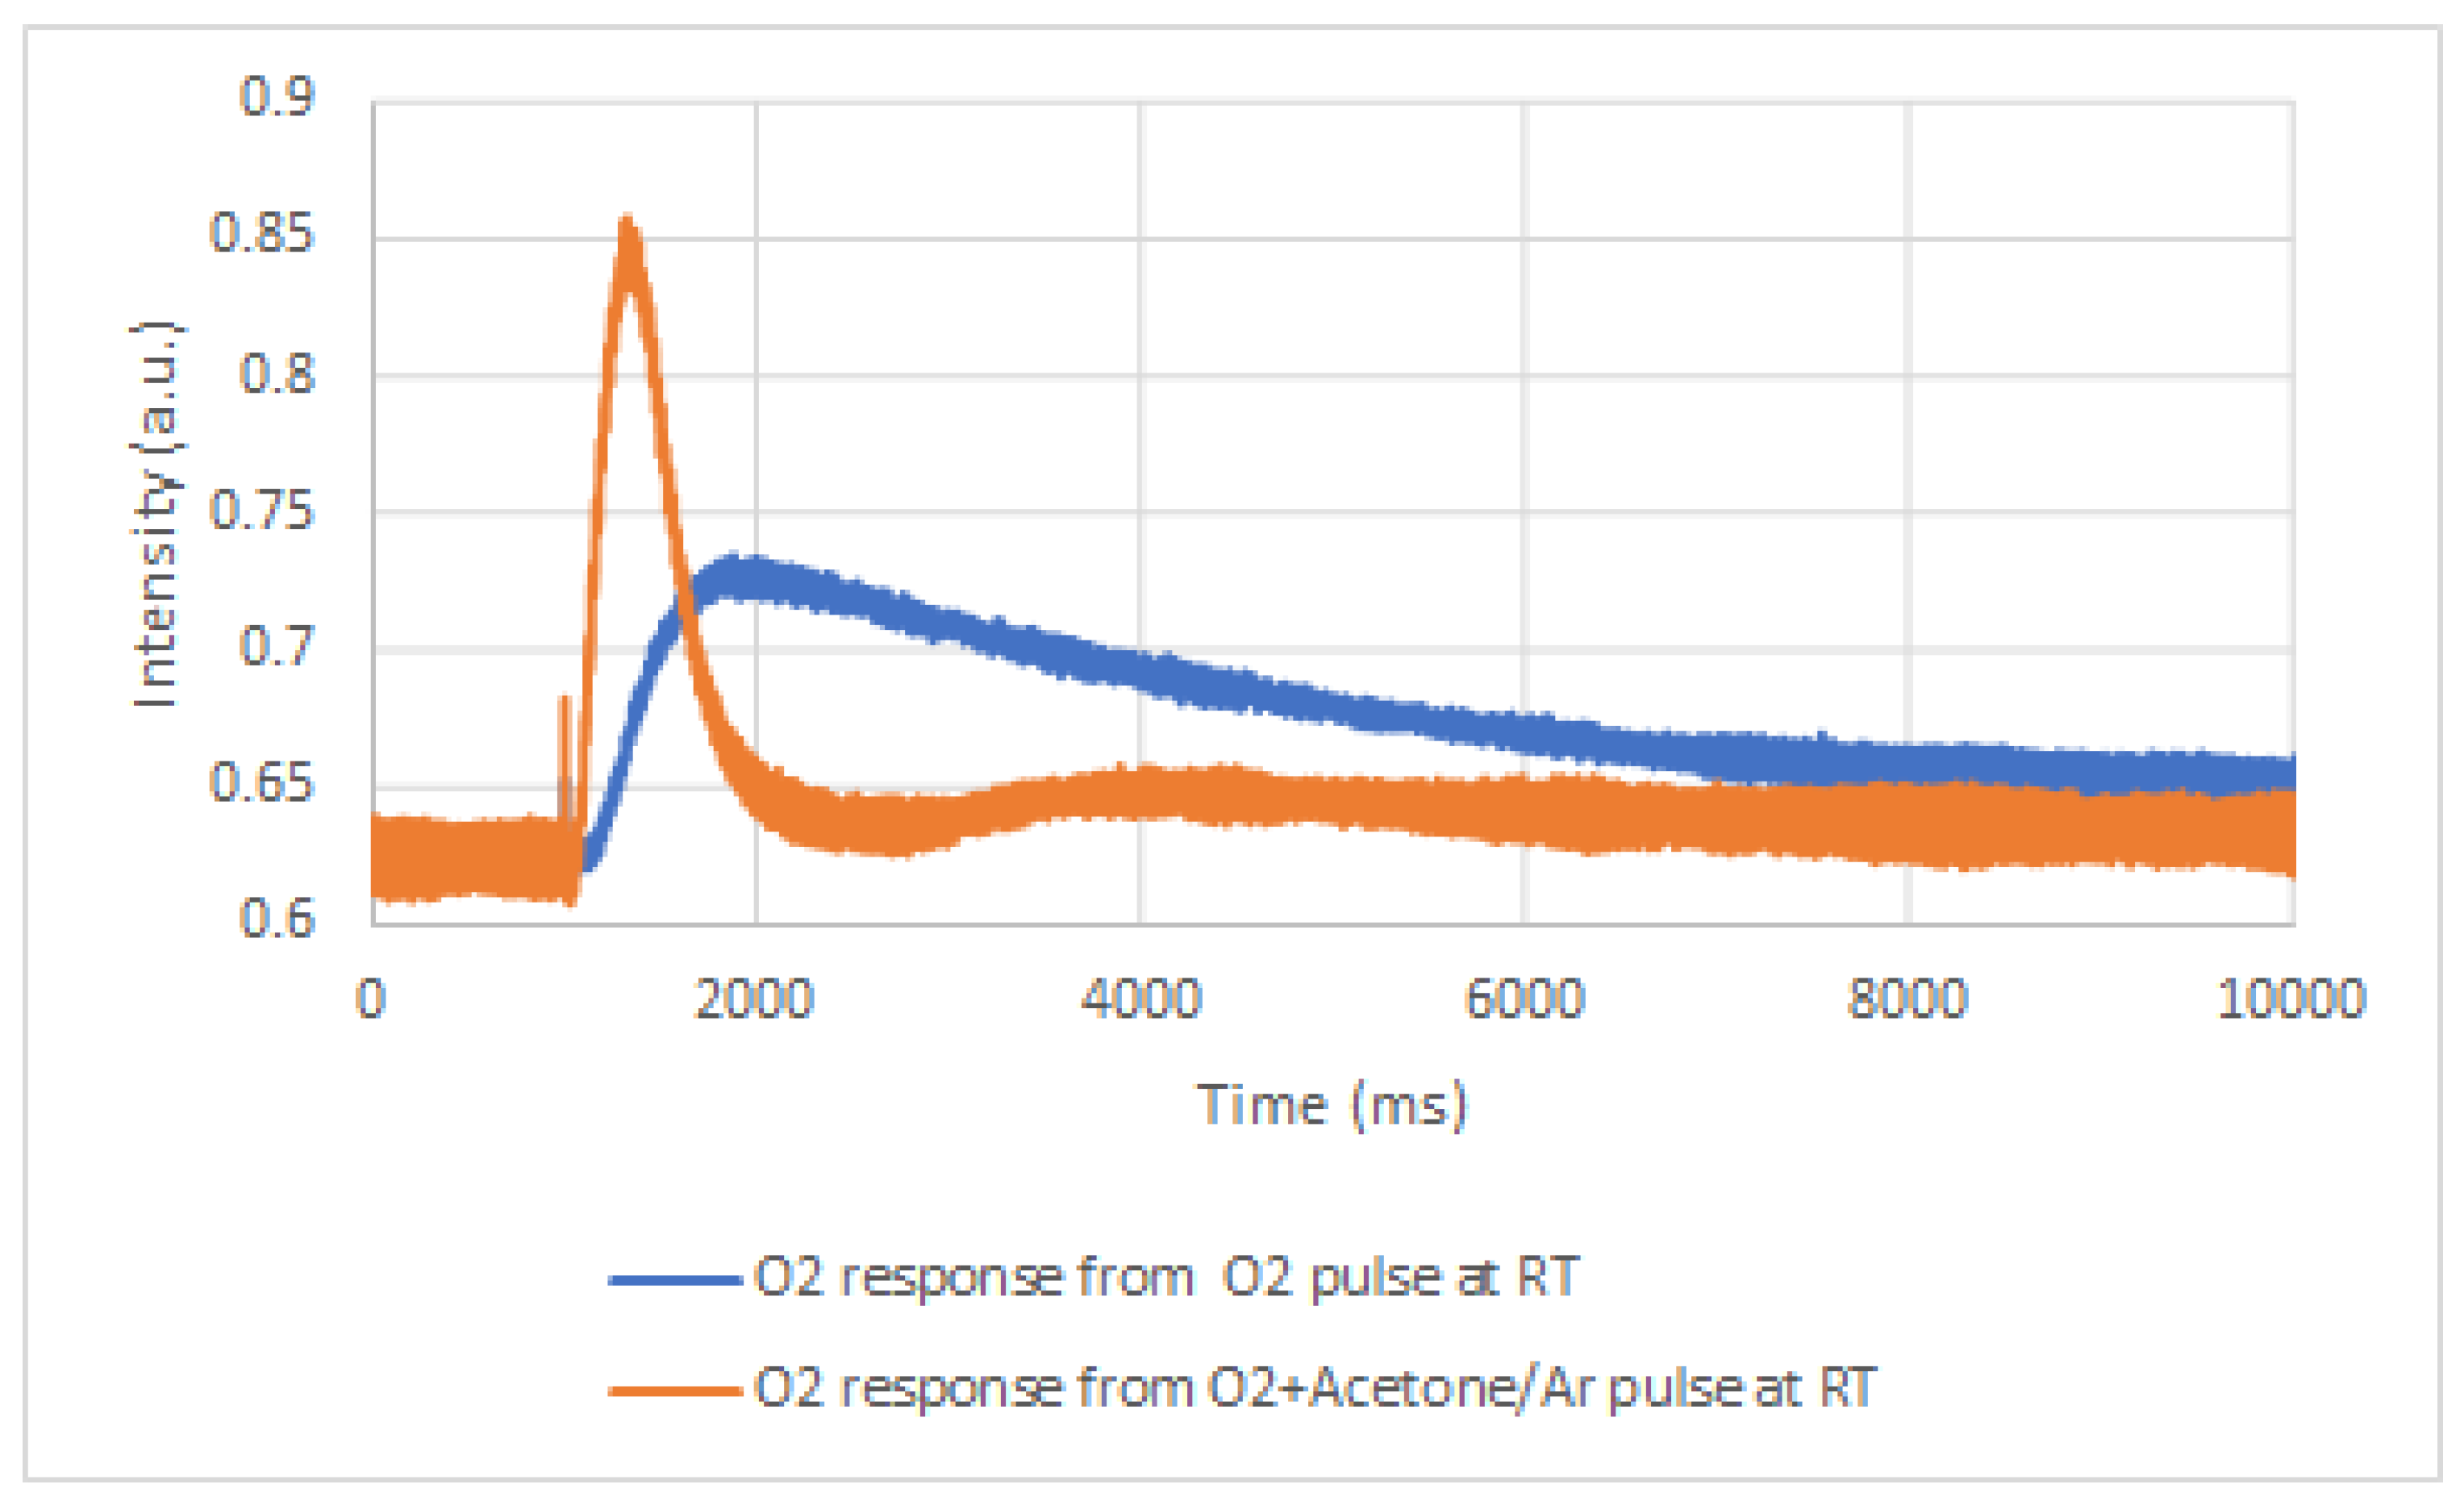
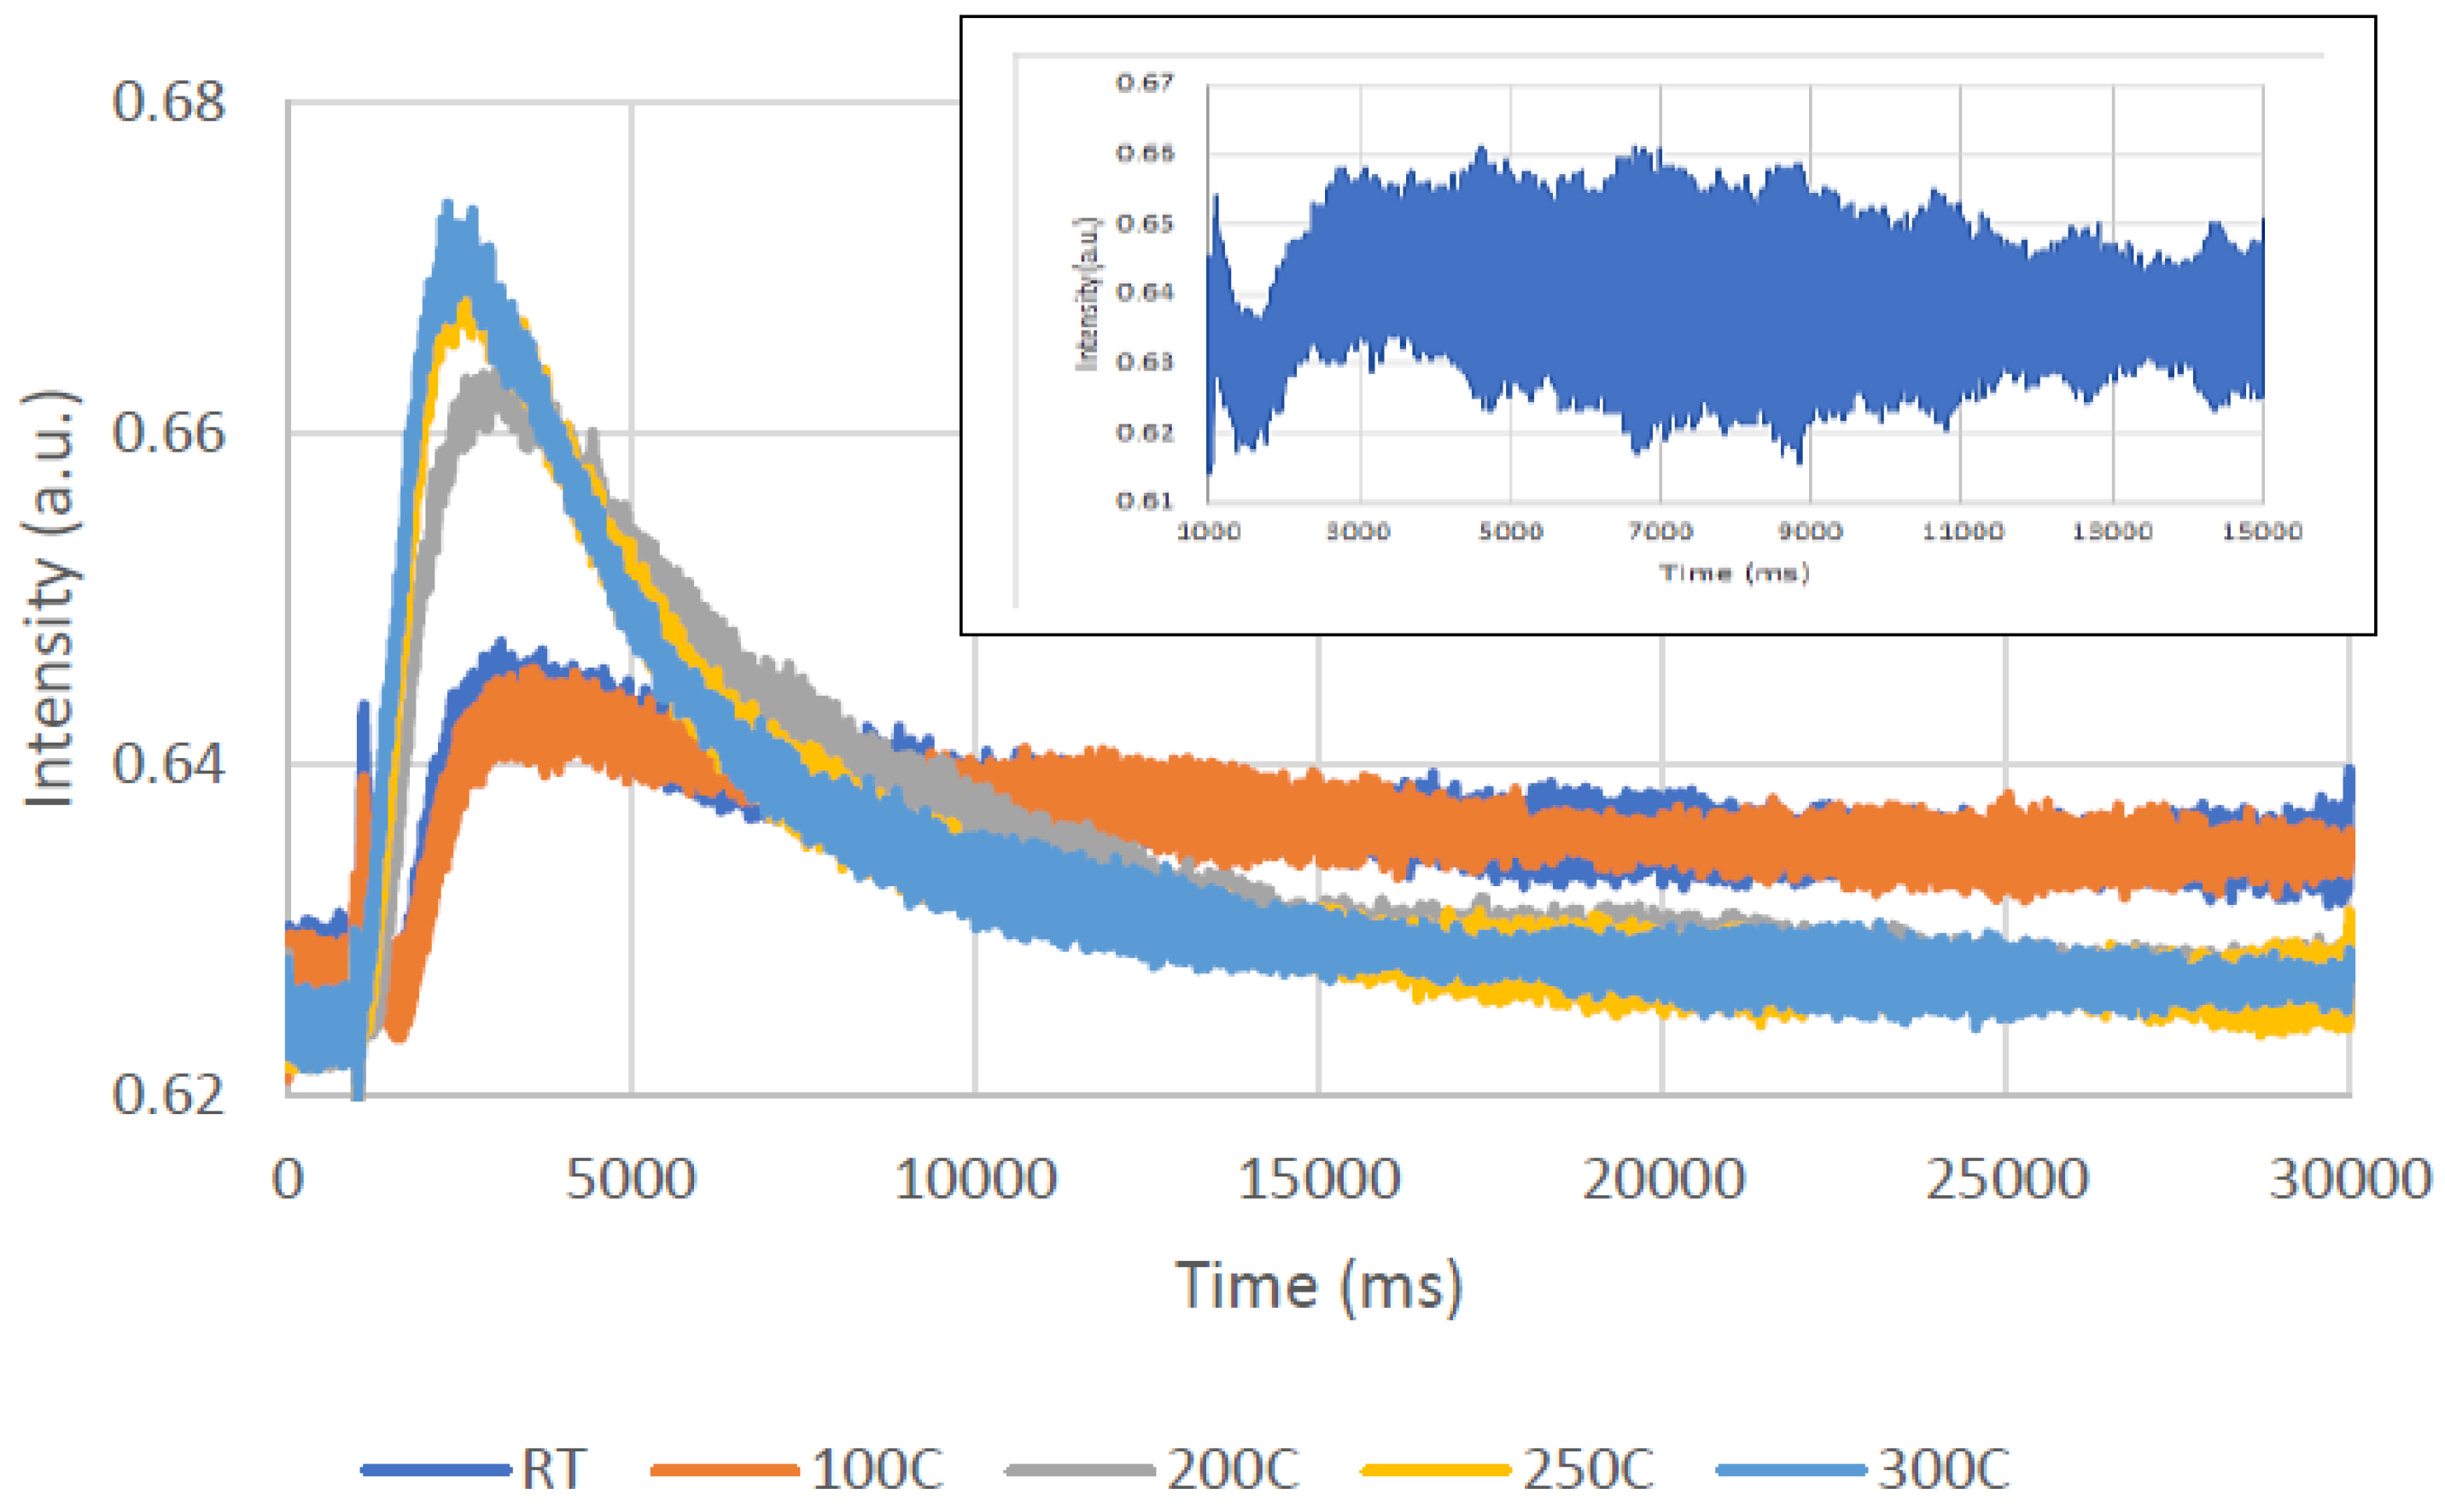
To study the catalytic activity of the Au-0.6Mdp/SBA-15 sample, single-pulse experiments with oxygen:acetone/Ar mixtures were performed at RT, 100, 200, 250, and 300 °C. The responses of O2 and acetone were recorded, both from their respective pulses, to assess their adsorption behaviours, and from their mixture pulses as well, to assess changes, if any, in their behaviour, or changes related to their interactions with catalyst or between them. The CO2 response was also recorded from the mixture pulse.
As seen in
Figure 9, there is a significant difference in the O
2 adsorption’s features at RT when it is pulsed alone or in mixture with acetone. The result supports the assumption that there is a competitive adsorption occurring when oxygen and acetone are pulsed together, as the oxygen response in the acetone presence is much narrower than in the absence of it. The adsorption could occur on both the support and Au nanoparticles. However, as SBA-15 mesoporous silica belongs to the inert, so-called inactive supports, the adsorption of oxygen on the support’s surface is excluded. Therefore, Au nanoparticles can be assessed as the active sites for oxygen and acetone adsorption and reaction.
The quantitative data supports the competitive adsorption of oxygen and acetone as well. Oxygen spends more time in the microreactor (longer adsorbed) when it was pulsed alone than when it was pulsed together with acetone, i.e., 6538 ms compared to 5116 ms.
Differences similar to those observed at RT were revealed at the other temperatures as well.
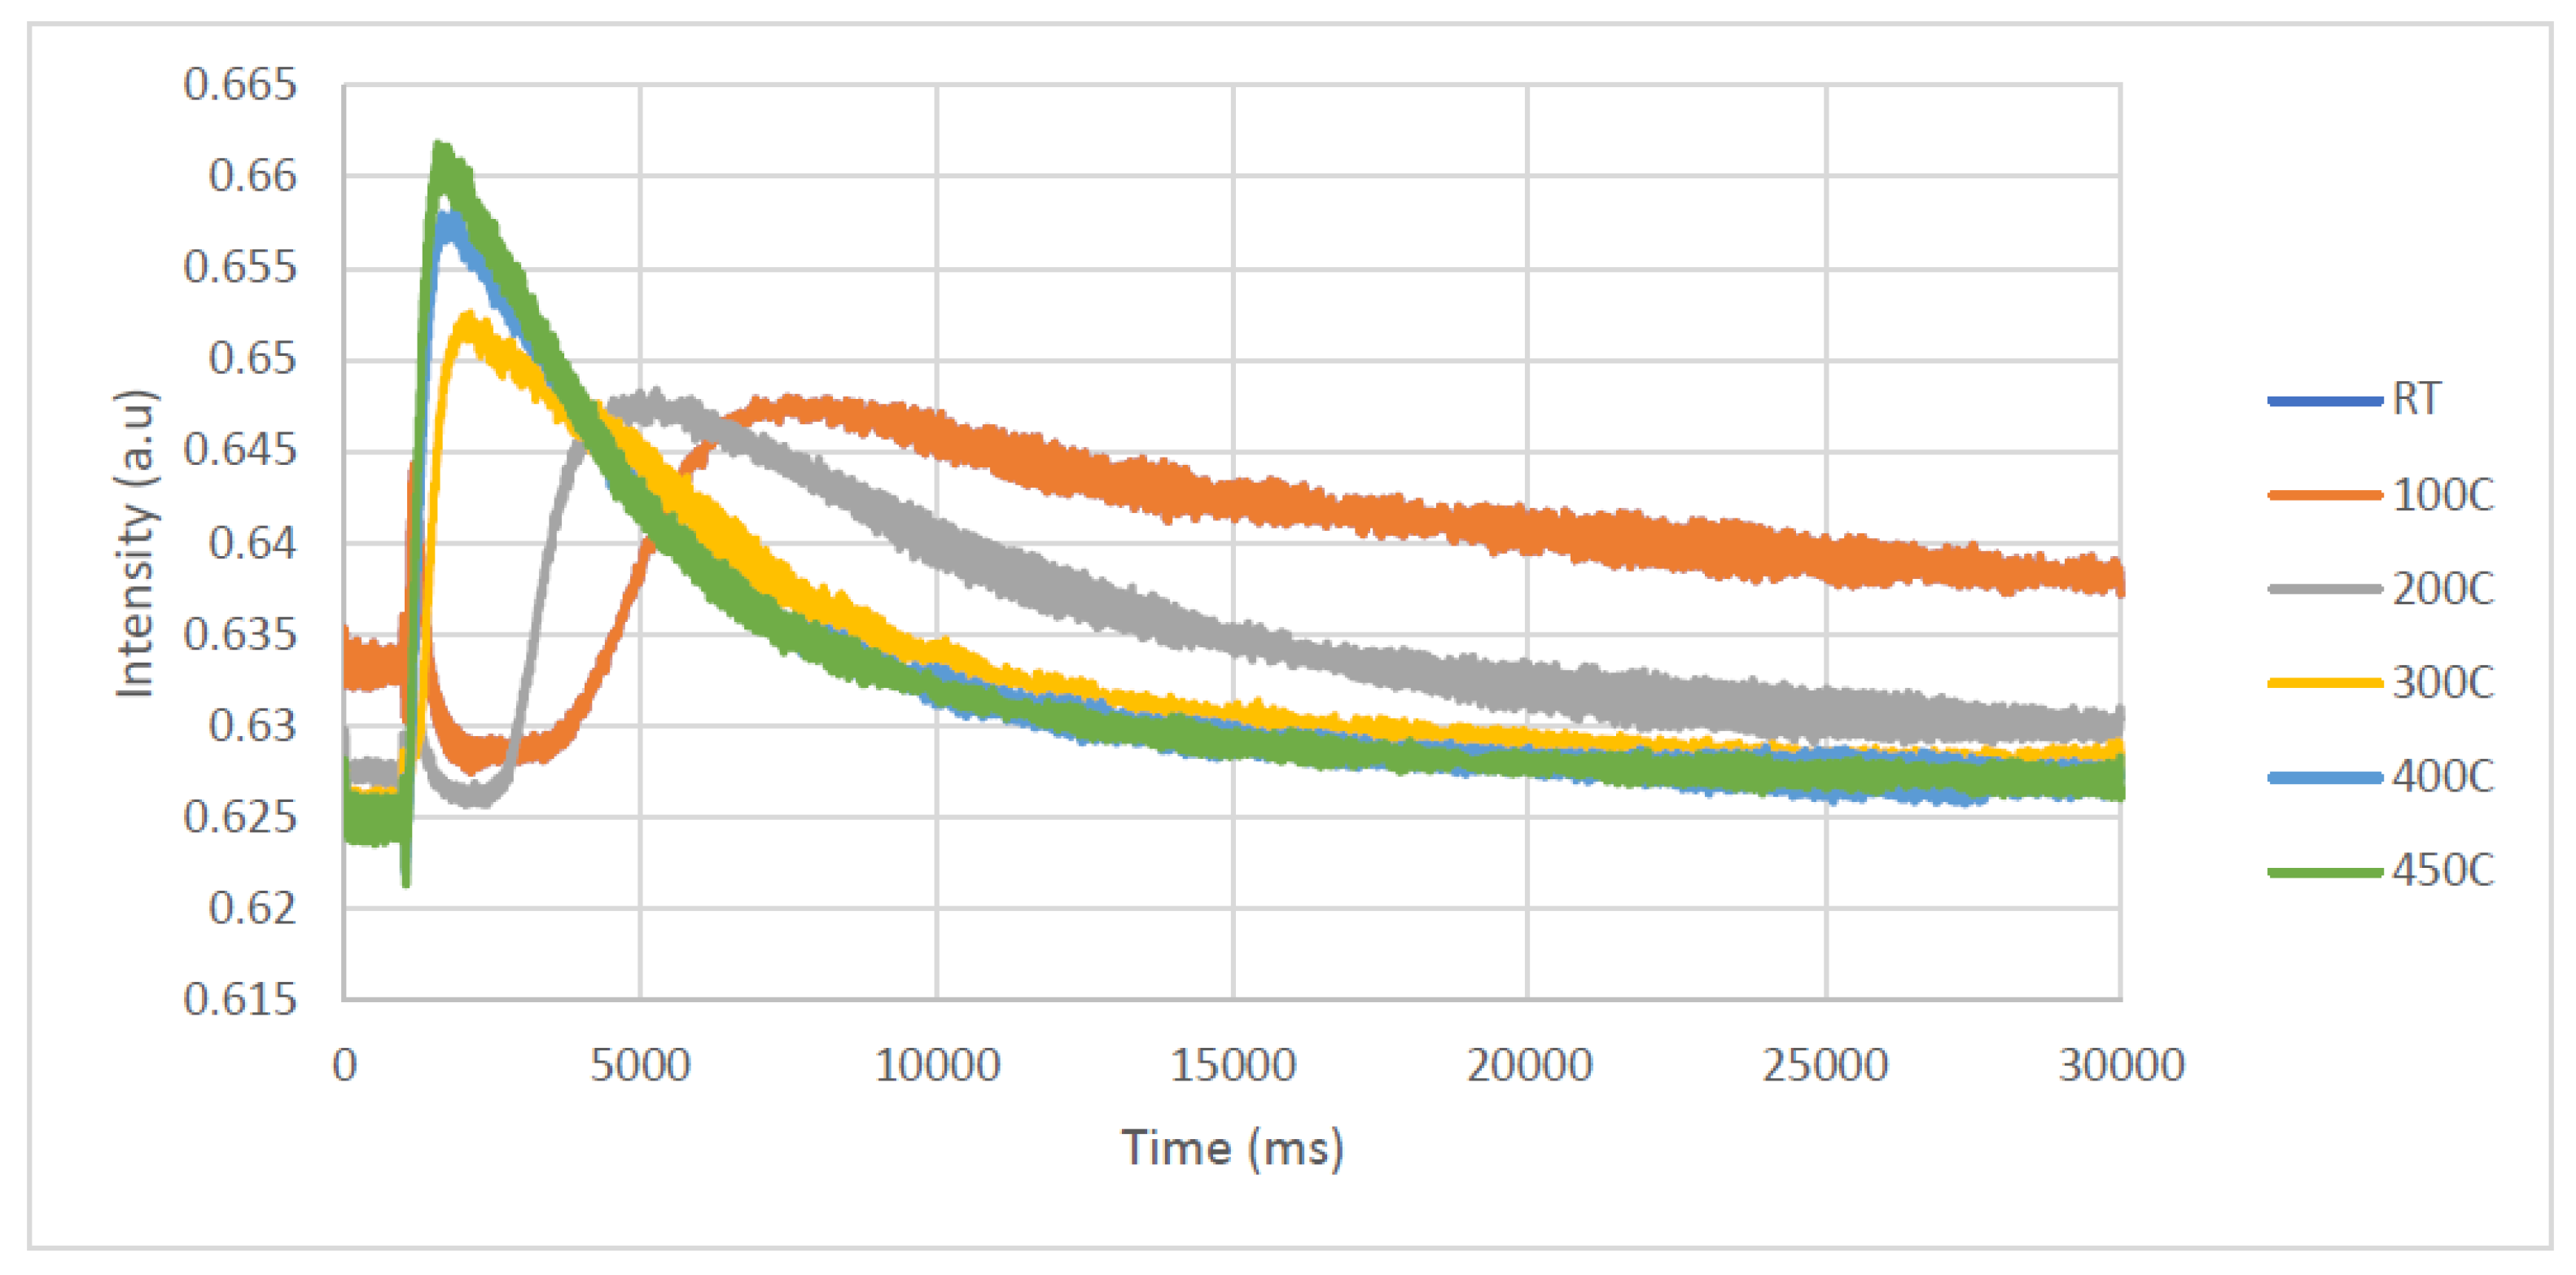
Figure 10a,b present the oxygen response as function of temperature, with A in the absence and B in the presence of acetone.
The small peak, around 4000 ms, shown on the oxygen response to oxygen:acetone/Ar mixture, at all temperatures, could be, most probably, attributed to a small amount of oxygen that was still adsorbed on the gold nanoparticles, despite the presence of acetone.
As shown in
Figure 10a, there are not significant changes in the oxygen’s response as a function of temperature. This behaviour prompts the conclusion that oxygen adsorption is not an activated one.
A careful examination of
Figure 10b reveals that the peak slightly shifts to higher times as the temperature increases. Therefore, one can assume that the interaction of oxygen with the catalyst on which acetone was adsorbed (as concluded from
Figure 9) becomes stronger, most likely because of the oxidation reaction.
Figure 11 presents the acetone response to oxygen: 10% acetone/Ar mixture pulse as a function of temperature.
As expected, there is almost no acetone leaving the TAP reactor at RT, as acetone is physically adsorbed on the catalyst.
Undoubtedly clear evidence of the occurrence of the oxidation reaction could have been obtained by following the CO
2 response on the oxygen:acetone/Ar pulses, as a function of temperature. However, the CO
2 response was very noisy, even at 300 °C (not shown). The explanation for this is, on the one hand, that because of the low amount of acetone in the acetone/Ar pulse, only small amounts of CO
2 were produced, and, on the other hand, it is possible that the CO
2 formed was strongly adsorbed on the catalyst. Yang et al. [
49] found that the BET surface area and the microporosity of a similar Au/SBA-15 catalyst were responsible for CO
2 adsorption. The higher the BET surface area and the microporosity, the higher the CO
2 uptake. As our catalyst has a rather high BET surface area of 726 m
2/g and a high microporosity of 0.17 cm
3/g [
50], the noisy CO
2 response is most probably due to the strong adsorption of CO
2.
Another way to confirm whether the oxidation reaction occurred is to compare the experimental amount of acetone leaving the microreactor when oxygen:10% acetone/Ar mixture was pulsed, an amount which is directly proportional to the experimental zero-th moment, with the theoretical amount (i.e., no acetone consumption) calculated by multiplying the zero-th moment of Ar response curves with the acetone/Ar ratio in the initial mixture.
Table 5 presents the results of this comparison at 200, 250, and 300 °C. At RT and 100 °C, there is almost no acetone leaving the reactor. As the difference between the Theoretical and Experimental zero-th moments of the acetone responses to the oxygen:10% acetone/Ar mixture pulses increases with temperature, one can conclude that the oxidation reaction occurred, with the acetone conversion increasing from 16% to 25%.
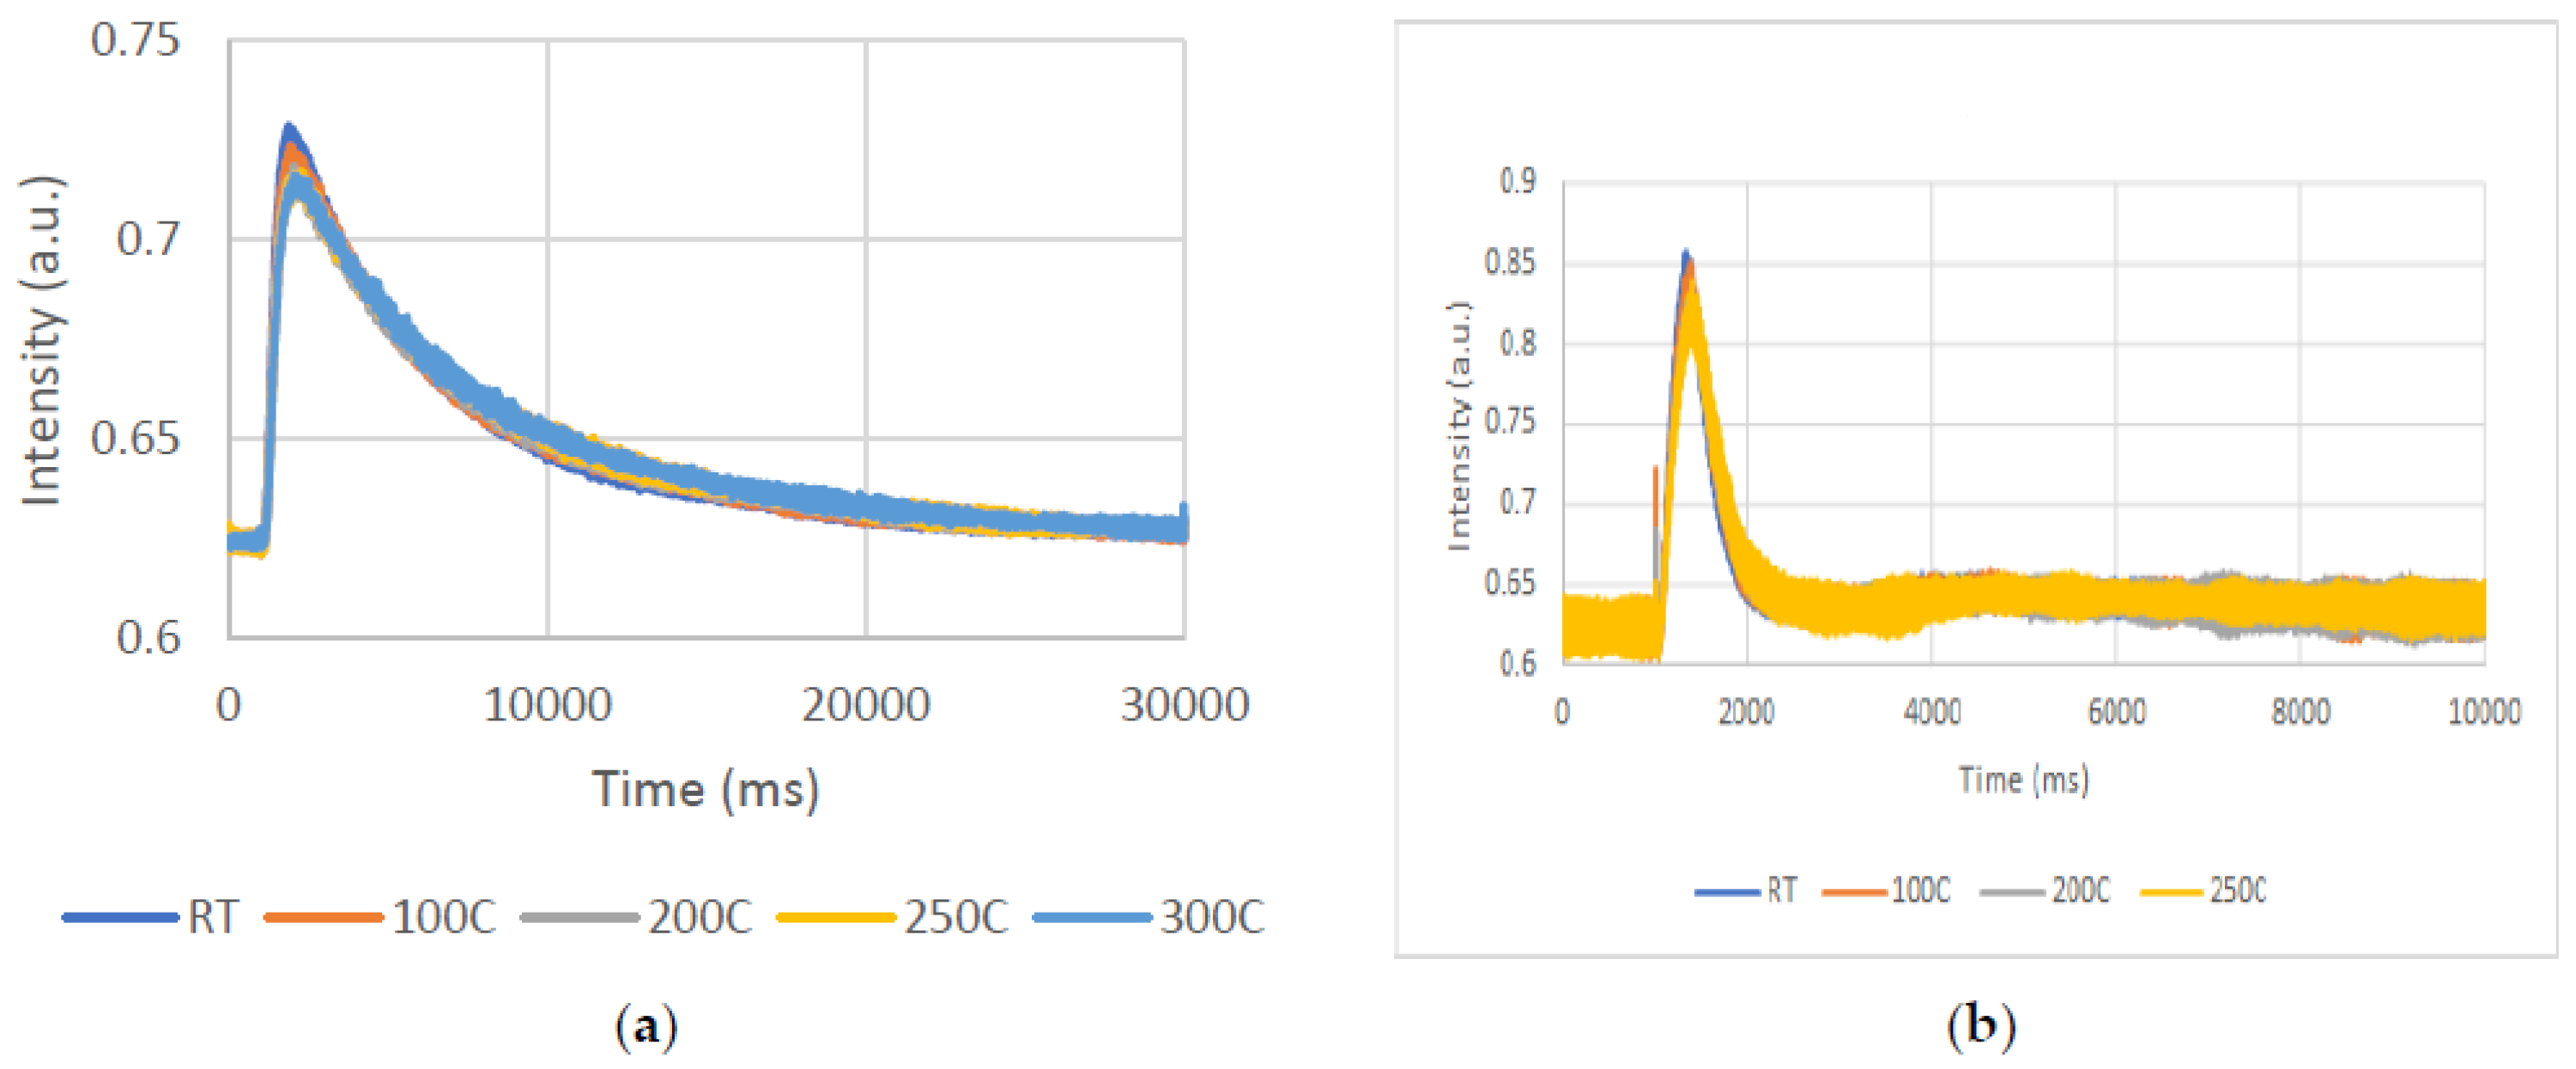
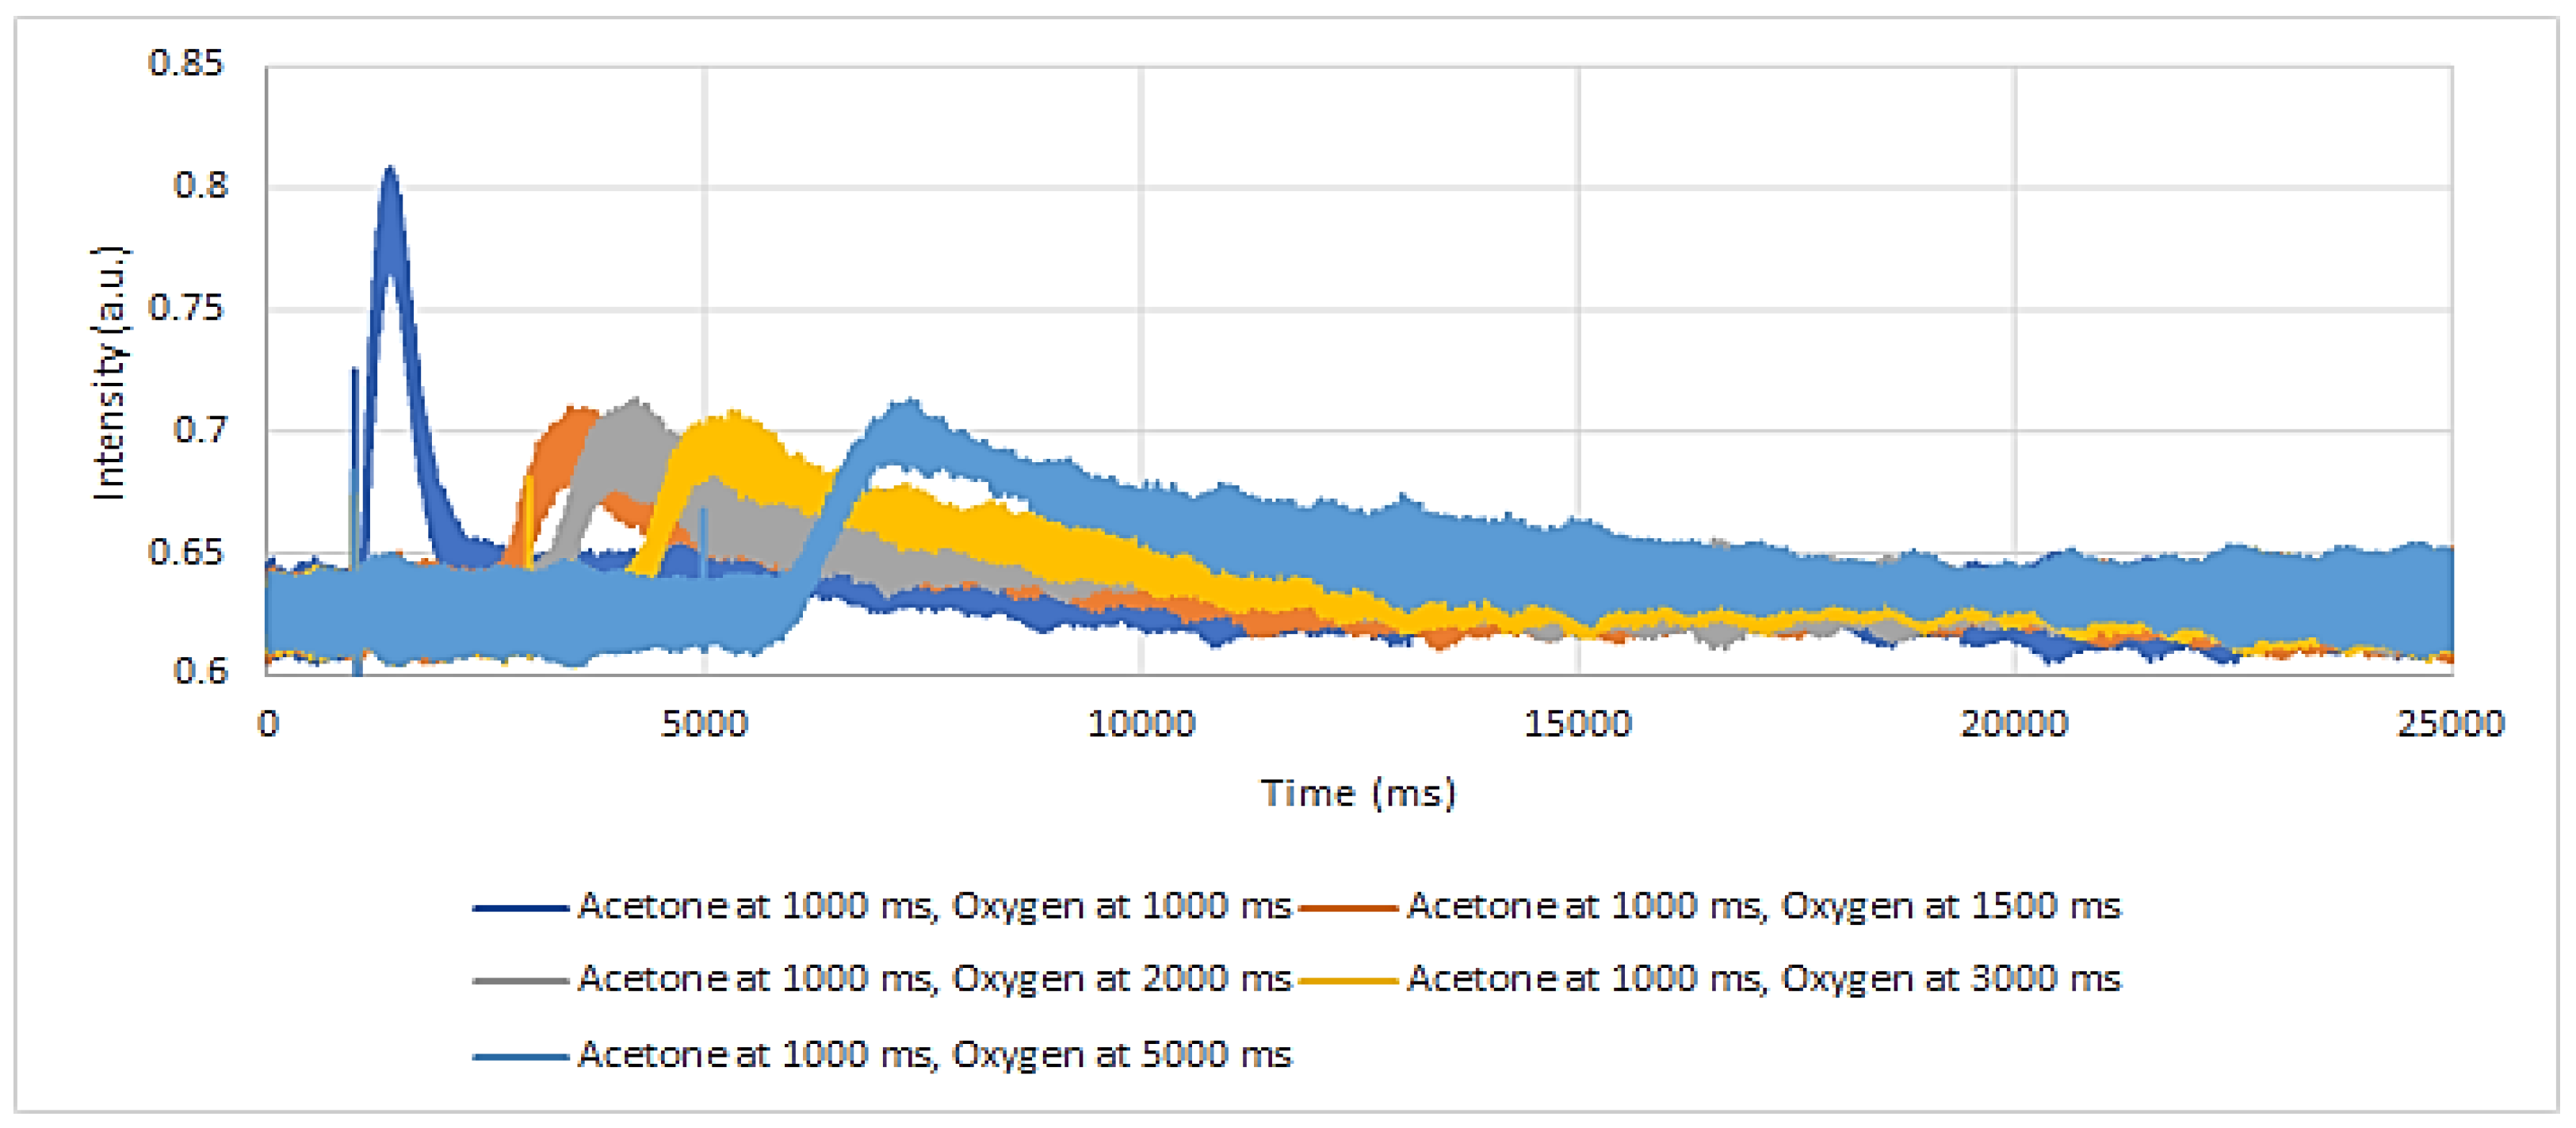
TAP pump-probe experiments were performed as well at 300 °C, at increased time intervals from 0 to 5000 ms. In order to assess the lifetime of adsorbed acetone, acetone was the pump molecule and oxygen the probe molecule. As seen in
Figure 12, there was no more adsorbed acetone left after 1500 ms to react with the probe oxygen, as the oxygen responses after this time interval stay the same. The lifetime of adsorbed acetone is therefore less than 1500 ms. The oxygen responses were similar to those obtained when oxygen was pulsed alone (
Figure 10A).
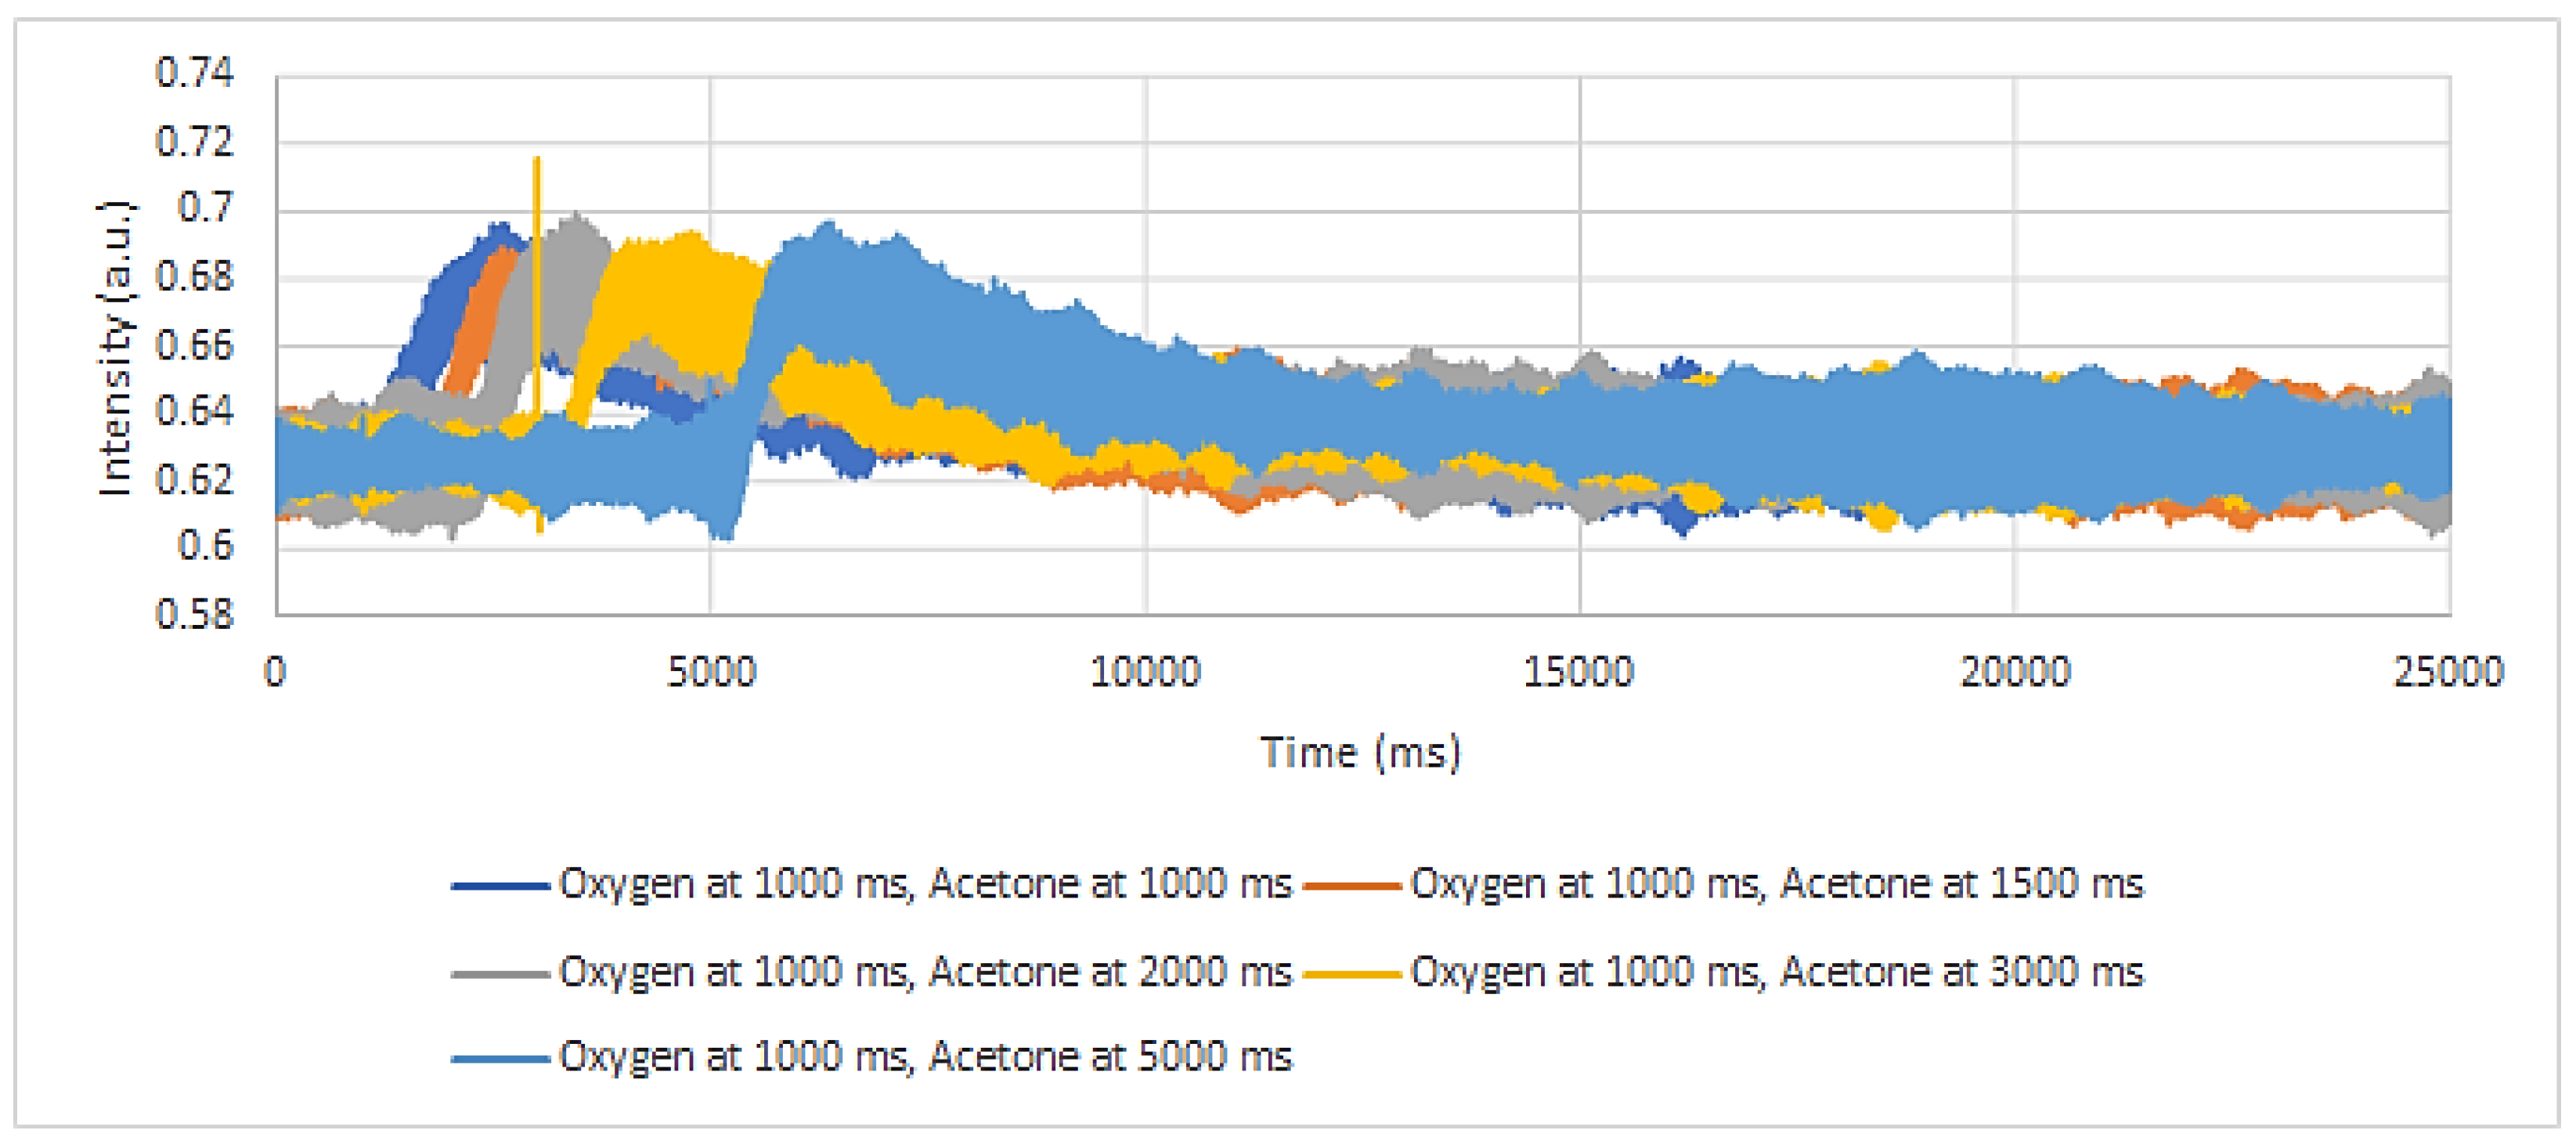
To assess the lifetime of adsorbed oxygen, TAP experiments with oxygen as the pump molecule and acetone as the probe molecule were performed.
Figure 13 shows the acetone responses as a function of the time interval.
Since there are no significant changes in the acetone response as the time interval increases, the TAP pump (oxygen)–probe (acetone/Ar) results confirm that oxygen does not adsorb on the catalyst when acetone is present.
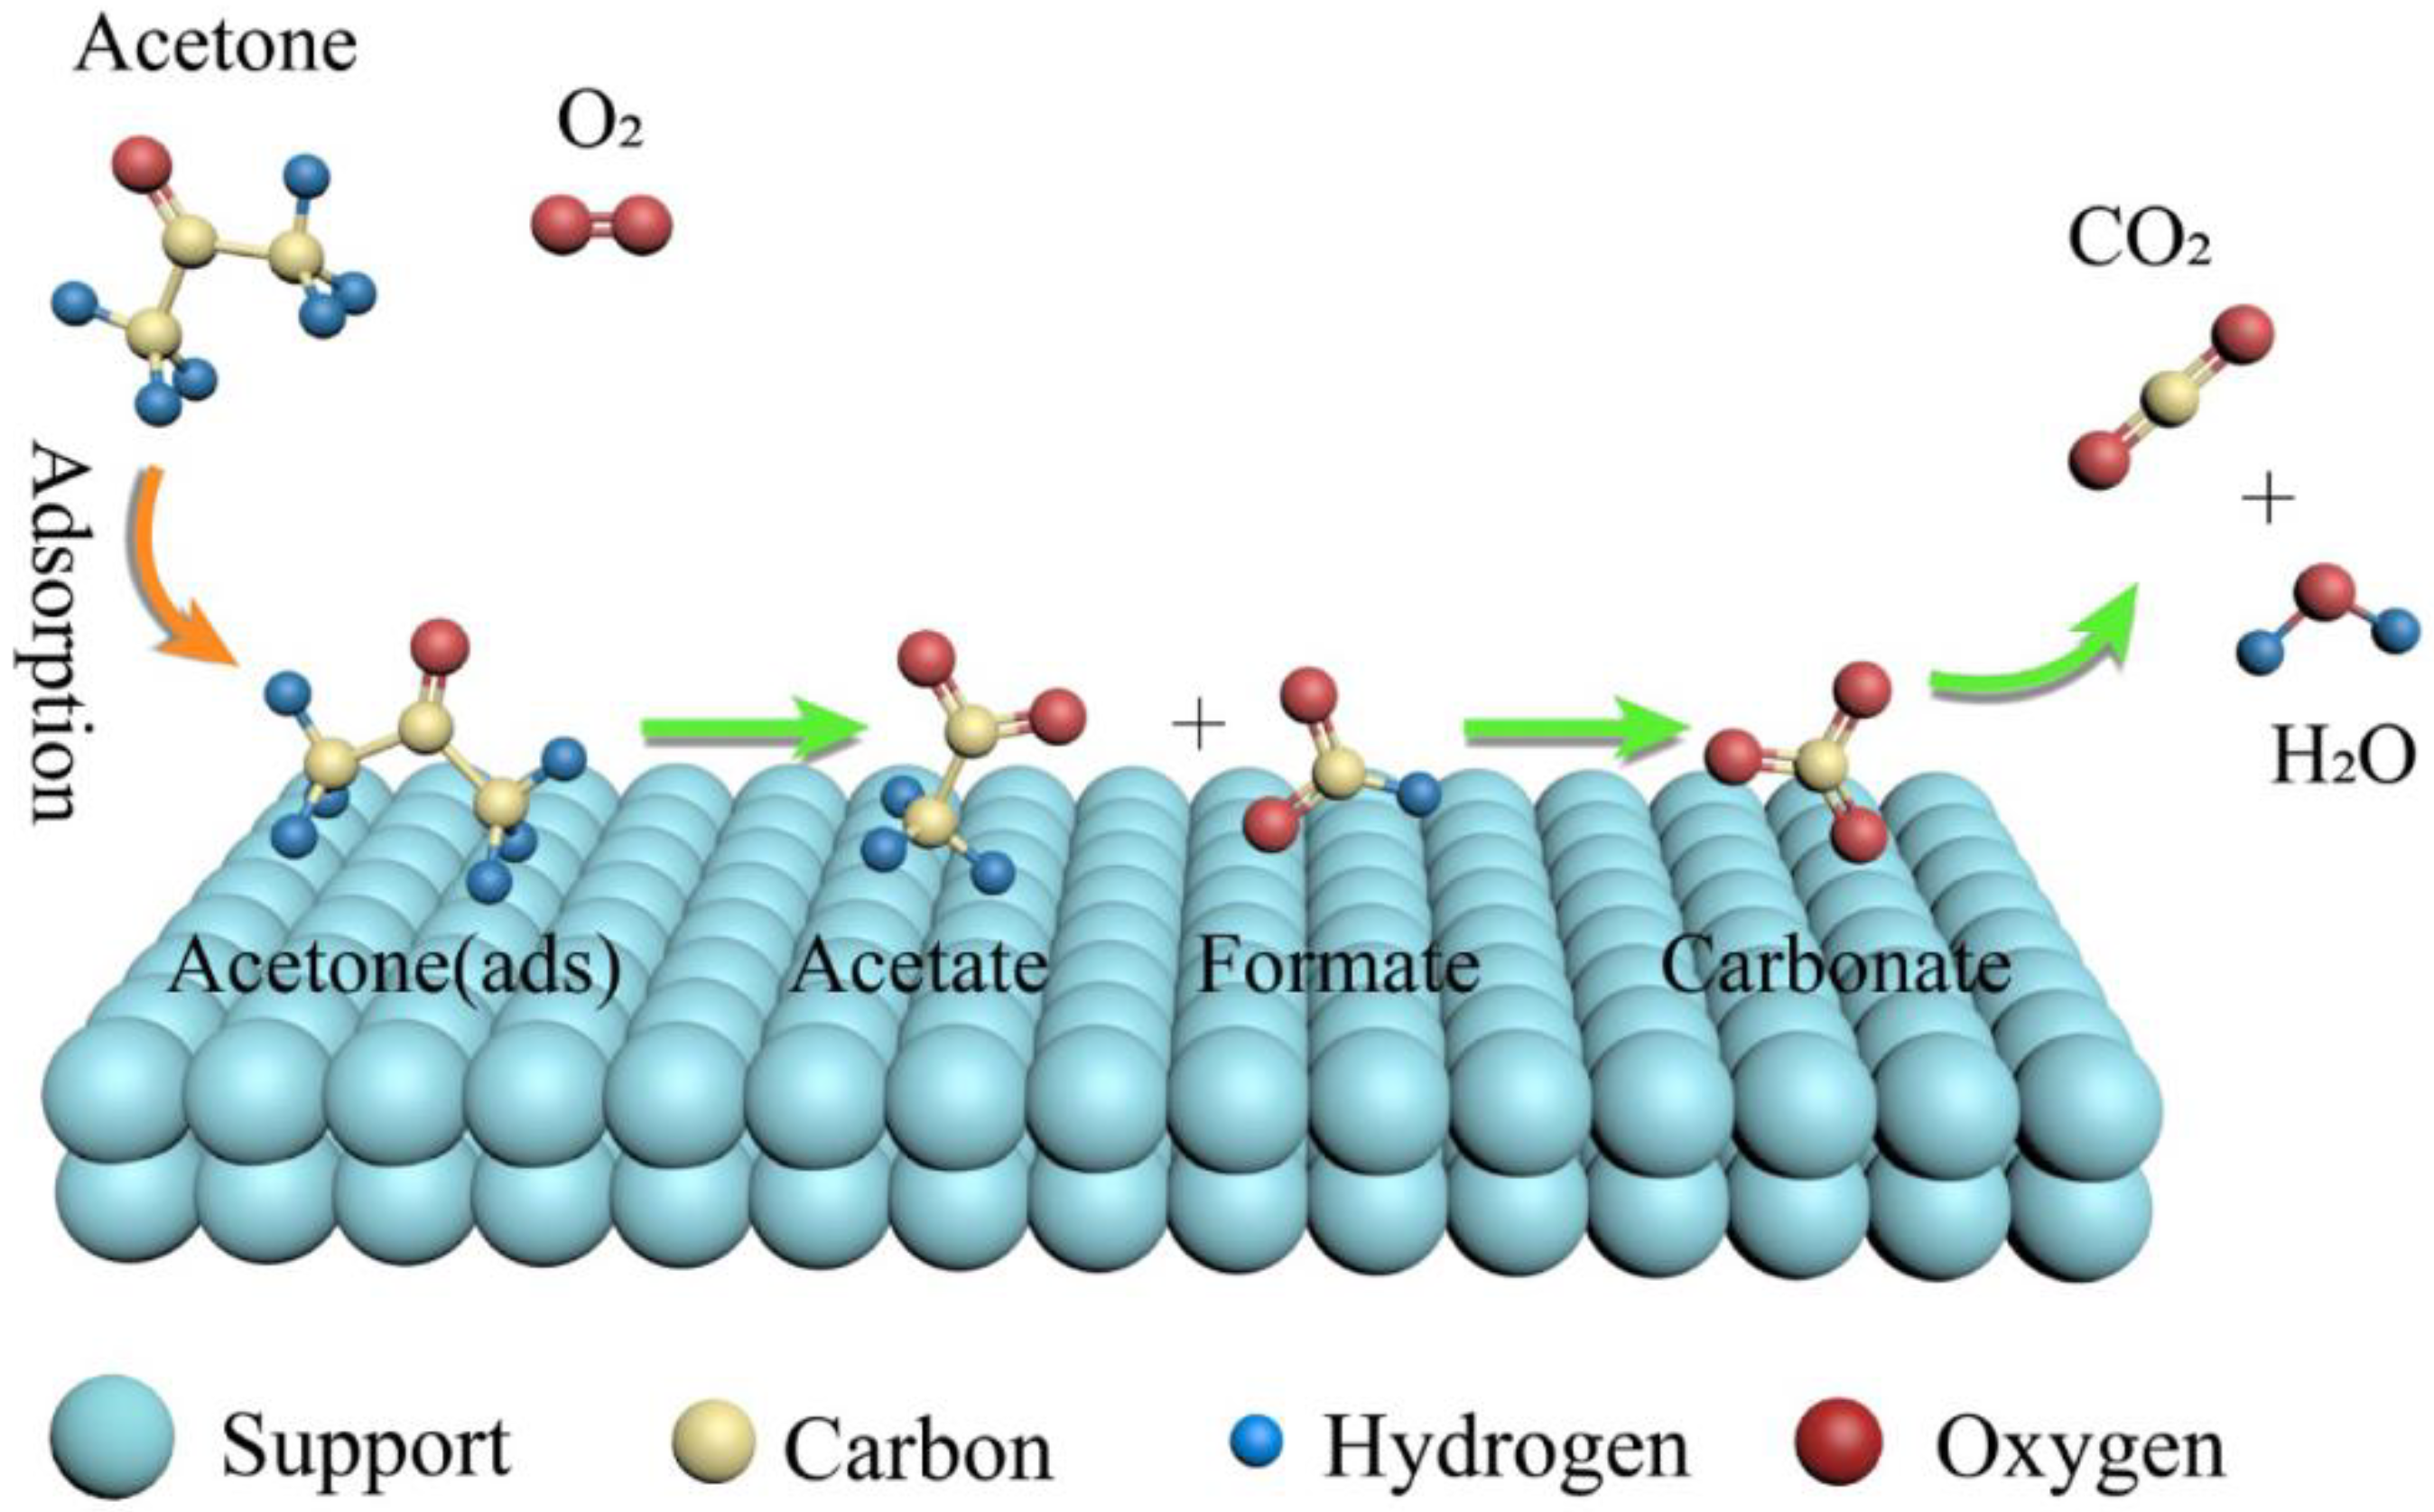
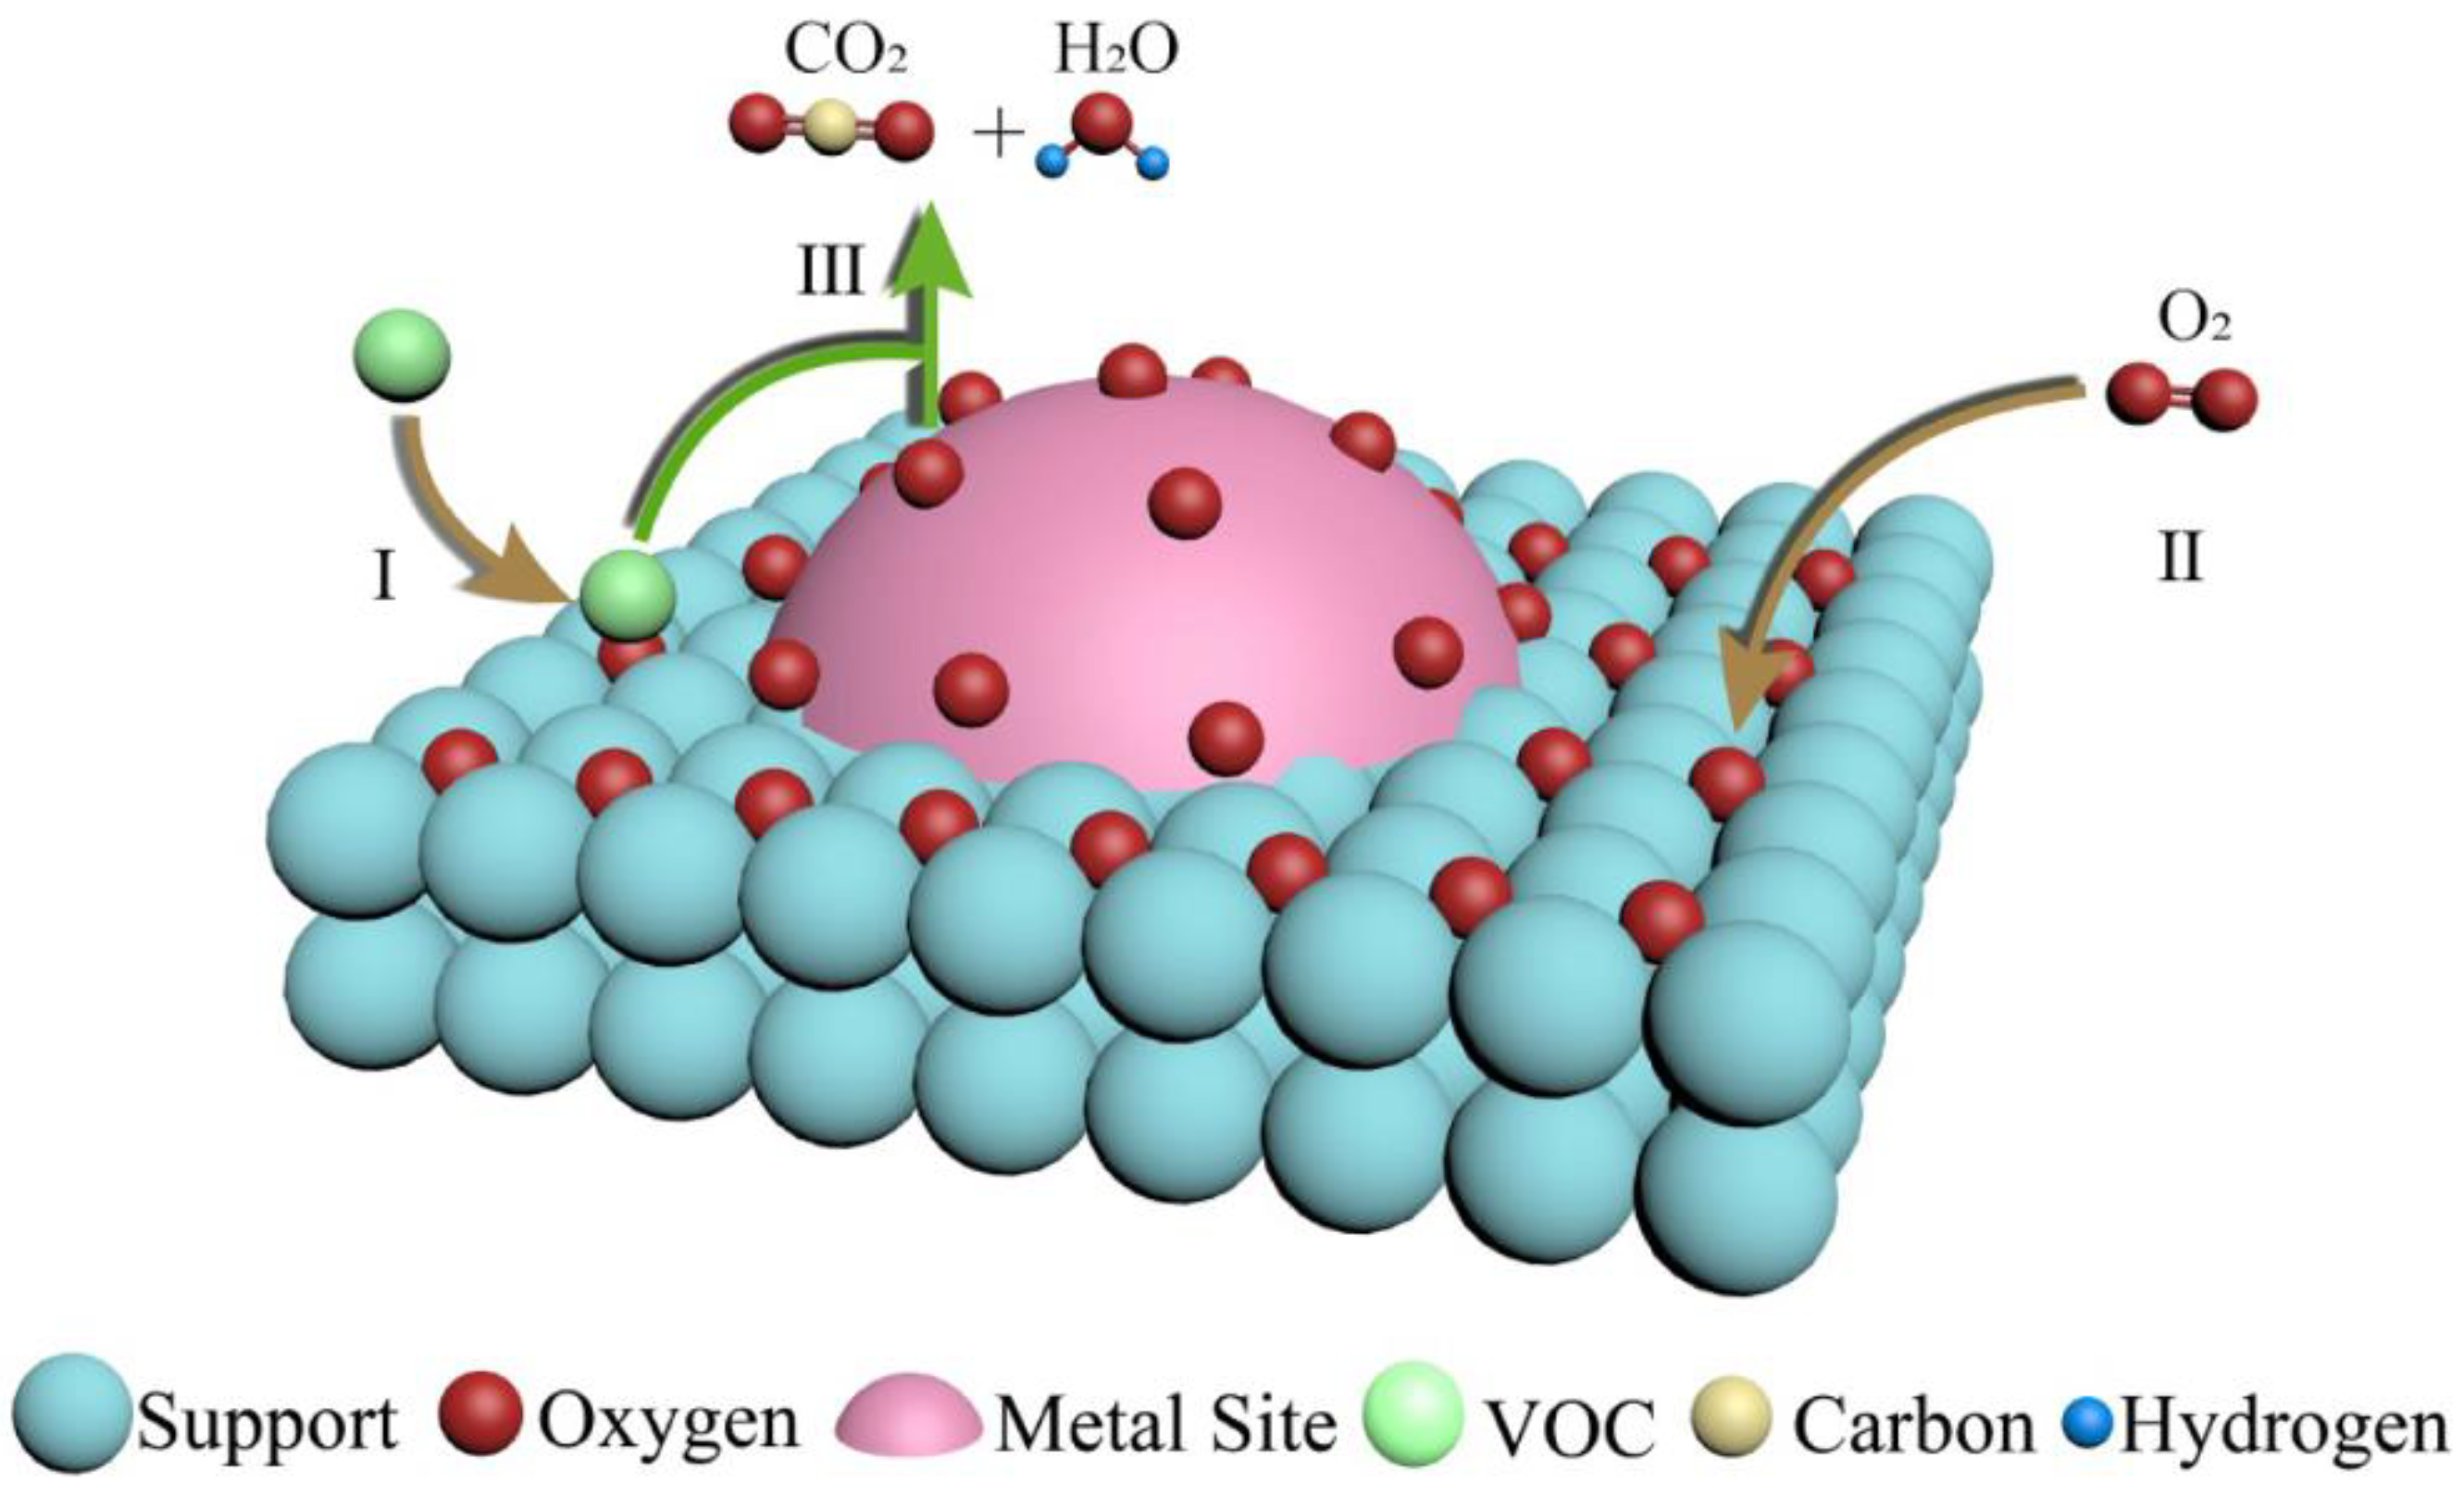
Based on TAP results, one can conclude that the acetone oxidation reaction occurs mainly between acetone adsorbed on the Au nanoparticles and oxygen from the gas phase, likely following the Eley–Rideal mechanism, with a minor contribution of the reaction between both species adsorbed, following the Langmuir–Hinshelwood mechanism. Similar findings regarding the mechanism of acetone complete oxidation were revealed within the review by Mu et al. [
31]. The acetone adsorption intermediates were shown as well.
Figure 14 and
Figure 15 illustrate the two oxidation mechanisms [
31]. The Eley–Rideal and Langmuir–Hinshelwood mechanisms are the two proven mechanisms for VOCs oxidation on non-reducible oxides supported by noble metals catalysts, whereas for the VOCs oxidation on reducible oxides that supported noble metals catalysts, the Mars–van Krevelan mechanism is generally accepted [
4,
12].
The catalytic activity towards acetone oxidation of all samples was tested in a CFR.
By stoichiometry, one mole of acetone will produce three moles of CO
2 if 100% acetone conversion takes place by complete oxidation:
Two series of measurements were performed. The first series was performed over the catalyst’s samples previously subjected to a flow of 60 mL/min 5% hydrogen in Ar at 500 °C for one hour (so called “Reduced”) and the second series was performed over the as-synthesised samples (so called “Oxidised”). The pre-treatment in hydrogen led to the reduction of -OH groups still present on the samples’ surfaces.
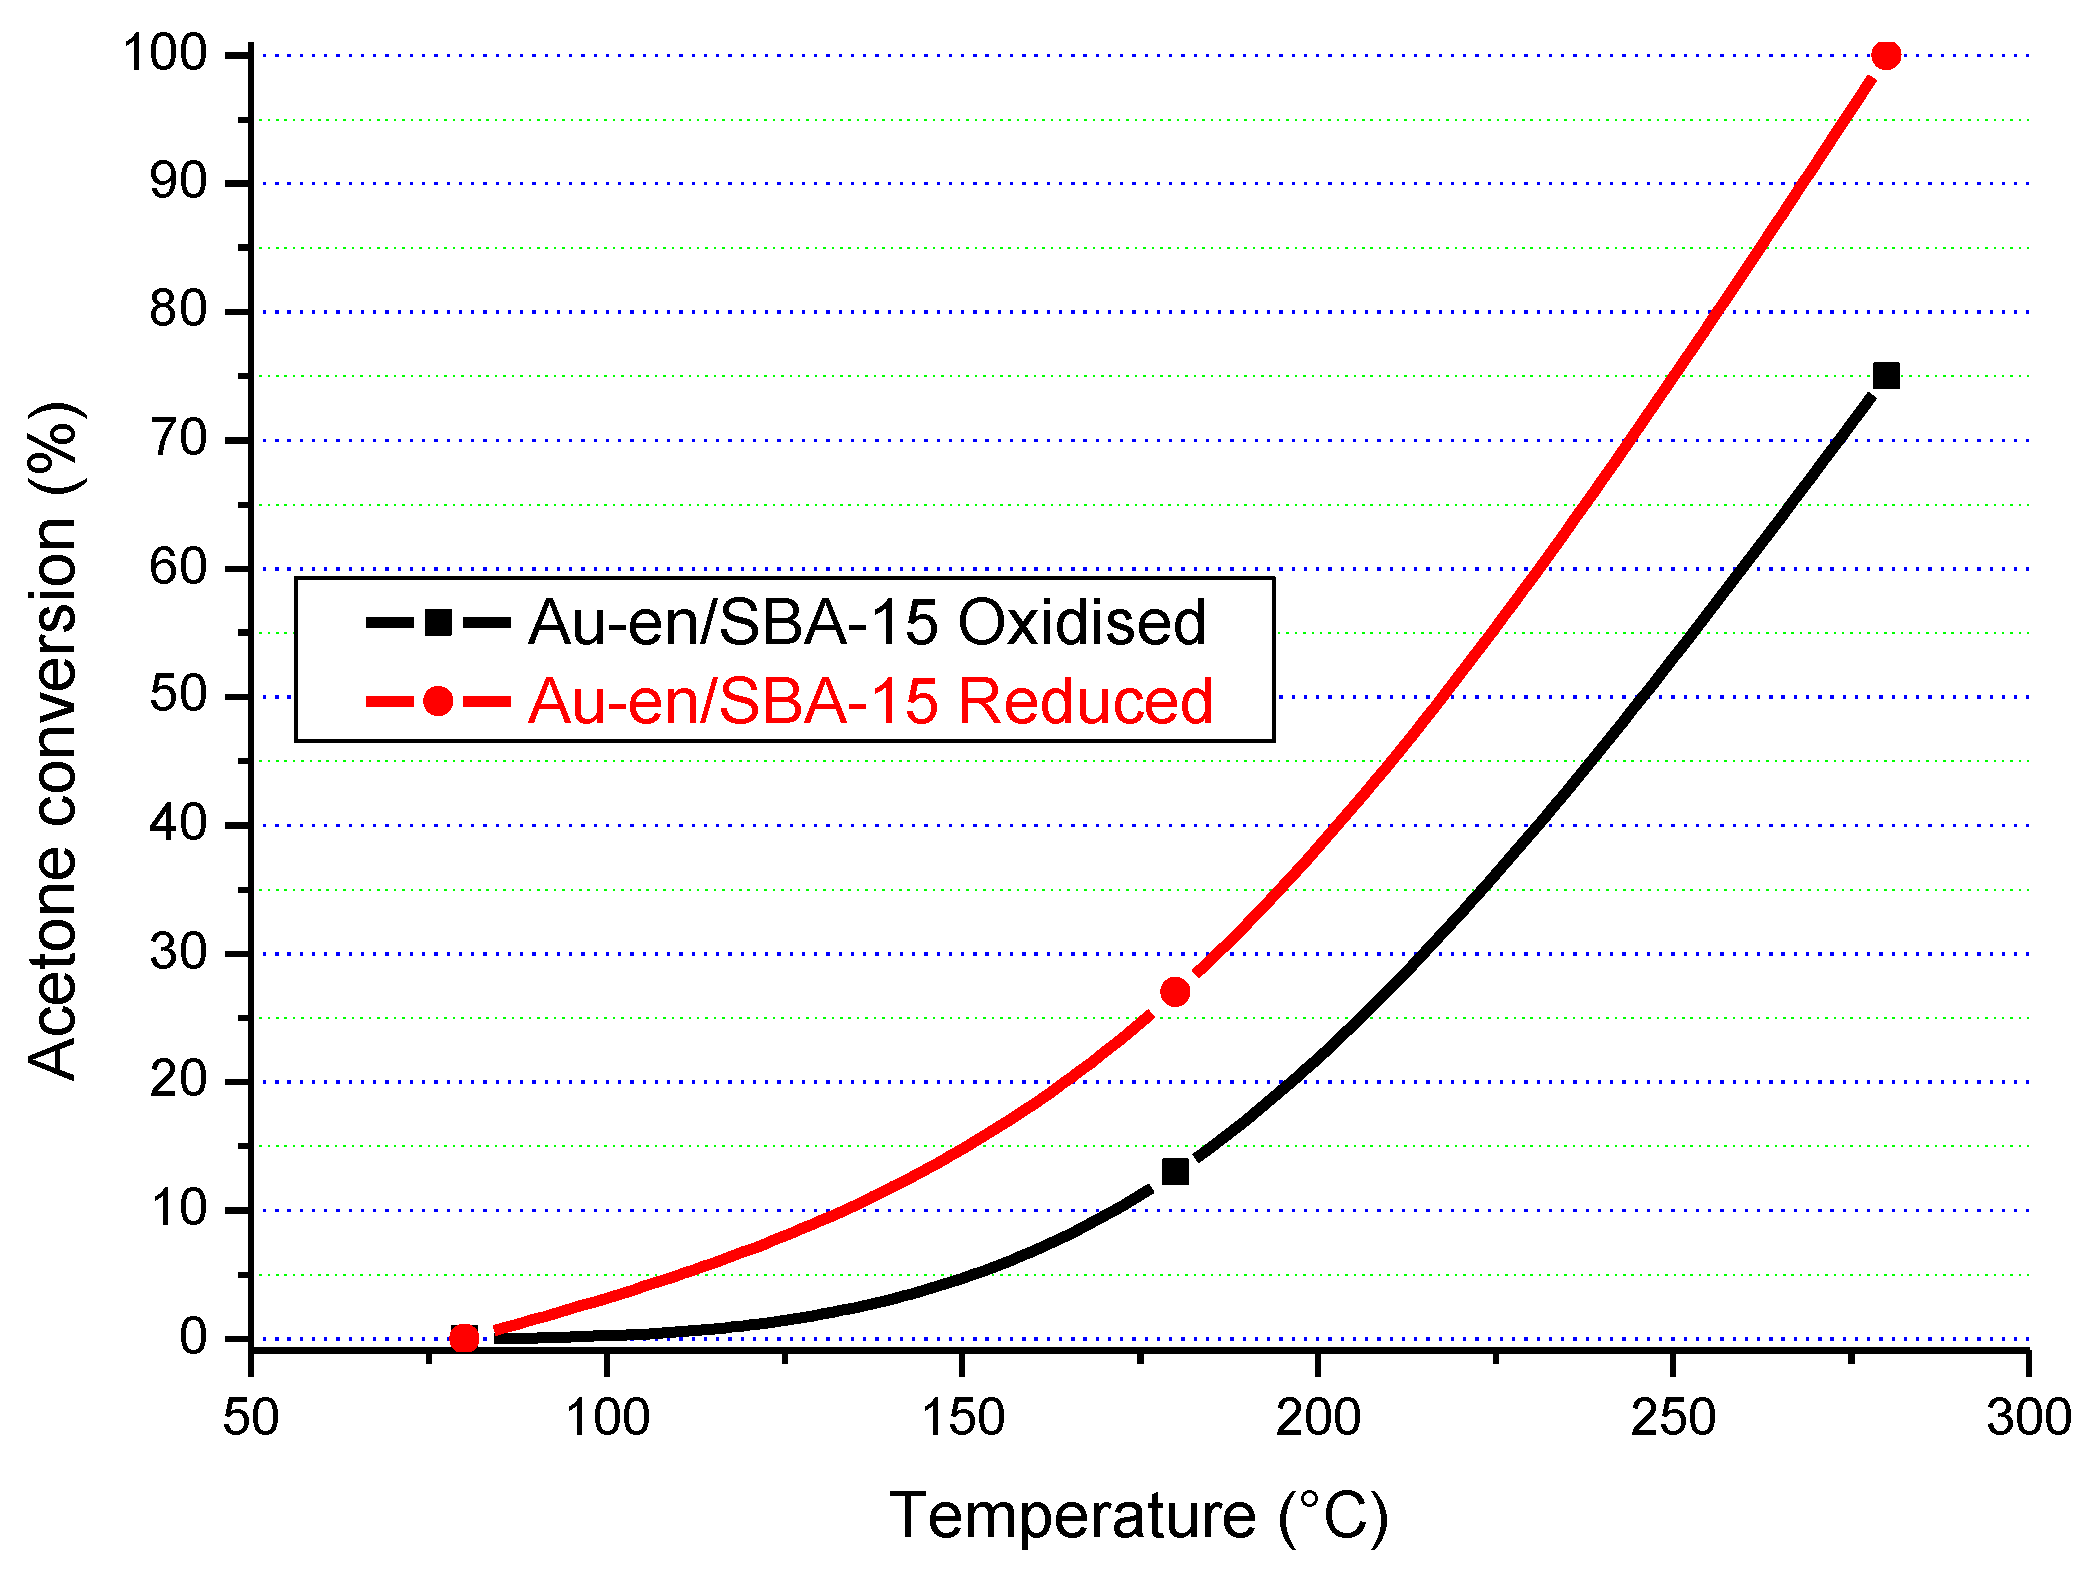
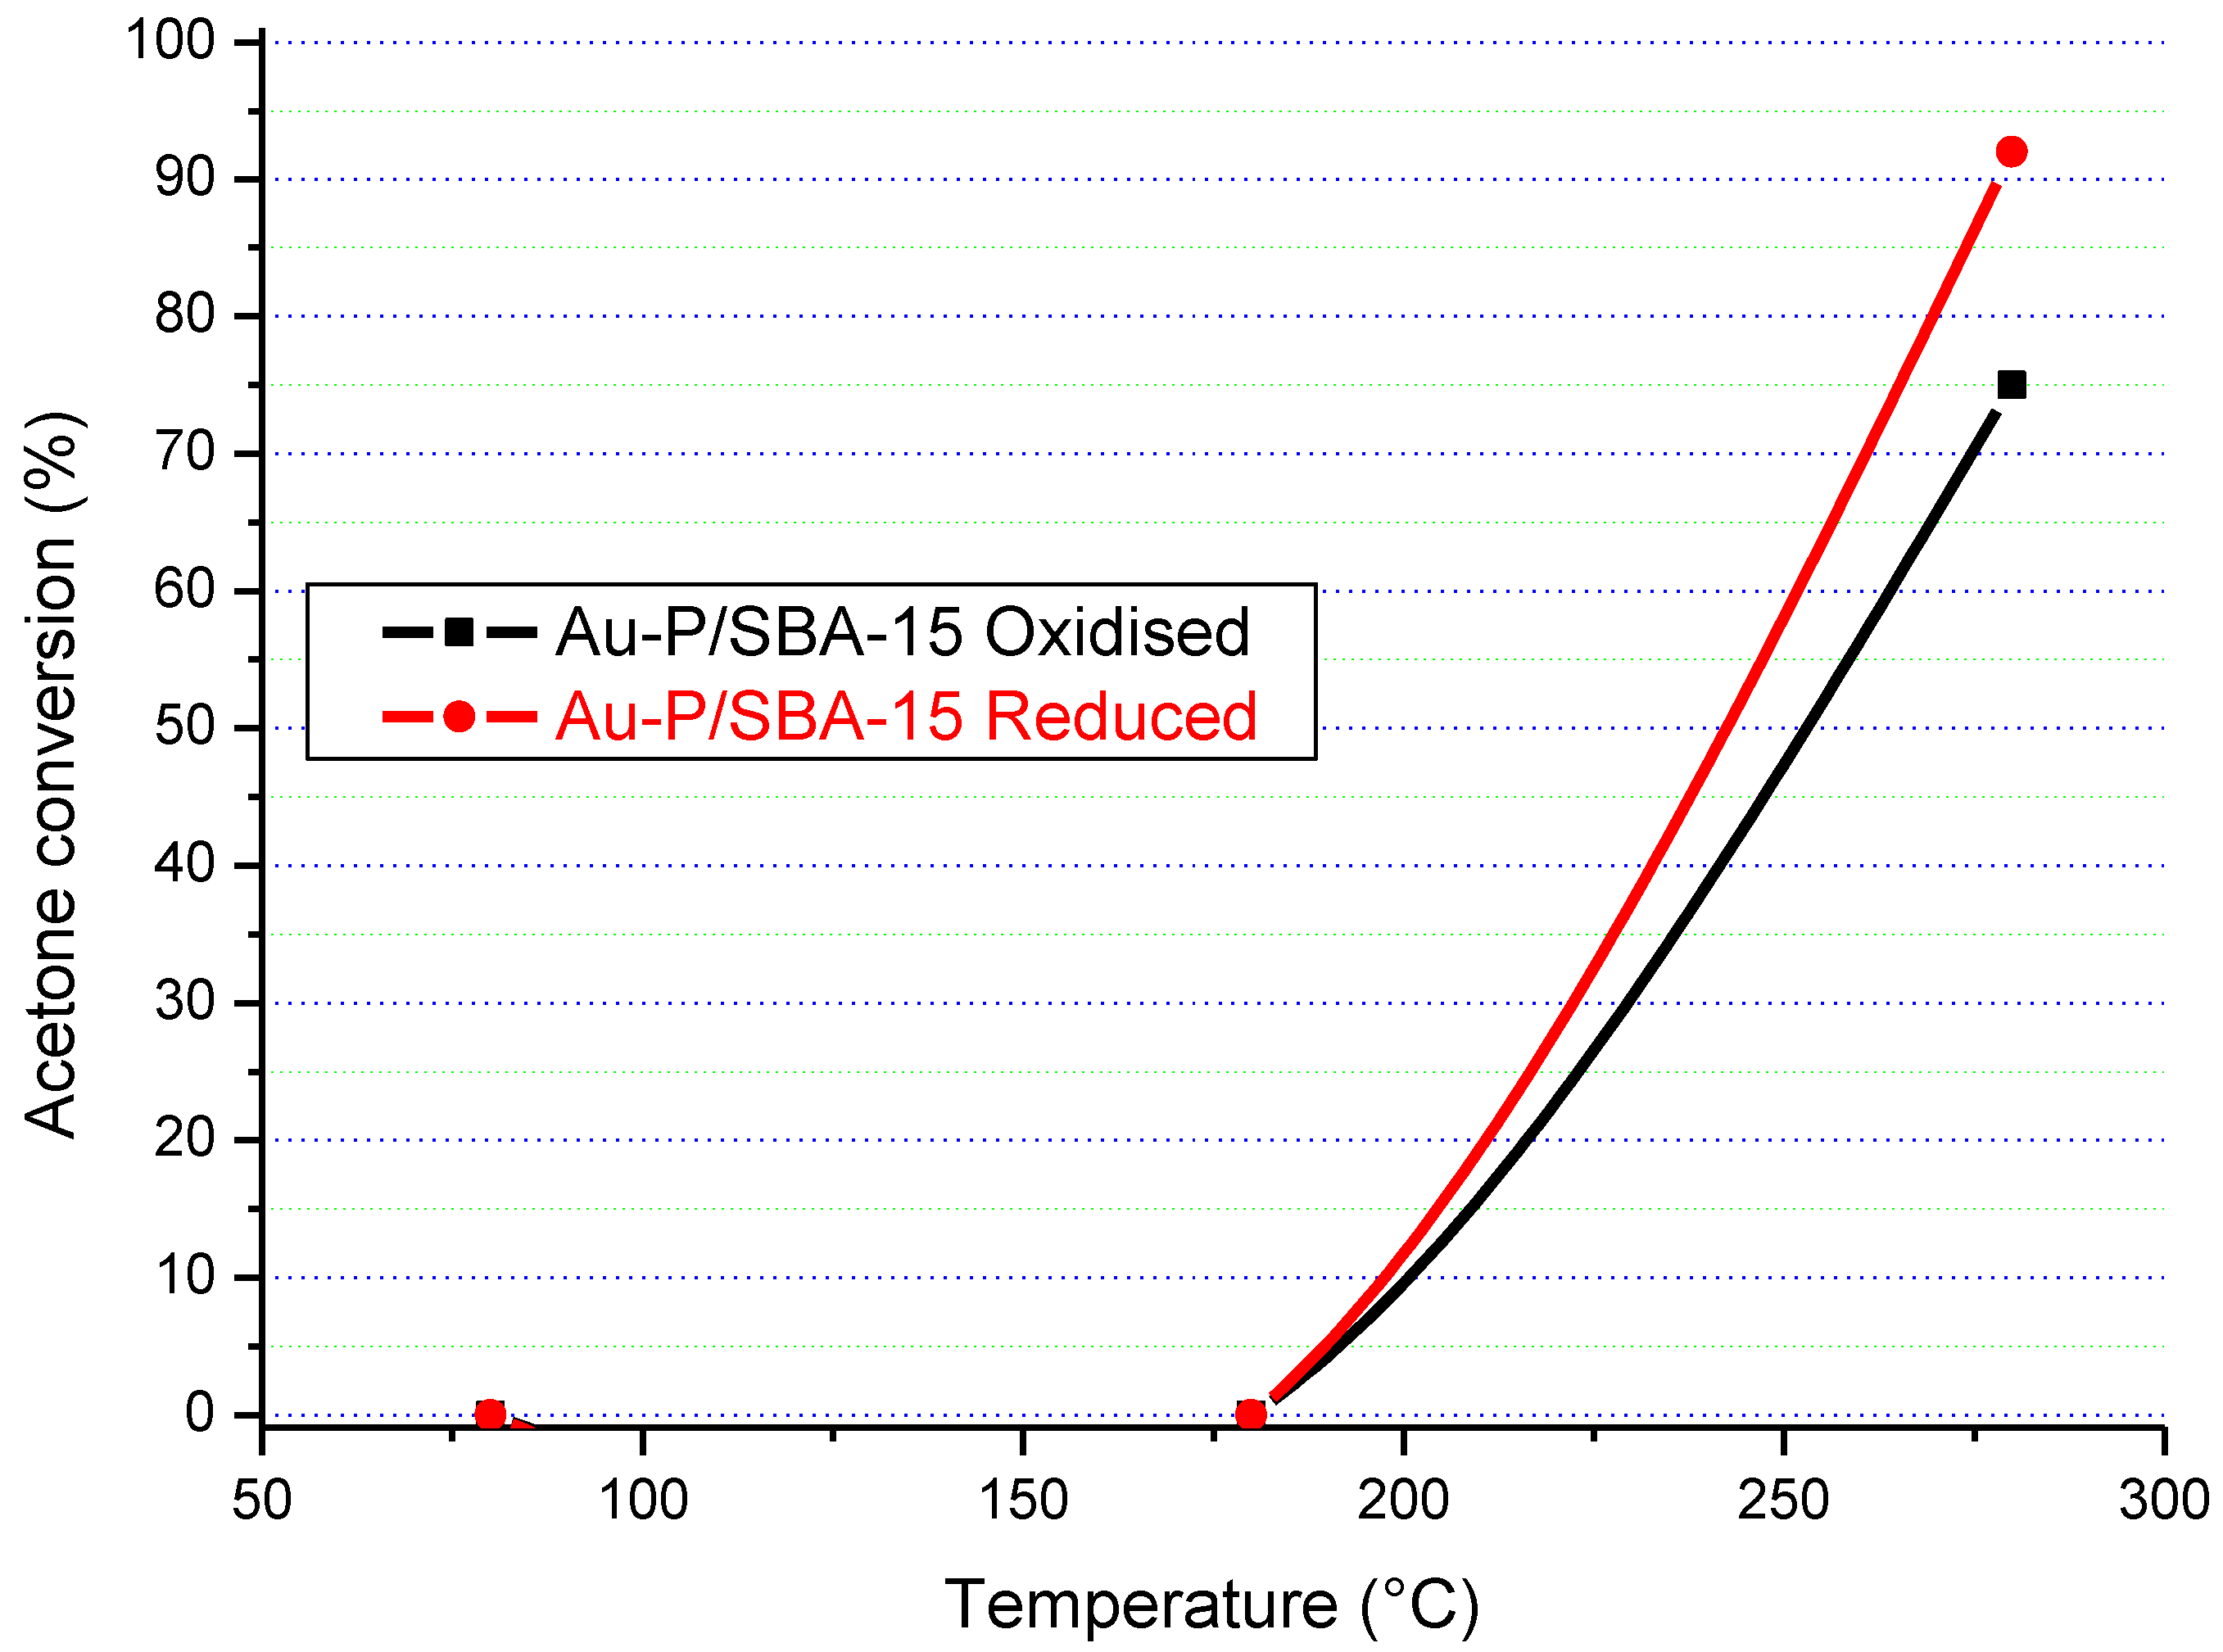
The acetone conversion–temperature plots are almost parallel for the oxidised and reduced samples indicates the same type of mechanism/kinetics for both forms.
The results in
Figure 16,
Figure 17,
Figure 18 and
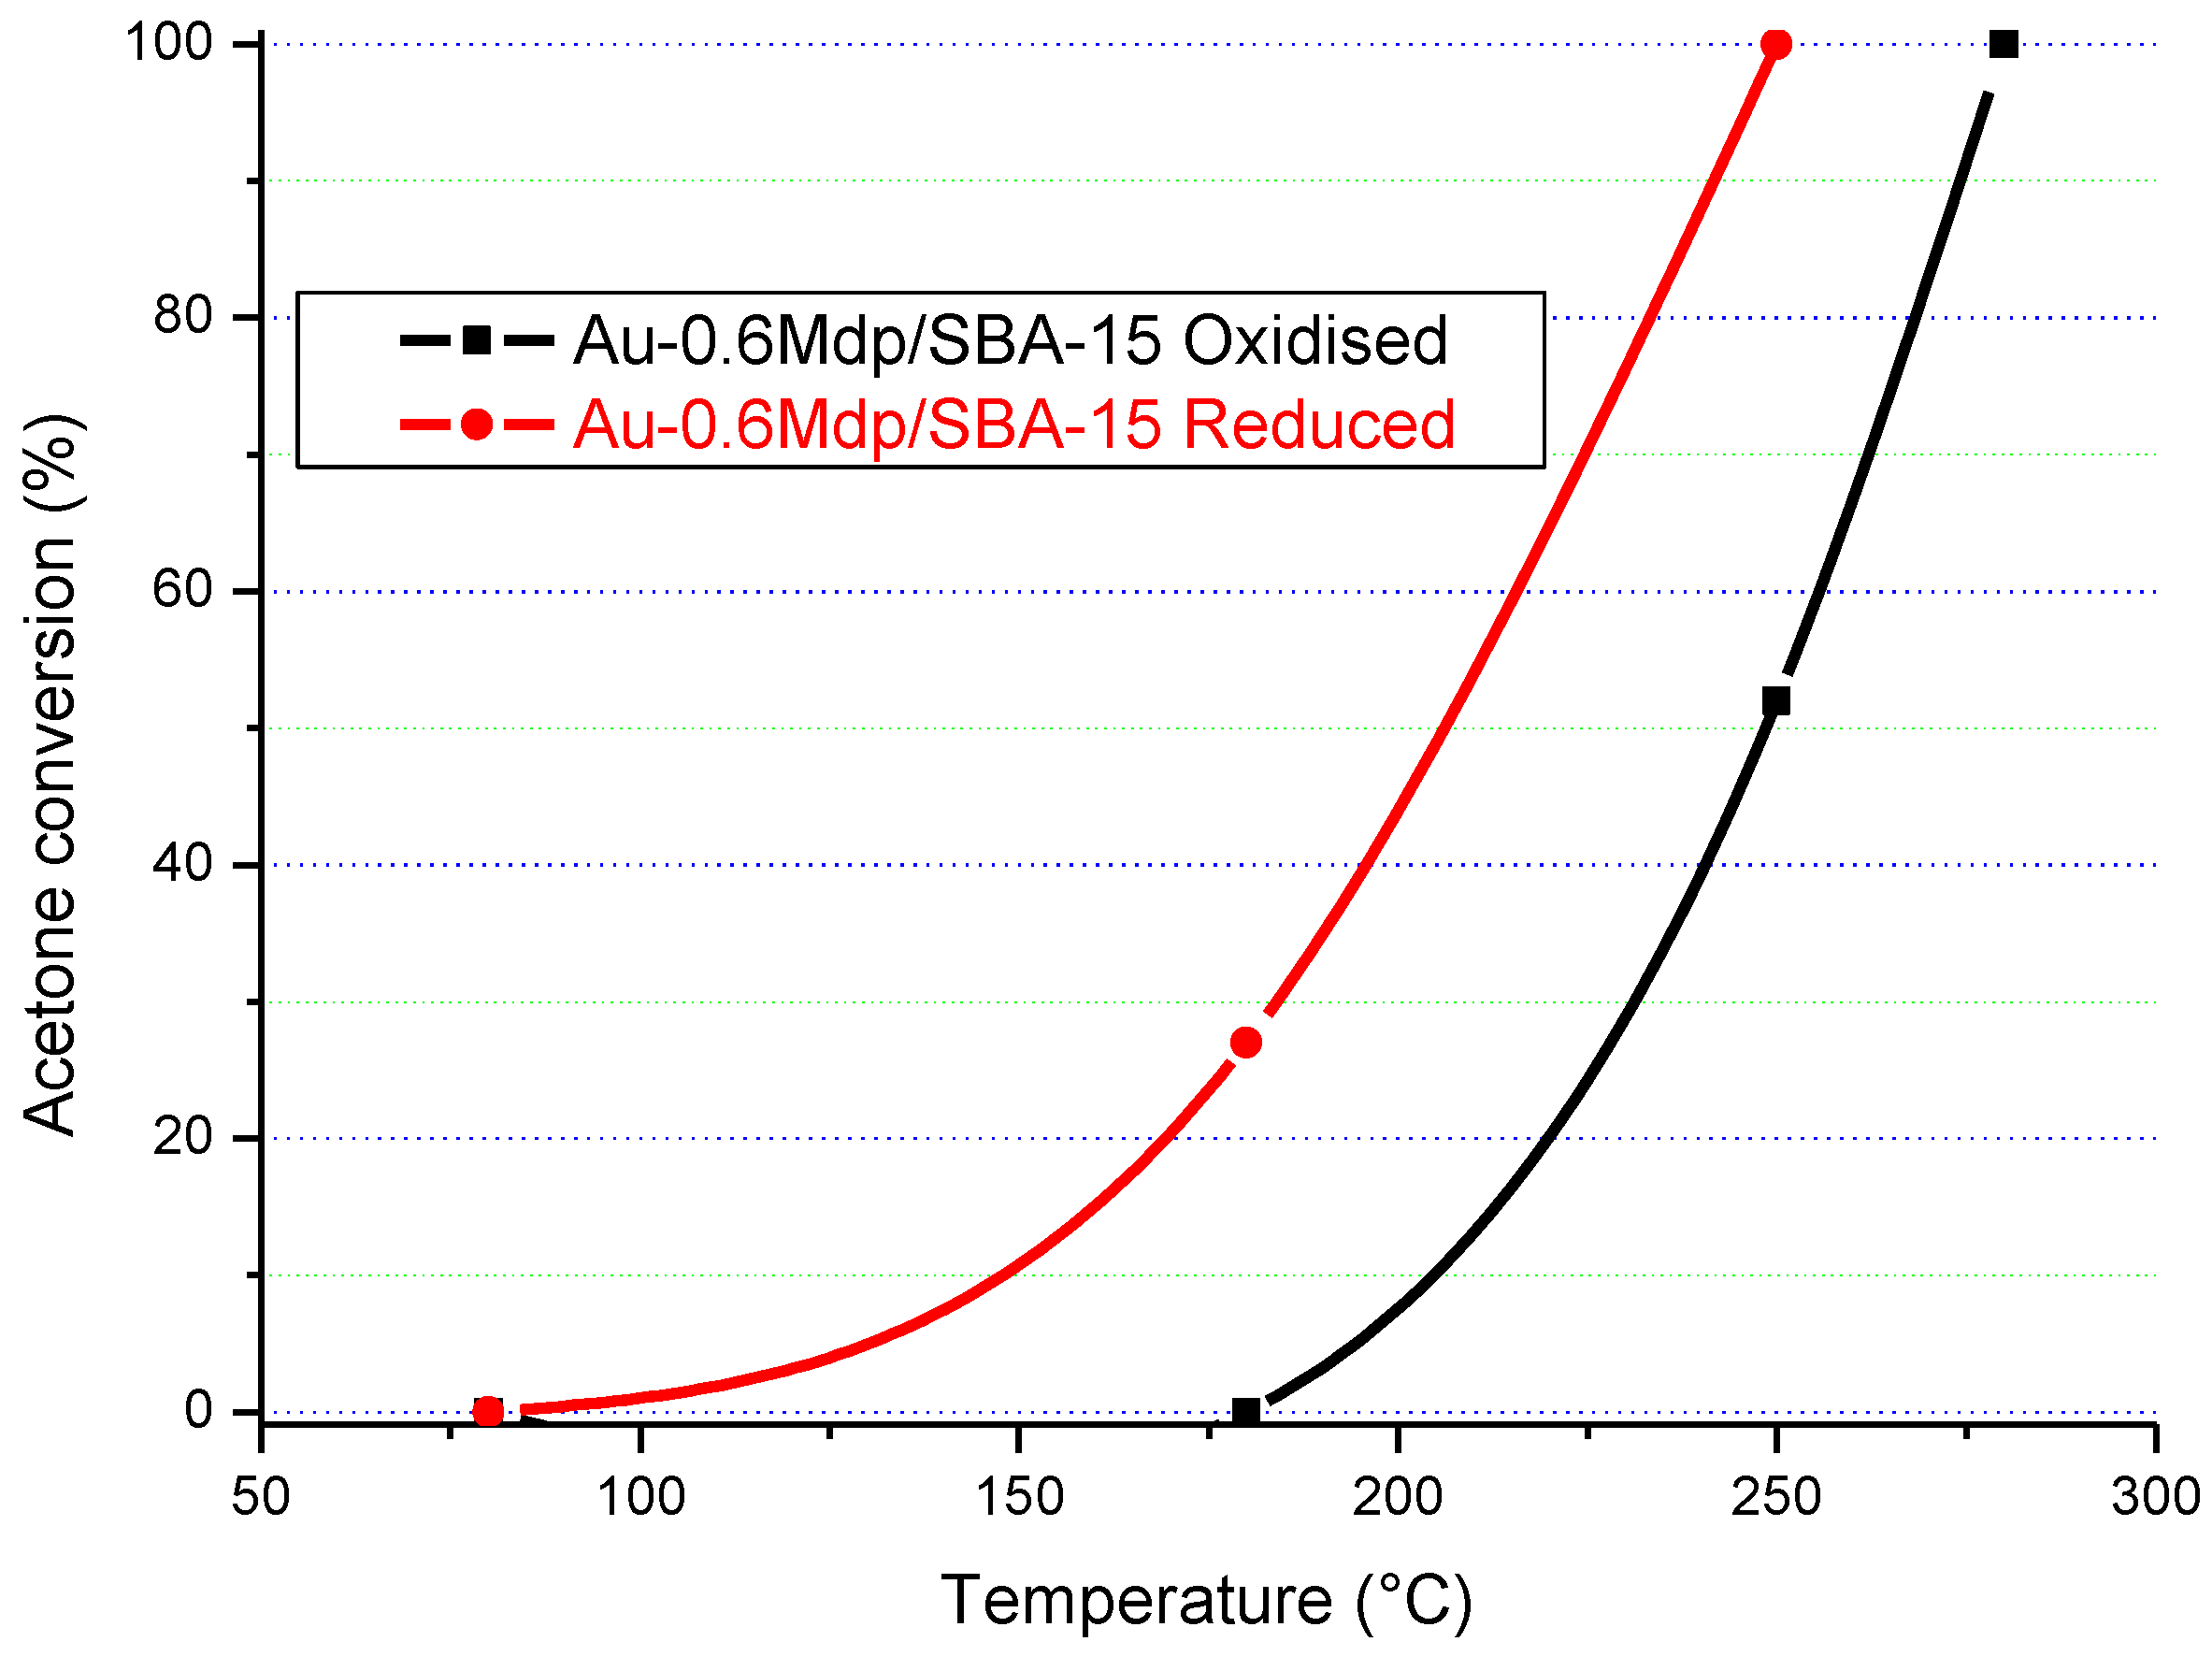
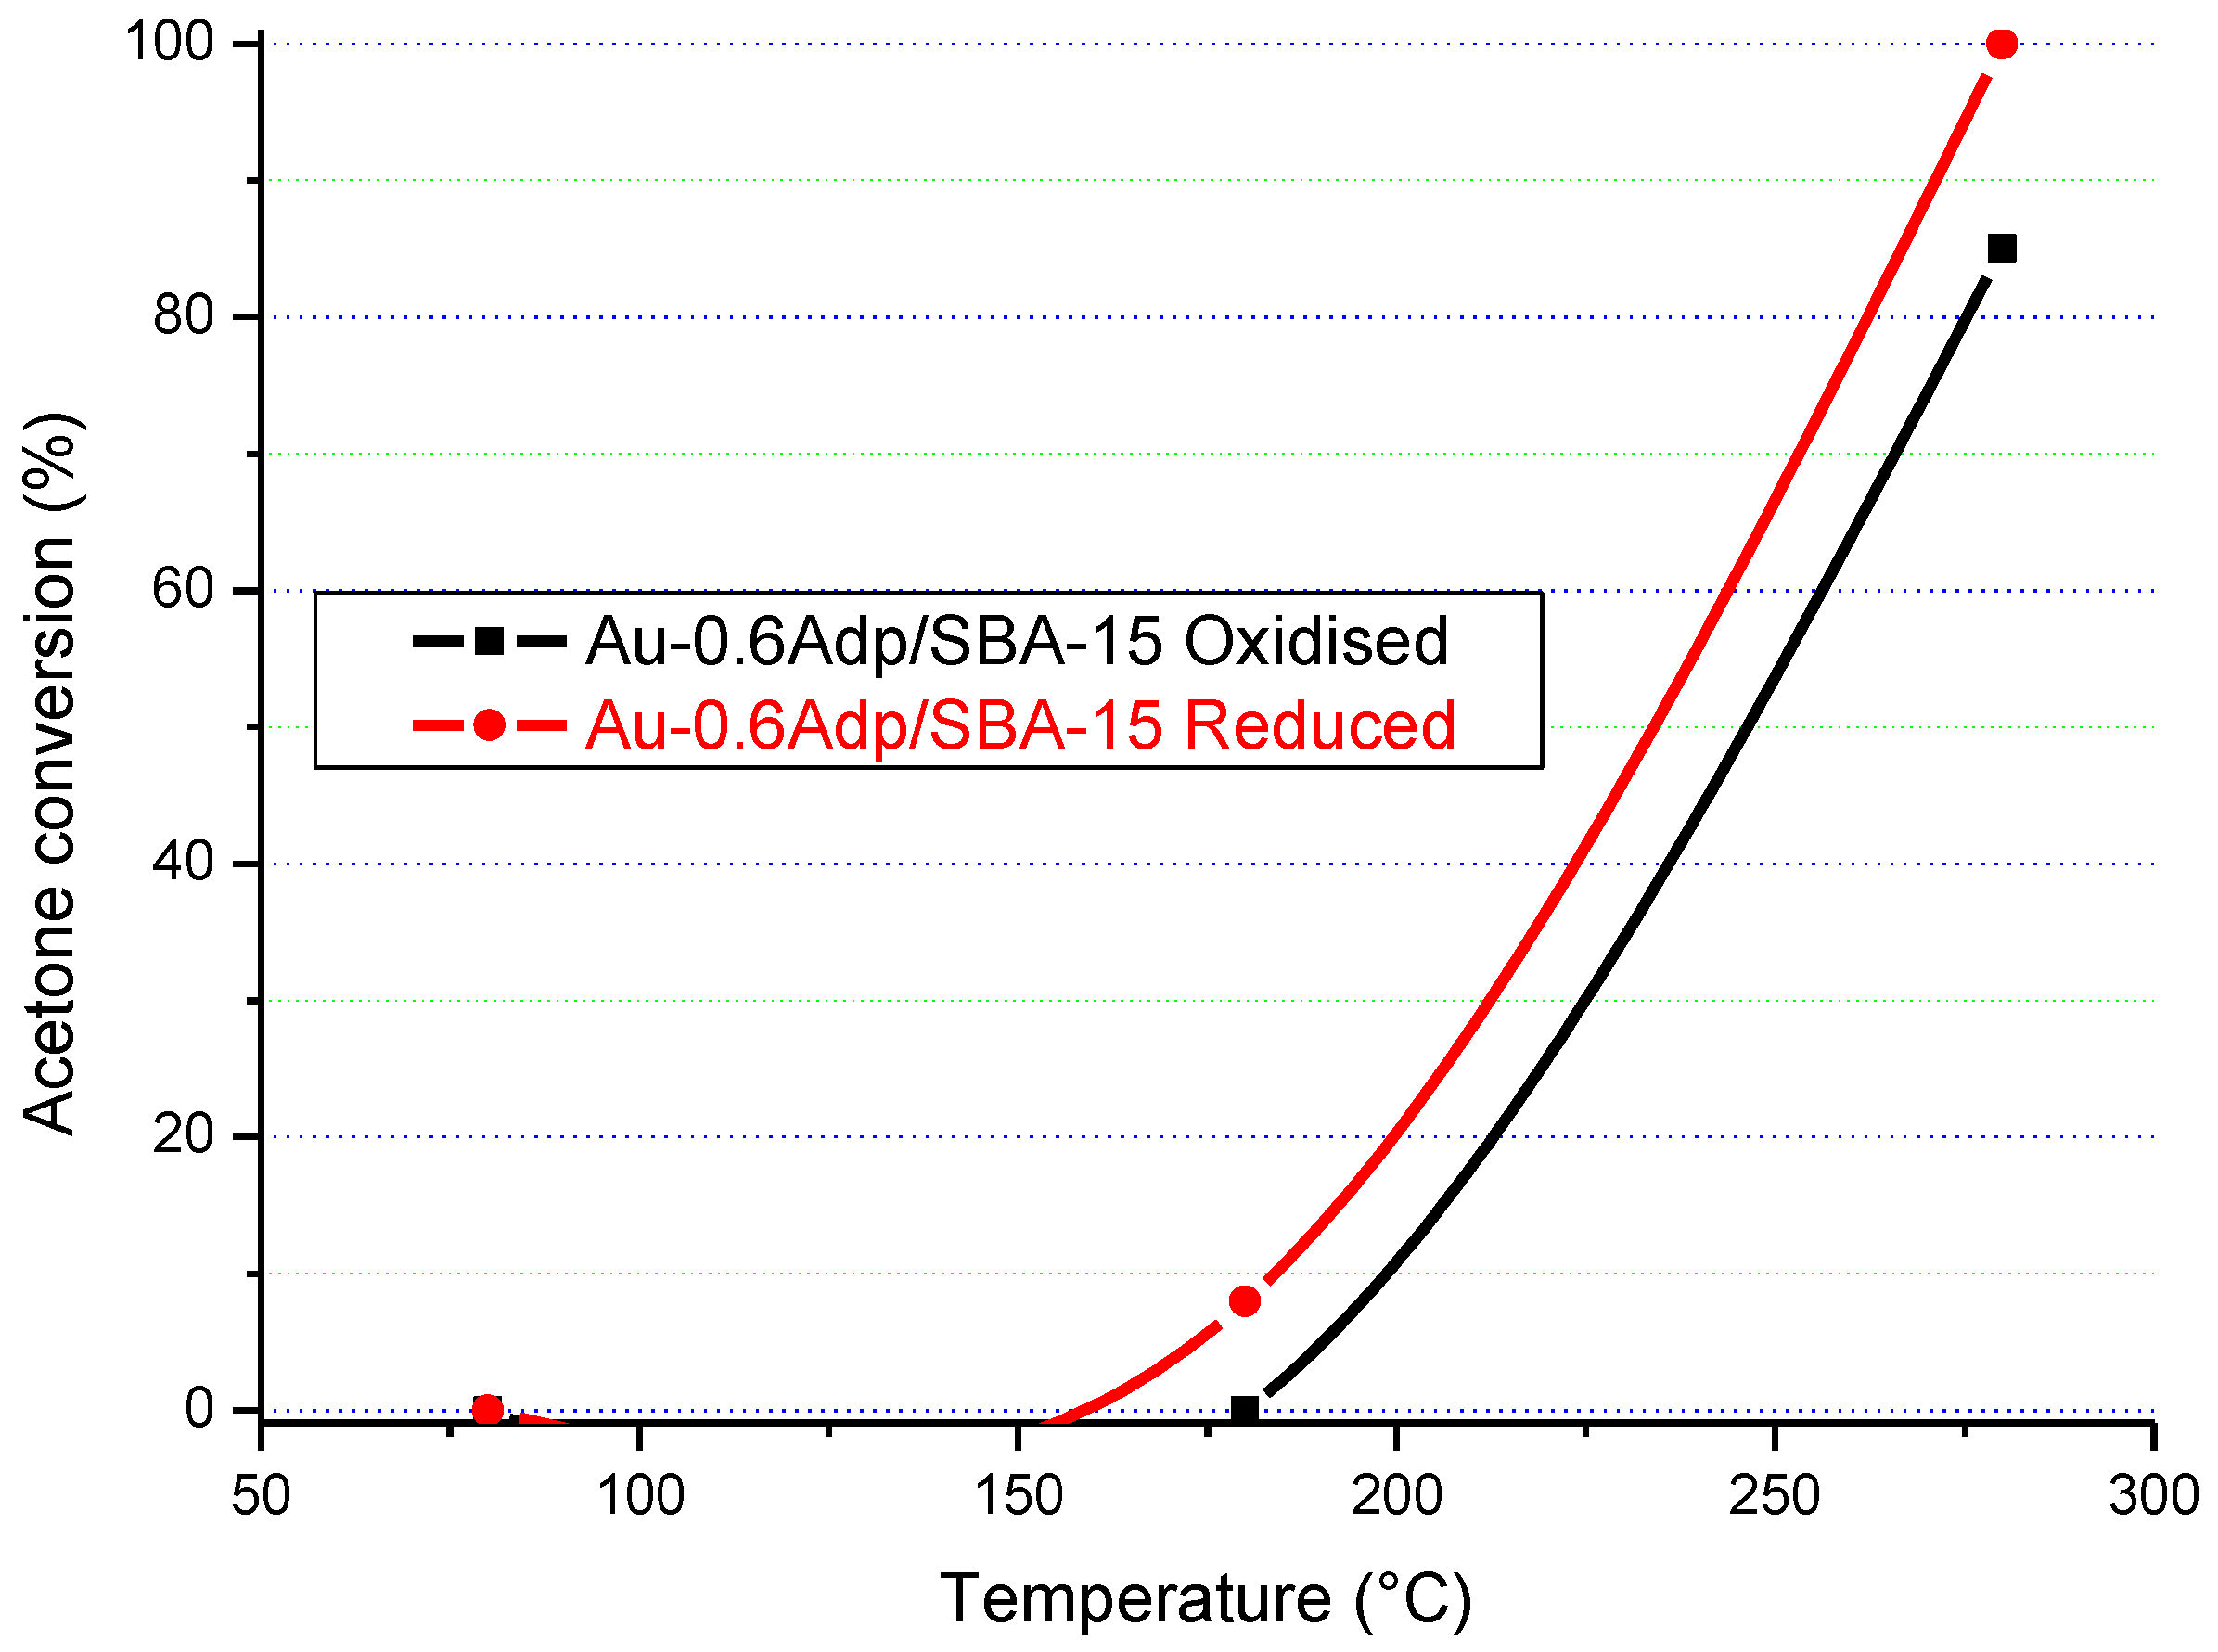
Figure 19 clearly show that the gold particle size and the state of the catalyst’s surface had a significant influence on its catalytic activity. In terms of the state of the surface, there was a clear difference between the catalytic activity of the as-synthesised (“oxidised”) and “reduced” Au/SBA-15 catalysts. Although both forms of Au/SBA-15 catalysts were highly active, the reduced catalysts showed higher catalytic activity, which indicates that a clean surface is beneficial.
The particle size of gold also influenced the catalytic activity. For instance, the Au-0.6Mdp/SBA-15 catalyst with most of its gold particle sizes at 1.3 nm (smallest gold particle size) was the only catalyst to attain 100% acetone conversion on Au/SBA-15 as-synthesised form at 280 °C. The other as-synthesised Au/SBA-15 catalysts only attained 75–83% acetone conversion at 280 °C. Furthermore, the reduced Au-0.6Mdp/SBA-15 sample proved to be the most active, attaining 100% acetone conversion at as low as 250 °C. The other reduced Au/SBA-15 catalysts, except for the reduced Au-P/SBA-15 catalyst, achieved 100% acetone conversion between 260–280 °C. The Au-P/SBA-15 catalyst with most of its gold particle sizes at 790 Å was the least active, attaining less than 100% (92%) at 280 °C. However, the presence of some smaller gold particle sizes (50–150 Å) in the Au-P/SBA-15 catalyst might have been responsible for its still high catalytic activity.
Therefore, the Au-0.6Mdp/SBA-15 catalyst with the smallest gold particle sizes (average of 1.9 nm), were well-dispersed and firmly attached to the SBA-15 support, and were provednto be the best Au/SBA-15 catalyst in the complete oxidation of acetone.
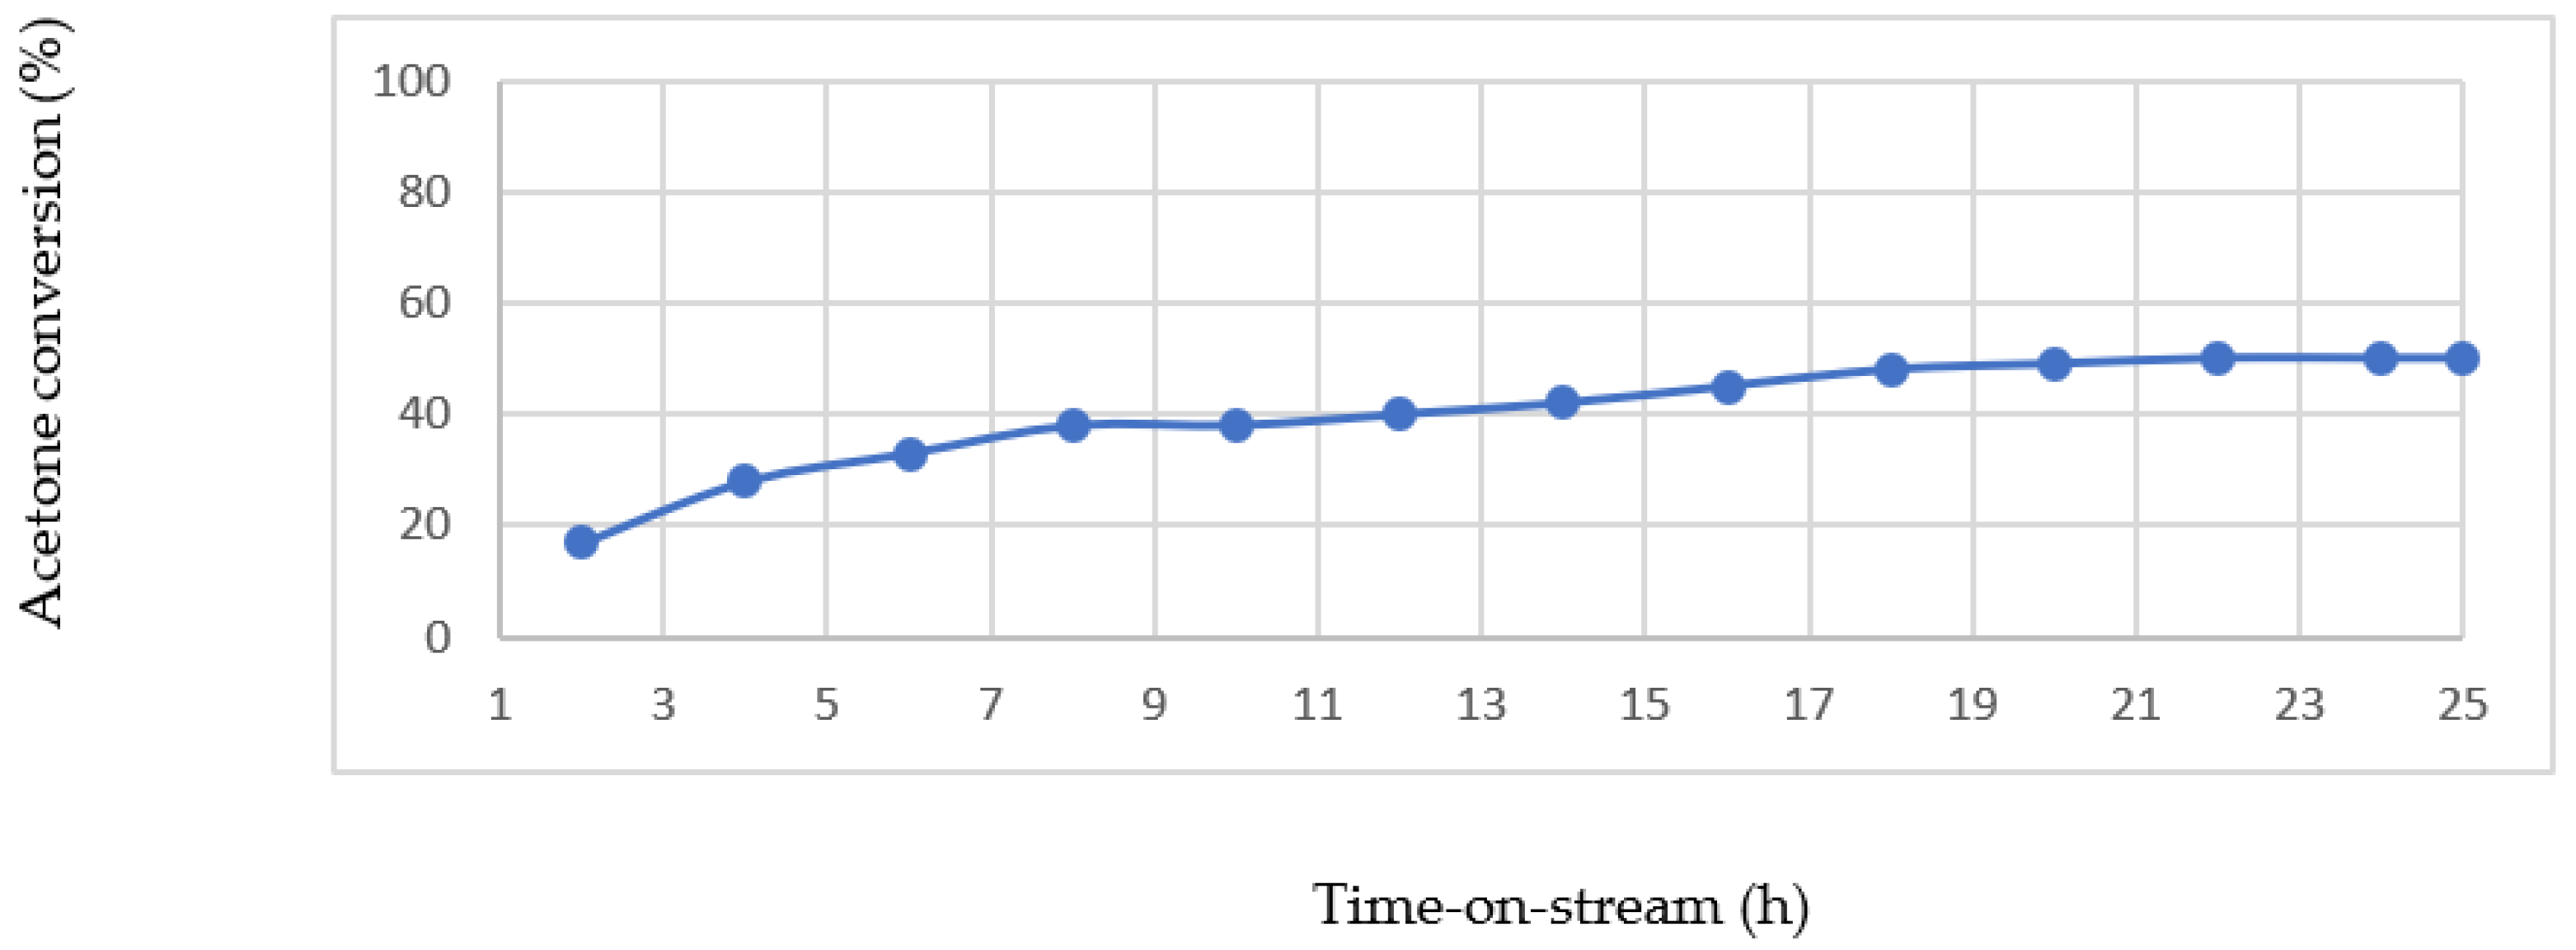
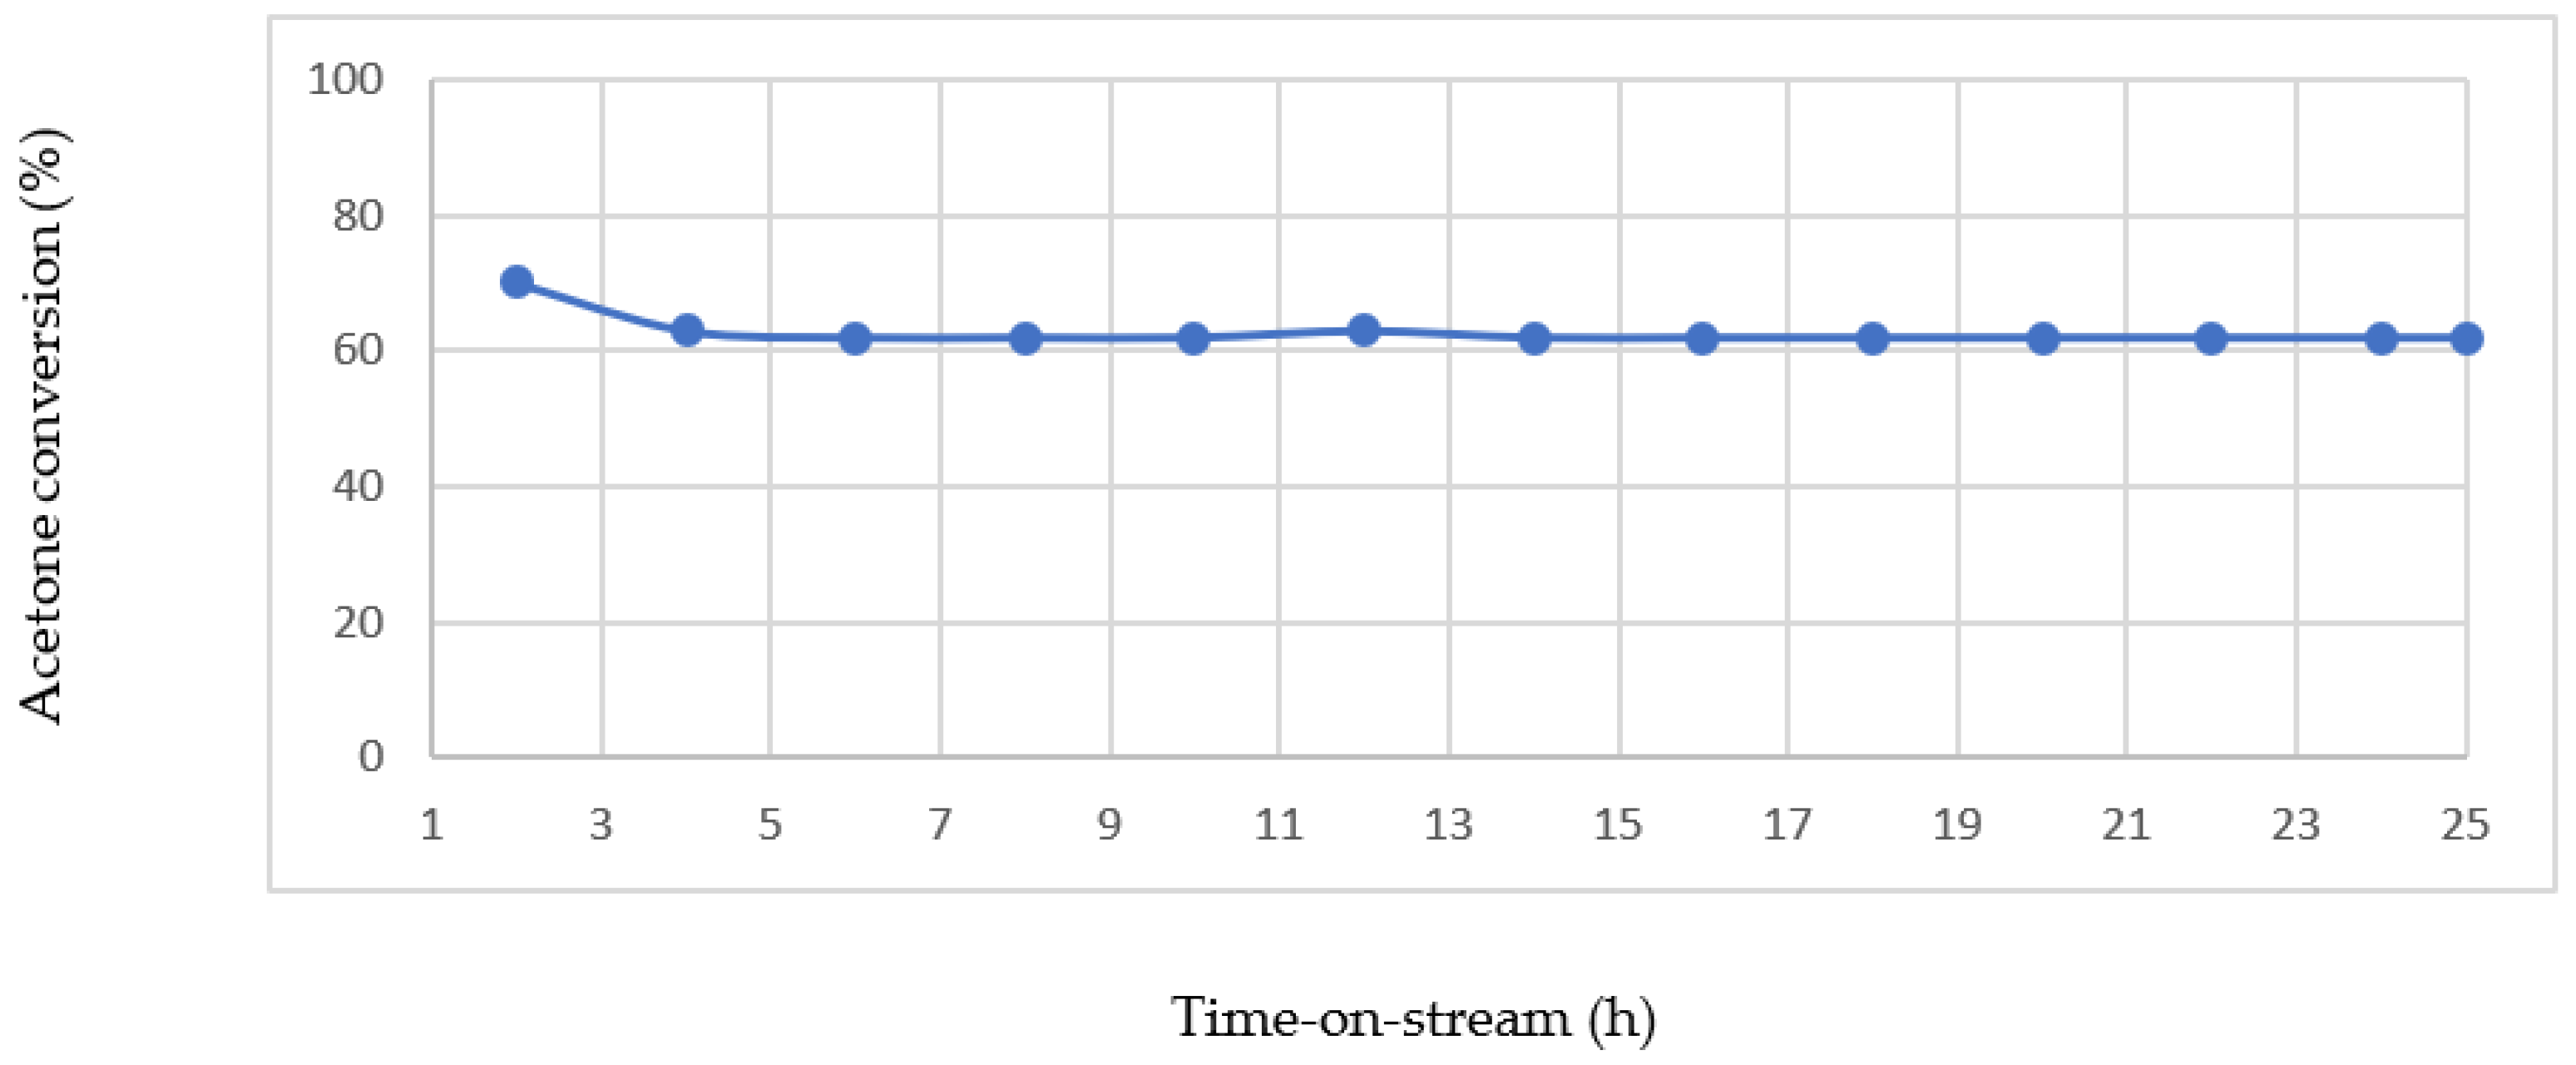
This sample not only showedthe highest catalytic activity towards acetone conversion, but, at the same time, it showed the highest reaction stability for catalyst lifetime tests performed for 25 h in a CFR at 270 °C for the as-synthesised sample, and at 220 °C for the reduced sample.
Stable operation of the as-synthesised Au-0.6Mdp/SBA-15 catalyst (
Figure 20) was achieved after a period of about 18 h at about 50 % acetone conversion. The result show there is a transient behaviour of the oxidised catalyst upon exposure to reaction stream. During this transient period, as explained by Avgouropoulous et al. [
51], the carbon mass balance is deficient, indicating the deposition/adsorption of acetone-derived species on the catalyst surface. As soon as the catalyst surface is saturated, the carbon mass balance is satisfied, and the catalyst exhibits stable behaviour.
For the stability test of the reduced Au-0.6Mdp/SBA-15 sample (
Figure 21), the observed increase in initial catalytic activity was about 4 h without a corresponding increase in CO
2 and H
2O. Gandía and et al. [
52] experienced a similar trend in the complete oxidation of acetone over manganese oxide catalysts. They attributed the initial increase in catalytic activity in about 2 h to the possible retention of a significant amount of unreacted acetone in the catalyst (which explains why there was no observed increase in CO
2 and H
2O formation that corresponding to the seeming increase in acetone conversion), which after saturating the catalyst surface, the reaction was stabilised. Further tests and characterisations may be required however to establish whether the observed initial increase in acetone conversion is as a result of the adsorption of unreacted acetone on the catalyst surface/stabilisation effect.
However, the catalyst stability test results shown in
Figure 18 and
Figure 19 confirm that both the as-synthesised and reduced forms of Au-0.6M dp/SBA-15 catalyst remained highly active and stable with no observed signs of catalyst deactivation over time-on-stream in the acetone complete oxidation reaction.


