
Two-Stage Spatiotemporal Time Series Modelling Approach for Rice Yield Prediction & Advanced Agroecosystem Management

 ,
,  , , ,
, , ,
Abstract
:1. Introduction
2. Materials and Methods
2.1. Description of Existing Models
2.1.1. The STARMA Model
2.1.2. The ARIMA Model
2.1.3. The TDNN Model
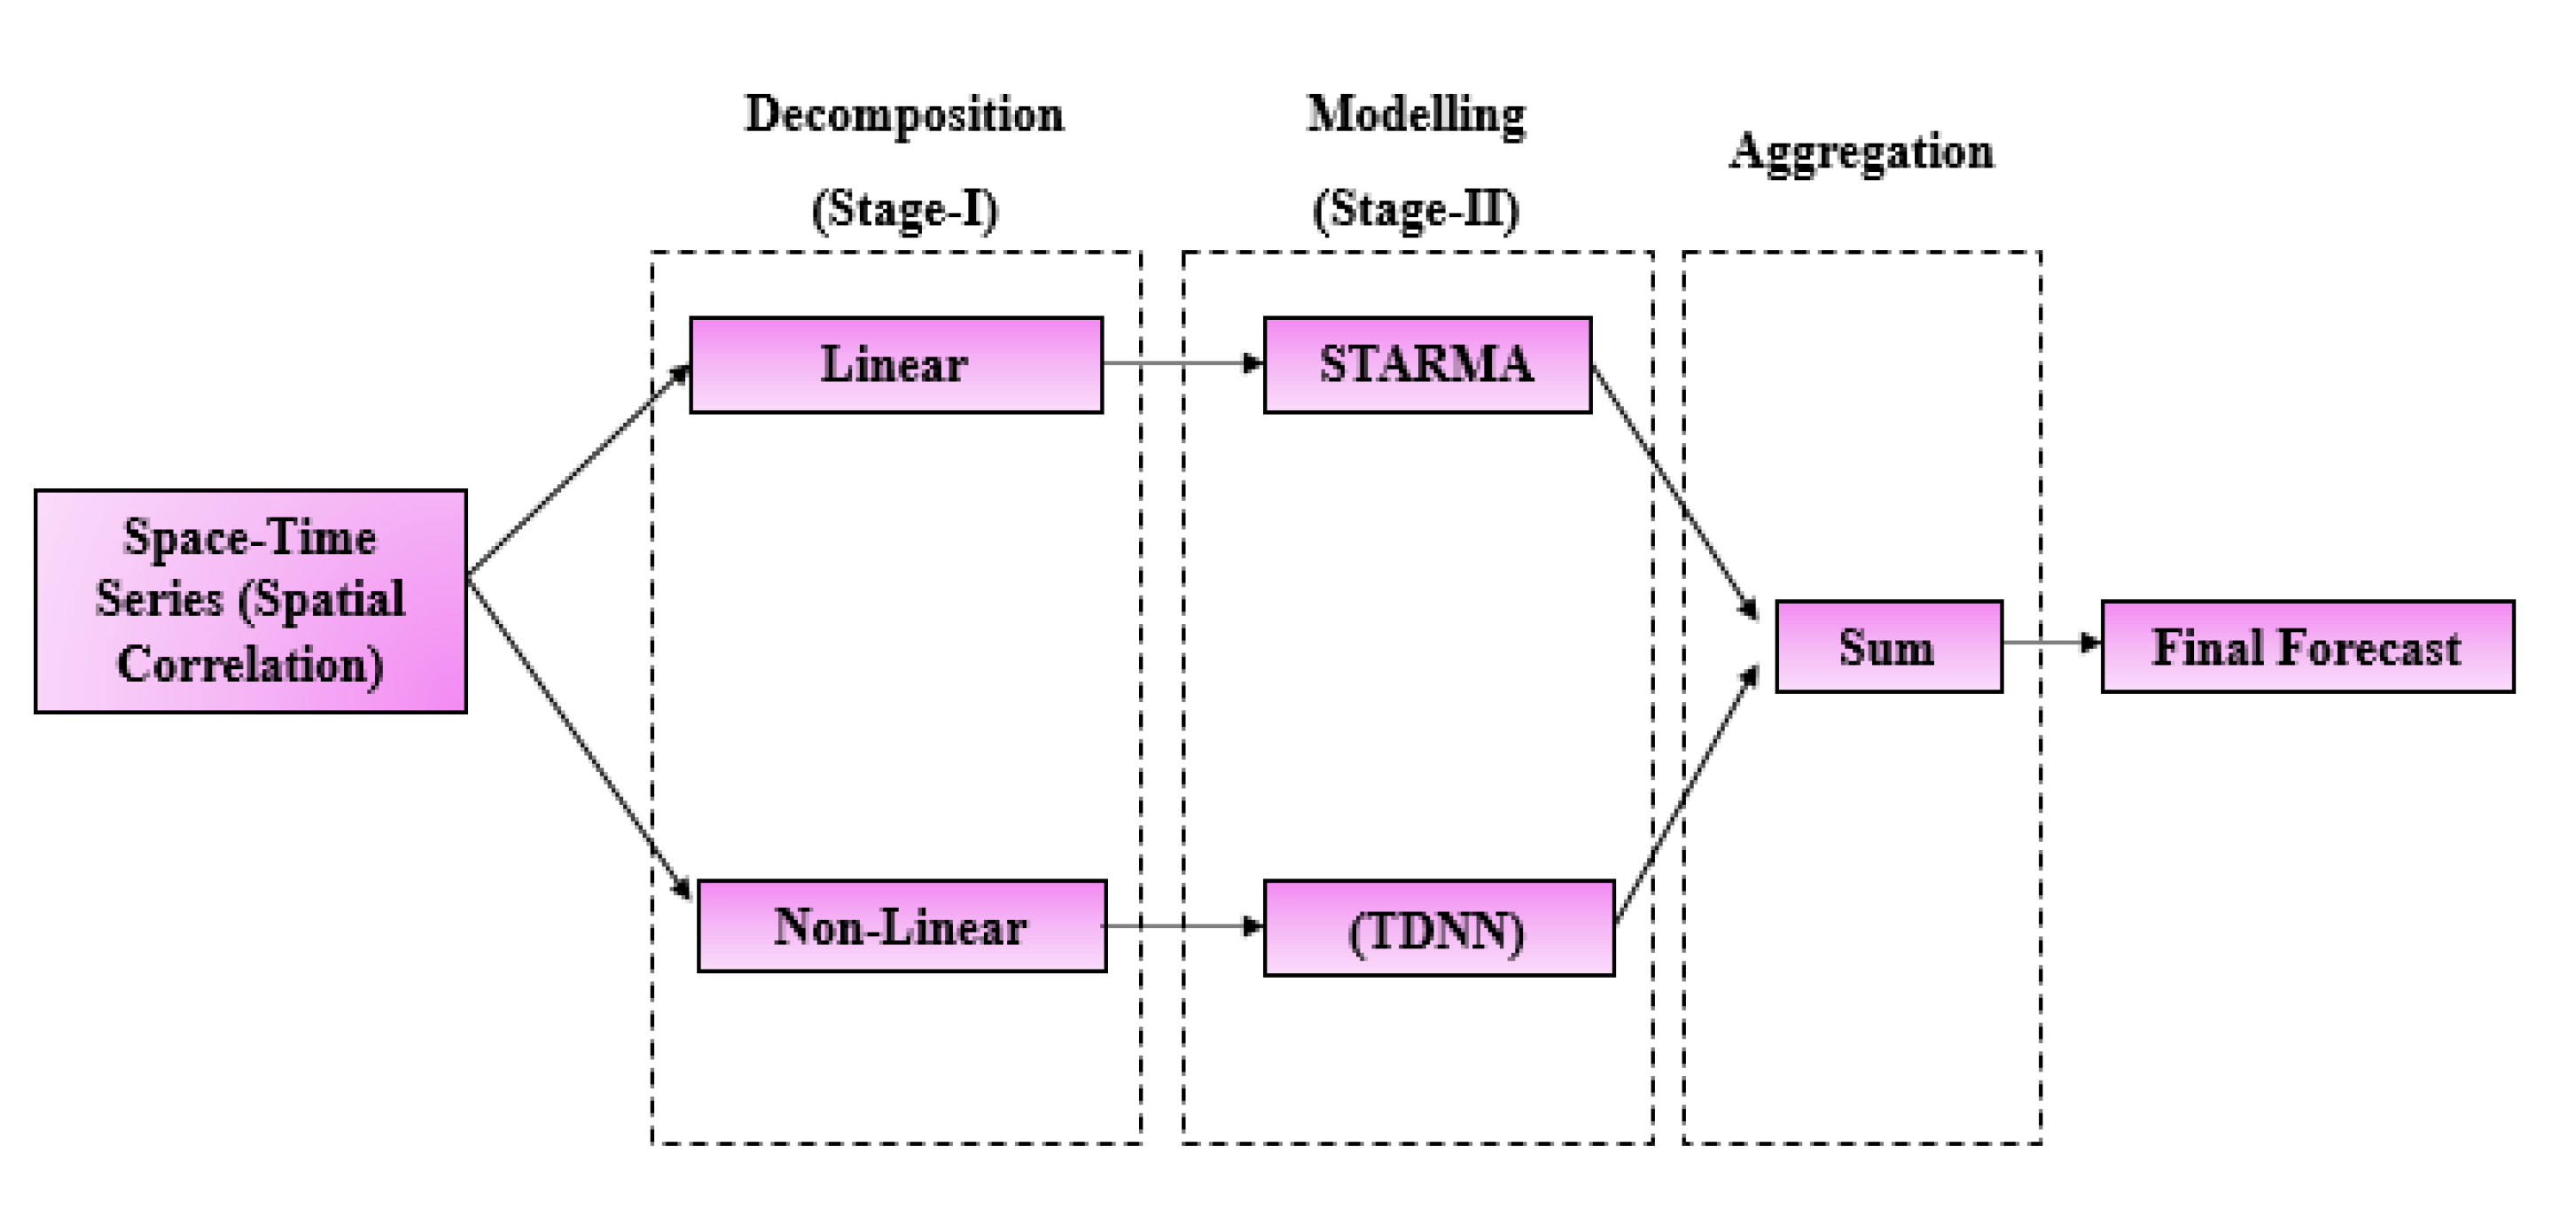
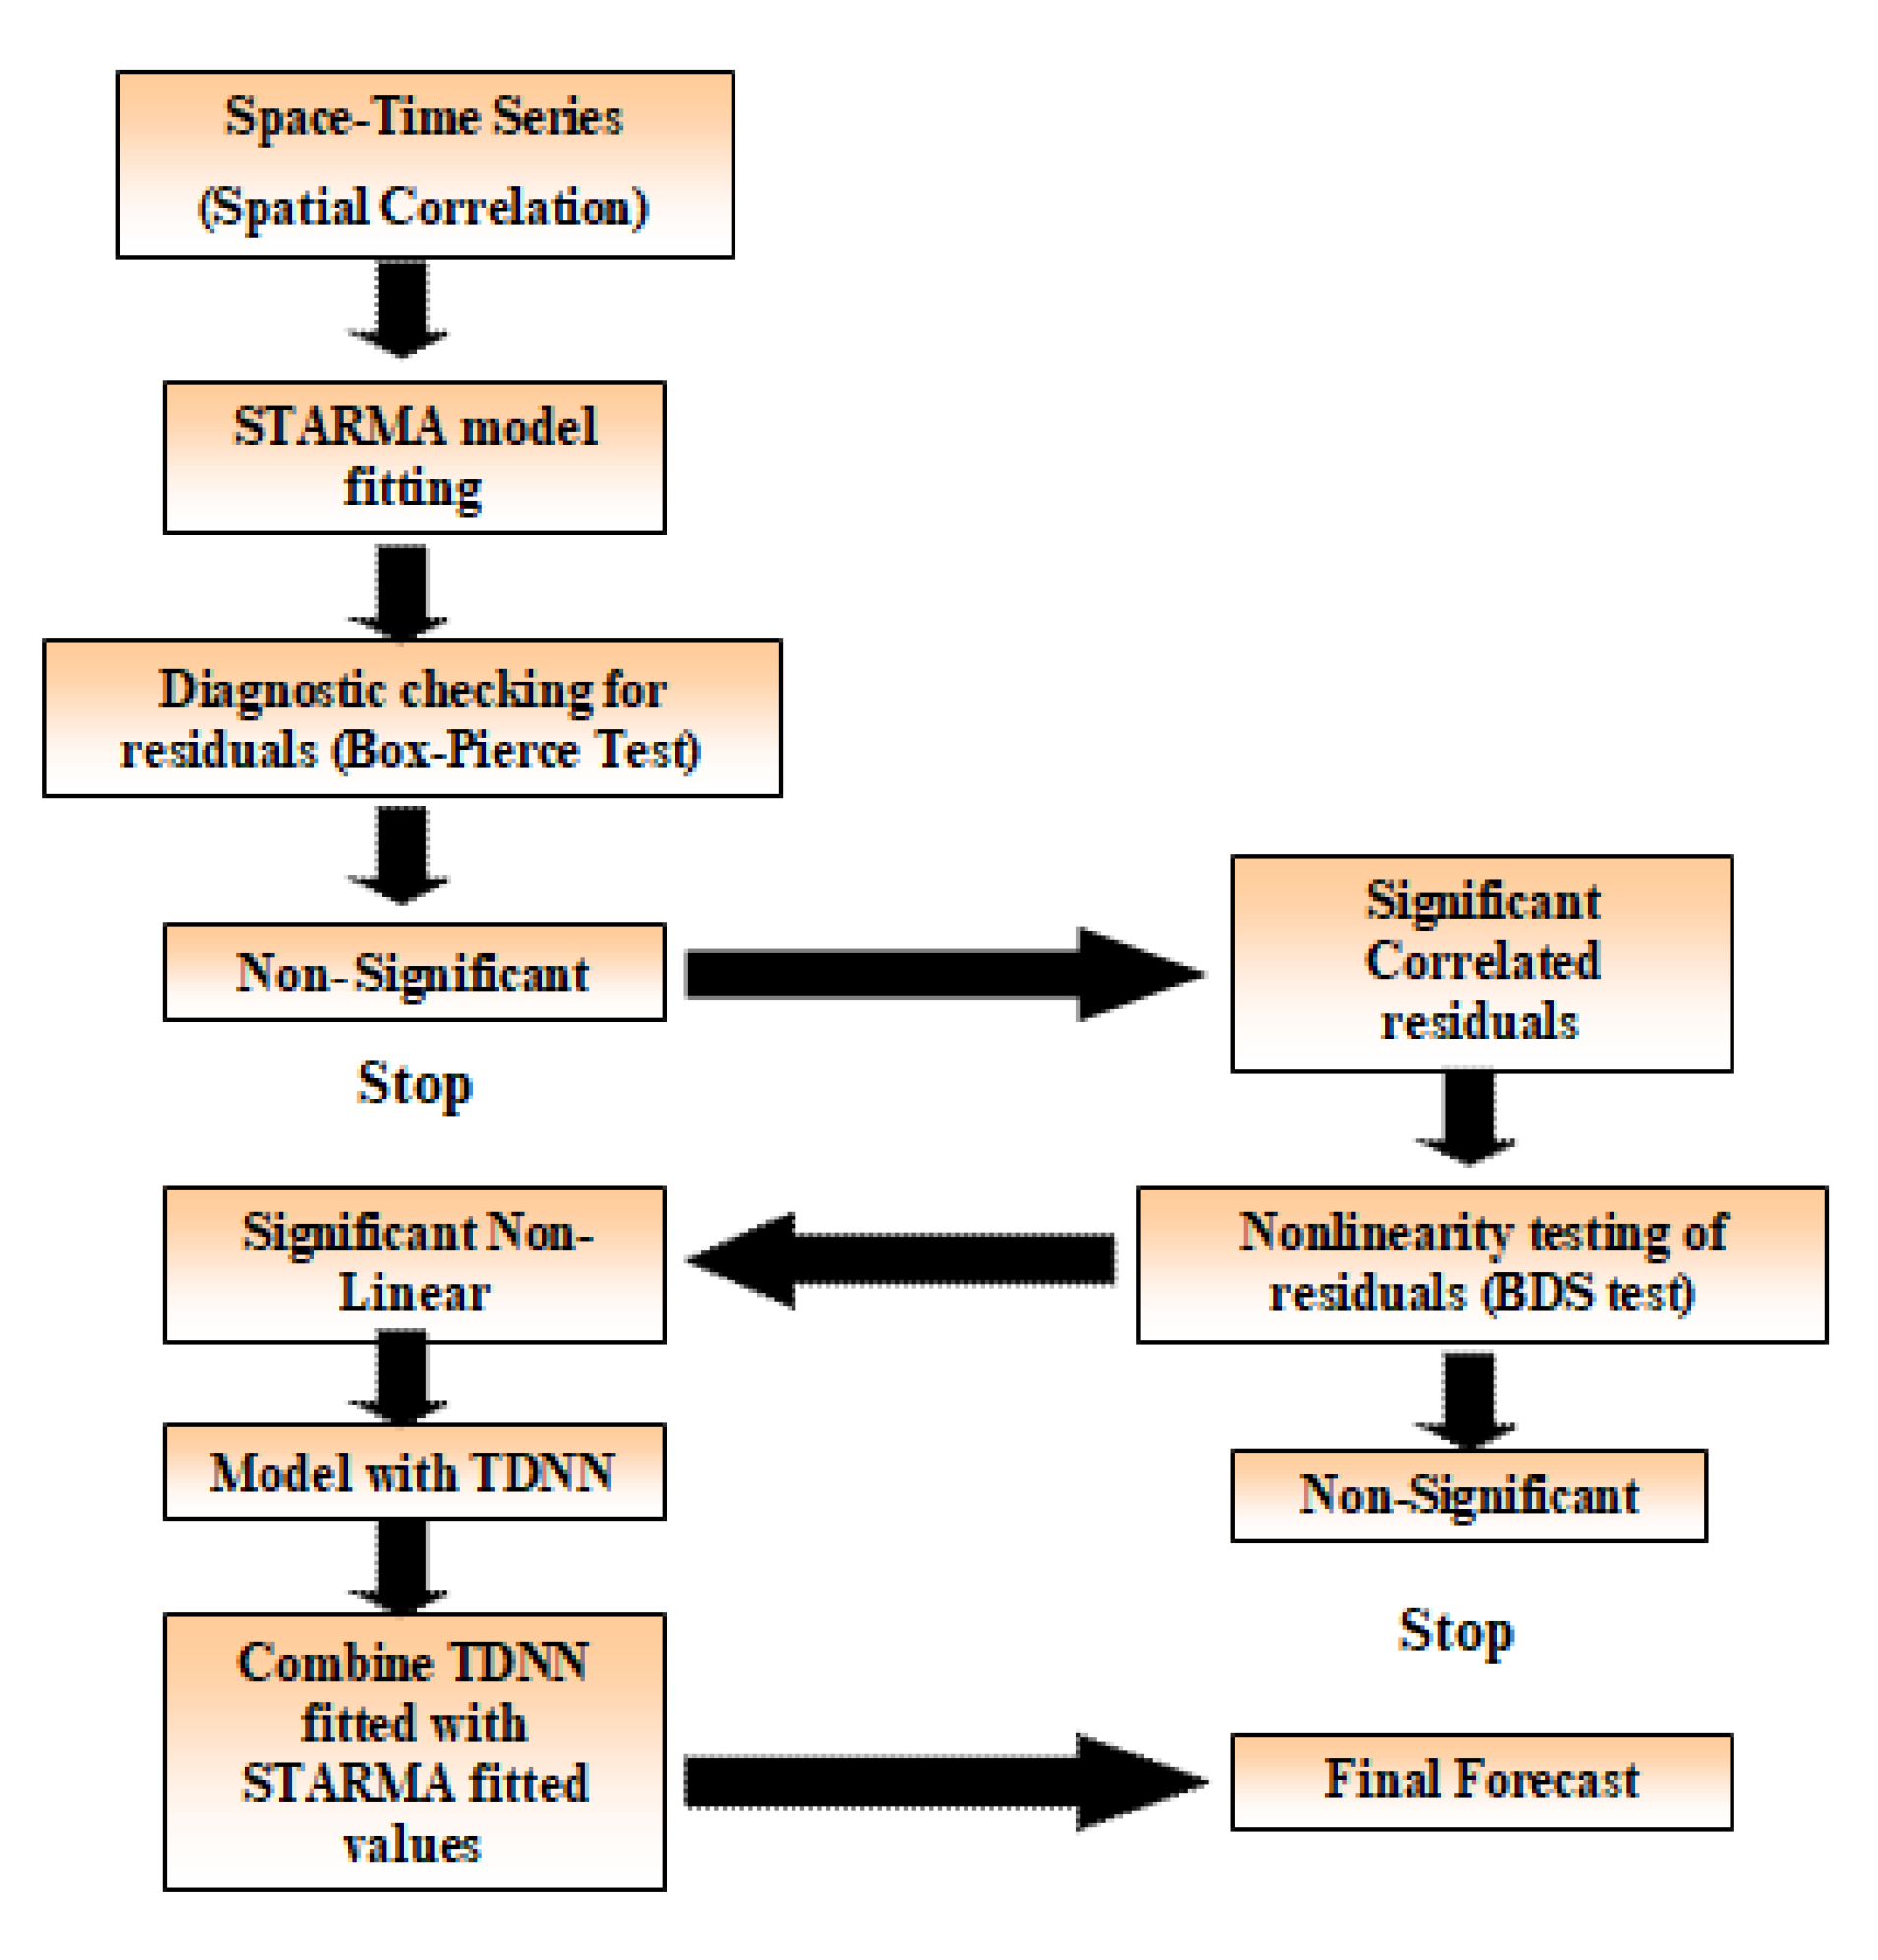
2.2. Description of Proposed Two-Stage STARMA (STARMA-II) Approach
2.3. Testing of the STARMA-II Approach
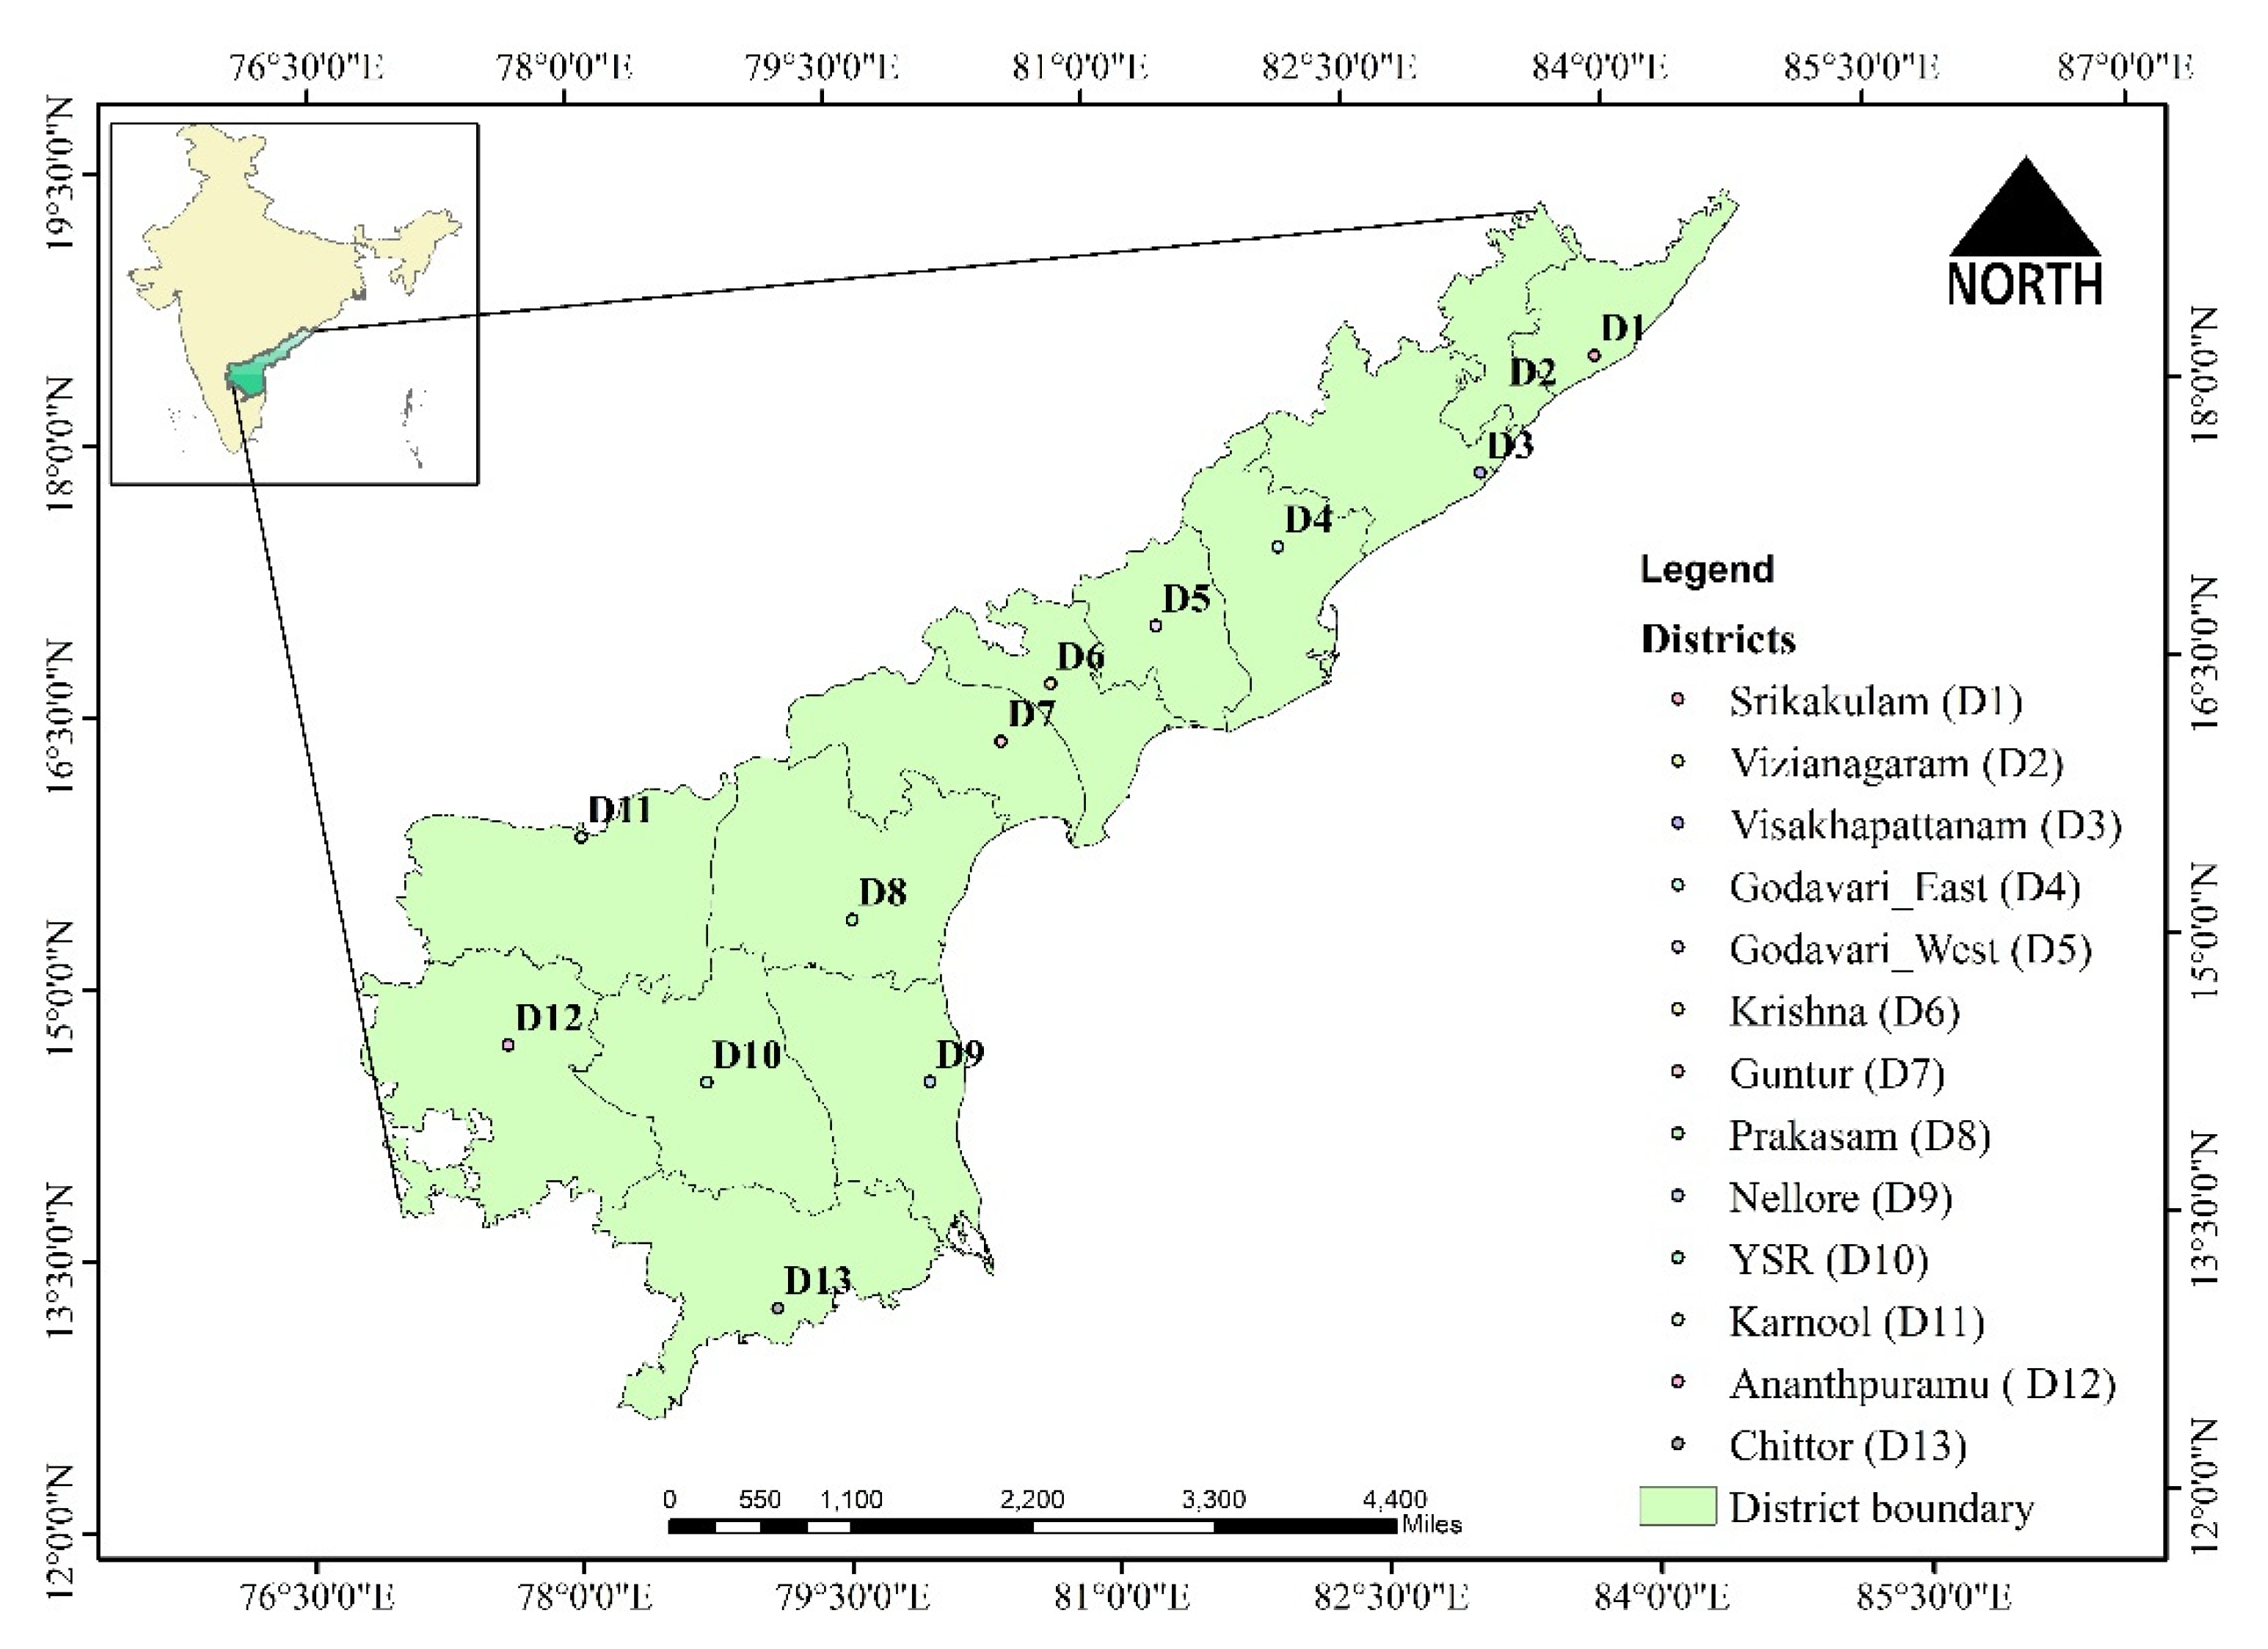
2.4. Study Area Description and Input Data Used in Modelling
3. Results
3.1. Results of the ARIMA Model
3.2. Creating Spatial Weight Matrix
3.3. Results of the STARMA Model
3.4. Results of Proposed STARMA-II Approach
4. Discussion
5. Conclusions
Supplementary Materials
Author Contributions
Funding
Institutional Review Board Statement
Informed Consent Statement
Data Availability Statement
Acknowledgments
Conflicts of Interest
References
- Ondrasek, G.; Rengel, Z. Environmental Salinization Processes: Detection, implications & solutions. Sci. Total Environ. 2021, 754, 142432. [Google Scholar] [CrossRef]
- Ali, S.; Ghosh, B.C.; Osmani, A.G.; Hossain, E.; Fogarassy, C. Farmers’ Climate Change Adaptation Strategies for Reducing the Risk of Rice Production: Evidence from Rajshahi District in Bangladesh. Agronomy 2021, 11, 600. [Google Scholar] [CrossRef]
- Food and Agriculture Organization of the United Nations. FAOSTAT Statistical Database; FAO: Rome, Italy, 2021; Available online: https://www.fao.org/faostat/en/#data (accessed on 21 September 2021).
- Agricultural Statistics at Glance; Ministry of Agriculture & Farmers Welfare Department of Agriculture; Cooperation & Farmers Welfare Directorate of Economics & Statistics; Government of India. 2020. Available online: https://eands.dacnet.nic.in/PDF/At%20a%20Glance%202019%20Eng.pdf (accessed on 21 September 2021).
- Romić, D.; Castrignanò, A.; Romić, M.; Buttafuoco, G.; Bubalo Kovačić, M.; Ondrašek, G.; Zovko, M. Modelling Spatial and Temporal Variability of Water Quality from Different Monitoring Stations using Mixed Effects Model Theory. Sci. Total Environ. 2020, 704, 135875. [Google Scholar] [CrossRef]
- Sein, Z.M.M.; Zhi, X.; Ogou, F.K.; Nooni, I.K.; Lim Kam Sian, K.T.C.; Gnitou, G.T. Spatio-Temporal Analysis of Drought Variability in Myanmar Based on the Standardized Precipitation Evapotranspiration Index (SPEI) and Its Impact on Crop Production. Agronomy 2021, 11, 1691. [Google Scholar] [CrossRef]
- Marino, S.; Alvino, A. Detection of Spatial and Temporal Variability of Wheat Cultivars by High-Resolution Vegetation Indices. Agronomy 2019, 9, 226. [Google Scholar] [CrossRef] [Green Version]
- Giacinto, V.D. A Generalized Space—Time ARMA Model with an Application to Regional Unemployment Analysis in Italy. Int. Reg. Sci. Rev. 2006, 29, 159–198. [Google Scholar] [CrossRef]
- Zhao, P.; Zhou, Y.; Li, F.; Ling, X.; Deng, N.; Peng, S.; Man, J. The Adaptability of APSIM-Wheat Model in the Middle and Lower Reaches of the Yangtze River Plain of China: A Case Study of Winter Wheat in Hubei Province. Agronomy 2020, 10, 981. [Google Scholar] [CrossRef]
- White, M.A.; Diffenbaugh, N.S.; Jones, G.V.; Pal, J.S.; Giorgi, F. Extreme Heat Reduces and Shifts United States Premium Wine Production in the 21st century. Proc. Natl. Acad. Sci. USA 2006, 103, 11217–11222. [Google Scholar] [CrossRef] [PubMed] [Green Version]
- Neuman, K.; Verburg, P.H.; Stehfest, E.; Muller, C. The yield Gap of Global Grain Production: A Spatial Analysis. Agric. Syst. 2010, 103, 316–326. [Google Scholar] [CrossRef]
- Rathod, S.; Gurung, B.; Singh, K.N.; Ray, M. An Improved Space-Time Autoregressive Moving Average (STARMA) Model for Modelling and Forecasting of Spatio-Temporal Time-Series Data. J. Ind. Soc. Agric. Stat. 2018, 72, 239–253. [Google Scholar]
- Sahu, P.K.; Padhi, A.; Patil, G.R.; Mahesh, G.; Sarkar, A.K. Spatial Temporal Analysis of Freight Flow through Indian Major Seaport System. Asian J. Shipp. Logist. 2019, 35, 77–85. [Google Scholar] [CrossRef]
- Saha, A.; Singh, K.N.; Ray, M.; Kumar, S.; Rathod, S. A New Approach for Spatio-Temporal Modelling and Forecasting based on Fuzzy Techniques in conjunction with K-means clustering. J. Ind. Soc. Agric. Stat. 2019, 73, 111–120. [Google Scholar]
- Pfeifer, P.E.; Deutsch, S.J. Seasonal Space-Time ARIMA modelling. Geogr. Anal. 1981, 13, 117–133. [Google Scholar] [CrossRef]
- Pfeifer, P.E.; Deutsch, S.J. Space-Time ARMA Modelling with contemporaneously correlated innovations. Technometrics 1981, 23, 401–409. [Google Scholar]
- Zhao, Y.; Ge, L.; Zhou, Y.; Sun, Z.; Zheng, E.; Wang, X.; Huang, Y.; Cheng, H. A new Seasonal Difference Space-Time Autoregressive Integrated Moving Average (SD-STARIMA) model and spatiotemporal trend prediction analysis for Hemorrhagic Fever with Renal Syndrome (HFRS). PLoS ONE 2018, 13, e0207518. [Google Scholar] [CrossRef] [PubMed]
- Box, G.E.P.; Jenkins, G. Time series analysis. In Forecasting and Control; Holden-Day: San Francisco, CA, USA, 1970. [Google Scholar]
- Rathod, S.; Singh, K.N.; Arya, P.; Ray, M.; Mukherjee, A.; Sinha, K.; Kumar, P.; Shekhawat, R.S. Forecasting maize yield using ARIMA-Genetic Algorithm approach. J. Outlook Agric. 2017, 46, 265–271. [Google Scholar] [CrossRef]
- Pfeifer, P.E.; Deutsch, S.J. A Comparison of Estimation Procedures for the Parameters of the STAR Model. Commun. Stat. Simul. Comput. 1980, 9, 255–270. [Google Scholar] [CrossRef]
- Pfeifer, P.E.; Deutsch, S.J. A Three-Stage Iterative Procedure for Space-Time Modeling. Technometrics 1980, 22, 35–47. [Google Scholar] [CrossRef]
- Pfeifer, P.E.; Deutsch, S.J. Identification and Interpretation of First-Order Space-Time ARMA Models. Technometrics 1980, 22, 397–403. [Google Scholar] [CrossRef]
- Pfeifer, P.E.; Deutsch, S.J. Independence and Sphericity Tests for the residuals of Space Time ARIMA Models. Commun. Stat. Simul. Comput. 1980, 9, 533–549. [Google Scholar] [CrossRef]
- Pfeifer, P.E.; Deutsch, S.J. Variance of the Sample-Time Autocorrelation Function of Contemporaneously Correlated Variables. SIAM J. Appl. Math. Ser. A 1981, 40, 133–136. [Google Scholar] [CrossRef]
- Rathod, S.; Singh, K.N.; Patil, S.G.; Naik, R.H.; Ray, M.; Meena, V.S. Modelling and Forecasting of Oilseed Production of India through Artificial Intelligence Techniques. Indian J. Agric. Sci. 2018, 88, 22–27. [Google Scholar]
- Chitikela, G.; Admala, M.; Ramalingareddy, V.K.; Bandumula, N.; Ondrasek, G.; Sundaram, R.M.; Rathod, S. Artificial-Intelligence-Based Time-Series Intervention Models to Assess the Impact of the COVID-19 Pandemic on Tomato Supply and Prices in Hyderabad, India. Agronomy 2021, 11, 1878. [Google Scholar] [CrossRef]
- Zhang, G.P. Time-Series Forecasting using a Hybrid ARIMA and Neural Network Model. Neurocomputing 2003, 50, 159–175. [Google Scholar] [CrossRef]
- Jha, G.K.; Girish, K.J.; Sinha, K. Time-Delay Neural Networks for Time Series Prediction: An Application to the Monthly Wholesale Price of Oilseeds in India. Neural. Comput. Appl. 2014, 24, 563–571. [Google Scholar] [CrossRef]
- Rathod, S.; Mishra, G.C.; Singh, K.N. Hybrid Time Series Models for Forecasting Banana Production in Karnataka State, India. J. Ind. Soc. Agric. Stat. 2017, 71, 193–200. [Google Scholar]
- Naveena, K.; Singh, S.; Rathod, S.; Singh, A. Hybrid Time Series Modelling for Forecasting the Price of Washed Coffee (Arabica Plantation Coffee) in India. Int. J. Agric. Sci. 2017, 9, 4004–4007. [Google Scholar]
- Rathod, S.; Mishra, G.C. Statistical Models for Forecasting Mango and Banana Yield of Karnataka, India. J. Agri. Sci. Technol. 2018, 20, 803–816. [Google Scholar]
- Alam, W.; Ray, M.; Kumar, R.R.; Sinha, K.S.; Singh, K.N. Improved ARIMAX modal based on ANN and SVM approaches for forecasting rice yield using weather variables. Indian J. Agric. Sci. 2018, 88, 1909–1913. [Google Scholar]
- Alam, W.; Sinha, K.; Kumar, R.R.; Ray, M.; Rathod, S.; Singh, K.N.; Arya, P. Hybrid linear time series approach for long term forecasting of crop yield. Indian J. Agric. Sci. 2018, 88, 1275–1279. [Google Scholar]
- Cheng, T.; Wang, J. Application of a Dynamic Recurrent Neural Network in Spatio-Temporal Forecasting in Information Fusion and Geographic Information Systems Germany; Springer: Berlin, Germany, 2007; pp. 173–186. [Google Scholar]
- Saputro, D.R.S.; Putri, I.M.; Noor, N.H.; Widyaningsih, P. Generalized Space Time Autoregressive (gstar)-Artificial Neural Network (ANN) Model with Multilayer Feedforward Networks Architecture. IOP Conf. Ser. Earth Environ. Sci. 2019, 243, 012039. [Google Scholar] [CrossRef]
- Konduri, V.S.; Vandal, T.J.; Ganguly, S.; Ganguly, A.R. Data Science for Weather Impacts on Crop Yield. Front. Sustain. Food Syst. 2020, 4, 52. [Google Scholar] [CrossRef]
- Saha, A.; Singh, K.N.; Ray, M.; Rathod, S. A hybrid spatio-temporal modelling: An application to space-time rainfall forecasting. Theor. Appl. Climatol. 2020, 142, 1271–1282. [Google Scholar] [CrossRef]
- Brock, W.; Scheinkman, J.A.; Dechert, W.D.; LeBaron, B. A Test for Independence Based on the Correlation Dimension. Eco. Rev. 1996, 15, 197–235. [Google Scholar] [CrossRef]
- Diebold, F.X.; Mariano, R.S. Comparing predictive accuracy. J. Bus. Econ. Stat. 1995, 13, 253–263. [Google Scholar]
- Agricultural Statistics at Glance; Directorate of Economics and Statistics; Government of Andhra Pradesh. 2020. Available online: https://foodprocessingindia.gov.in/uploads/publication/Agricultural-statistics-at-a-Glance-2020.pdf (accessed on 29 January 2021).
- Subba, R.T.; Antunes, A. 2003 Spatio-Temporal Modelling of Temperature Time Series: A Comparative Study. In Time Series Analysis and Applications to Geophysical Systems; Schonberg, F.P., Brillinger, D.R., Robinson, E.A., Eds.; IMA Publications/Springer: New York, NY, USA, 2003; pp. 123–150. [Google Scholar]
- Yin, X.; Kropff, M.J.; McLeare, G.; Visperas, R.M. A nonlinear model for crop development as a function of temperature. Agric. For. Meteorol. 1995, 77, 1–16. [Google Scholar] [CrossRef] [Green Version]
- Yin, X.; Kropff, M.J.; Ellis, R.H. Rice flowering in response to diurnal temperature amplitude. Field Crop. Rese. 1996, 48, 1–9. [Google Scholar] [CrossRef]
- Piyal Ekanayake, P.; Rankothge, W.; Weliwatta, R. Machine Learning Modelling of the Relationship between Weather and Paddy Yield in Sri Lanka. J. Math. 2021, 2021, 9941899. [Google Scholar] [CrossRef]
- Yin, X.; Kropff, M.J.; Goudriaan, J. Differential Effects of Day and Night Temperature on Development to Flowering in Rice. Anna Bota 1996, 77, 203–213. [Google Scholar] [CrossRef] [Green Version]
- Alam, M.N.; Effendy. Identifying Factors Influencing Production and Rice Farming Income with Approach of Path Analysis. Am. J. Agric. Biol. Sci. 2017, 12, 39–43. [Google Scholar] [CrossRef]
- Prasanna, P.A.L.; Kumar, S.; Singh, A. Rice Production in India—Implications of Land Inequity and Market Imperfections. Agri. Econ. Res. Rev. 2009, 22, 431–442. [Google Scholar]
- Sunandini, G.P.; Paul, K.S.R.; Irugu, S.D. Analysis of Trends, Growth and Instability in Rice Production in Andhra Pradesh. Curr. J. Appl. Sci. Technol. 2020, 39, 40–46. [Google Scholar] [CrossRef]
- Lee, C.Y. Space-Time Modelling and Application to Emerging Infectious Diseases. Ph.D. Thesis, Michigan State University, East Lansing, MI, USA, 2005. [Google Scholar]


| District | Model | AR (1) | MA(1) | Box-Pierce Test | |
|---|---|---|---|---|---|
| Original | Residuals | ||||
| Srikakulam | ARIMA (0, 0, 1) | 0.69 (<0.0001) | 8.74 | 1.3 × 10⁻⁶ | |
| (0.003) | (0.99) | ||||
| Vizianagaram | ARIMA (1, 0, 0) | 0.46 | 4.3 | 0.19 | |
| (0.01) | (0.03) | (0.65) | |||
| Visakhapattanam | ARIMA (0, 0, 1) | 0.48 (0.0008) | 11.97 | 1.52 | |
| (0.0005) | (0.21) | ||||
| Godavari_East | ARIMA (1, 1, 0) | −0.475 | 5.26 | 0.88 | |
| (0.103) | (0.02) | (0.34) | |||
| Godavari_West | ARIMA (1, 1, 0) | −0.387 | 3.95 | 0.22 | |
| (0.121) | (0.02) | (0.63) | |||
| Krishna | ARIMA (0, 0, 1) | 0.46 (0.02) | 3.23 | 0.01 | |
| (0.07) | (0.89) | ||||
| Guntur | ARIMA (1, 0, 0) | 0.42 | 3.03 | 0.2 | |
| (0.03) | (0.08) | (0.65) | |||
| Prakasam | ARIMA (0, 0, 1) | 0.53 (0.008) | 6.58 | 0.02 | |
| (0.01) | (0.86) | ||||
| Nellore | ARIMA (0, 0, 1) | 0.80 (<0.0001) | 12.44 | 2.22 | |
| (0.0004) | (0.13) | ||||
| YSR | ARIMA (0, 0, 1) | 0.53 (0.006) | 6.9 | 0.13 | |
| (0.008) | (0.71) | ||||
| Karnool | ARIMA (0, 0, 1) | 0.84 (<0.0001) | 9.52 | 0.21 | |
| (0.002) | (0.64) | ||||
| Ananthpuramu | ARIMA (1, 0, 0) | 0.39 | 3.93 | 0.13 | |
| (0.02) | (0.04) | (0.712) | |||
| Chittoor | ARIMA (0, 0, 1) | 0.52 (0.0003) | 11.44 | 1.15 | |
| (0.0007) | (0.28) | ||||
| Criteria’s | Slag1 | Slag2 | Slag3 | Slag-KNN |
|---|---|---|---|---|
| BIC | 536.87 | 539.26 | 549.08 | 532.91 |
| Log Likelihood | −256.71 | −257.9 | −258.55 | −254.23 |
| D1 | D2 | D3 | D4 | D5 | D6 | D7 | D8 | D9 | D10 | D11 | D12 | D13 | |
|---|---|---|---|---|---|---|---|---|---|---|---|---|---|
| D1 | 0 | 0.65 | 0 | 0 | 0 | 0 | 0 | 0 | 0 | 0 | 0 | 0 | 0 |
| D2 | 0 | 0 | 0.64 | 0 | 0 | 0 | 0 | 0 | 0 | 0 | 0 | 0 | 0 |
| D3 | 0 | 0.64 | 0 | 0 | 0 | 0 | 0 | 0 | 0 | 0 | 0 | 0 | 0 |
| D4 | 0 | 0 | 0 | 0 | 0.93 | 0 | 0 | 0 | 0 | 0 | 0 | 0 | 0 |
| D5 | 0 | 0 | 0 | 0 | 0 | 0.78 | 0 | 0 | 0 | 0 | 0 | 0 | 0 |
| D6 | 0 | 0 | 0 | 0 | 0 | 0 | 0.94 | 0 | 0 | 0 | 0 | 0 | 0 |
| D7 | 0 | 0 | 0 | 0 | 0 | 0.94 | 0 | 0 | 0 | 0 | 0 | 0 | 0 |
| D8 | 0 | 0 | 0 | 0 | 0 | 0 | 0 | 0 | 0.9 | 0 | 0 | 0 | 0 |
| D9 | 0 | 0 | 0 | 0 | 0 | 0 | 0 | 0.9 | 0 | 0 | 0 | 0 | 0 |
| D10 | 0 | 0 | 0 | 0 | 0 | 0 | 0 | 0 | 0 | 0 | 0 | 0.67 | 0 |
| D11 | 0 | 0 | 0 | 0 | 0 | 0 | 0 | 0 | 0 | 0 | 0 | 0.52 | 0 |
| D12 | 0 | 0 | 0 | 0 | 0 | 0 | 0 | 0 | 0 | 0.675 | 0 | 0 | 0 |
| D13 | 0 | 0 | 0 | 0 | 0 | 0 | 0 | 0 | 0 | 0.674 | 0 | 0 | 0 |
| STARMA , , | Slag 0 | Slag 1 | Multivariate Box-Pierce Non-Correlation Test | ||
|---|---|---|---|---|---|
| For Original Series | For Residuals | ||||
| Estimate | 0.86 | 0.14 | −0.28 | 5520.536 (p < 0.0001) | 113.86 (p < 0.0001) |
| S.E. | 0.078 | 0.079 | 0.148 | ||
| Probability | (<0.0001) | (0.06) | (0.05) | ||
| District | Dimension | |||||||
|---|---|---|---|---|---|---|---|---|
| m = 2 | m = 3 | |||||||
| Srikakulam | 1.60 | 0.29 | 2.62 | 2.91 | −5.74 | −0.57 | 1.65 | 2.36 |
| (0.10) | (0.77) | (0.008) | (0.003) | (<0.001) | (0.560) | (0.09) | (0.01) | |
| Vizianagaram | 1.38 | 4.51 | 4.27 | 4.08 | 22.14 | 1.56 | 3.41 | 3.61 |
| (<0.001) | (<0.001) | (<0.001) | (<0.001) | (<0.001) | (0.11) | (<0.001) | (<0.001) | |
| Visakhapattanam | 6.28 | 12.83 | 11.20 | 8.89 | 6.20 | 15.12 | 11.10 | 8.79 |
| (<0.001) | (<0.001) | (<0.001) | (<0.001) | (<0.001) | (<0.001) | (<0.001) | (<0.001) | |
| Godavari_East | −2.93 | 1.85 | 1.73 | 2.77 | −4.69 | 0.94 | 1.33 | 1.70 |
| (0.003) | (0.06) | (0.08) | (0.005) | (<0.001) | (0.34) | (0.18) | (0.08) | |
| Godavari_West | −1.03 | 1.48 | 4.64 | 6.18 | 0.86 | 1.32 | 3.82 | 5.88 |
| (0.29) | (0.13) | (<0.001) | (<0.001) | (0.38) | (0.18) | (<0.001) | (<0.001) | |
| Krishna | −0.71 | 4.02 | 5.58 | 7.01 | −3.24 | 4.03 | 5.87 | 7.04 |
| (0.47) | (<0.001) | (<0.001) | (<0.001) | (0.001) | (<0.001) | (<0.001) | (<0.001) | |
| Guntur | 24.29 | 9.10 | 7.77 | 7.75 | 44.66 | 11.54 | 9.58 | 7.56 |
| (<0.001) | (<0.001) | (<0.001) | (<0.001) | (<0.001) | (<0.001) | (<0.001) | (<0.001) | |
| Prakasam | 65.69 | 0.05 | 2.55 | 1.47 | 202.25 | −0.02 | 4.28 | 3.40 |
| (<0.001) | (0.95) | (0.01) | (0.14) | (<0.001) | (0.97) | (<0.001) | (<0.001) | |
| Nellore | 8.32 | 5.86 | 5.69 | 5.80 | 46.59 | 9.58 | 8.77 | 9.39 |
| (<0.001) | (<0.001) | (<0.001) | (<0.001) | (<0.001) | (<0.001) | (<0.001) | (<0.001) | |
| YSR | 9.84 | −1.74 | 0.35 | −0.55 | 12.25 | 1.61 | 2.09 | 1.60 |
| (<0.001) | (0.08) | (0.72) | (0.57) | (<0.001) | (0.10) | (0.03) | (0.10) | |
| Karnool | −89.84 | 3.92 | 5.45 | 4.00 | 118.41 | 19.71 | 5.70 | 4.42 |
| (<0.001) | (<0.001) | (<0.001) | (<0.001) | (<0.001) | (<0.001) | (<0.001) | (<0.001) | |
| Ananthpuramu | −2.00 | −2.14 | −1.89 | −4.01 | −1.97 | −0.76 | −0.57 | −1.62 |
| (0.04) | (0.03) | (0.05) | (0.0001) | (0.04) | (0.44) | (0.56) | (0.10) | |
| Chittoor | 3.79 | −1.15 | −0.09 | −0.37 | 3.19 | −0.97 | 1.34 | 0.44 |
| (0.001) | (0.24) | (0.92) | (0.70) | (0.001) | (0.32) | (0.17) | (0.65) | |
| District | MAPE | |||||
|---|---|---|---|---|---|---|
| ARIMA | STARMA | STARMA-II | ||||
| Training | Testing | Training | Testing | Training | Testing | |
| Srikakulam | 12.13 | 42.78 | 11.95 | 15.00 | 9.42 | 11.54 |
| Vizianagaram | 12.41 | 46.44 | 10.83 | 12.77 | 6.81 | 8.94 |
| Visakhapattanam | 16.47 | 46.85 | 15.72 | 16.10 | 10.10 | 9.80 |
| Godavari_East | 12.54 | 38.66 | 11.03 | 10.65 | 9.48 | 8.68 |
| Godavari_West | 11.16 | 37.40 | 9.76 | 13.61 | 6.88 | 6.68 |
| Krishna | 9.27 | 47.65 | 7.99 | 10.09 | 3.12 | 5.64 |
| Guntur | 10.72 | 46.98 | 9.24 | 10.29 | 8.42 | 9.40 |
| Prakasam | 14.83 | 43.11 | 11.67 | 13.10 | 5.99 | 6.84 |
| Nellore | 11.43 | 49.19 | 8.53 | 10.80 | 6.07 | 7.37 |
| YSR | 16.01 | 36.27 | 13.01 | 14.62 | 6.95 | 7.35 |
| Karnool | 10.93 | 46.81 | 10.19 | 14.45 | 4.69 | 6.91 |
| Ananthpuramu | 12.46 | 37.62 | 11.18 | 14.48 | 8.04 | 10.13 |
| Chittoor | 14.28 | 51.78 | 11.67 | 14.31 | 7.66 | 9.18 |
| District | ARIMA & STARMA | ARIMA & STARMA-II | STARMA & STARIMA-II | |||
|---|---|---|---|---|---|---|
| DM Statistics | Probability | DM Statistics | Probability | DM Statistics | Probability | |
| Srikakulam | 1.89 | 0.0680 | 2.24 | 0.0331 | 3.39 | 0.0021 |
| Vizianagaram | 2.37 | 0.0241 | 2.58 | 0.0150 | 2.82 | 0.0086 |
| Visakhapattanam | 2.19 | 0.0364 | 2.30 | 0.0284 | 1.42 | 0.1654 |
| Godavari_East | 2.61 | 0.0142 | 2.68 | 0.0143 | 2.03 | 0.0517 |
| Godavari_West | 2.62 | 0.0141 | 2.72 | 0.0113 | 2.04 | 0.0511 |
| Krishna | 2.42 | 0.0222 | 1.67 | 0.0956 | −1.55 | 0.1127 |
| Guntur | 2.40 | 0.0231 | 2.42 | 0.0219 | 1.78 | 0.0781 |
| Prakasam | 2.67 | 0.0123 | 2.99 | 0.0056 | 3.41 | 0.0019 |
| Nellore | 2.59 | 0.0147 | 2.66 | 0.0125 | 1.91 | 0.0655 |
| YSR | 2.57 | 0.0156 | 2.79 | 0.0092 | 2.02 | 0.0527 |
| Karnool | 2.24 | 0.0329 | 2.45 | 0.0207 | 4.32 | 0.0001 |
| Ananthpuramu | 2.16 | 0.0383 | 2.35 | 0.0258 | 2.25 | 0.0325 |
| Chittoor | 2.56 | 0.0162 | 2.70 | 0.0117 | 1.77 | 0.0867 |
Publisher’s Note: MDPI stays neutral with regard to jurisdictional claims in published maps and institutional affiliations. |
© 2021 by the authors. Licensee MDPI, Basel, Switzerland. This article is an open access article distributed under the terms and conditions of the Creative Commons Attribution (CC BY) license (https://creativecommons.org/licenses/by/4.0/).
Share and Cite
Rathod, S.; Saha, A.; Patil, R.; Ondrasek, G.; Gireesh, C.; Anantha, M.S.; Rao, D.V.K.N.; Bandumula, N.; Senguttuvel, P.; Swarnaraj, A.K.; et al. Two-Stage Spatiotemporal Time Series Modelling Approach for Rice Yield Prediction & Advanced Agroecosystem Management. Agronomy 2021, 11, 2502. https://doi.org/10.3390/agronomy11122502
Rathod S, Saha A, Patil R, Ondrasek G, Gireesh C, Anantha MS, Rao DVKN, Bandumula N, Senguttuvel P, Swarnaraj AK, et al. Two-Stage Spatiotemporal Time Series Modelling Approach for Rice Yield Prediction & Advanced Agroecosystem Management. Agronomy. 2021; 11(12):2502. https://doi.org/10.3390/agronomy11122502
Chicago/Turabian StyleRathod, Santosha, Amit Saha, Rahul Patil, Gabrijel Ondrasek, Channappa Gireesh, Madhyavenkatapura Siddaiah Anantha, Dhumannatarao Venkata Krishna Nageswara Rao, Nirmala Bandumula, Ponnuvel Senguttuvel, Arun Kumar Swarnaraj, and et al. 2021. "Two-Stage Spatiotemporal Time Series Modelling Approach for Rice Yield Prediction & Advanced Agroecosystem Management" Agronomy 11, no. 12: 2502. https://doi.org/10.3390/agronomy11122502
APA StyleRathod, S., Saha, A., Patil, R., Ondrasek, G., Gireesh, C., Anantha, M. S., Rao, D. V. K. N., Bandumula, N., Senguttuvel, P., Swarnaraj, A. K., Meera, S. N., Waris, A., Jeyakumar, P., Parmar, B., Muthuraman, P., & Sundaram, R. M. (2021). Two-Stage Spatiotemporal Time Series Modelling Approach for Rice Yield Prediction & Advanced Agroecosystem Management. Agronomy, 11(12), 2502. https://doi.org/10.3390/agronomy11122502