A before-after-control-intervention (BACI) study design was used [
10,
11,
12,
13] to evaluate the hydrologic response of meadow restoration to remove encroached conifers and upslope forest thinning. Linear regression was used to develop pre-restoration and post-restoration relationships between Marian Meadow, the intervention, or treated site, and a Control Meadow (
Figure 1). Statistical comparisons of the intercepts and slopes of the pre-regression and post-regression relationships were used to attempt to detect a change in the hydrologic response. Changes to intercepts or slopes of the relationships can reflect a change to the magnitude and/or timing of hydrologic responses to restoration. A simple water budget approach using soil moisture, depth to groundwater, and climate data was used to attempt to validate the statistical analysis and identify processes that influenced the hydrologic response [
10,
14]. Number of days of specific shallow depths to groundwater during the growing season was used to indicate efficacy of the restoration treatment [
15].
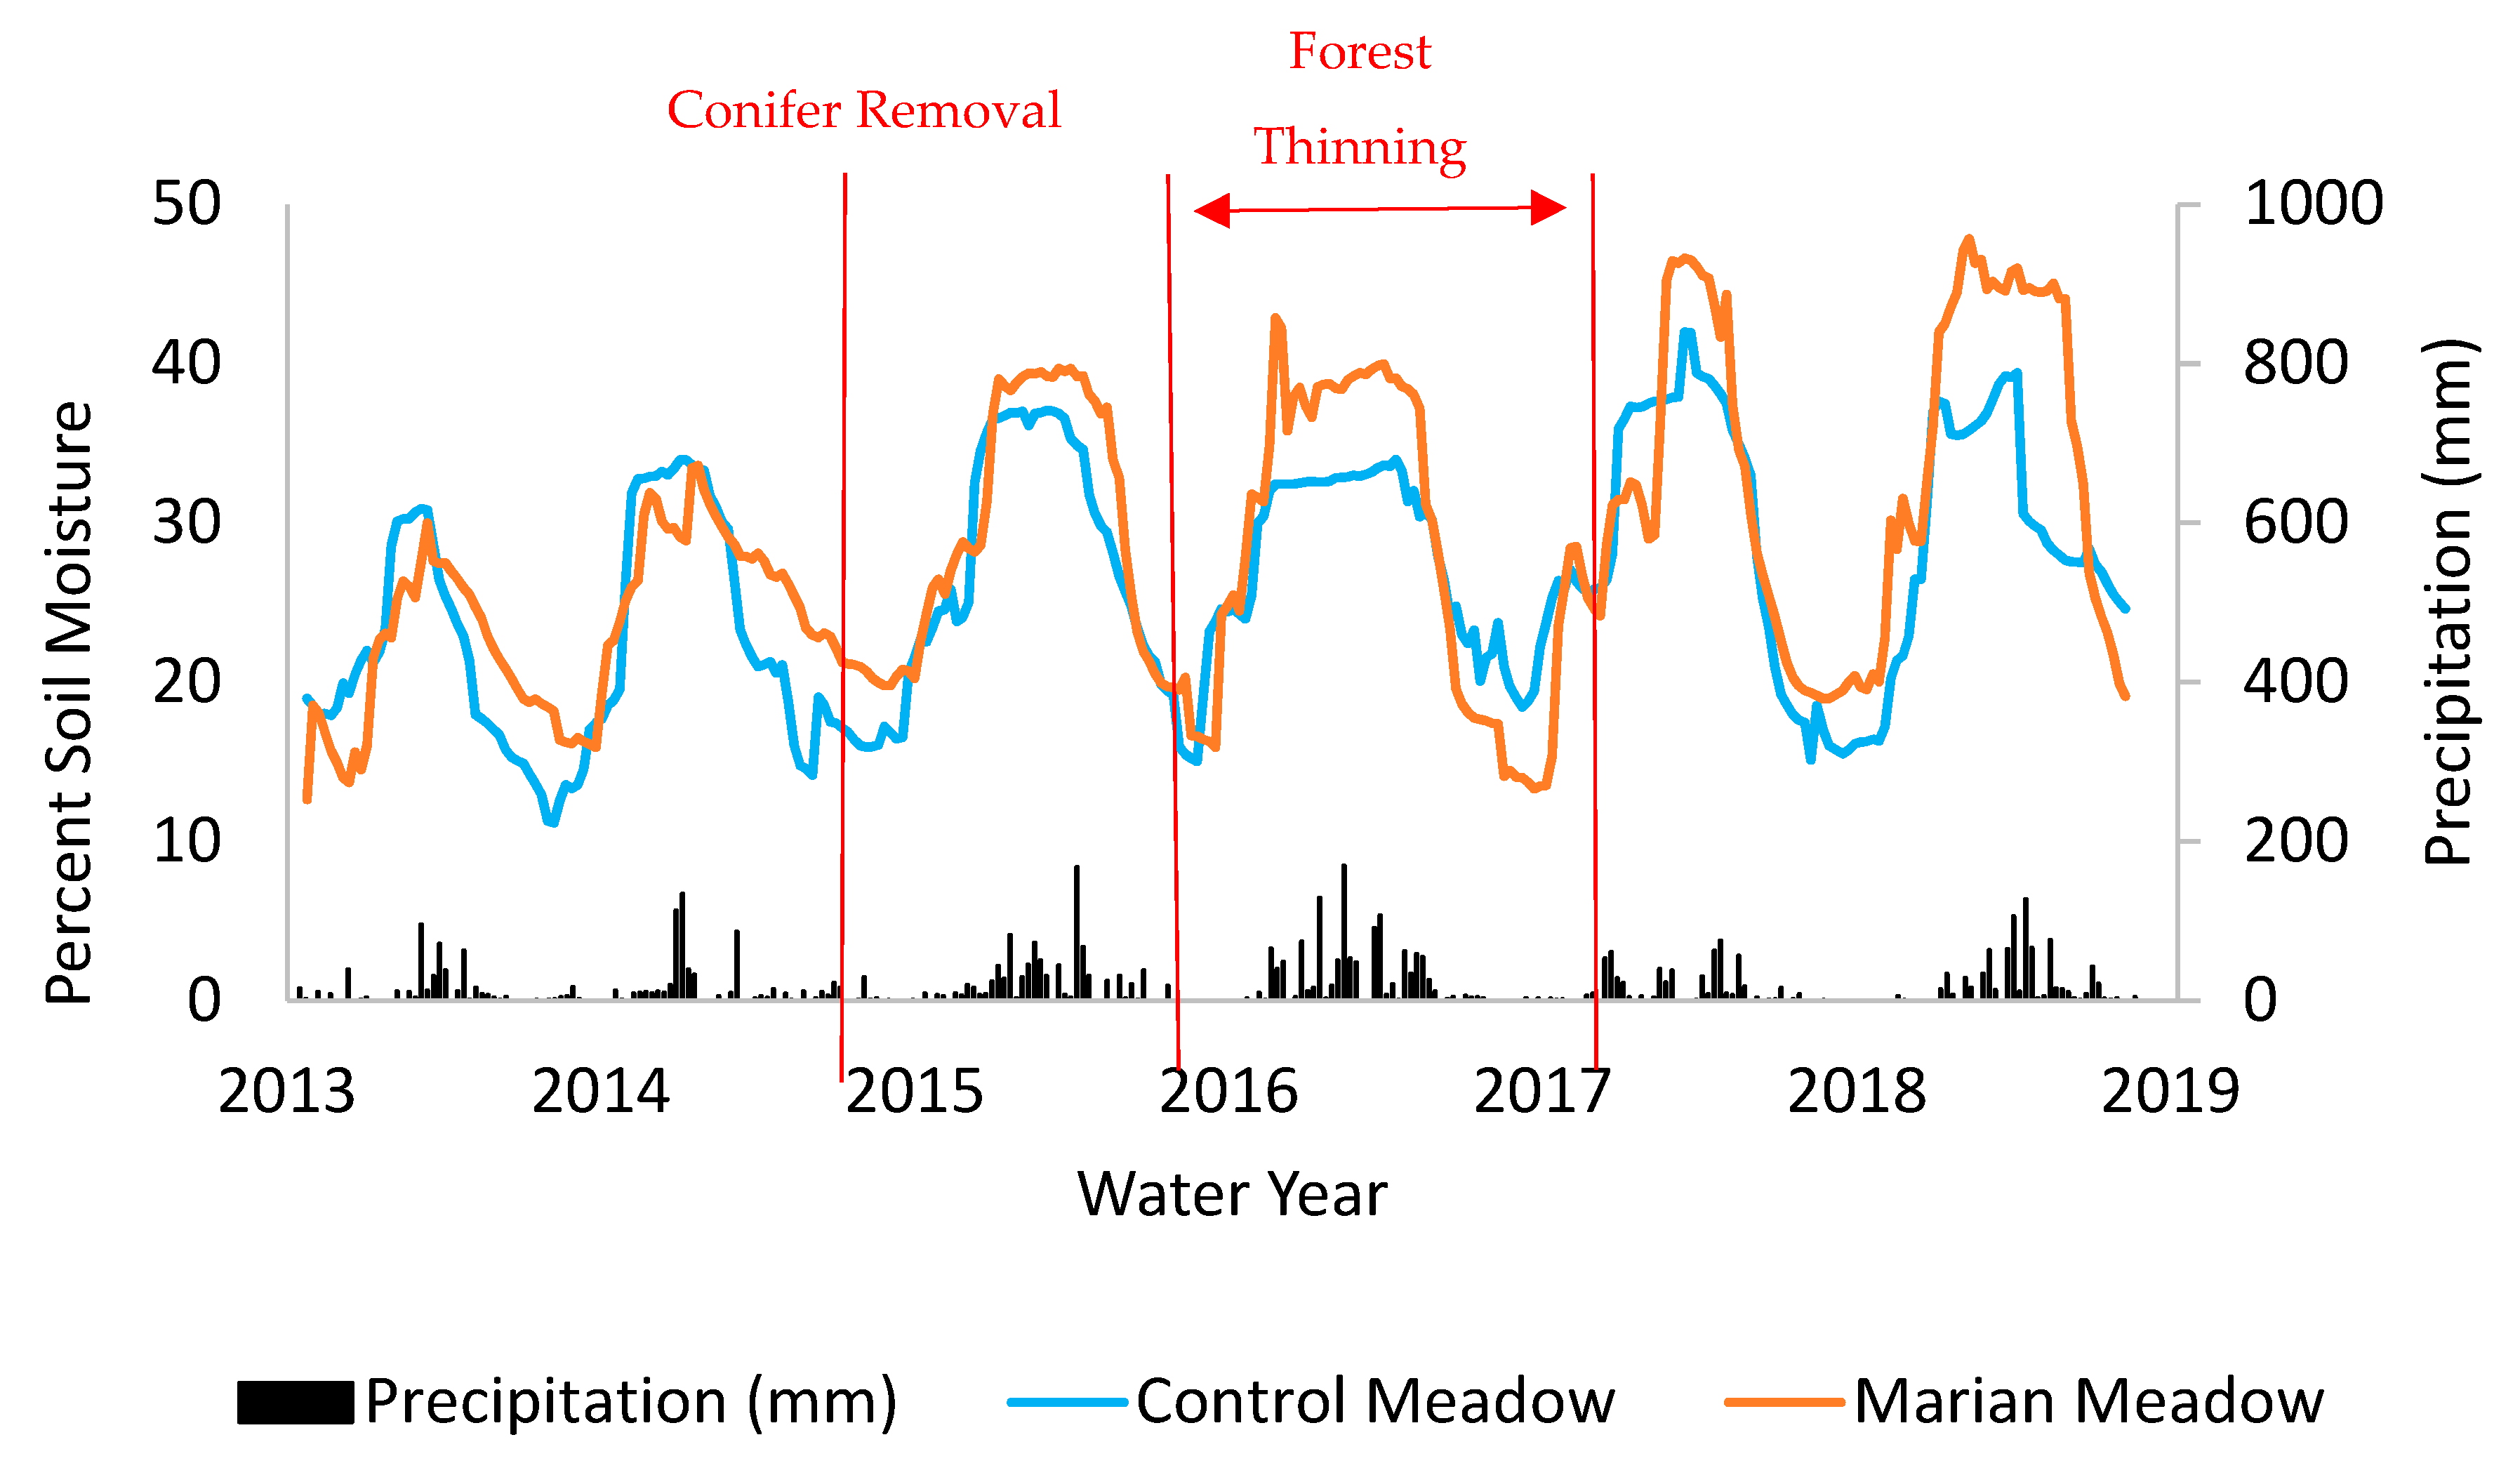
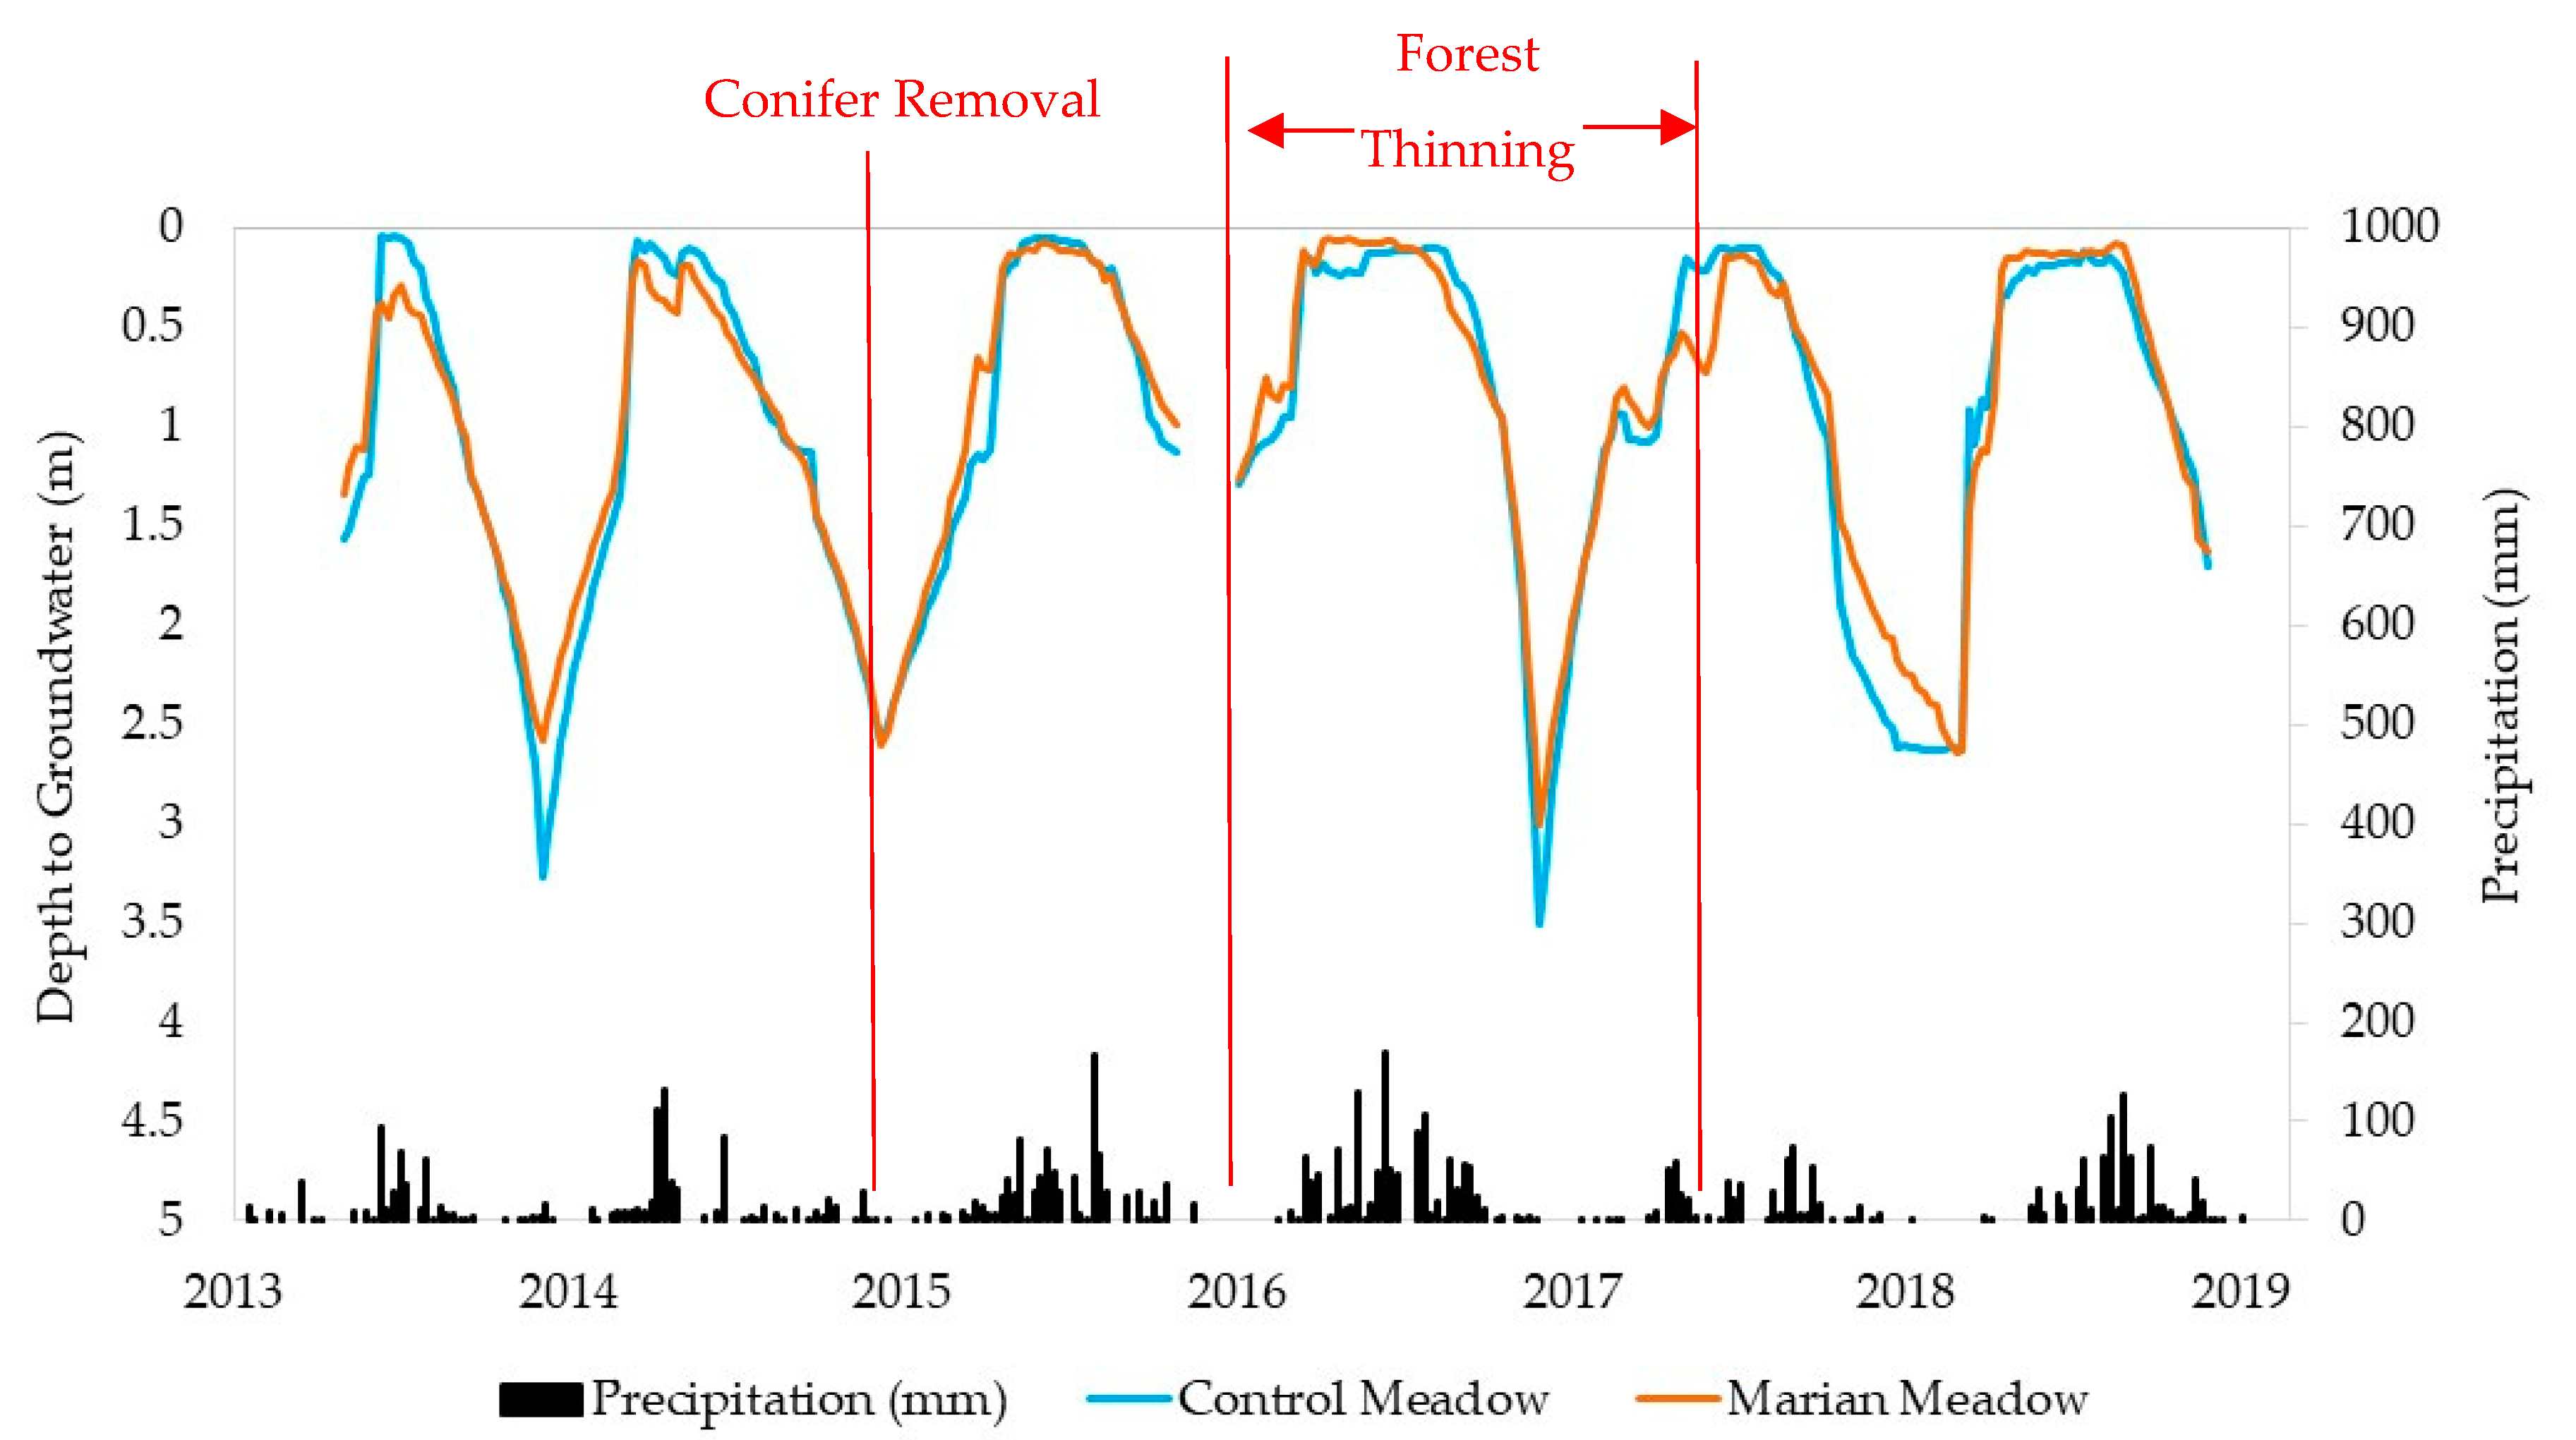
Soil moisture, shallow groundwater depth, and climate data was collected at Marian Meadow and a Control Meadow from September 2013 to September 2019 (
Figure 1). A pre-restoration “before” time period was almost two years in length. Removal of encroached conifers within Marian Meadow study area occurred in July 2015. The upslope harvest around the meadow occurred from the summer of 2016 through the fall of 2017. A more detailed description of the study meadows and measurements are available in Surfleet et al. [
10]. In this article, we only summarize the methods already described [
10], which adds detail when new approaches were utilized.
2.1. Study Areas
The two study meadows were located approximately 16 km from Chester, California, USA on private forestland owned by Collins Pine Company (
Table 1,
Figure 1). Marian Meadow is approximately 18.2 hectares in the area at an elevation of 1370 m. The watershed area contributing to Marian Meadow is 1785 ha. Marian Meadow was encroached primarily by
Pinus contorta (lodgepole pine) with a basal area of 25.04 m
2/hectare prior to restoration. The restoration of Marian Meadow involved removing all lodgepole pine from the meadow during summer 2015. The forest surrounding Marian Meadow was composed of mixed conifer species. The mixed conifer species include
Pinus ponderosa,
Pinus jefferyi,
Pinus monticola,
Pinus contorta,
Psuedotsuga mensiezii,
Calecedrus decurrens, and
Quercus velutina. The basal area of the forest surrounding Marian Meadow was 33.1 m
2/hectare. Following the forest thinning, the basal area was 30.3 m
2/hectare with a 2.8 m
2/hectare or 9% reduction in stand density adjacent to Marian Meadow. The area of the forest thinning within the Marian Meadow watershed was 584 ha and 33% of the watershed area. The Control Meadow was 8.1 hectares in area and an elevation of 1460 m, which is a restored meadow. Encroached conifers were removed in 2010. Although recently restored, herbaceous meadow vegetation had filled in the three years prior to our study (
Table 1,
Figure 1).
The average annual precipitation recorded at Chester was 860 mm [
16]. Precipitation is a mix of rain and snow. The average annual air temperature of nearby Chester, California (elevation 1372 m) from 1948 to 2005 was 8.7 °C.
The meadows are located in a transitional zone between the Cascade and Sierra Nevada Mountains, USA. Soils have primarily volcanic parent material [
17]. The top horizon at Marian Meadow has a clay texture (
Table 1). The Control Meadow consists of a clay loam from poorly consolidated alluvial materials with high sand content [
18,
19]. Soil bulk density and porosity were determined from samples taken at 30 cm. Hydraulic conductivity was determined at 2 m using the Kozeny-Carmen equation [
20] based on a particle size distribution analysis [
21] (
Table 1). Both meadows are classified as dry meadows [
22,
23].
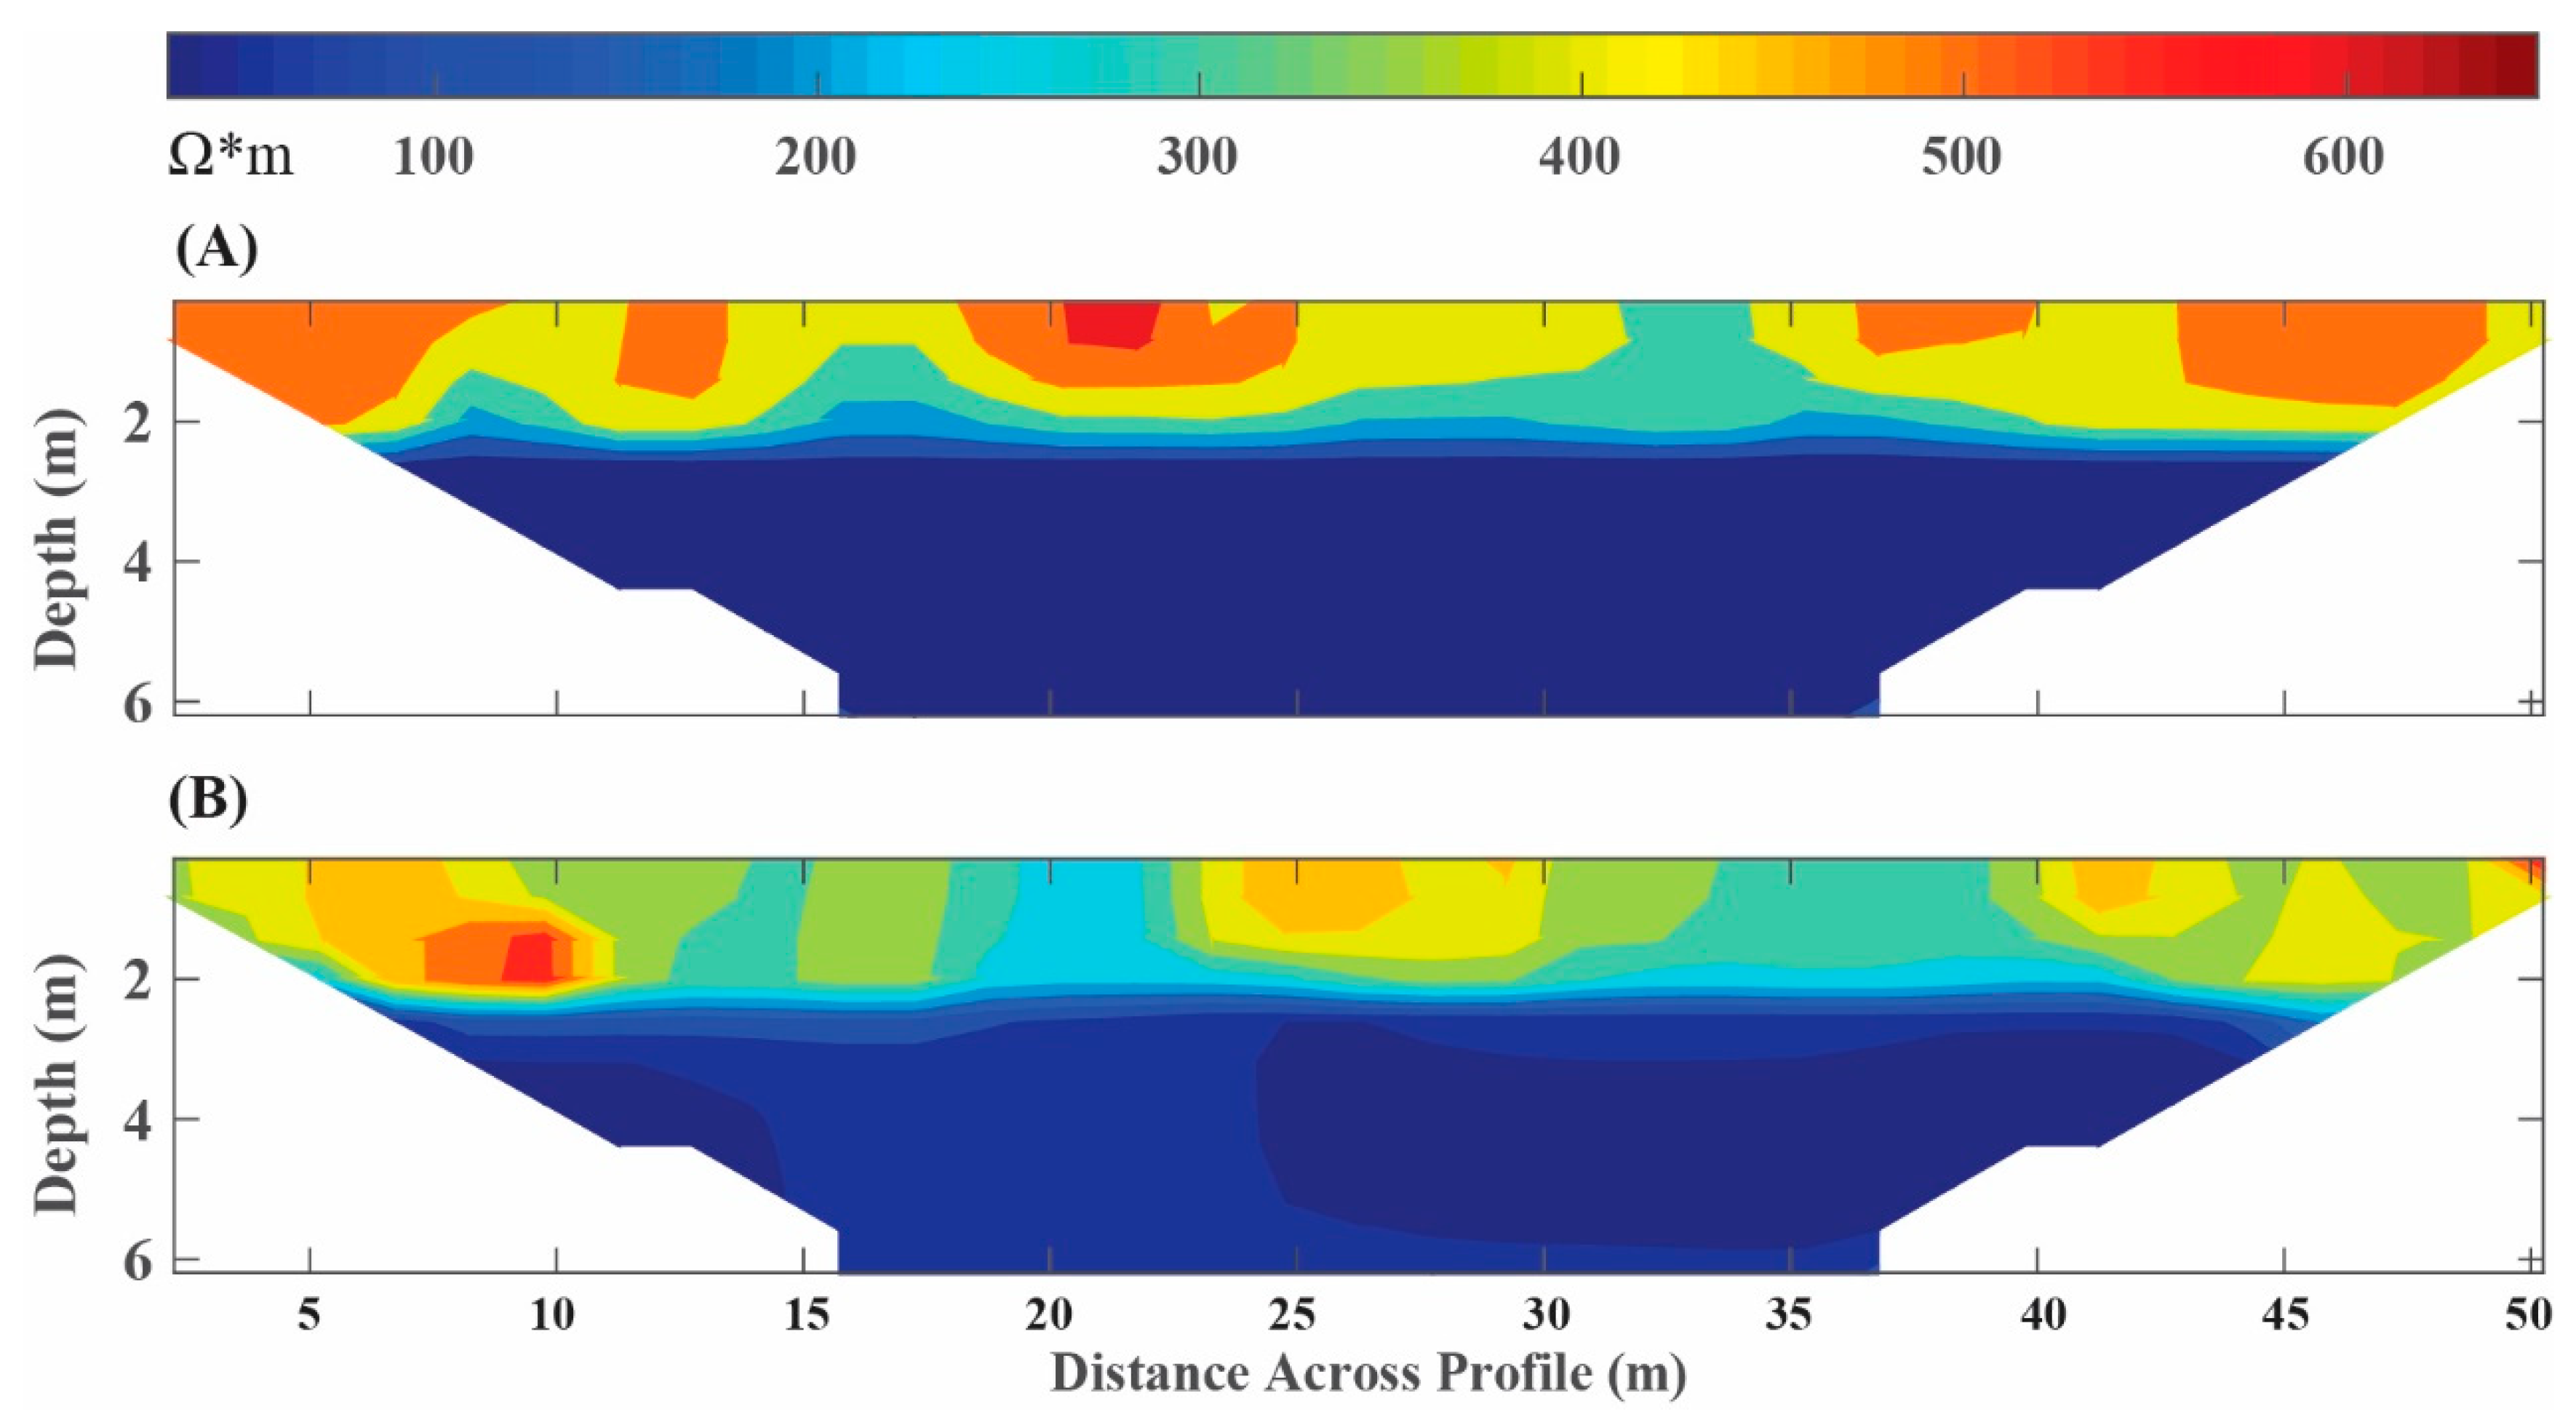
Electrical resistivity tomography (ERT) surveys were performed across the length of both meadows (
Figure 1) to determine the depth to confining layers. ERT was also used in evaluating depth to groundwater when groundwater was below the depth of shallow wells, which is described later. The ERT surveys to determine depth to a confining layer were performed with a SuperSting-R8 electrical resistivity meter operated with Schlumberger Array geometry (Advanced Geosciences Incorporated, Austin, TX, USA), inverted with EarthImager-2D software (Advanced Geosciences Incorporated, Austin, TX, USA), and contoured in Matlab R2016a (MathWorks, Natick, MA, USA). The ERT profile across both meadows employed 112 electrodes at a spacing of three meters in the Control Meadow and four meters in Marian Meadow (
Figure 1). Near-surface soil along both profiles was very dry at the survey time (July 2018), but the inverted resistivity models match the field data well with root-mean-square (RMS) errors of 8.3% and 6.3% in the Control Meadow and Marian Meadow, respectively.
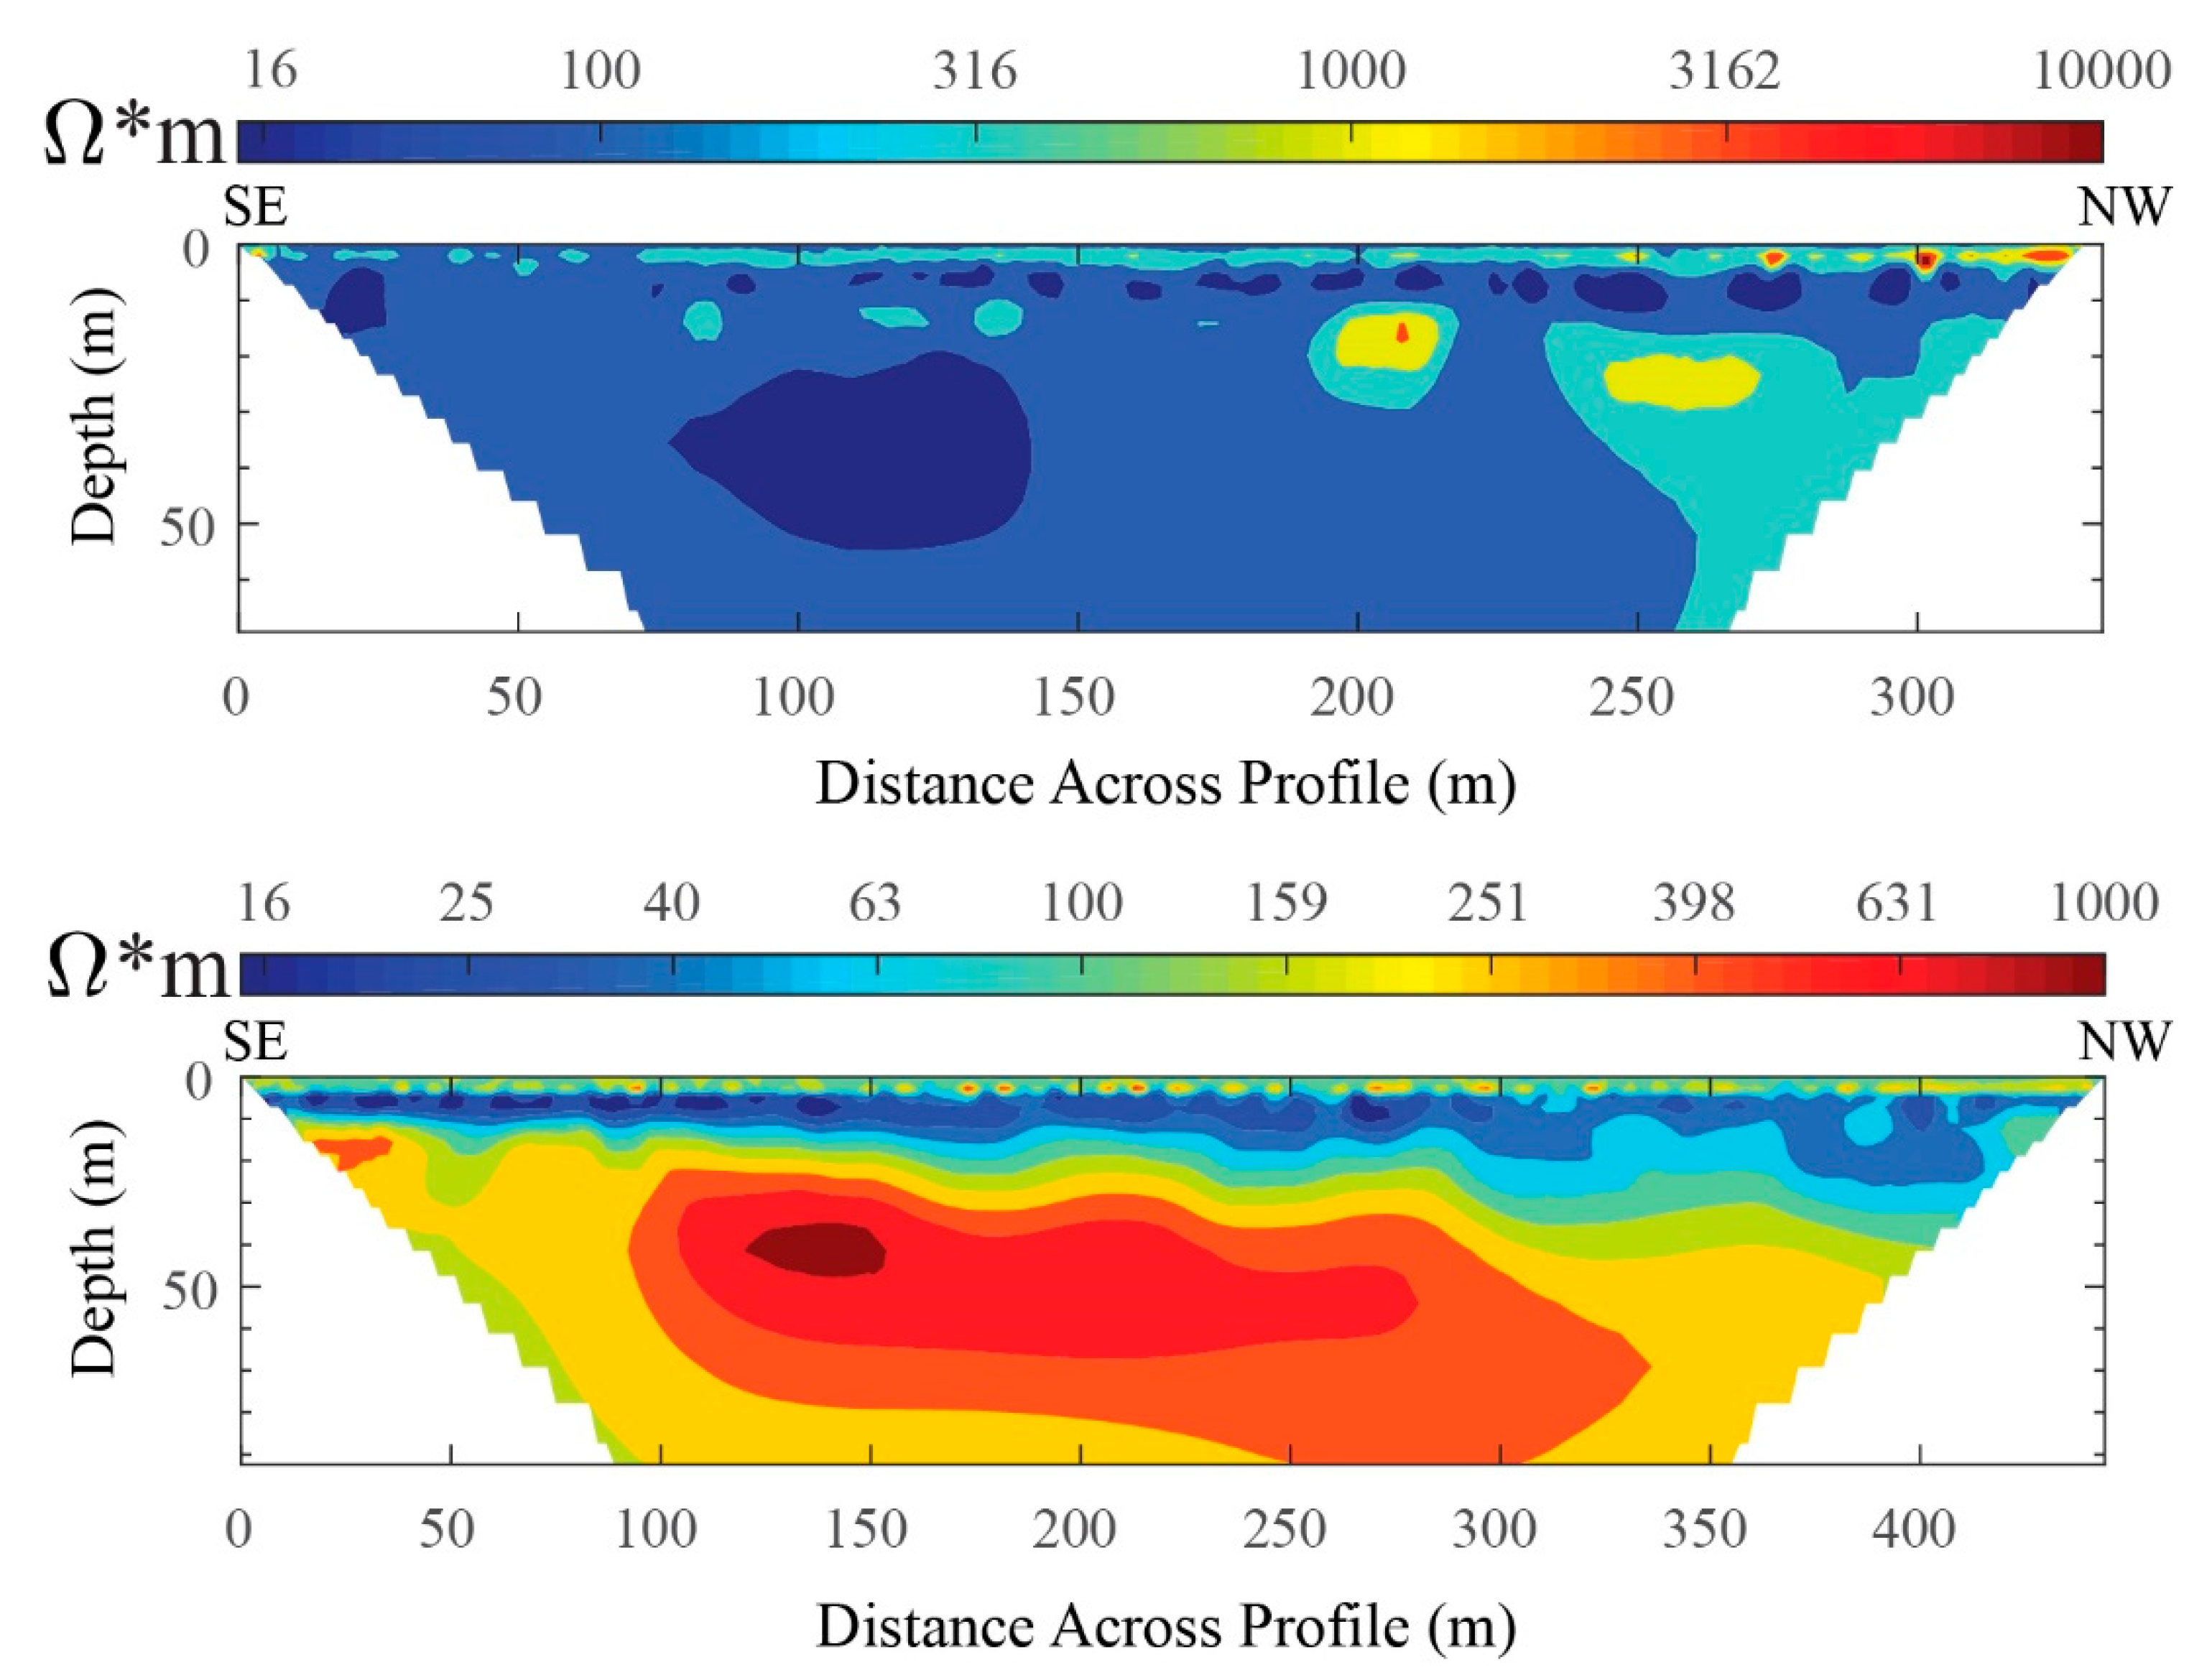
The depth of the confining layers differs in the two meadows. The confining layer in Marian Meadow is laterally continuous across the profile (
Figure 2) and is interpreted to be composed of moderately fractured extrusive igneous rock with resistivity values >300
. Confining layer depth is 12 m on the SE end of the profile and steadily deepens to approximately 30 m on the NW end of the profile. High resistivity features seen in the first few meters below the profile indicate dry soil conditions. The darkest blue contours (<25
) are interpreted as regions with enhanced clay content derived from weathering of the volcanic rocks of the region. The confining layer resistivity decreases to the NW, which indicates that the confining layer may become more fractured in this direction.
In the Control Meadow, a partially confining layer is detected at a depth of approximately 15 m at the NW end of the profile but disappears to the SE (
Figure 2). The confining layer on the NW side of the profile is characterized by resistivity values of >300
, interpreted to be composed of moderately fractured extrusive igneous rock. Very high resistivity features are observed near the surface, which indicates extremely dry near-surface soil conditions. Resistivity values of 100
less typically indicate saturated soil or alluvium. However, regions contoured with the darkest blue colors (<30
) are potentially clay deposits related to the weathering of the volcanic rock of the region. The base of the aquifer in the Control Meadow is, therefore, generally greater than the 69-meter imaging depth of the ERT profile, and significantly deeper than in Marian Meadow.
2.5. Meadows’ Water Budgets
An annual water budget was created for Marian and Control meadows using methods developed by Rahgozar et al. [
14]. Greater detail for procedures for each water budget value is available [
10]. The general form of the water budget was shown in Equation (1).
where
P is precipitation (mm) from the Chester rain gauge. Q
SEOF was saturated with excess overland flow or surface ponding (mm) assumed to be P when the groundwater was fully saturated. ET was the sum of evapotranspiration from the soil (ET
S) and evaporation from interception capture (I
C) (mm). I
C was estimated by selecting isolated precipitation events with intensity less than the hydraulic conductivity of the surface soil layers, which occurs after medium to dry antecedent conditions. The intercept of the best fit line on the precipitation to infiltration relationship yields the estimate of the interception capture. Interception capture (Ic) was assumed to represent either evaporation or sublimation of incoming precipitation [
10].
ET
S was determined by the difference in the diurnal fluctuations of soil moisture. ΔS (mm), which is the change in storage of water, was the sum of infiltration to groundwater (I
WT) and soil moisture (I
S) minus ET
S (Equation (2)). Error is defined as the sum of the water balance components subtracted from the annual precipitation. If the water balance was precise, the error would be zero.


