The Impact of Multi-Projects on the Alteration of the Flow Regime in the Middle and Lower Course of the Hanjiang River, China


Abstract
:1. Introduction
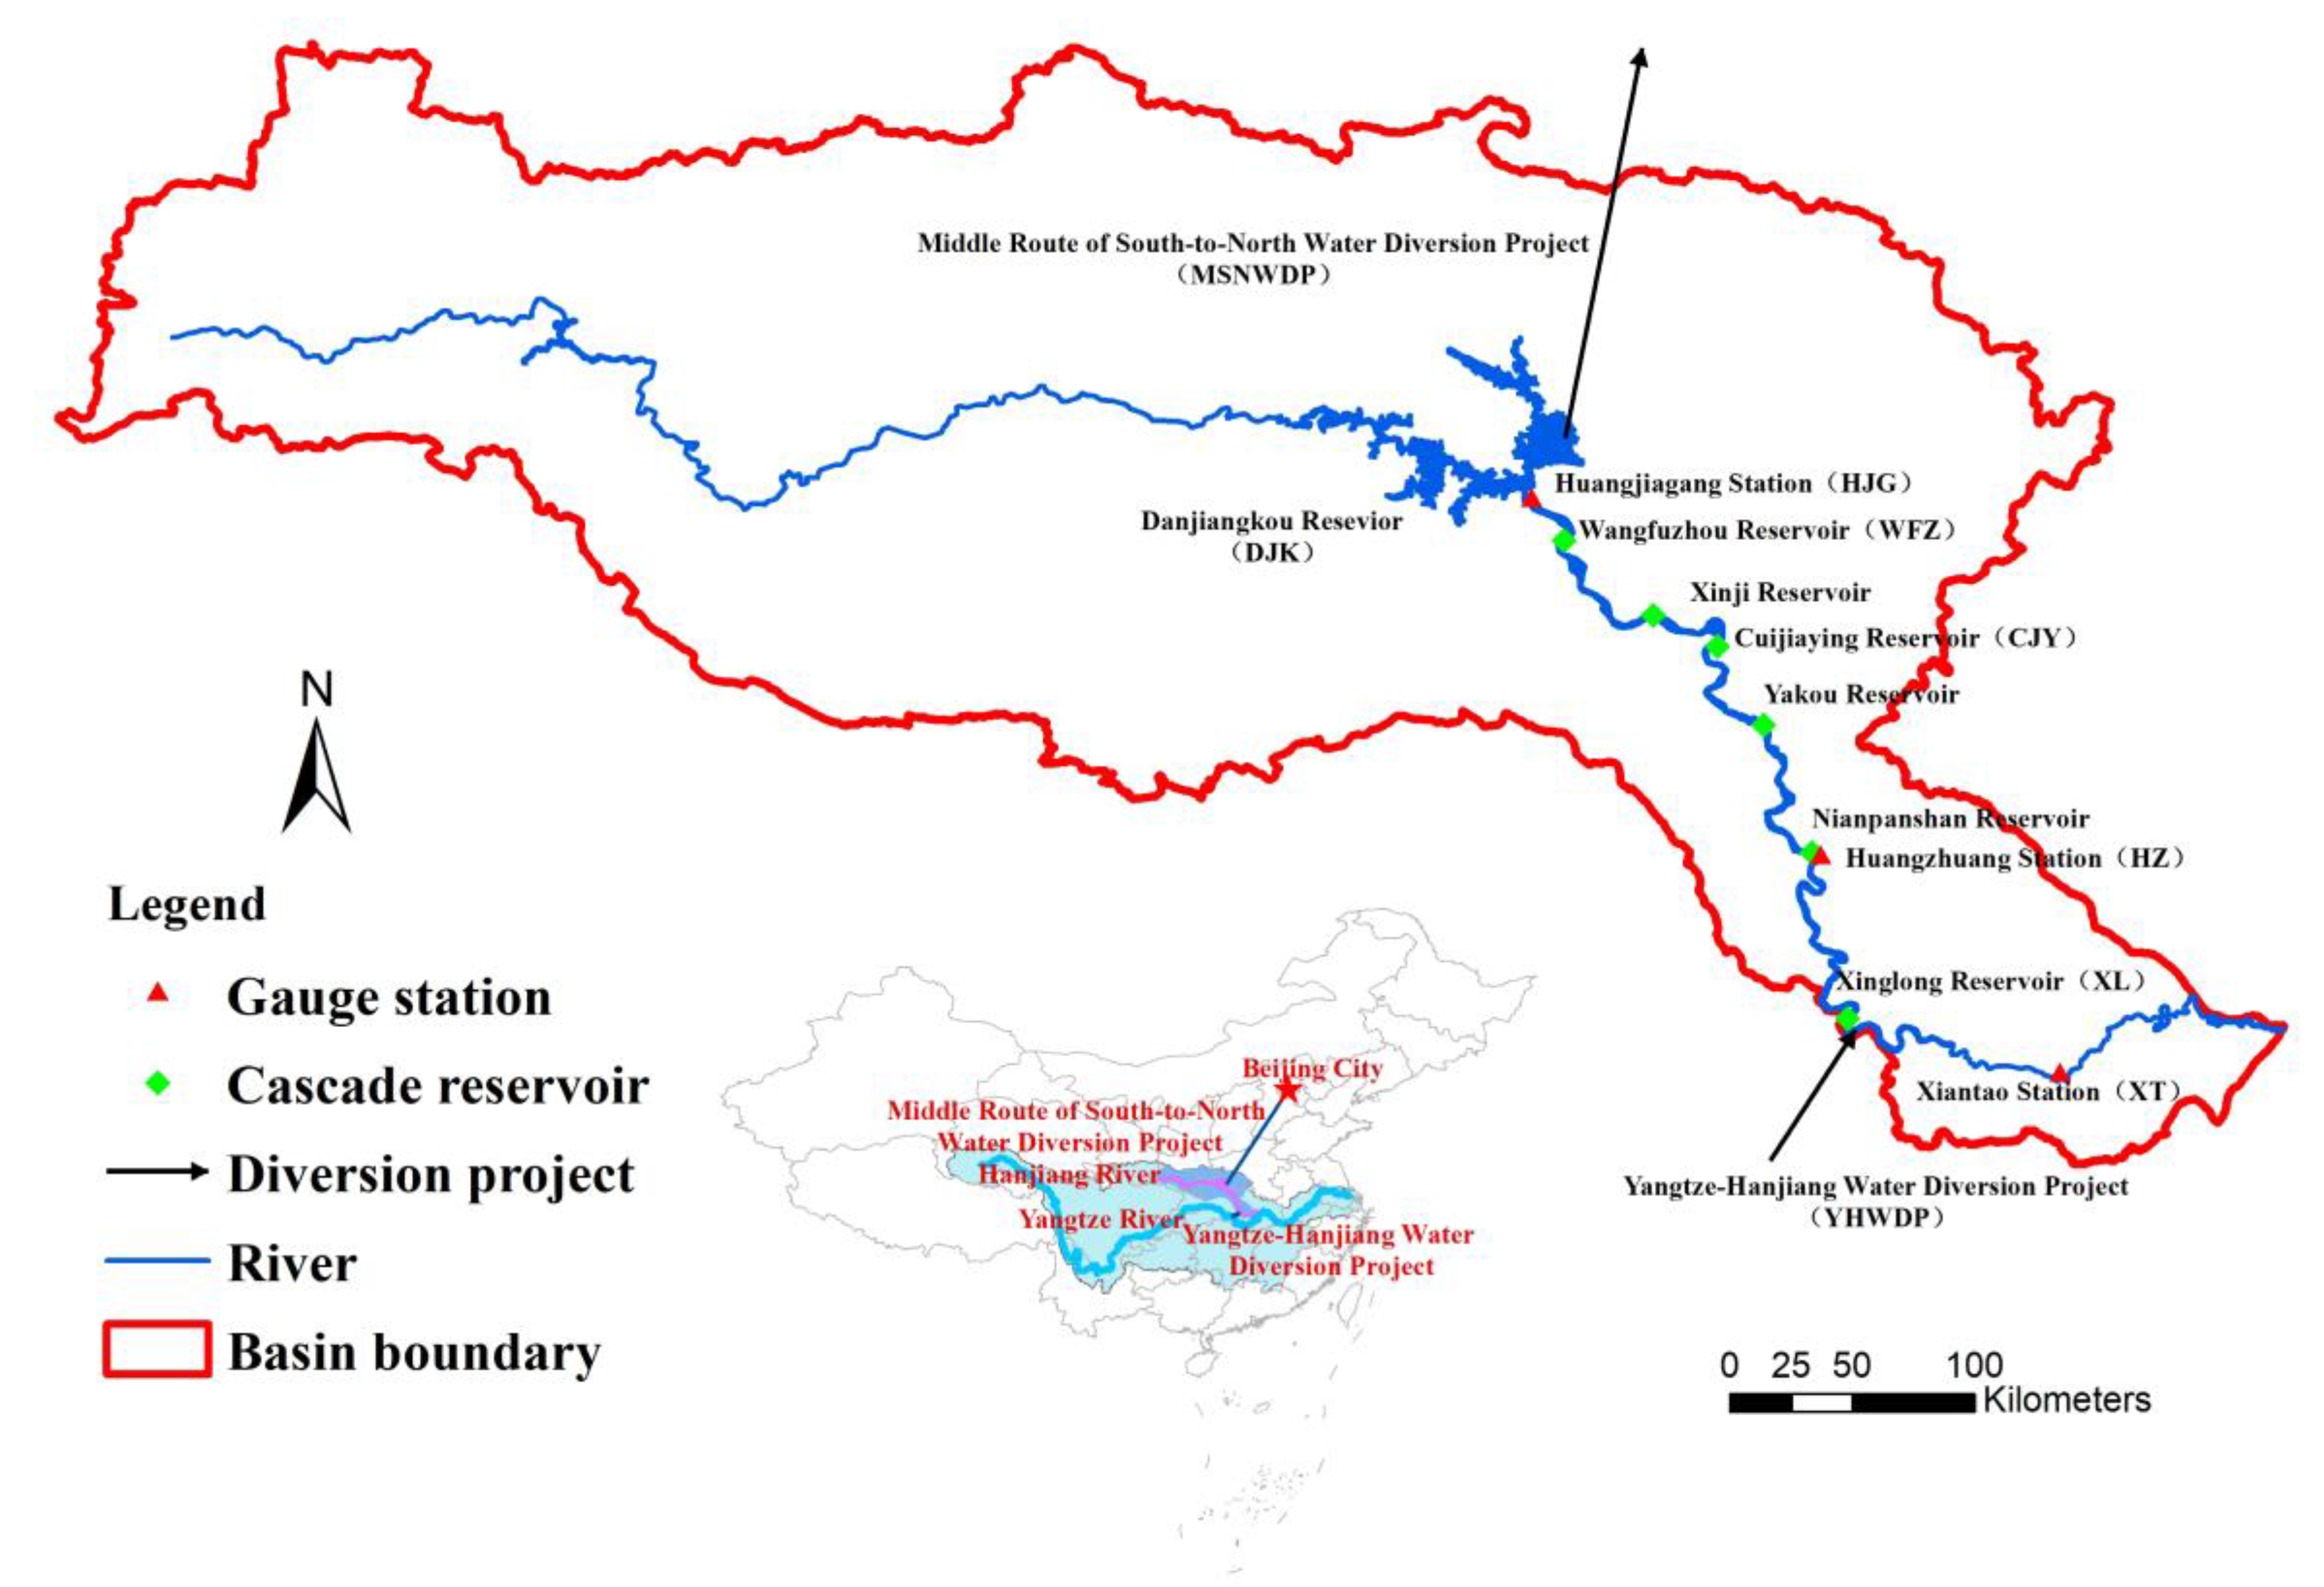
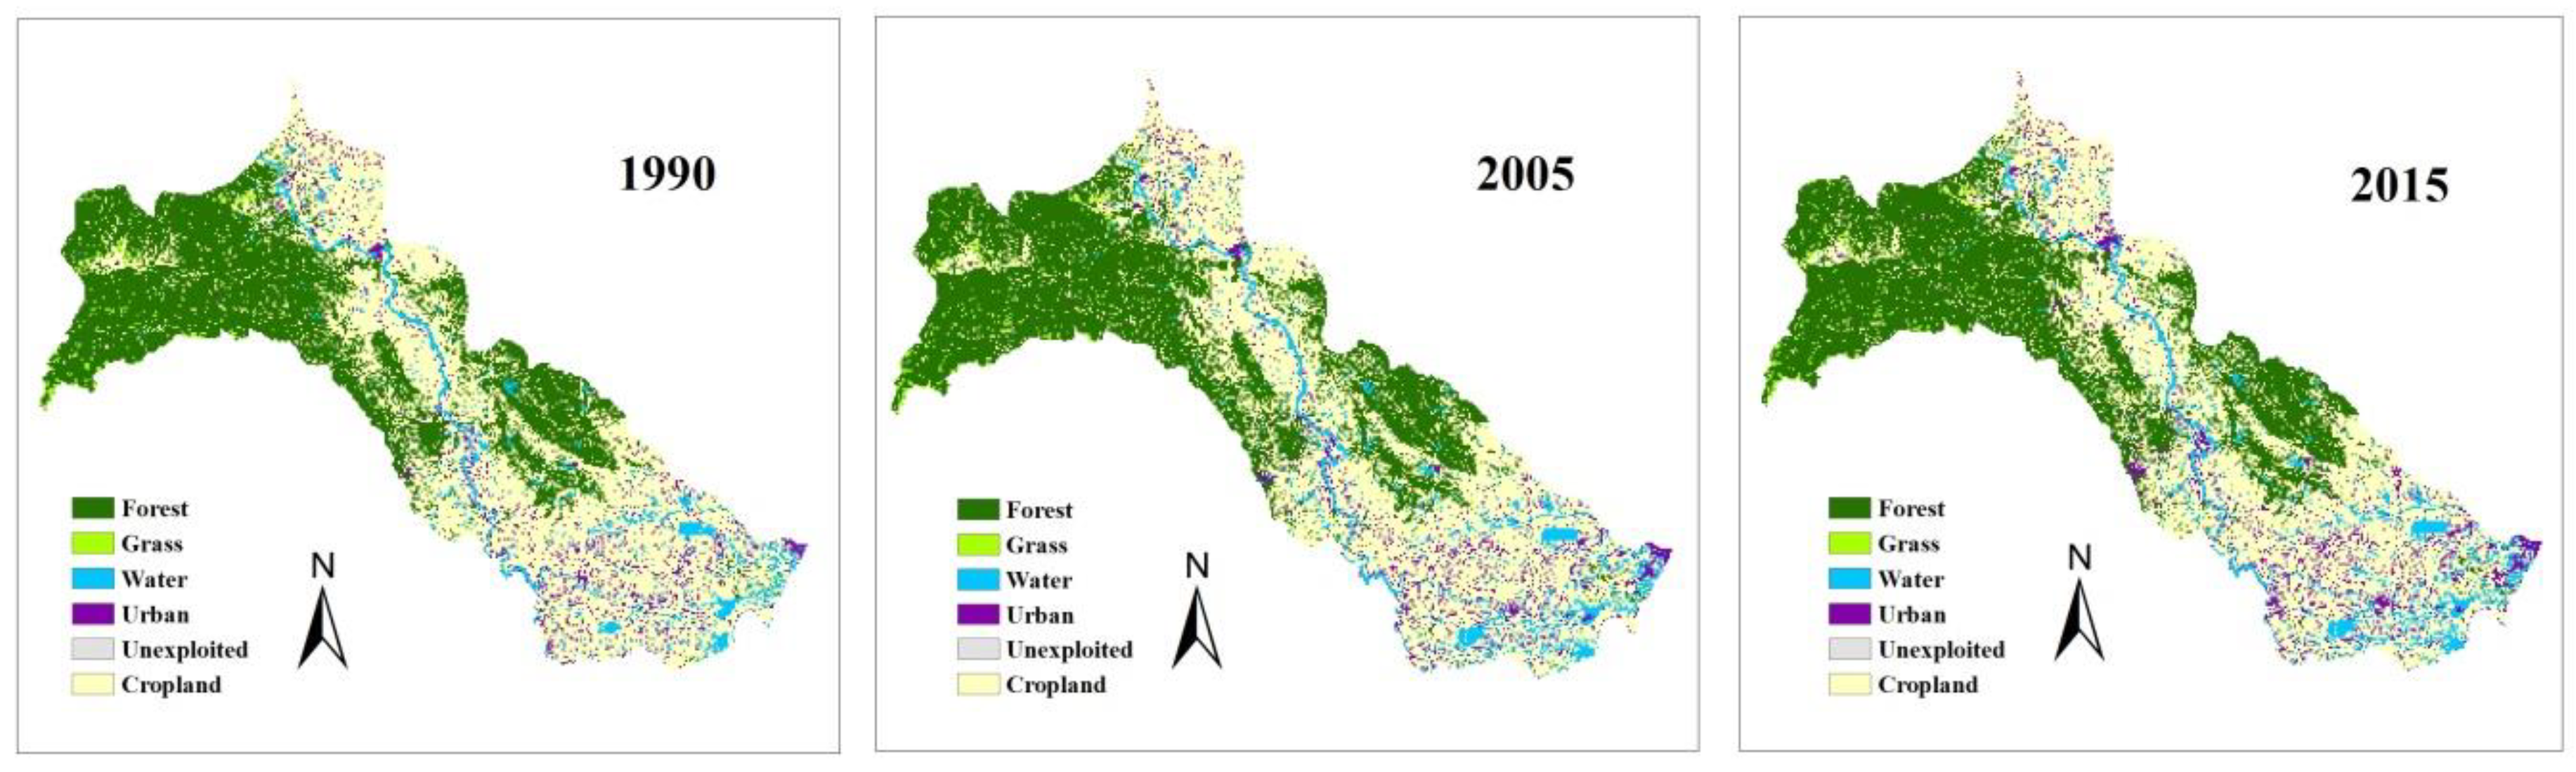
2. Study Area and Data
3. Methods
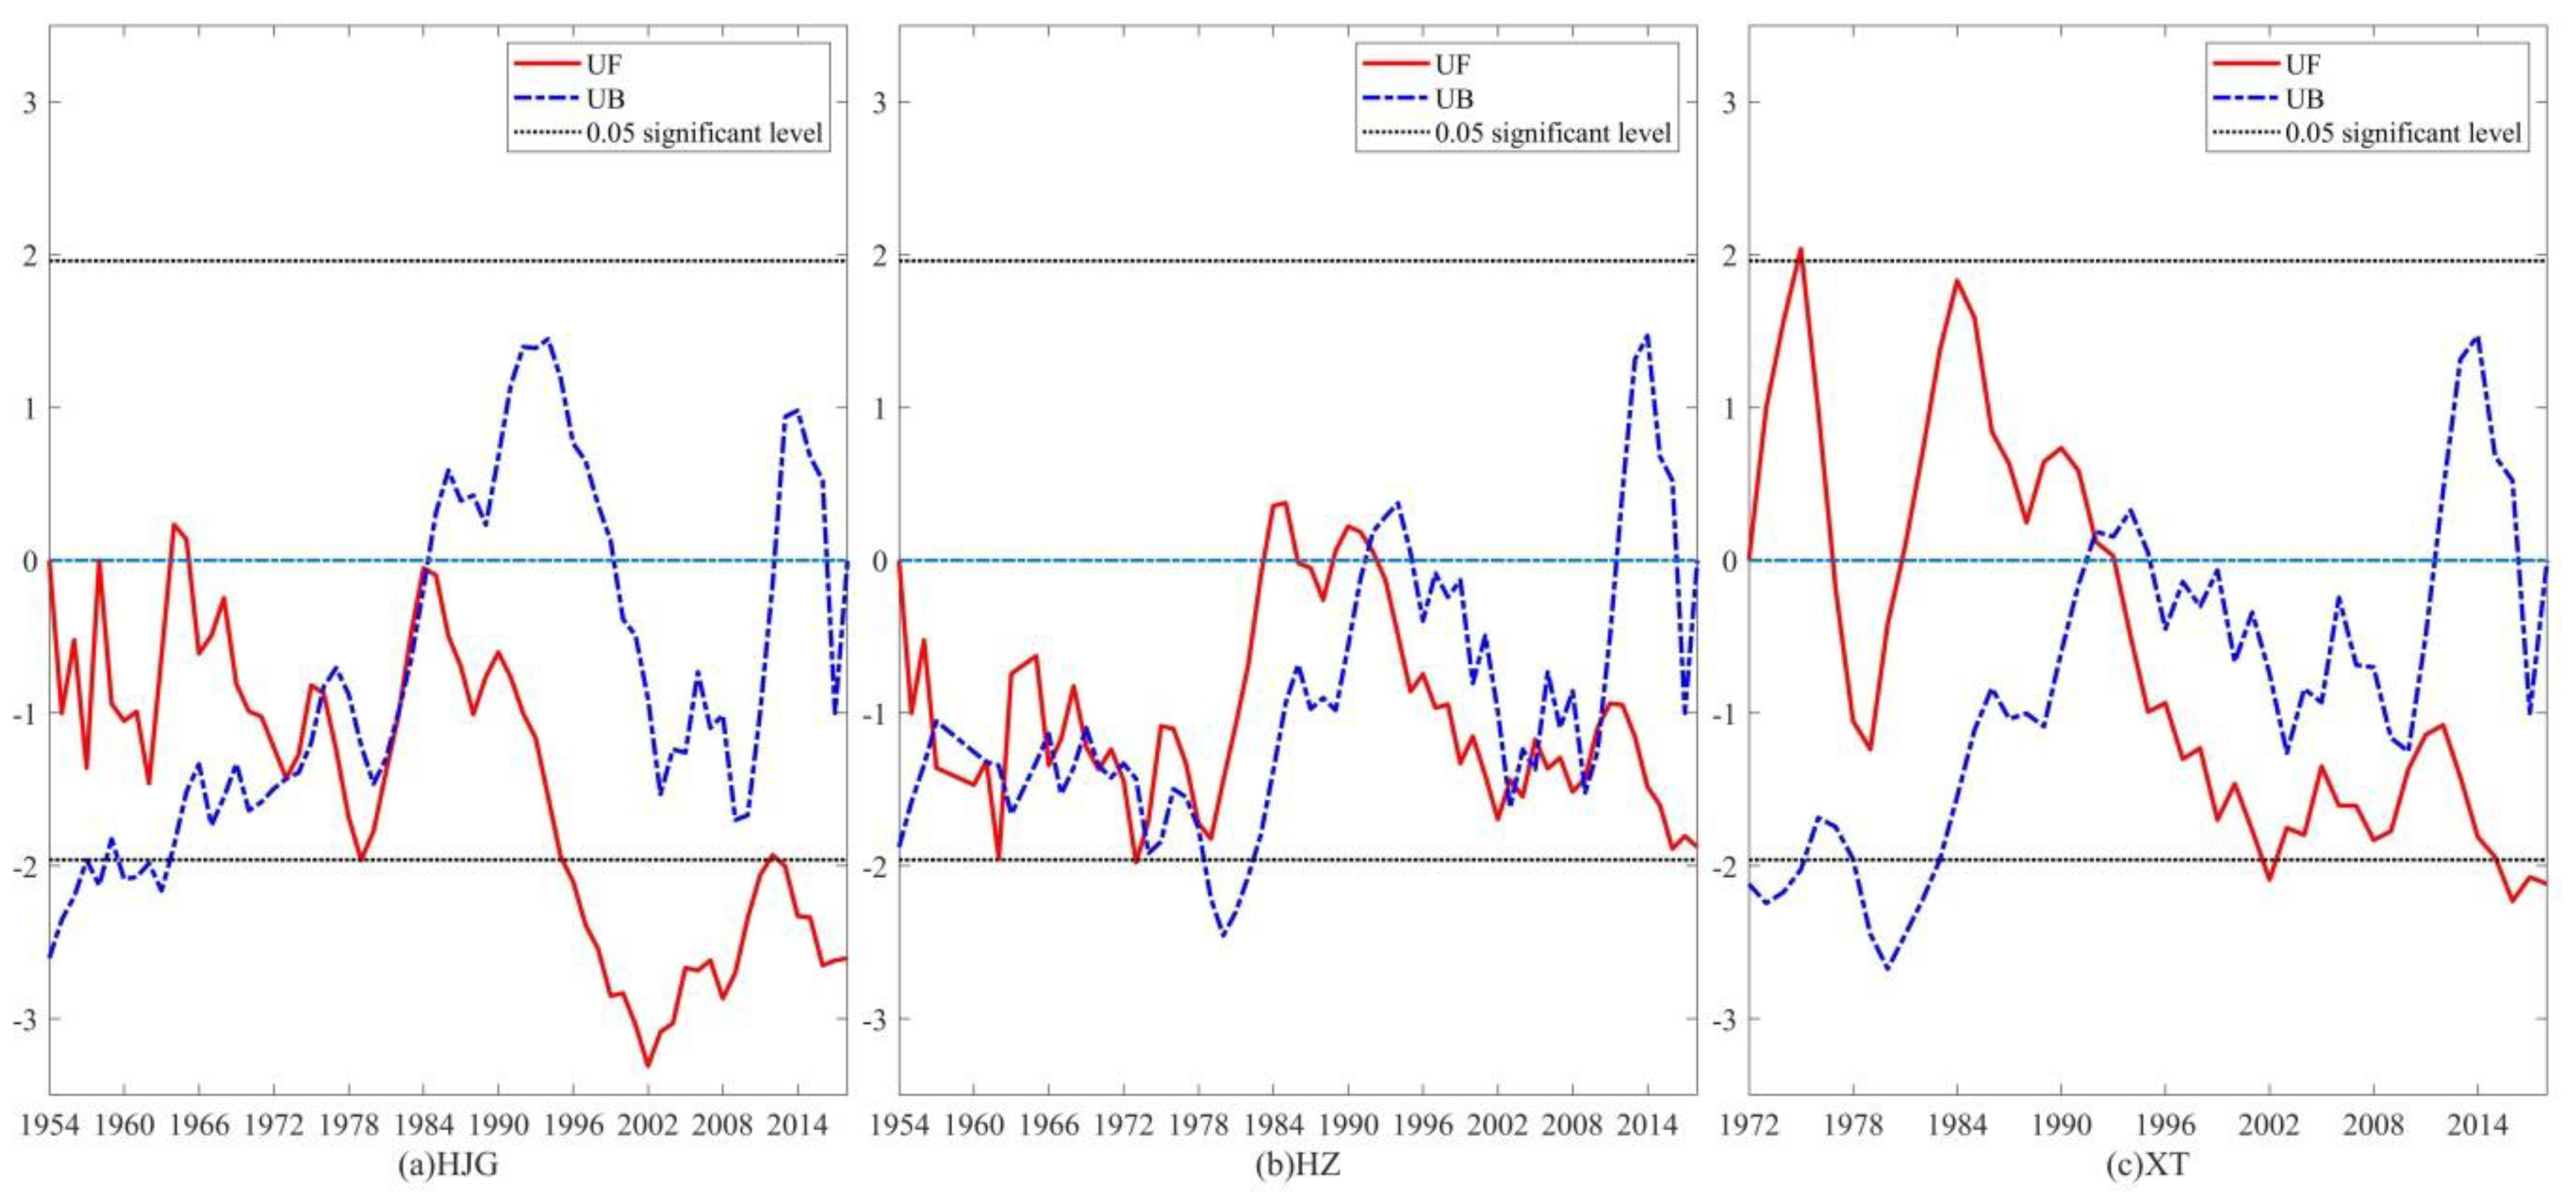
3.1. Mann–Kendall Test
3.2. Indicators of Hydrologic Alteration
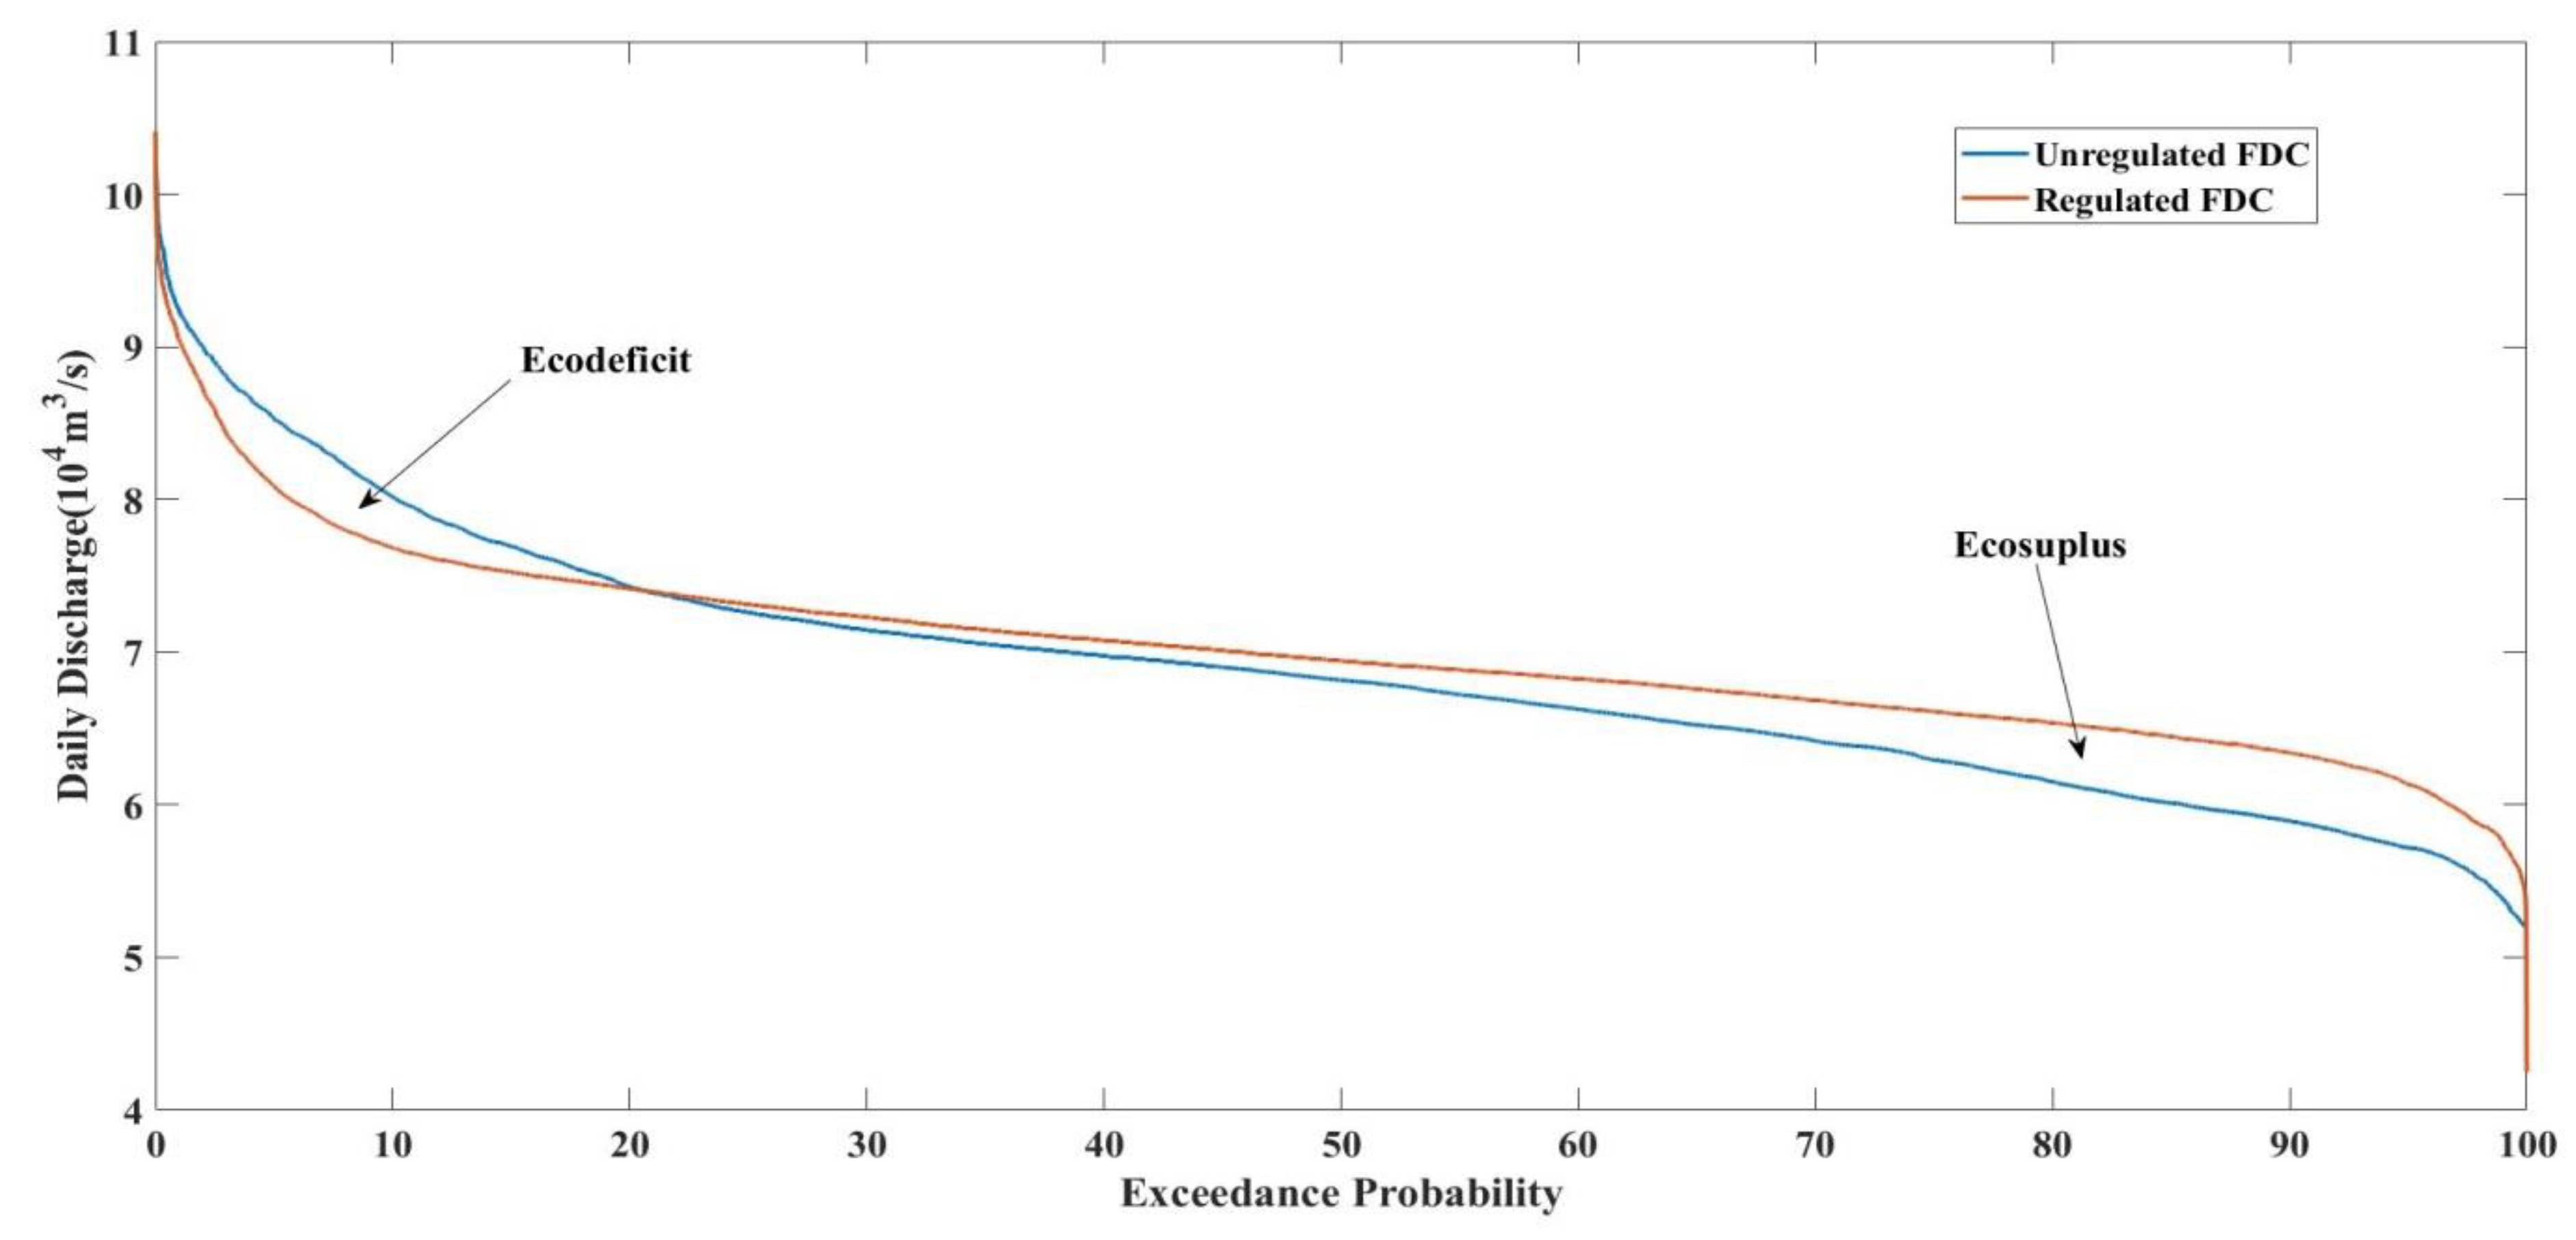
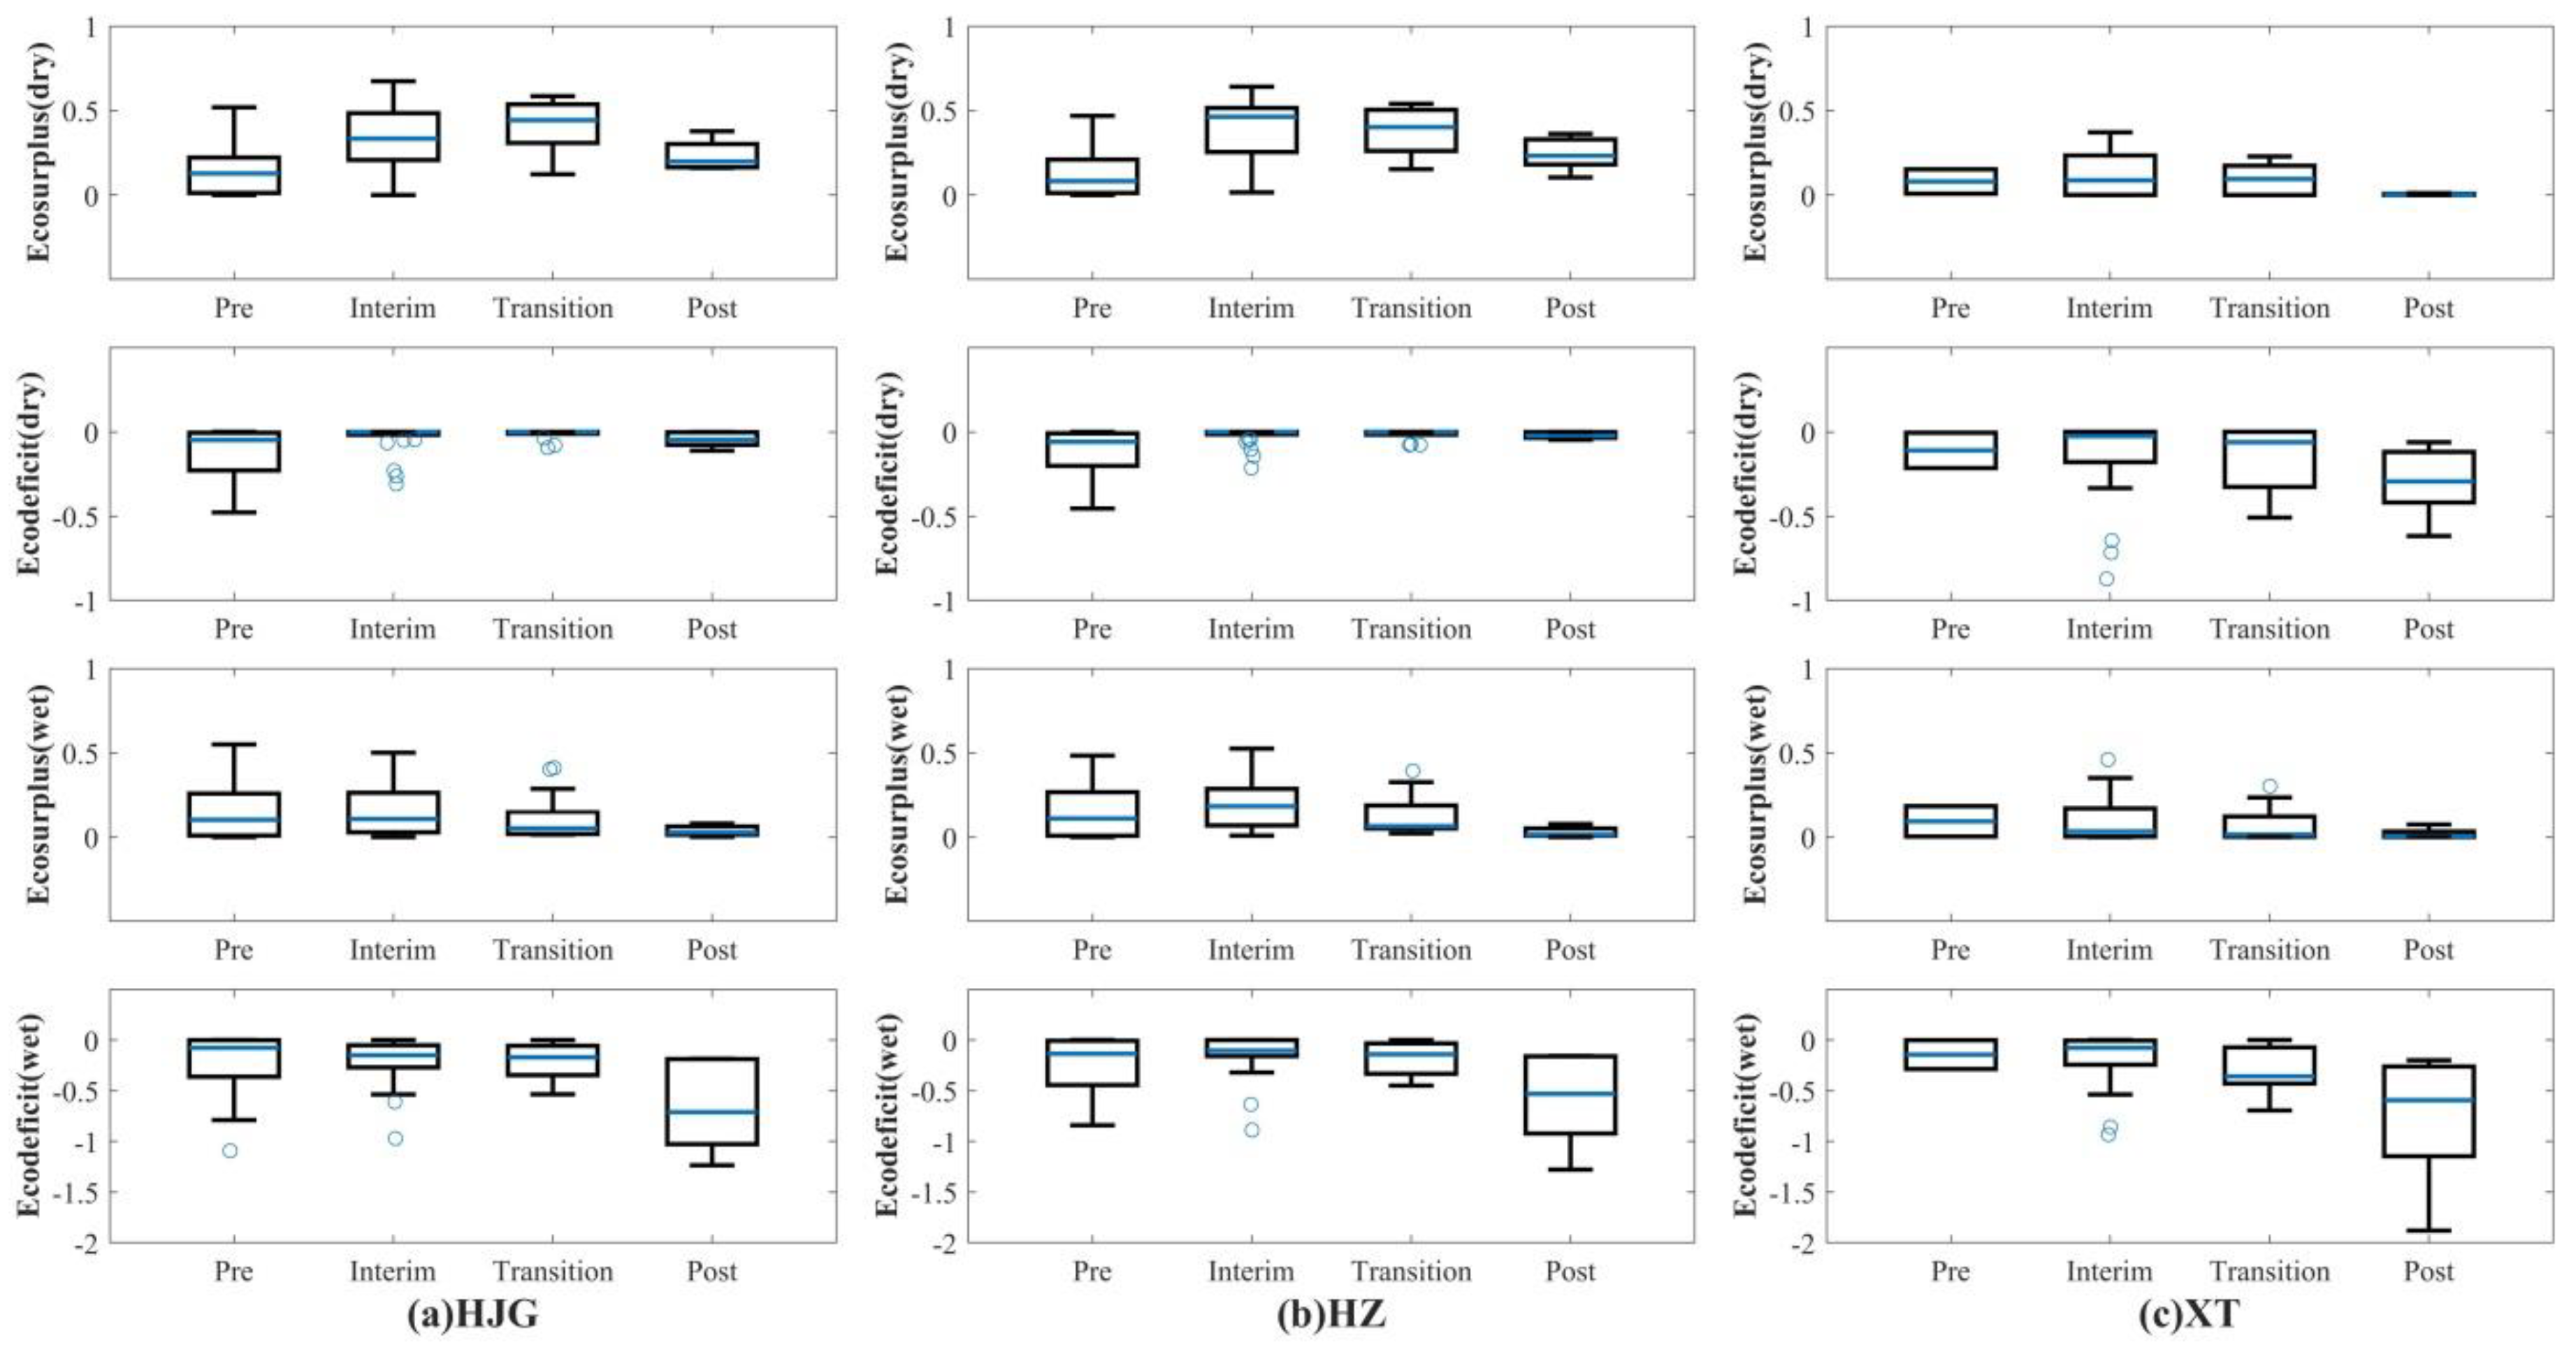
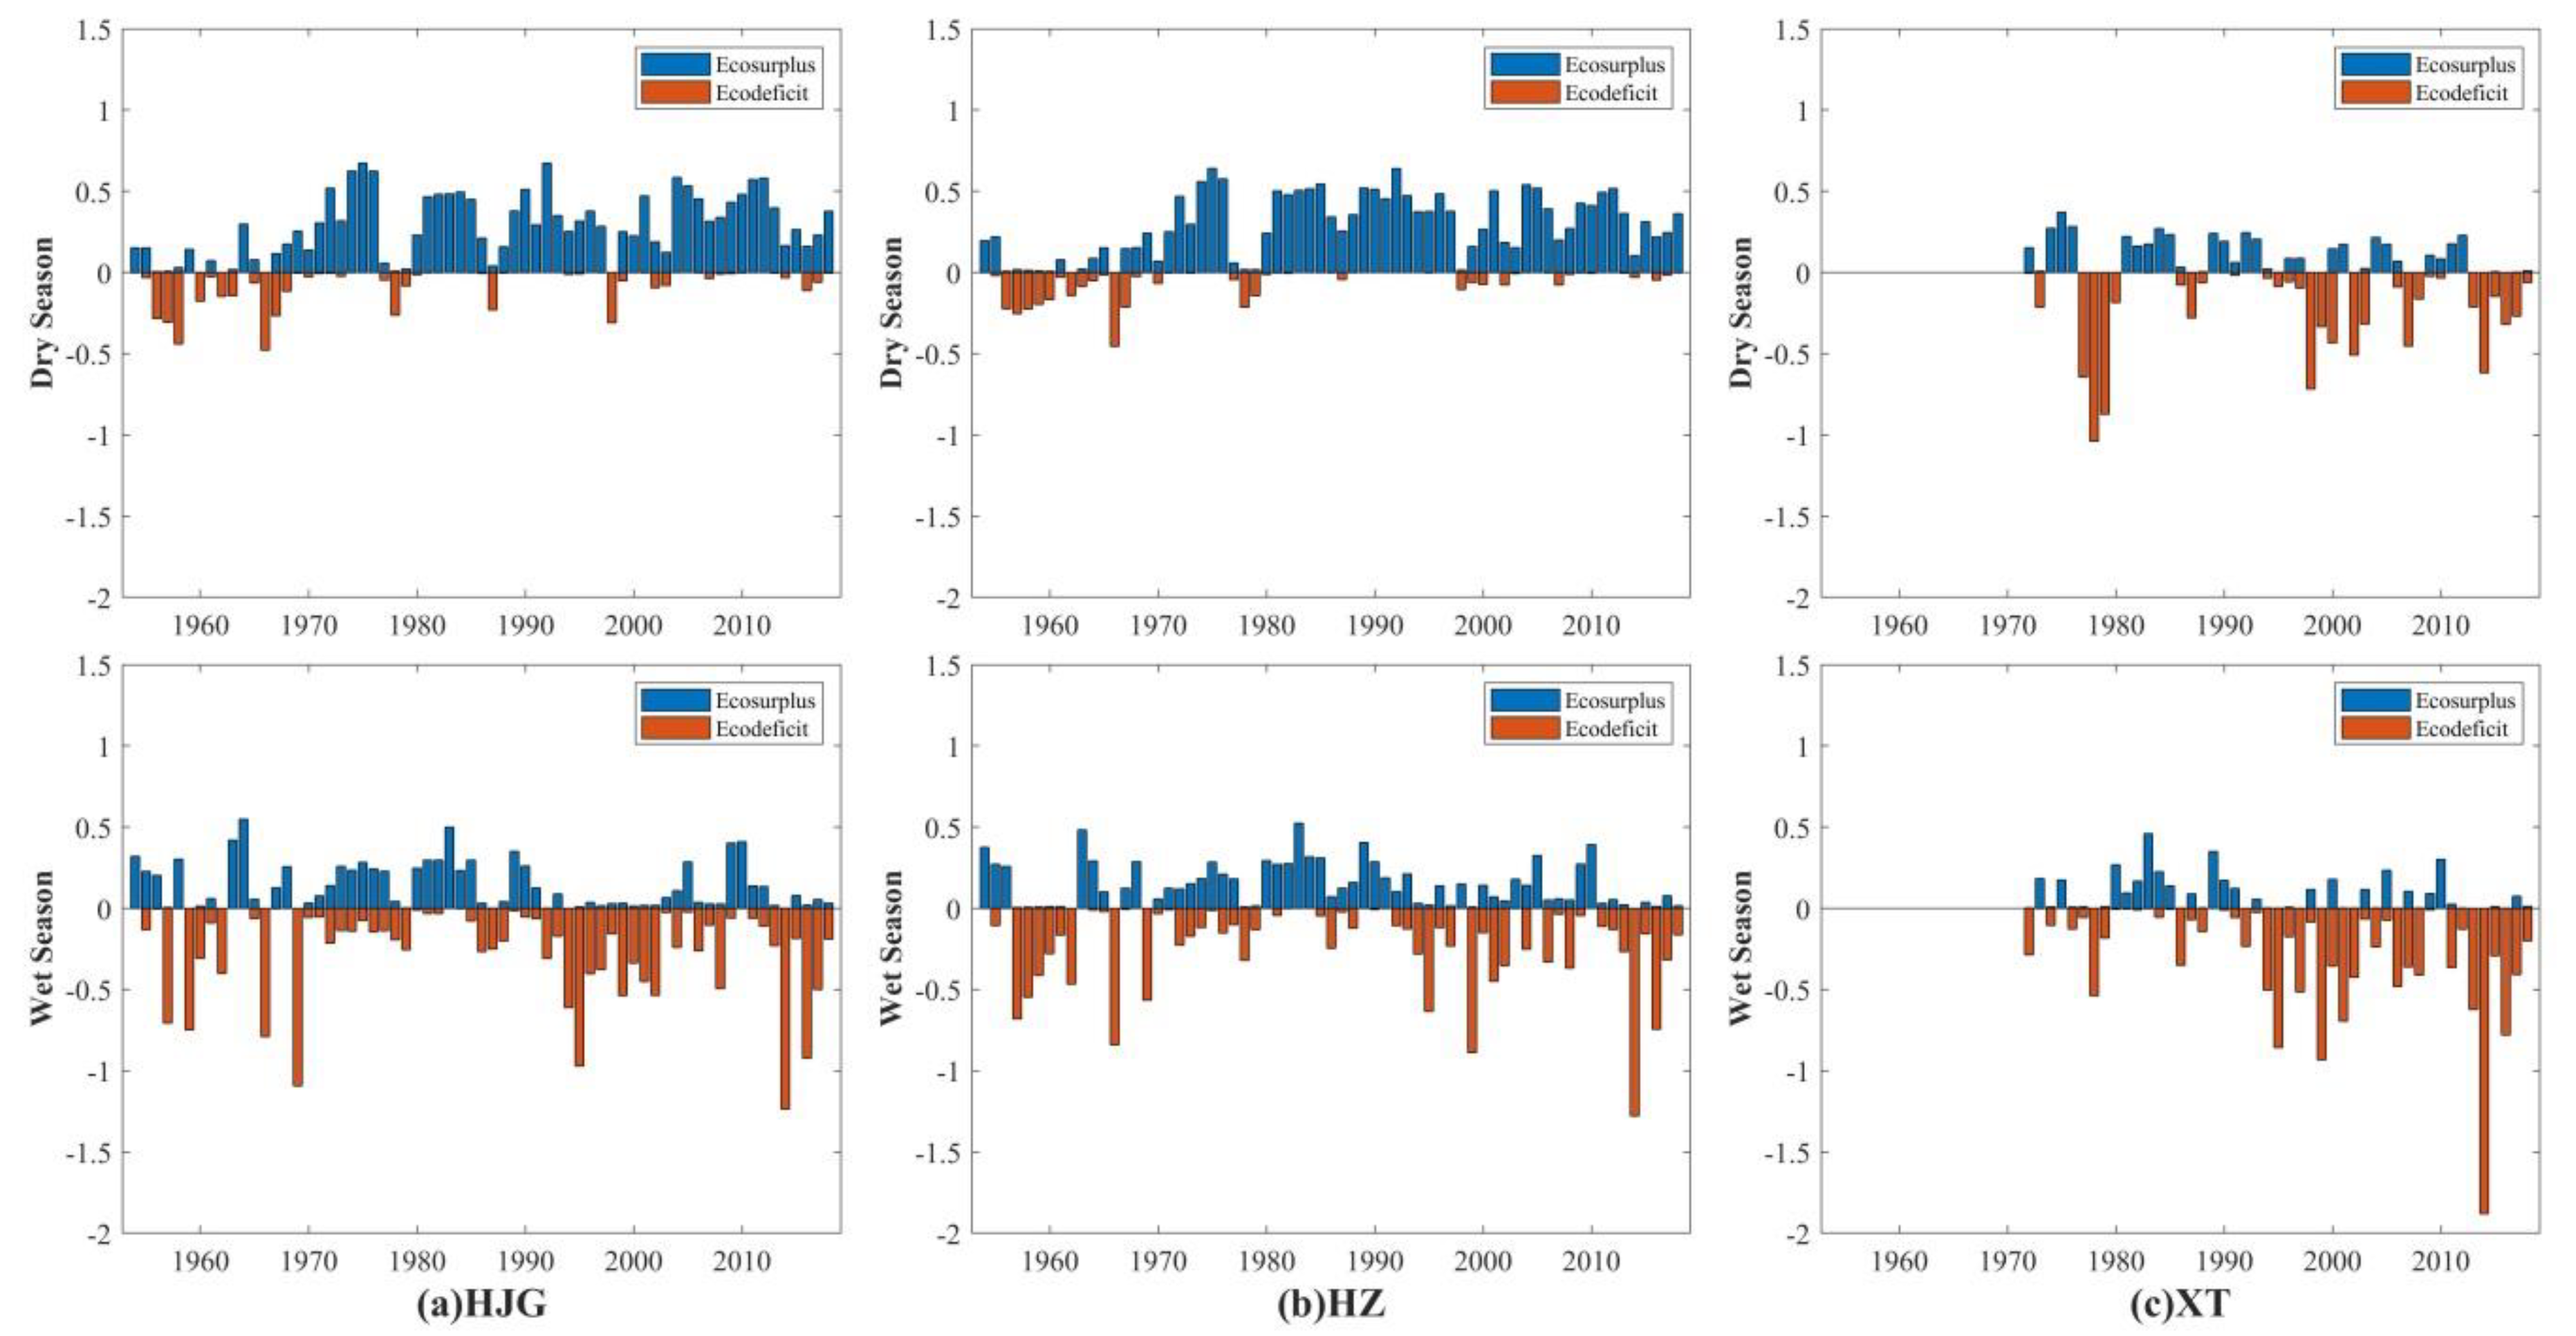
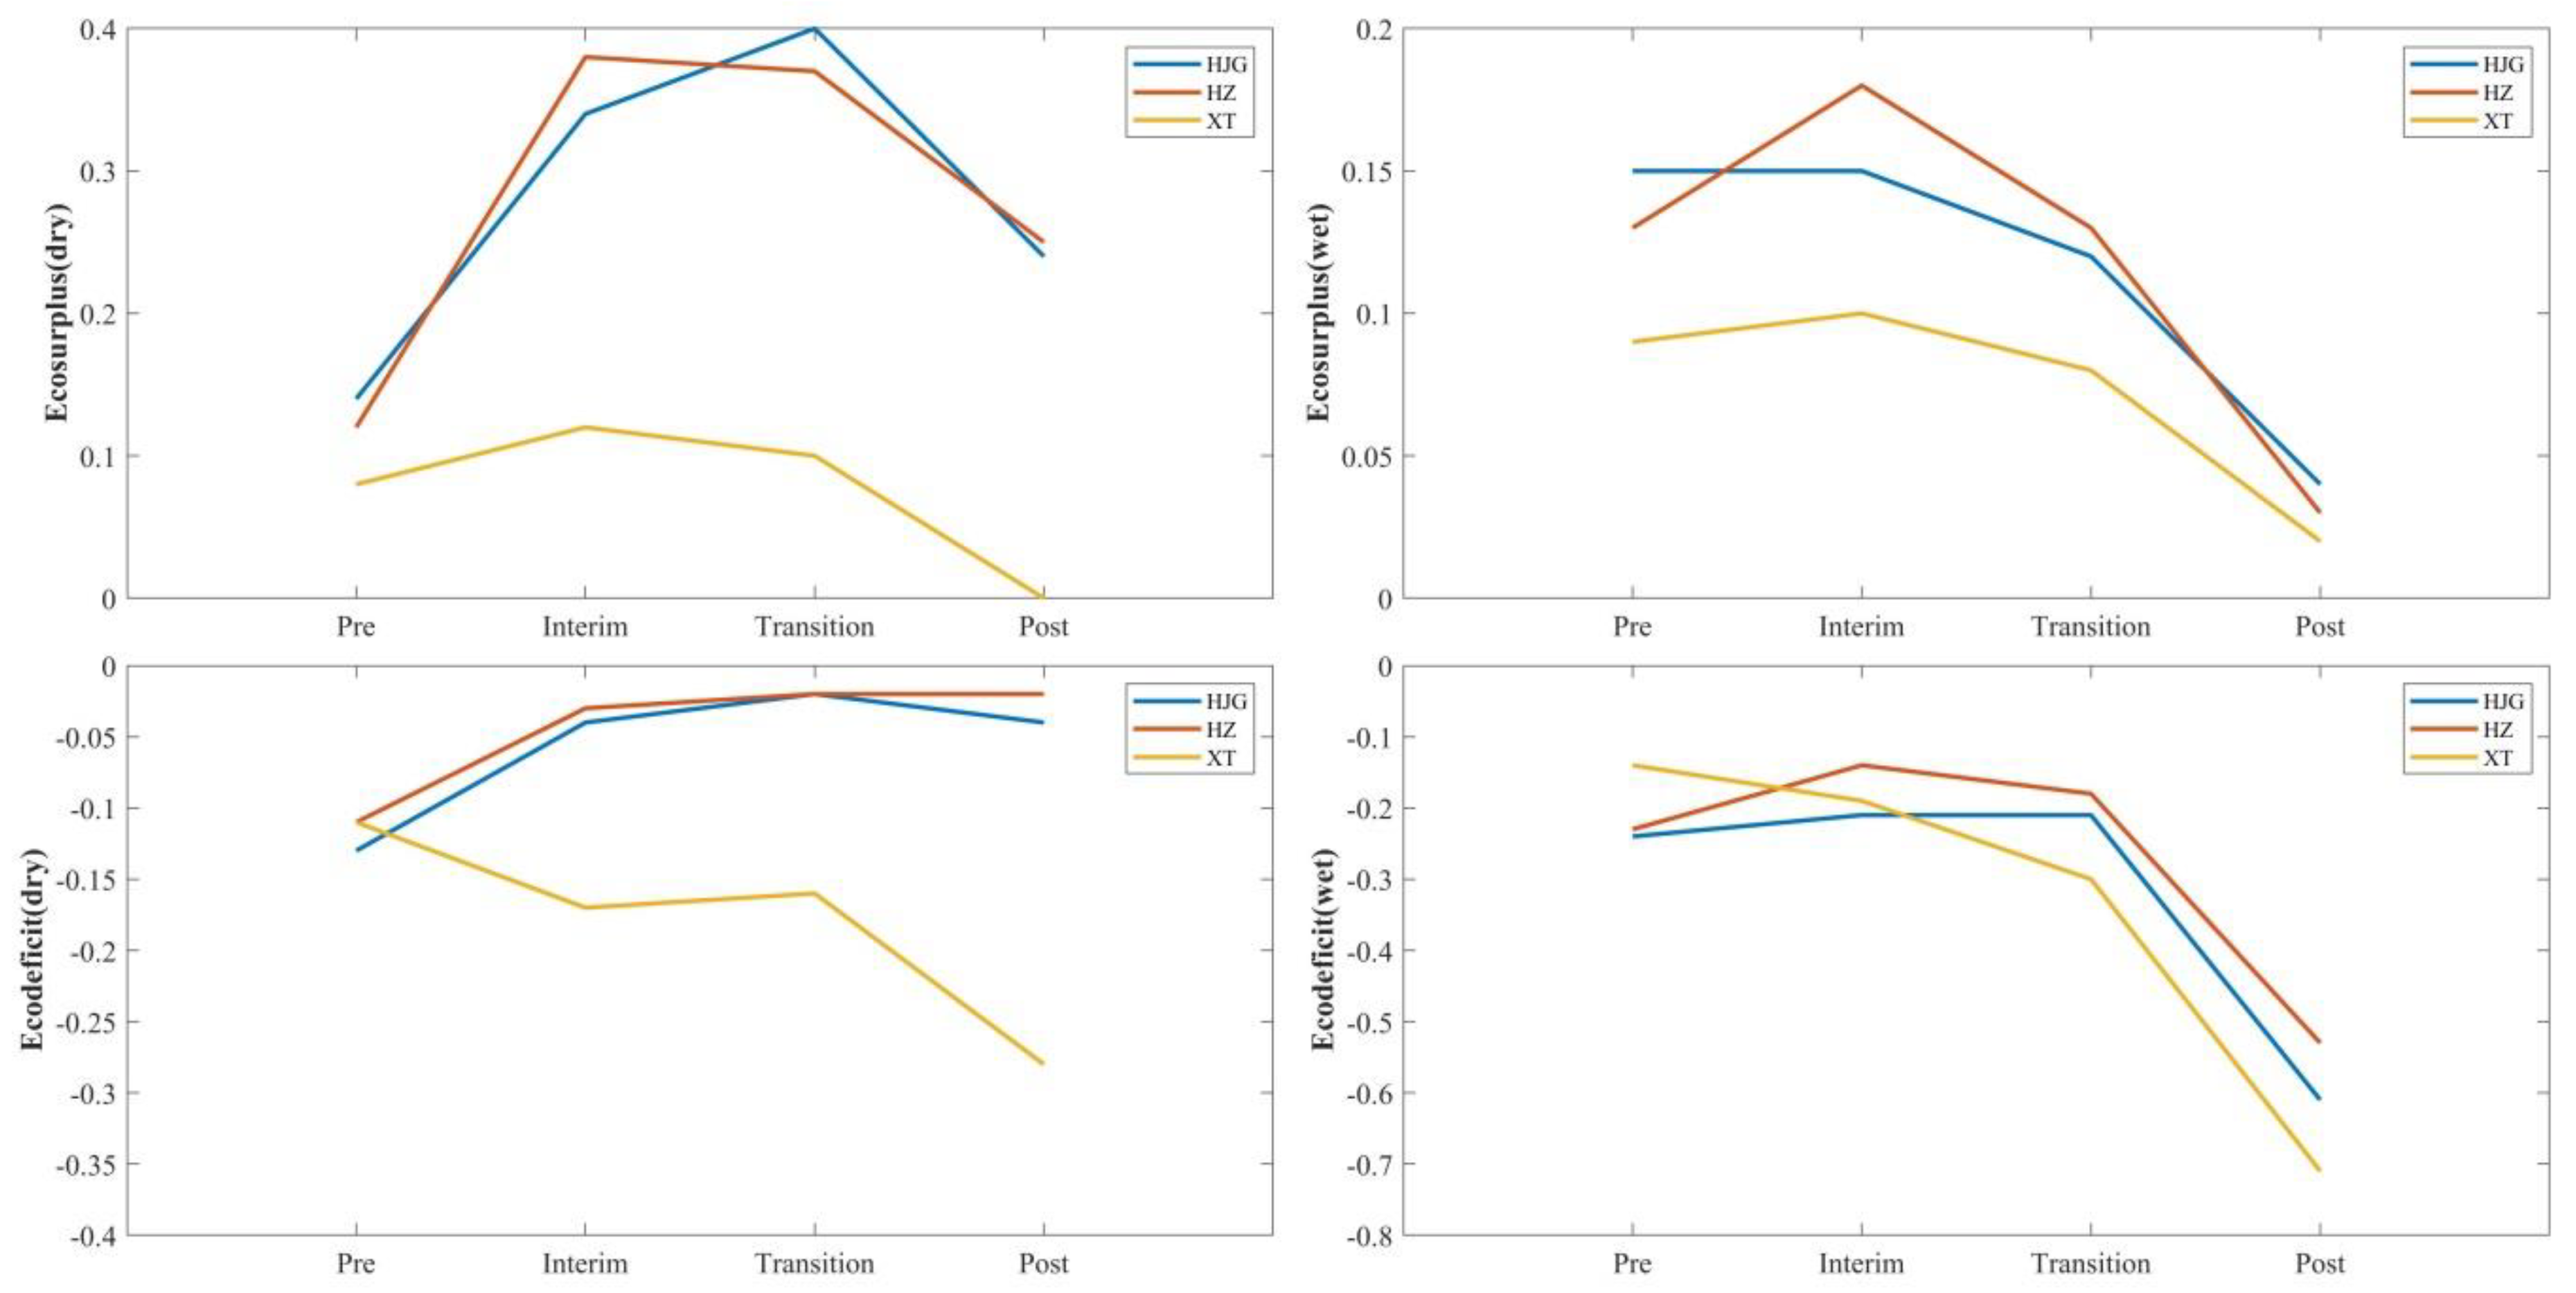
3.3. Eco-Flow Metrics
4. Results
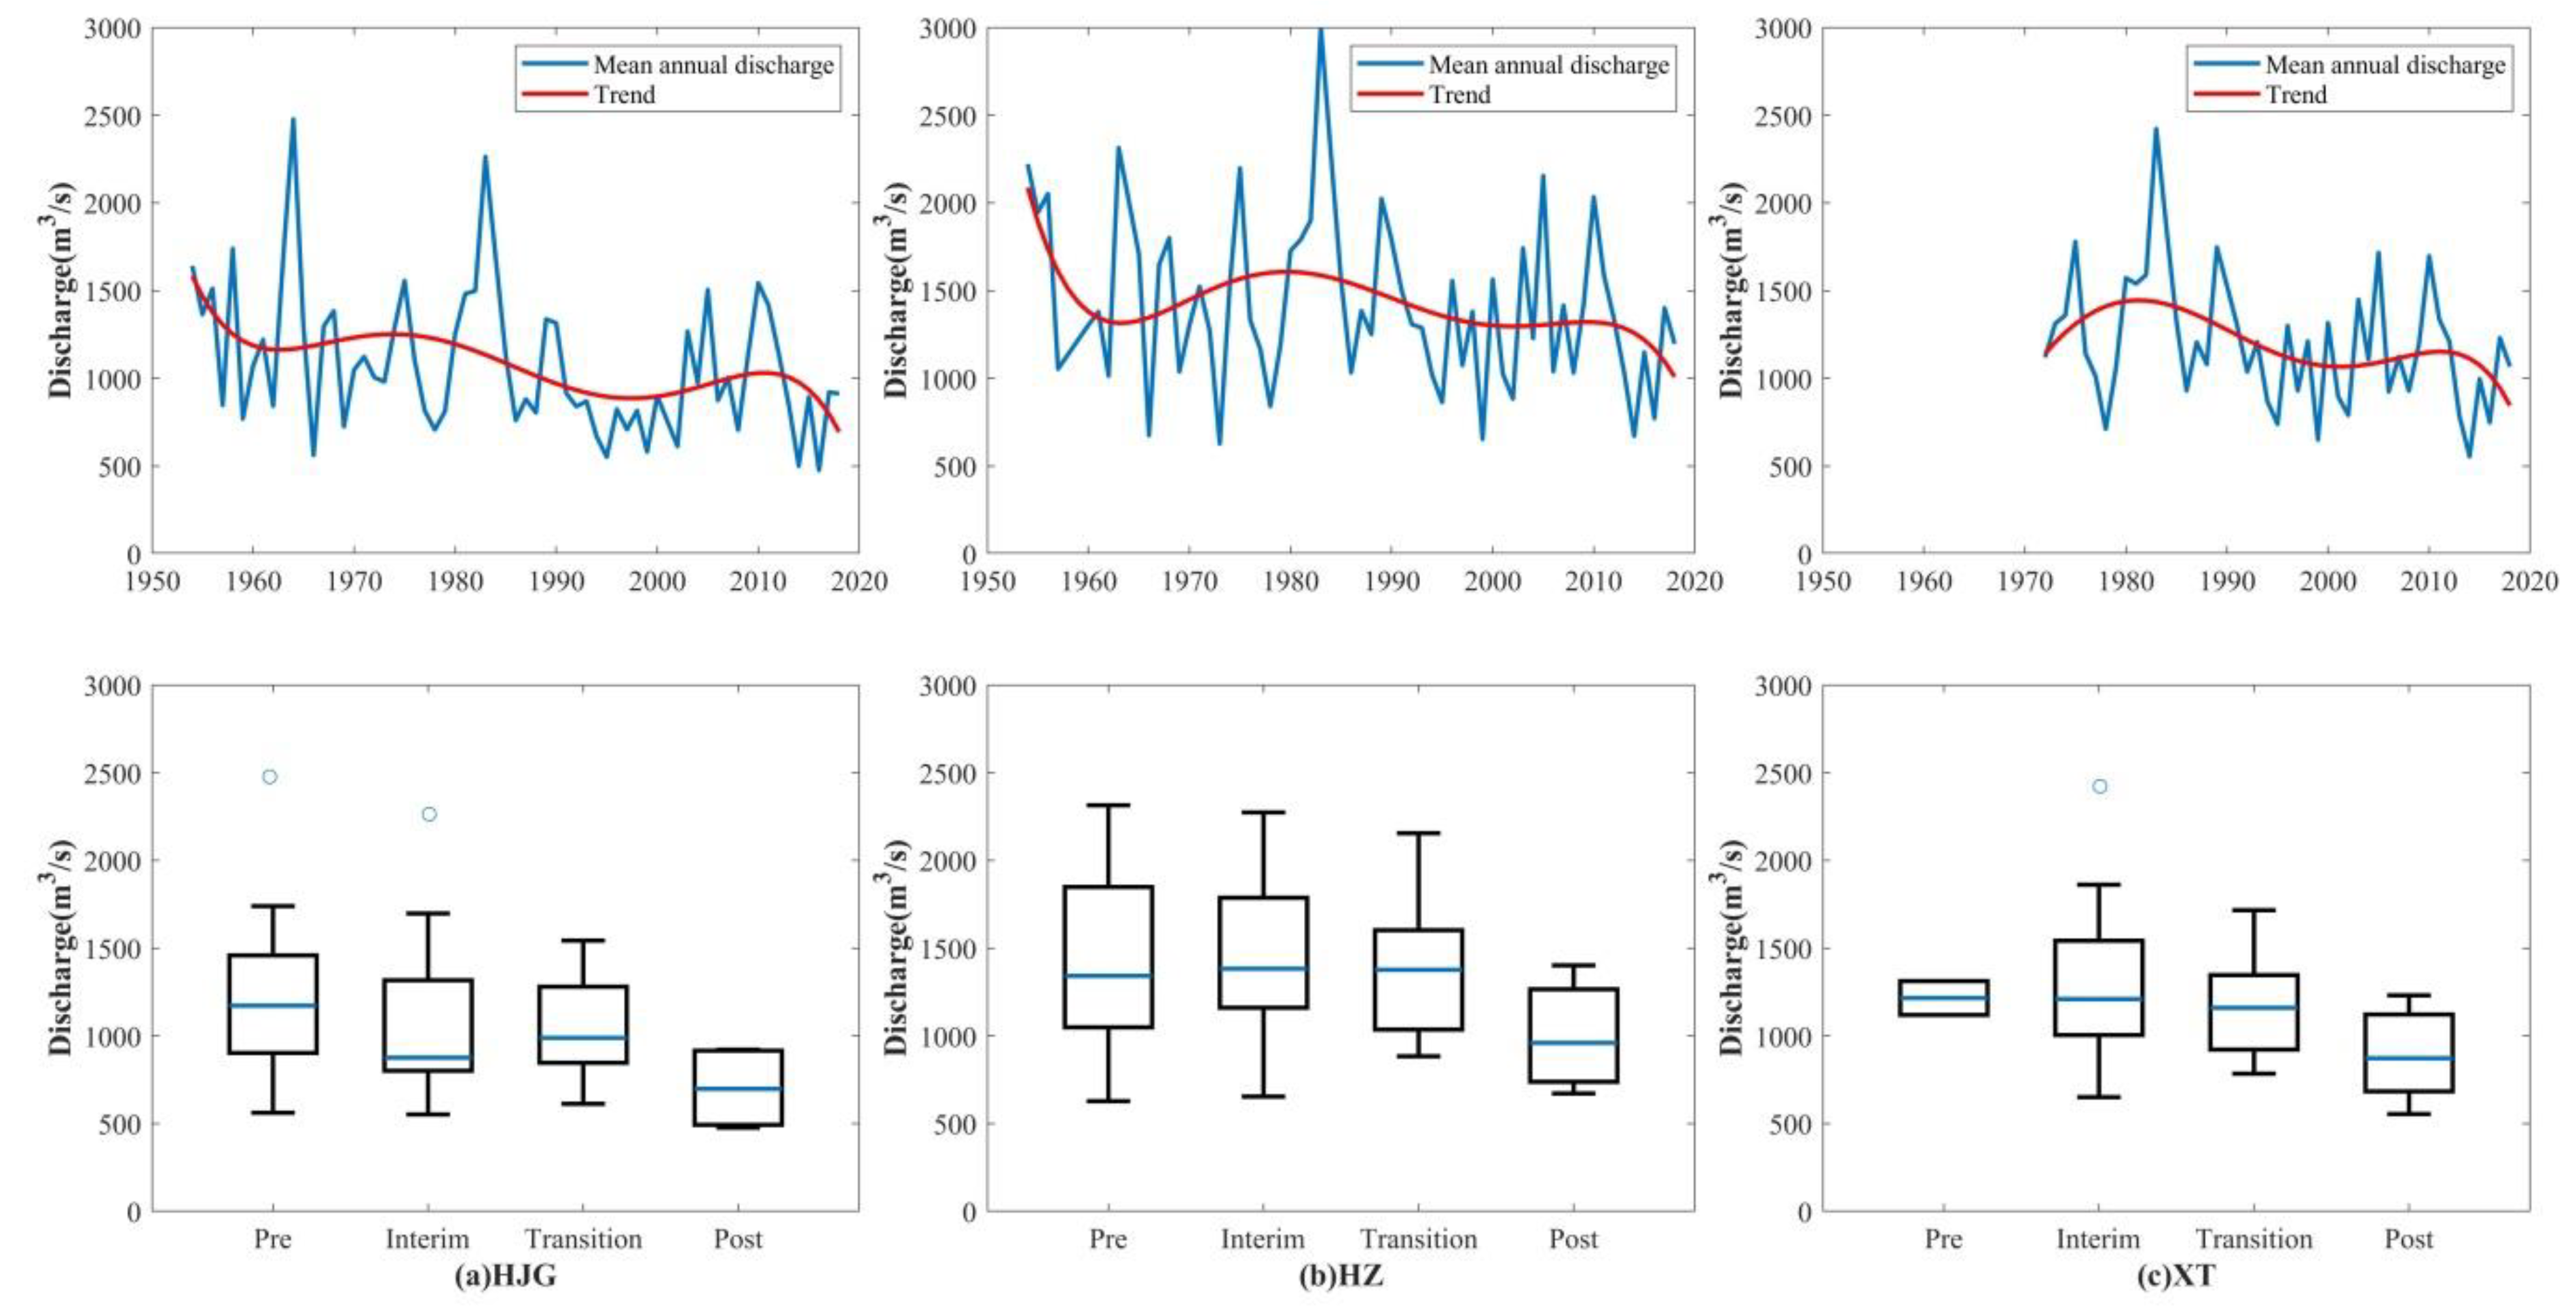
4.1. Analysis of Annual Discharge
4.2. Analysis of Seasonal Discharge
5. Discussion
5.1. Impact of DJK on the Streamflow
5.2. Impact of WFZ and CJY on the Streamflow
5.3. Impact of Water Diversion Projects and XL on the Streamflow
6. Conclusions
Author Contributions
Funding
Conflicts of Interest
References
- Poff, L.R.; Zimmerman, J.K.H. Ecological responses to altered flow regimes: A literature review to inform the science and management of environmental flows. Freshw. Biol. 2010, 55, 194–205. [Google Scholar] [CrossRef]
- Poff, N.L.; Allan, J.D.; Bain, M.B.; Karr, J.R.; Prestegaard, K.L.; Richter, B.D.; Sparks, R.E.; Stromberg, J.C. The Natural Flow Regime. BioScience 1997, 47, 769–784. [Google Scholar] [CrossRef]
- Magilligan, F.J.; Nislow, K.H. Changes in hydrologic regime by dams. Geomorphology 2005, 71, 61–78. [Google Scholar] [CrossRef]
- Brath, A.; Montanari, A.; Moretti, G. Assessing the effect on flood frequency of land use change via hydrological simulation (with uncertainty). J. Hydrol. 2006, 324, 141–153. [Google Scholar] [CrossRef]
- Li, Q.; Yu, M.; Lu, G.; Cai, T.; Xue, B.; Xia, Z. Impacts of the Gezhouba and Three Gorges reservoirs on the sediment regime in the Yangtze River, China. J. Hydrol. 2011, 403, 224–233. [Google Scholar] [CrossRef]
- Rolls, R.J.; Growns, I.O.; Khan, T.A.; Wilson, G.G.; Ellison, T.L.; Prior, A.; Waring, C.C. Fish recruitment in rivers with modified discharge depends on the interacting effects of flow and thermal regimes. Freshw. Biol. 2013, 58, 1804–1819. [Google Scholar] [CrossRef]
- Zhang, Q.; Xu, C.Y.; Becker, S.; Jiang, T. Sediment and runoff changes in the Yangtze River basin during past 50 years. J. Hydrol. 2006, 331, 511–523. [Google Scholar] [CrossRef]
- Rosenberg, D.M.; Mccully, P.; Pringle, C.M. Global-Scale Environmental Effects of Hydrological Alterations: Introduction. Bioscience 2000, 50, 746–751. [Google Scholar] [CrossRef] [Green Version]
- Biggs, B.J.F.; Nikora, V.I.; Snelder, T.H. Linking scales of flow variability to lotic ecosystem structure and function. River Res. Appl. 2005, 21, 283–298. [Google Scholar] [CrossRef]
- Olden, J.D.; Naiman, R.J. Incorporating thermal regimes into environmental flows assessments: Modifying dam operations to restore freshwater ecosystem integrity. Freshw. Biol. 2010, 55, 86–107. [Google Scholar] [CrossRef]
- Campisano, A.; Creaco, E.; Modica, C. Numerical modelling of sediment bed aggradation in open rectangular drainage channels. Urban Water J. 2013, 10, 365–376. [Google Scholar] [CrossRef]
- Christer, N.; Reidy, C.A.; Mats, D.; Carmen, R. Fragmentation and flow regulation of the world’s large river systems. Science 2005, 308, 405–408. [Google Scholar]
- Poff, N.L.; Matthews, J.H. Environmental flows in the Anthropocence: Past progress and future prospects. Curr. Opin. Environ. Sustain. 2013, 5, 667–675. [Google Scholar] [CrossRef]
- Caiola, N.; Ibáñez, C.; Verdú, J.; Munné, A. Effects of flow regulation on the establishment of alien fish species: A community structure approach to biological validation of environmental flows. Ecol. Indic. 2014, 45, 598–604. [Google Scholar] [CrossRef]
- Castello, L.; Macedo, M.N. Large-scale degradation of Amazonian freshwater ecosystems. Glob. Chang. Biol. 2016, 22, 990–1007. [Google Scholar] [CrossRef]
- Gao, B.; Yang, D.; Zhao, T.; Yang, H. Changes in the eco-flow metrics of the Upper Yangtze River from 1961 to 2008. J. Hydrol. 2012, 448–449, 30–38. [Google Scholar] [CrossRef]
- Wang, Y.; Rhoads, B.L.; Wang, D. Assessment of the flow regime alterations in the middle reach of the Yangtze River associated with dam construction: Potential ecological implications. Hydrol. Process. 2016, 30, 3949–3966. [Google Scholar] [CrossRef]
- Li, D.; Di, L.; Zhao, J.; Hui, L.; Yang, H. Observed changes in flow regimes in the Mekong River basin. J. Hydrol. 2017, 551, 217–232. [Google Scholar] [CrossRef]
- Richter, B.D.; Baumgartner, J.V.; Powell, J.; Braun, D.P. A Method for Assessing Hydrologic Alteration within Ecosystems. Conserv. Biol. 1996, 10, 1163–1174. [Google Scholar] [CrossRef] [Green Version]
- Richter, B.D.; Baumgartner, J.V.; Braun, D.P.; Powell, J. A spatial assessment of hydrologic alteration within a river network. Regul. Rivers Res. Manag. 1998, 14, 329–340. [Google Scholar] [CrossRef]
- Gao, Y.; Vogel, R.M.; Kroll, C.N.; Poff, N.L.; Olden, J.D. Development of representative indicators of hydrologic alteration. J. Hydrol. 2009, 374, 136–147. [Google Scholar] [CrossRef]
- Peres, D.J.; Cancelliere, A. Environmental Flow Assessment Based on Different Metrics of Hydrological Alteration. Water Resour. Manag. 2017, 30, 1–19. [Google Scholar] [CrossRef]
- Li, D.; Wan, W.; Zhao, J. Optimizing environmental flow operations based on explicit quantification of IHA parameters. J. Hydrol. 2018, 563, 510–522. [Google Scholar] [CrossRef]
- Richter, B.; Baumgartner, J.; Wigington, R.; Braun, D. How much water does a river need? Freshw. Biol. 1997, 37, 231–249. [Google Scholar] [CrossRef] [Green Version]
- Cochrane, T.A.; Arias, M.E.; Piman, T. Historical impact of water infrastructure on water levels of the Mekong River and the Tonle Sap system. Hydrol. Earth Syst. Sci. 2014, 18, 4529–4541. [Google Scholar] [CrossRef] [Green Version]
- Jackson, R.B.; Carpenter, S.R.; Dahm, C.N.; McKnight, D.M.; Naiman, R.J.; Postel, S.L.; Running, S.W. Water in a changing world. Ecol. Appl. 2001, 11, 1027–1045. [Google Scholar] [CrossRef]
- Postel, S.L.; Daily, G.C.; Ehrlich, P.R. Human appropriation of renewable fresh water. Science 1996, 271, 785–788. [Google Scholar] [CrossRef]
- Lu, W.; Lei, H.; Yang, D.; Tang, L.; Miao, Q. Quantifying the impacts of small dam construction on hydrological alterations in the Jiulong River basin of Southeast China. J. Hydrol. 2018, 567, 382–392. [Google Scholar] [CrossRef]
- Zhang, Q.; Zhang, Z.; Shi, P.; Singh, V.P.; Gu, X. Evaluation of ecological instream flow considering hydrological alterations in the Yellow River basin, China. Glob. Planet. Chang. 2018, 160, 61–74. [Google Scholar] [CrossRef]
- Yang, S.L.; Milliman, J.D.; Li, P.; Xu, K. 50,000 dams later: Erosion of the Yangtze River and its delta. Glob. Planet. Chang. 2011, 75, 14–20. [Google Scholar] [CrossRef]
- Wang, Y.; Wang, D.; Wu, J. Assessing the impact of Danjiangkou reservoir on ecohydrological conditions in Hanjiang river, China. Ecol. Eng. 2015, 81, 41–52. [Google Scholar] [CrossRef]
- Chen, D.; Hu, M.; Wang, J.; Guo, Y.; Dahlgren, R.A. Factors controlling phosphorus export from agricultural/forest and residential systems to rivers in eastern China, 1980–2011. J. Hydrol. 2016, 533, 53–61. [Google Scholar] [CrossRef] [Green Version]
- Ma, Z.; Kang, S.; Zhang, L.; Tong, L.; Su, X. Analysis of impacts of climate variability and human activity on streamflow for a river basin in arid region of northwest China. J. Hydrol. 2008, 352, 239–249. [Google Scholar] [CrossRef]
- Gocic, M.; Trajkovic, S. Analysis of changes in meteorological variables using Mann-Kendall and Sen’s slope estimator statistical tests in Serbia. Glob. Planet. Chang. 2013, 100, 172–1872. [Google Scholar] [CrossRef]
- Vogel, R.M.; Sieber, J.; Archfield, S.A.; Smith, M.P.; Apse, C.D.; Huber-Lee, A. Relations among storage, yield, and instream flow. Water Resour. Res. 2007, 43. [Google Scholar] [CrossRef]
- Vogel, R.M.; Member, J.; Fennessey, N. Flow—Duration Curves. I: New Interpretation and Confidence Intervals. J. Water Resour. Plan. Manag. 1994, 120, 485–504. [Google Scholar] [CrossRef]
- Vogel, R.M.; Fennessey, N. Flow duration curves II: A review of applications in water resources planning. J. Am. Water Resour. Assoc. 1995, 31, 1029–1039. [Google Scholar] [CrossRef]
- Long, D.; Yang, W.; Scanlon, B.R.; Zhao, J.; Liu, D.; Burek, P.; Pan, Y.; You, L.; Wada, Y. South-to-North Water Diversion stabilizing Beijing’s groundwater levels. Nat. Commun. 2020, 11, 3665. [Google Scholar] [CrossRef]


| Name | Commission Year | Total Capacity (billion m3) |
|---|---|---|
| MSNDWP | 2014 | 9.50 |
| YHDWP | 2014 | 3.70 |
| Danjiangkou Reservoir | (1973) 2013 * | (22.31) 33.91 |
| Wangfuzhou Reservoir | 2000 | 0.31 |
| Xinji Reservoir | - | 0.44 |
| Cuijiaying Reservoir | 2010 | 0.25 |
| Yakou Reservoir | - | 0.70 |
| Nianpanshan Reservoir | - | 0.90 |
| Xinglong Reservoir | 2014 | 0.49 |
| Category | Parameters | |
|---|---|---|
| Group 1: Magnitude of monthly water conditions | Mean flow in January Mean flow in July Mean flow in February Mean flow in August Mean flow in March Mean flow in September | Mean flow in April Mean flow in October Mean flow in May Mean flow in November Mean flow in June Mean flow in December |
| Group 2: Magnitude and duration of annual extreme water conditions | Annual minima, 1-day mean Annual minima, 3-day means Annual minima, 7-day means Annual minima, 30-day means Annual minima, 90-day means Number of zero-flow days | Annual maxima, 1-day mean Annual maxima, 3-day means Annual maxima, 7-day means Annual maxima, 30-day means Annual maxima, 90-day means Base flow index * |
| Group 3: timing of annual extreme water conditions | Date of 1-day maximum | Date of 1-day minimum |
| Group 4: frequency and duration of high and low pulses | Number of low pulses each year Mean duration of low pulses (days) | Number of high pulses each year Mean duration of high pulses (days) |
| Group 5: rate and frequency of water condition changes | Rise rates: Mean of all positive differences between consecutive daily values Number of hydrologic reversals | Fall rates: Mean of all negative differences between consecutive daily values |
| Huangjiagang | Huangzhuang | |||||
|---|---|---|---|---|---|---|
| Pre-Impact Period (1954–1973) | Interim period (1974–1999) | Pre-Impact Period (1954–1973) | Interim Period (1974–1999) | |||
| Mean Value | Mean Value | Relative Change (%) | Mean Value | Mean Value | Relative Change (%) | |
| Group 1: Mean Flow | ||||||
| January | − | 693.10 | 87.12 | 488.00 | 918.10 | 88.14 |
| February | 352.60 | 635.20 | 80.15 | 459.90 | 881.30 | 91.63 |
| March | 533.10 | 655.30 | 22.92 | 618.50 | 901.90 | 45.82 |
| April | 1055.00 | 773.50 | −26.68 | 1122.00 | 1008.00 | −10.16 |
| May | 1525.00 | 873.80 | −42.70 | 1769.00 | 1226.00 | −30.70 |
| June | 1121.00 | 1046.00 | −6.69 | 1390.00 | 1491.00 | 7.27 |
| July | 2449.00 | 1622.00 | −33.77 | 3055.00 | 2410.00 | −21.11 |
| August | 1864.00 | 1673.00 | −10.25 | 2717.00 | 2630.00 | −3.20 |
| September | 2281.00 | 1768.00 | −22.49 | 2396.00 | 2299.00 | −4.05 |
| October | 1737.00 | 1299.00 | −25.22 | 1884.00 | 1813.00 | −3.77 |
| November | 854.90 | 764.70 | −10.55 | 1026.00 | 1078.00 | 5.07 |
| December | 547.10 | 688.70 | 25.88 | 688.50 | 913.90 | 32.74 |
| Group 2: Annual Extreme | ||||||
| 1-day minimum | 197.60 | 311.10 | 57.44 | 295.50 | 565.00 | 91.20 |
| 3-day minimum | 215.80 | 377.70 | 75.02 | 302.60 | 578.00 | 91.01 |
| 7-day minimum | 231.60 | 411.40 | 77.63 | 321.40 | 598.50 | 86.22 |
| 30-day minimum | 274.00 | 476.50 | 73.91 | 364.70 | 671.70 | 84.18 |
| 90-day minimum | 393.80 | 555.40 | 41.04 | 500.30 | 759.90 | 51.89 |
| 1-day maximum | 12030.00 | 6667.00 | −44.58 | 12260.00 | 9146.00 | −25.40 |
| 3-day maximum | 10240.00 | 6003.00 | −41.38 | 11170.00 | 7941.00 | −28.91 |
| 7-day maximum | 7537.00 | 4896.00 | −35.04 | 8647.00 | 6384.00 | −26.17 |
| 30-day maximum | 4160.00 | 2857.00 | −31.32 | 4801.00 | 3834.00 | −20.14 |
| 90-day maximum | 2579.00 | 1914.00 | −25.79 | 3080.00 | 2724.00 | −11.56 |
| Group 3: Timing of Extreme | ||||||
| Number of zero days | 0.00 | 0.00 | − | 0.00 | 0.00 | − |
| Base flow index | 0.21 | 0.42 | 101.10 | 0.24 | 0.43 | 78.93 |
| Date of minimum | 112.80 | 134.15 | 18.93 | 106.88 | 141.04 | 31.96 |
| Date of maximum | 223.50 | 206.70 | −7.52 | 209.71 | 223.65 | 6.65 |
| Group 4: Frequency and Duration | ||||||
| Low pulse count | 4.55 | 7.23 | 58.92 | 3.77 | 1.15 | −69.35 |
| Low pulse duration | 22.04 | 4.27 | −80.61 | 33.10 | 15.28 | −53.84 |
| High pulse count | 5.80 | 1.96 | −66.17 | 4.94 | 3.23 | −34.61 |
| High pulse duration | 5.47 | 6.19 | 13.28 | 6.84 | 5.26 | −23.18 |
| Group 5: Rate | ||||||
| Rise rate | 447.30 | 157.50 | −64.79 | 431.60 | 194.70 | −54.89 |
| Fall rate | 230.60 | 160.30 | −30.49 | 217.00 | 163.70 | −24.56 |
| Number of reversals | 95.35 | 183.20 | 92.13 | 72.41 | 124.50 | 71.94 |
| Huangzhuang | Xiantao | |||||
|---|---|---|---|---|---|---|
| Interim Period (1974–1999) | Transition Period (2000–2013) | Interim Period (1974–1999) | Transition Period (2000–2013) | |||
| Mean Value | Mean Value | Relative Change (%) | Mean Value | Mean Value | Relative Change (%) | |
| Group 1: Mean Flow | ||||||
| January | 918.10 | 866.80 | −5.59 | 872.30 | 814.40 | −6.64 |
| February | 881.30 | 838.20 | −4.89 | 832.90 | 796.10 | −4.42 |
| March | 901.90 | 878.10 | −2.64 | 843.90 | 837.50 | −0.76 |
| April | 1008.00 | 917.40 | −8.99 | 850.30 | 820.80 | −3.47 |
| May | 1226.00 | 1038.00 | −15.33 | 1028.00 | 916.70 | −10.83 |
| June | 1491.00 | 1197.00 | −19.72 | 1246.00 | 1012.00 | −18.78 |
| July | 2410.00 | 2282.00 | −5.31 | 1974.00 | 1781.00 | −9.78 |
| August | 2630.00 | 2584.00 | −1.75 | 2112.00 | 1954.00 | −7.48 |
| September | 2299.00 | 2524.00 | 9.79 | 1885.00 | 2035.00 | 7.96 |
| October | 1813.00 | 1526.00 | −15.83 | 1568.00 | 1288.00 | −17.86 |
| November | 1078.00 | 1016.00 | −5.75 | 999.10 | 928.60 | −7.06 |
| December | 913.90 | 887.80 | −2.86 | 864.80 | 814.60 | −5.80 |
| Group 2: Annual Extreme | ||||||
| 1-day minimum | 565.00 | 519.50 | −8.05 | 495.10 | 475.10 | −4.04 |
| 3-day minimum | 578.00 | 542.20 | −6.19 | 531.40 | 487.90 | −8.19 |
| 7-day minimum | 598.50 | 563.10 | −5.91 | 556.10 | 508.90 | −8.49 |
| 30-day minimum | 671.70 | 627.00 | −6.65 | 621.00 | 568.20 | −8.50 |
| 90-day minimum | 759.90 | 701.30 | −7.71 | 701.70 | 627.10 | −10.63 |
| 1-day maximum | 9146.00 | 7584.00 | −17.08 | 5985.00 | 5102.00 | −14.75 |
| 3-day maximum | 7941.00 | 7050.00 | −11.22 | 5554.00 | 4916.00 | −11.49 |
| 7-day maximum | 6384.00 | 5958.00 | −6.67 | 4773.00 | 4332.00 | −9.24 |
| 30-day maximum | 3834.00 | 3795.00 | −1.02 | 3059.00 | 2925.00 | −4.38 |
| 90-day maximum | 2724.00 | 2683.00 | −1.51 | 2206.00 | 2138.00 | −3.08 |
| Group 3: Timing of Extreme | ||||||
| Number of zero days | 0.00 | 0.00 | − | 0.00 | 0.00 | − |
| Base flow index | 0.43 | 0.43 | −0.65 | 0.46 | 0.45 | −2.78 |
| Date of minimum | 141.04 | 193.21 | 36.99 | 139.38 | 144.50 | 3.67 |
| Date of maximum | 223.65 | 213.93 | −4.35 | 232.35 | 215.43 | −7.28 |
| Group 4: Frequency and Duration | ||||||
| Low pulse count | 1.15 | 3.00 | 159.97 | 0.00 | 0.00 | − |
| Low pulse duration | 15.28 | 10.72 | −29.84 | − | − | − |
| High pulse count | 3.23 | 2.29 | −29.25 | 3.35 | 2.36 | −29.56 |
| High pulse duration | 5.26 | 8.23 | 56.46 | 7.44 | 10.48 | 40.92 |
| Group 5: Rate | ||||||
| Rise rate | 194.70 | 148.40 | −23.78 | 124.10 | 89.76 | −27.67 |
| Fall rate | 163.70 | 120.00 | −26.70 | 96.89 | 69.81 | −27.95 |
| Number of reversals | 124.50 | 152.50 | 22.49 | 97.42 | 101.90 | 4.60 |
| Huangjiagang | Huangzhuang | Xiantao | |||||||
|---|---|---|---|---|---|---|---|---|---|
| Transition Period (2000–2013) | Post-Impact Period (2014–2018) | Transition Period (2000–2013) | Post-Impact Period (2014–2018) | Transition Period (2000–2013) | Post-Impact Period (2014–2018) | ||||
| Mean Value | Mean Value | Relative Change (%) | Mean Value | Mean Value | Relative Change (%) | Mean Value | Mean Value | Relative Change (%) | |
| Group 1: Mean Flow | |||||||||
| January | 737.20 | 539.40 | −26.83 | 866.80 | 697.30 | −19.55 | 814.40 | 611.80 | −24.88 |
| February | 741.80 | 566.30 | −23.66 | 838.20 | 686.60 | −18.09 | 796.10 | 625.40 | −21.44 |
| March | 764.40 | 556.30 | −27.22 | 878.10 | 722.00 | −17.78 | 837.50 | 671.30 | −19.84 |
| April | 827.20 | 704.70 | −14.81 | 917.40 | 959.90 | 4.63 | 820.80 | 857.20 | 4.43 |
| May | 890.00 | 838.20 | −5.82 | 1038.00 | 1130.00 | 8.86 | 916.70 | 1006.00 | 9.74 |
| June | 940.90 | 1018.00 | 8.19 | 1197.00 | 1362.00 | 13.78 | 1012.00 | 1145.00 | 13.14 |
| July | 1450.00 | 983.20 | −32.19 | 2282.00 | 1375.00 | −39.75 | 1781.00 | 1251.00 | −29.76 |
| August | 1630.00 | 678.00 | −58.40 | 2584.00 | 1063.00 | −58.86 | 1954.00 | 902.30 | −53.82 |
| September | 1854.00 | 697.10 | −62.40 | 2524.00 | 987.00 | −60.90 | 2035.00 | 815.80 | −59.91 |
| October | 1171.00 | 1221.00 | 4.27 | 1526.00 | 1923.00 | 26.02 | 1288.00 | 1704.00 | 32.30 |
| November | 788.80 | 547.50 | −30.59 | 1016.00 | 812.20 | −20.06 | 928.60 | 776.40 | −16.39 |
| December | 756.80 | 527.30 | −30.33 | 887.80 | 704.00 | −20.70 | 814.60 | 635.40 | −22.00 |
| Group 2: Annual Extreme | |||||||||
| 1-day minimum | 425.10 | 355.10 | −16.47 | 519.50 | 444.90 | −14.36 | 475.10 | 397.70 | −16.29 |
| 3-day minimum | 453.00 | 367.20 | −18.94 | 542.20 | 452.50 | −16.54 | 487.90 | 407.00 | −16.58 |
| 7-day minimum | 478.40 | 378.60 | −20.86 | 563.10 | 477.50 | −15.20 | 508.90 | 416.60 | −18.14 |
| 30-day minimum | 540.40 | 398.40 | −26.28 | 627.00 | 524.50 | −16.35 | 568.20 | 473.10 | −16.74 |
| 90-day minimum | 609.00 | 438.40 | −28.01 | 701.30 | 565.20 | −19.41 | 627.10 | 535.90 | −14.54 |
| 1-day maximum | 4998.00 | 2857.00 | −42.84 | 7584.00 | 5116.00 | −32.54 | 5102.00 | 3808.00 | −25.36 |
| 3-day maximum | 4770.00 | 2748.00 | −42.39 | 7050.00 | 4722.00 | −33.02 | 4916.00 | 3647.00 | −25.81 |
| 7-day maximum | 4285.00 | 2622.00 | −38.81 | 5958.00 | 4043.00 | −32.14 | 4332.00 | 3312.00 | −23.55 |
| 30-day maximum | 2632.00 | 1999.00 | −24.05 | 3795.00 | 2956.00 | −22.11 | 2925.00 | 2532.00 | −13.44 |
| 90-day maximum | 1872.00 | 1312.00 | −29.91 | 2683.00 | 1943.00 | −27.58 | 2138.00 | 1682.00 | −21.33 |
| Group 3: Timing of Extreme | |||||||||
| Number of zero days | 0.00 | 0.00 | − | 0.00 | 0.00 | − | 0.00 | 0.00 | − |
| Base flow index | 0.47 | 0.54 | 14.56 | 0.43 | 0.48 | 11.71 | 0.45 | 0.45 | −0.31 |
| Date of minimum | 200.36 | 142.20 | −29.03 | 193.21 | 251.80 | 30.32 | 144.50 | 201.20 | 39.24 |
| Date of maximum | 210.50 | 240.00 | 14.01 | 213.93 | 226.20 | 5.74 | 215.43 | 227.60 | 5.65 |
| Group 4: Frequency and Duration | |||||||||
| Low pulse count | 1.64 | 6.60 | 301.70 | 3.00 | 8.40 | 180.00 | 0.00 | 0.20 | − |
| Low pulse duration | 9.45 | 5.17 | −45.30 | 10.72 | 4.18 | −61.05 | − | 3.00 | − |
| High pulse count | 1.21 | 0.40 | −67.05 | 2.29 | 0.60 | −73.75 | 2.36 | 1.20 | −49.09 |
| High pulse duration | 9.14 | 10.00 | 9.42 | 8.23 | 13.00 | 58.05 | 10.48 | 8.83 | −15.72 |
| Group 5: Rate | |||||||||
| Rise rate | 96.35 | 49.95 | −48.16 | 148.40 | 95.93 | −35.36 | 89.76 | 52.62 | −41.38 |
| Fall rate | 97.57 | 49.70 | −49.06 | 120.00 | 76.63 | −36.14 | 69.81 | 44.96 | −35.60 |
| Number of reversals | 194.60 | 193.60 | −0.51 | 152.50 | 136.20 | −10.69 | 101.90 | 106.20 | 4.22 |
© 2020 by the authors. Licensee MDPI, Basel, Switzerland. This article is an open access article distributed under the terms and conditions of the Creative Commons Attribution (CC BY) license (http://creativecommons.org/licenses/by/4.0/).
Share and Cite
Yin, X.; Zhang, J.; Chen, J. The Impact of Multi-Projects on the Alteration of the Flow Regime in the Middle and Lower Course of the Hanjiang River, China. Water 2020, 12, 2301. https://doi.org/10.3390/w12082301
Yin X, Zhang J, Chen J. The Impact of Multi-Projects on the Alteration of the Flow Regime in the Middle and Lower Course of the Hanjiang River, China. Water. 2020; 12(8):2301. https://doi.org/10.3390/w12082301
Chicago/Turabian StyleYin, Xin, Jianyun Zhang, and Jie Chen. 2020. "The Impact of Multi-Projects on the Alteration of the Flow Regime in the Middle and Lower Course of the Hanjiang River, China" Water 12, no. 8: 2301. https://doi.org/10.3390/w12082301
APA StyleYin, X., Zhang, J., & Chen, J. (2020). The Impact of Multi-Projects on the Alteration of the Flow Regime in the Middle and Lower Course of the Hanjiang River, China. Water, 12(8), 2301. https://doi.org/10.3390/w12082301