
Design Floods Considering the Epistemic Uncertainty


Abstract
:1. Introduction
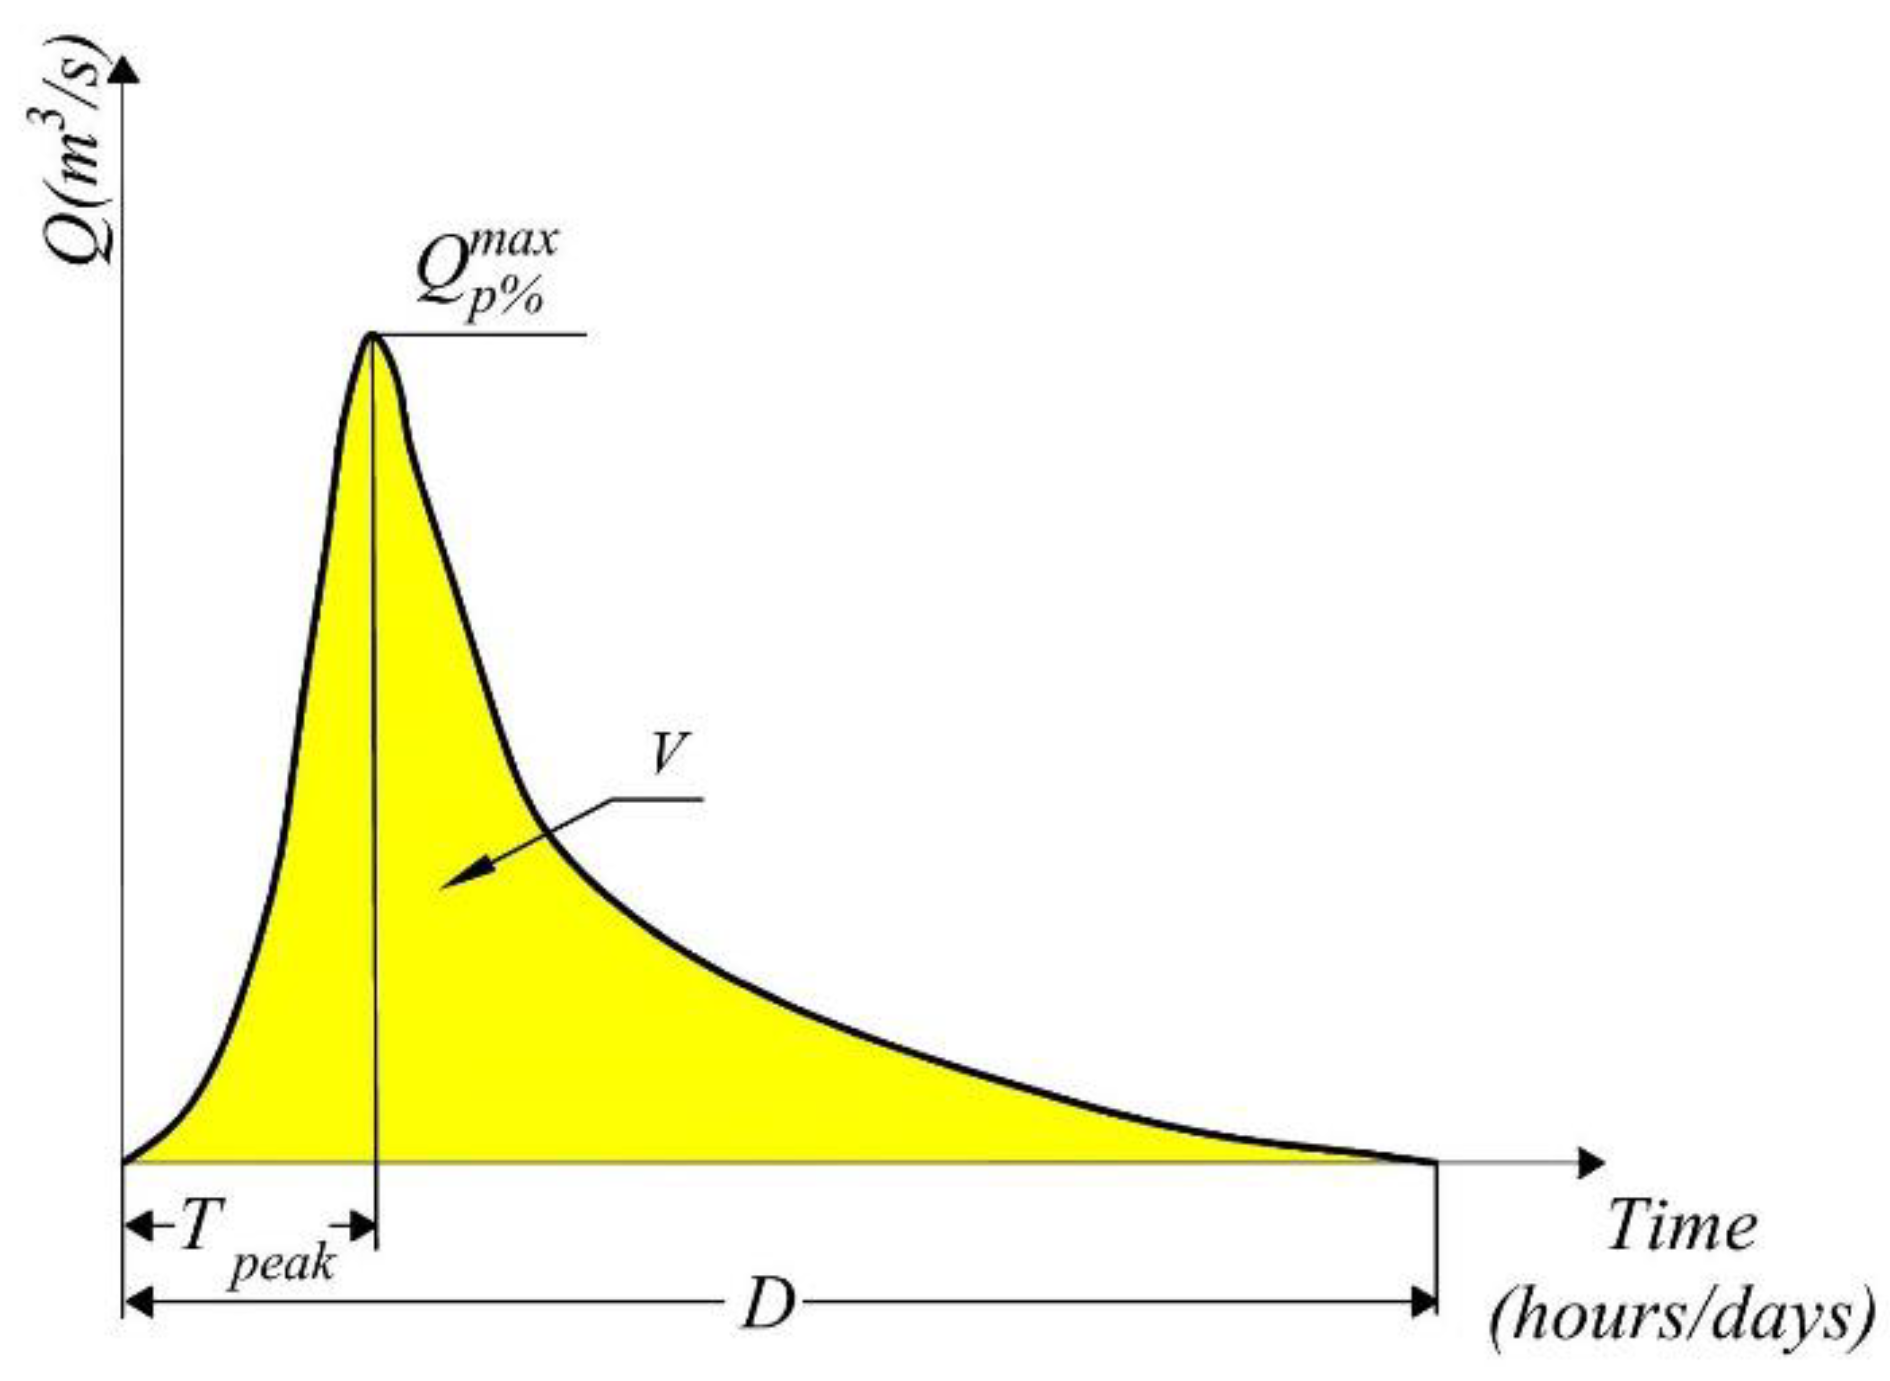
1.1. Parameters of the Design Flood (DF)
- Empirical formulae, which derive the peak discharge as a function of catchment characteristics and climatic factors;
- Envelope curves of observed floods;
- Frequency analysis methods for observed floods. Such an analysis can cover in situ or regional data;
- Joint (peak-volume) design flood methodology, which evaluates the exceedance probability of the DF volume, given a design peak discharge (based on a regional approach);
- Rainfall-based methods: (i) the design event-based models consider that the probability of exceedance of the design flood is equal to the probability of exceedance of the input rainfall (assumption valid for small catchments); (ii) in the joint probability approach, a deterministic rainfall–runoff model receives probability-distributed inputs to obtain probability-distributed outputs; (iii) the continuous simulation uses the recorded or synthetic long-term rainfall in order to compute the flood hydrographs, which are subsequently subjected to statistical processing.
- (a)
- —maximum discharges corresponding to probability of exceedance;
- (b)
- —time to peak of the flood hydrograph;
- (c)
- —total duration of the flood hydrograph;
- (d)
- —compactness coefficient, which is a parameter that encompasses three correlated variables: , and
1.2. Frequency Analysis and Statistical Tests
- Annual Maximum Series (AMS), the processed data being the annual maximum discharges [5];
- (a)
- For the annual maximum series: GEV, P3, log-Pearson 3 (LP3), Gamma2, Generalized Gamma, log-normal distribution (LN), and so forth.
- (b)
- For partial duration series: Generalized Pareto (GP), Weibull, LP3, Gamma2, Generalized Gamma distribution, and so forth.
2. Materials and Methods
- Annual Maximum Series (AMS approach);
- Flood volumes, with a selection of the floods whose discharges exceeded a specified threshold value (POT approach).
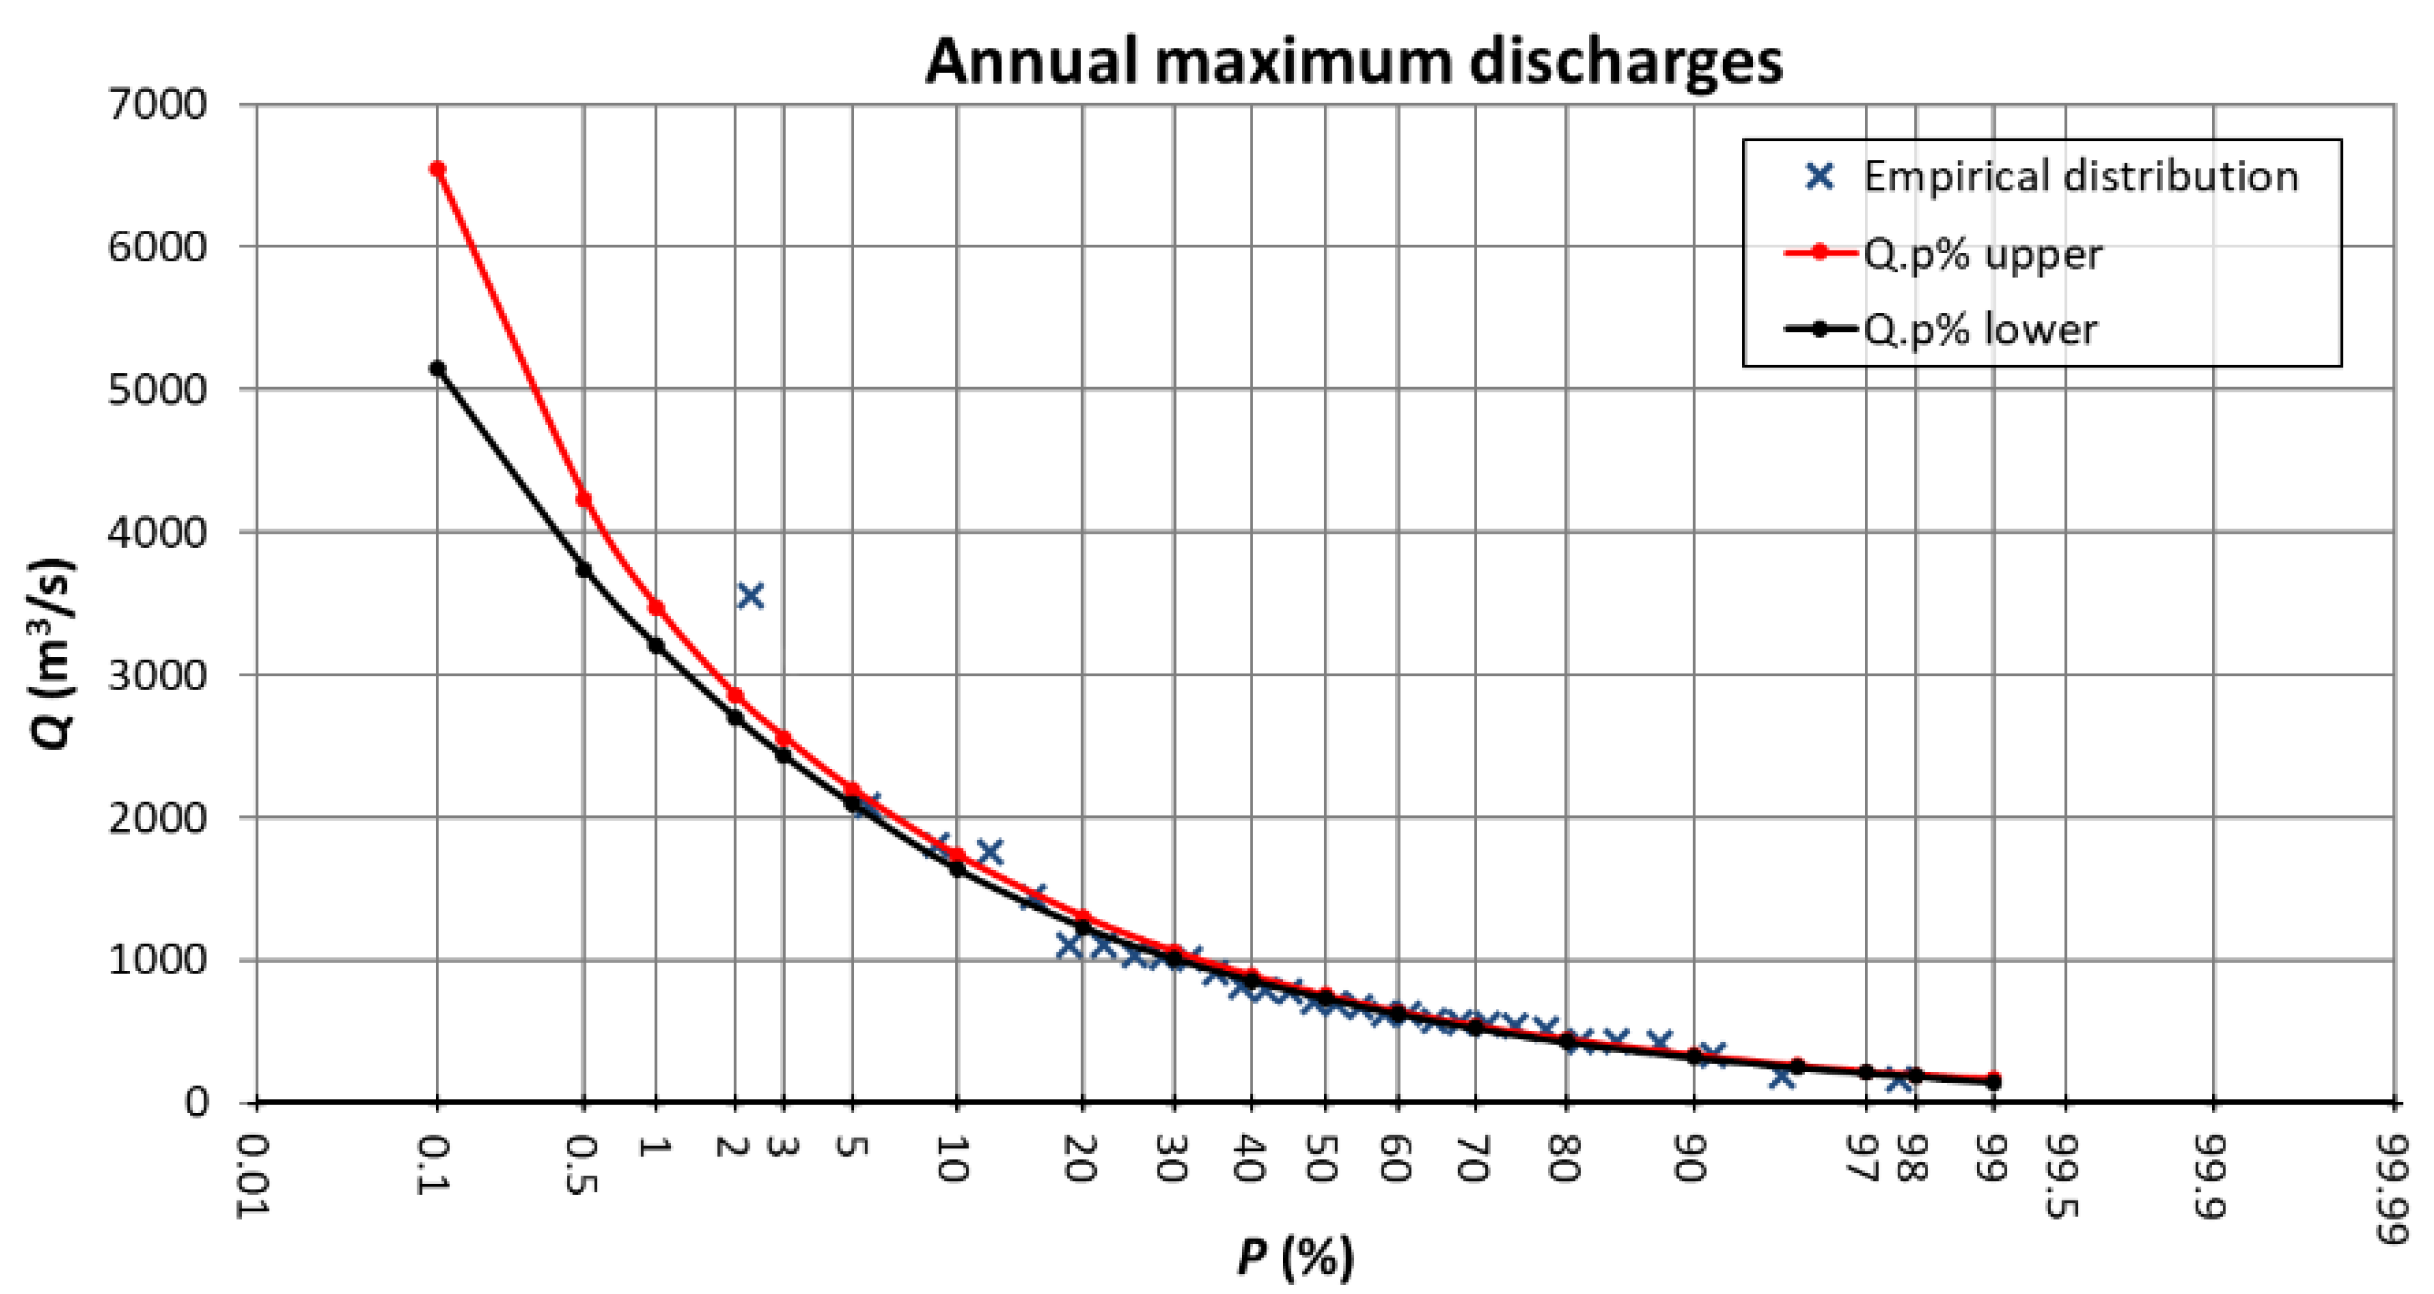
2.1. Maximum Annual Discharges
- (a)
- The lower and upper values of the interval of epistemic uncertainty, and respectively, were chosen according to a pre-defined percentage difference between these limits. For example, the difference between the selected upper and lower values should not exceed 20–25% in order to avoid a large interval of uncertainty:
- (b)
- The distributions inside but close to the interval limits were then chosen as the lower and upper margins of the uncertainty interval.
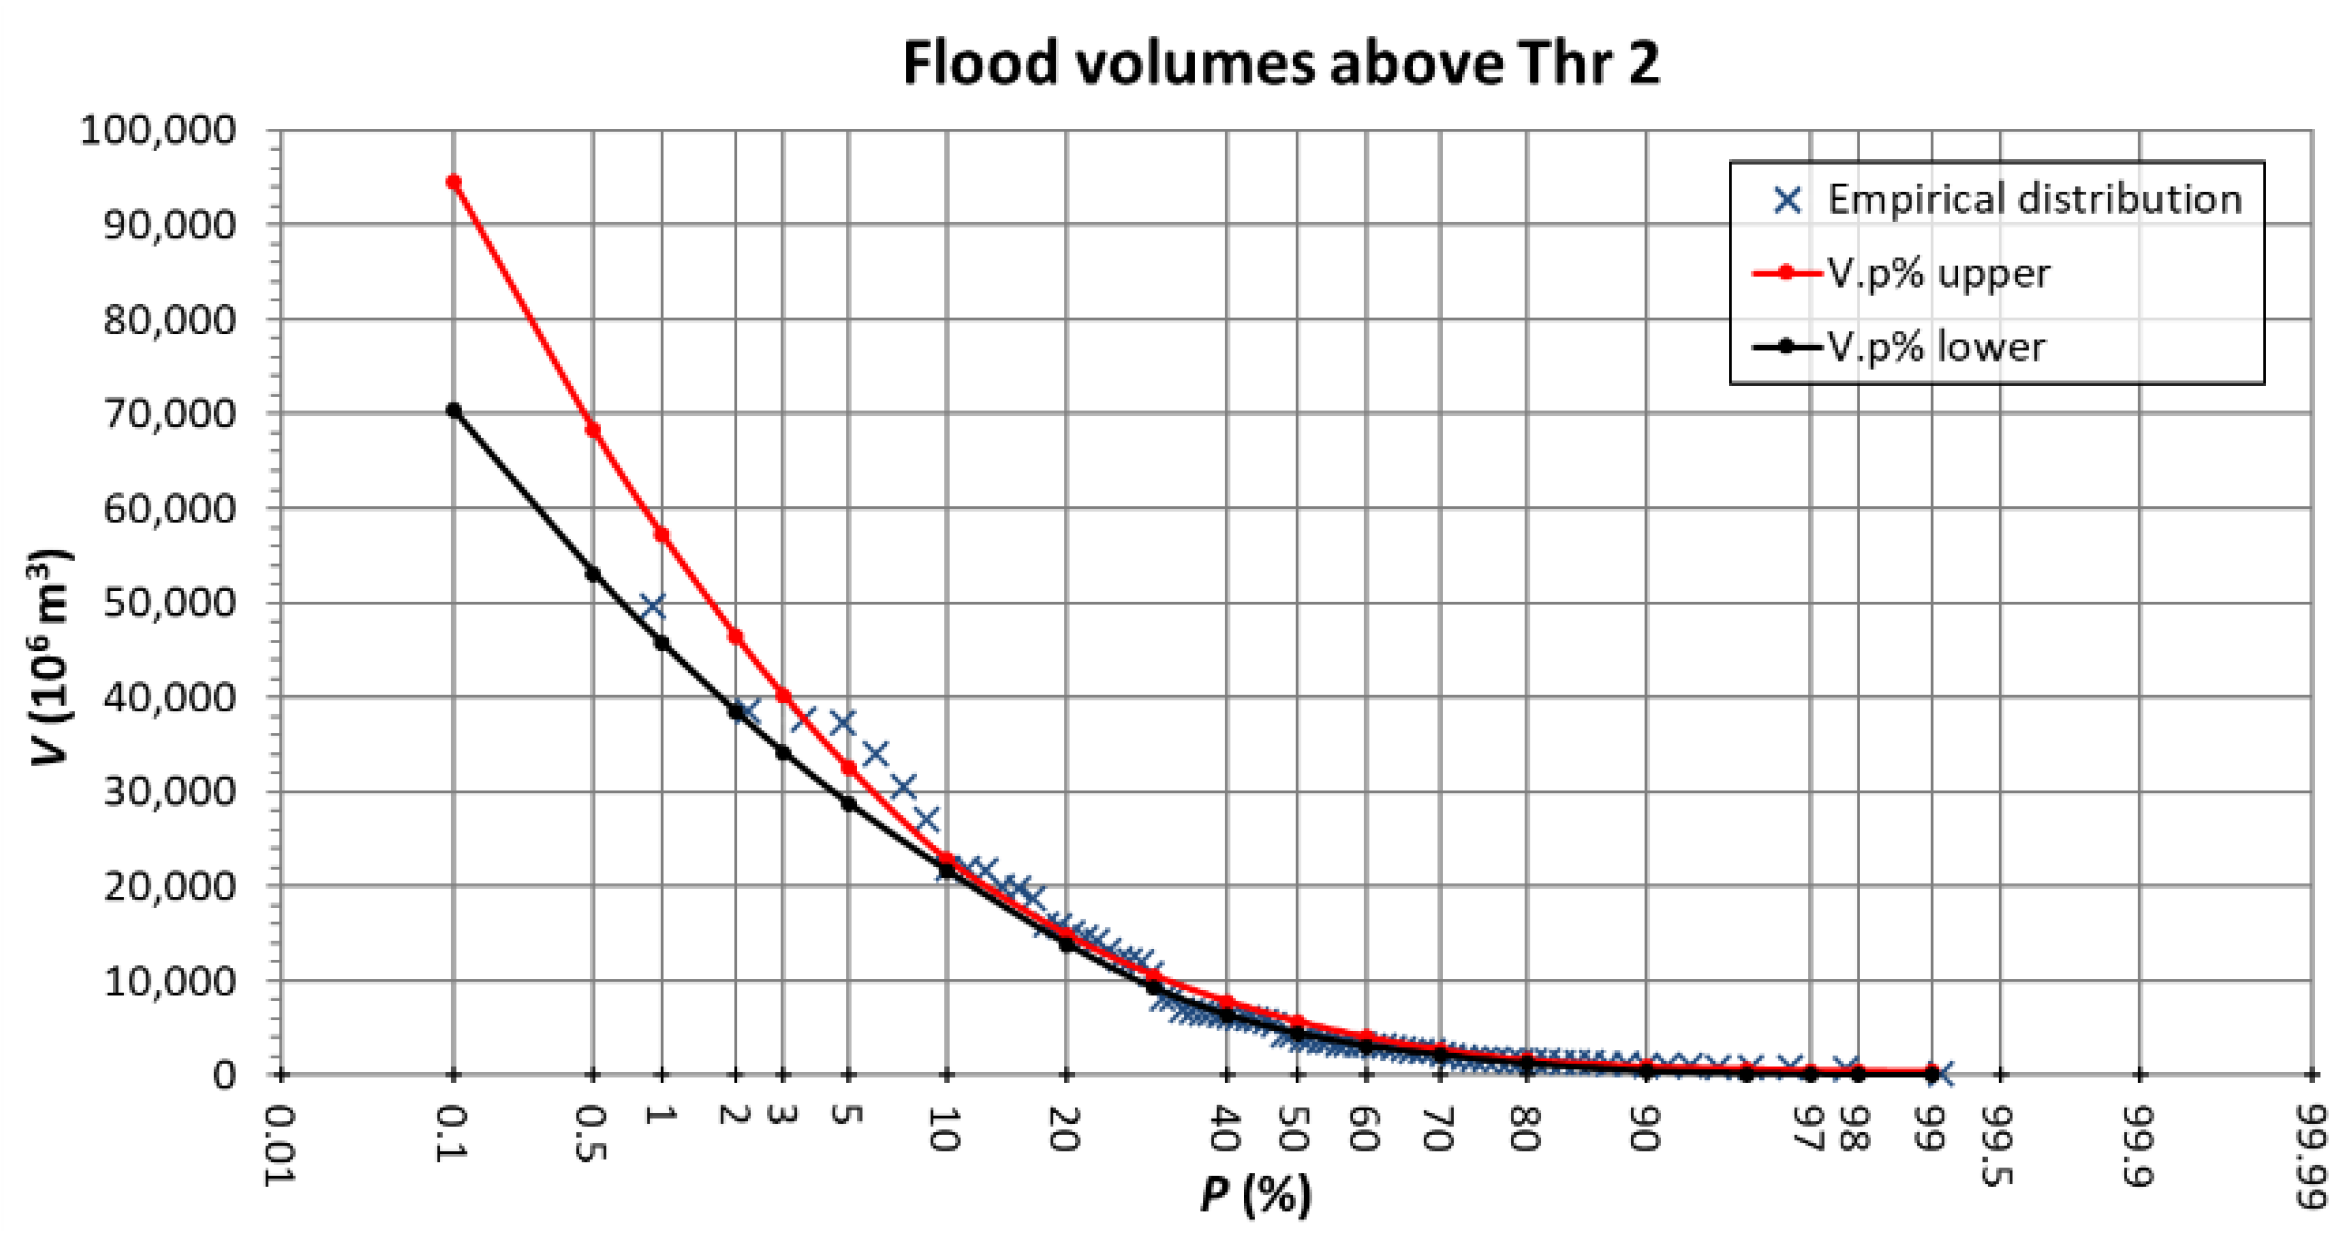
2.2. Flood Volumes
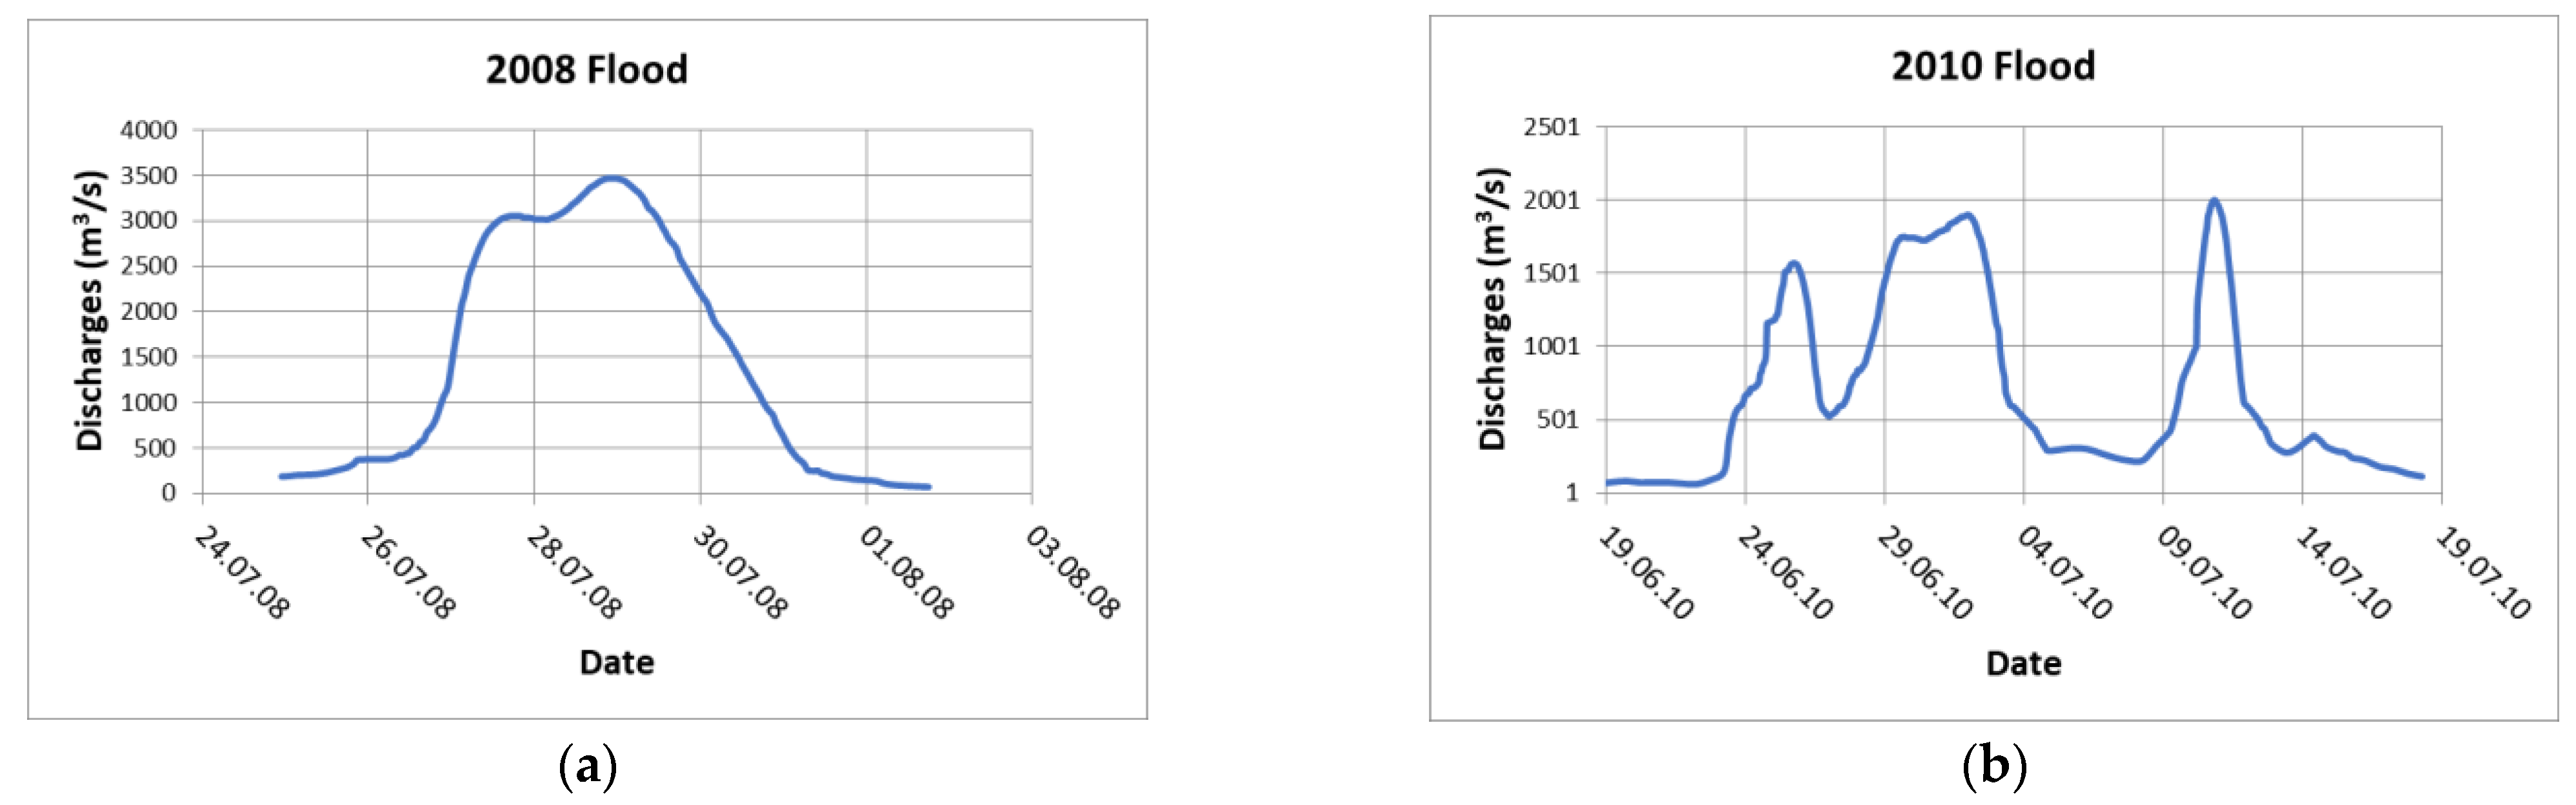
2.3. Critical Floods
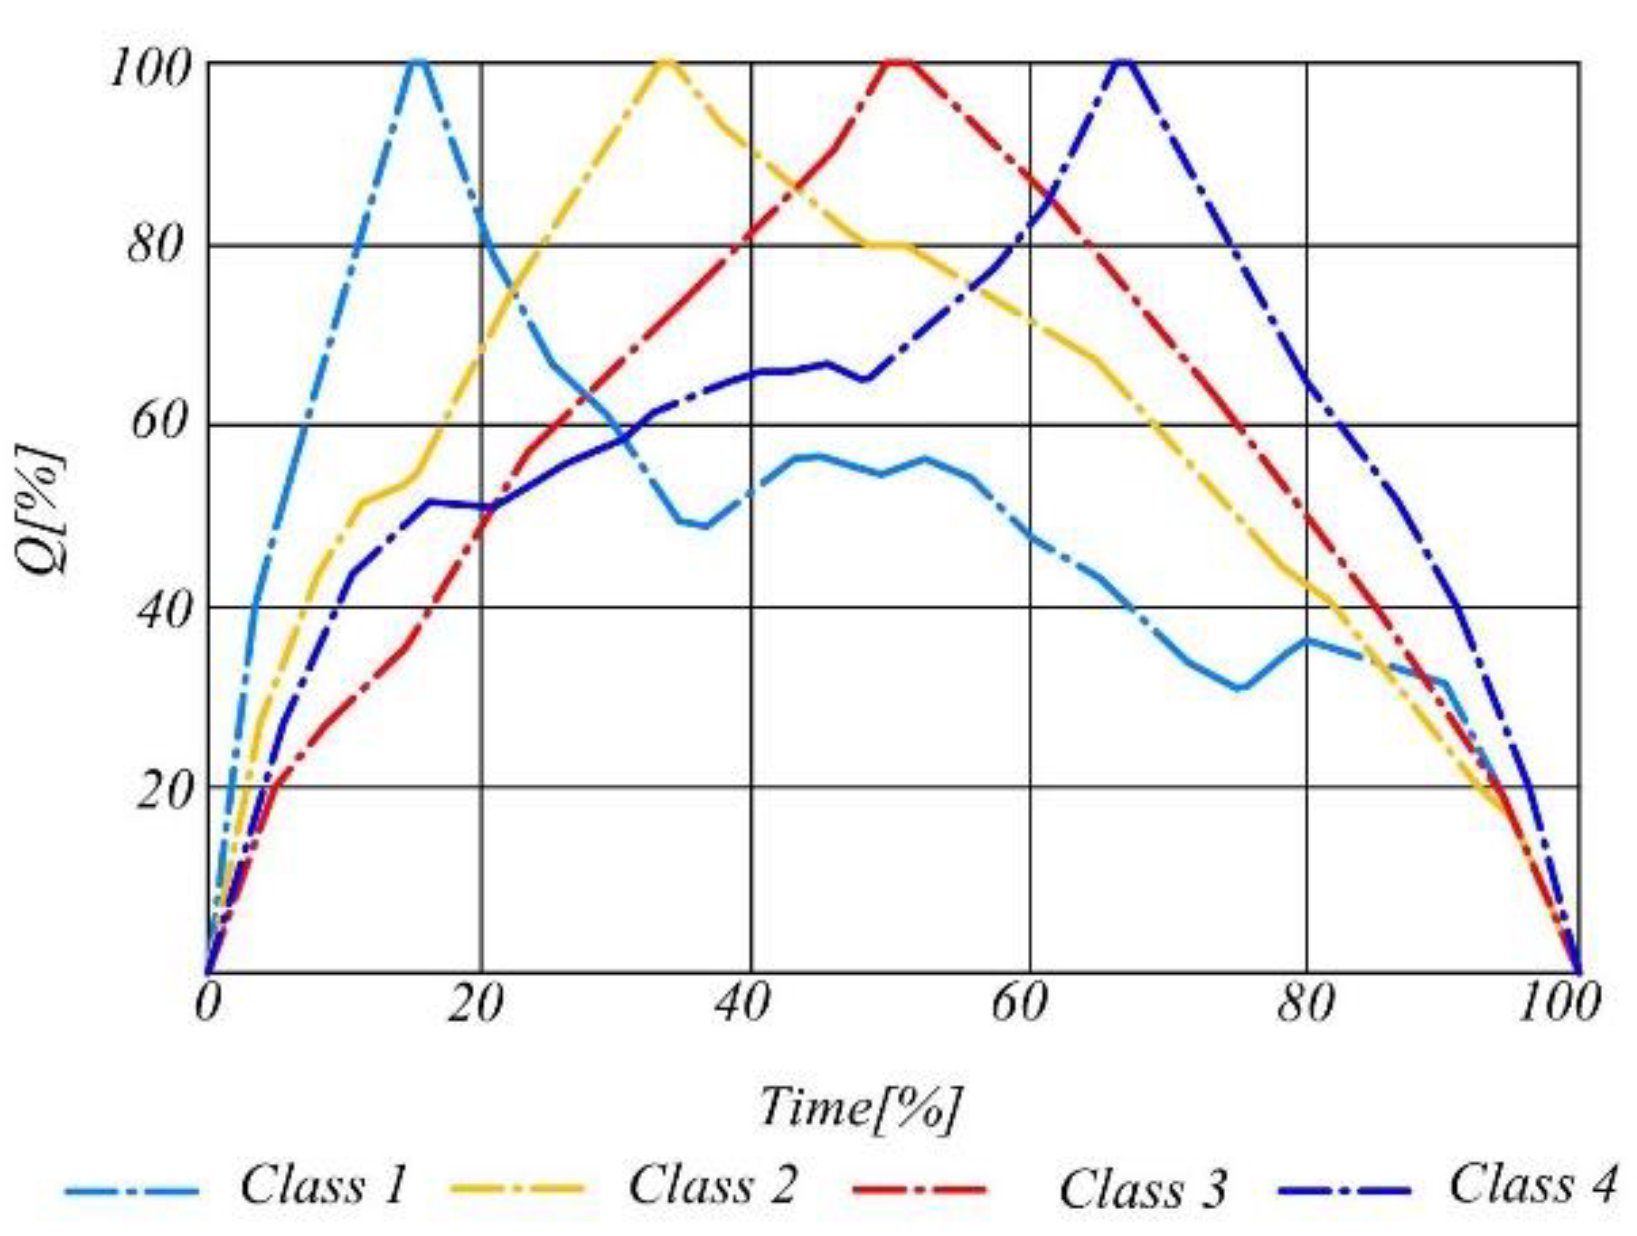
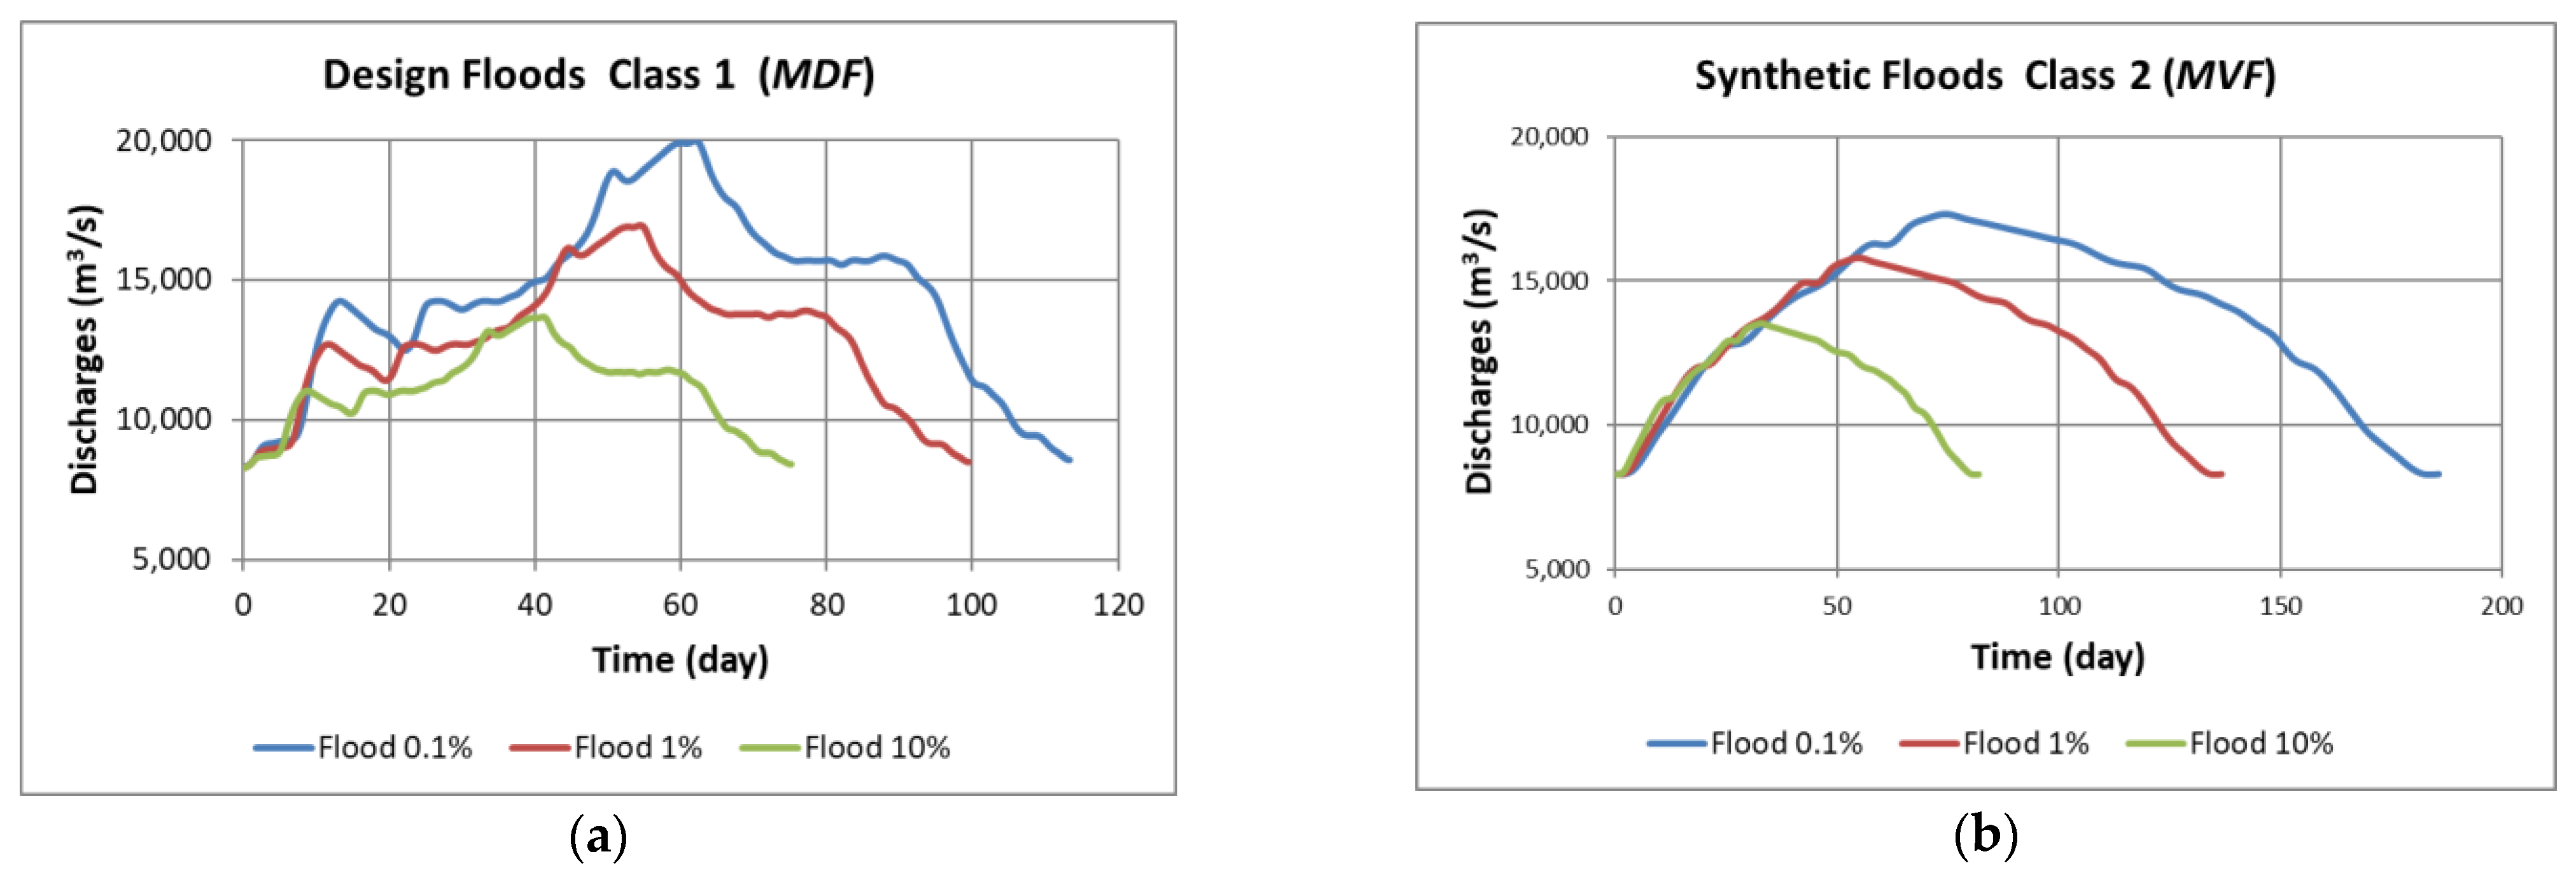
2.4. Shape of the Design Flood
2.5. Compactness Coefficient of the Design Flood
- (a)
- The first significant floods are retained in the descending order of the maximum discharges. For the analysis of the most dangerous floods, .
- (b)
- The selected floods, which are based on the deducted value of the threshold , are to be normalized.
- (c)
- The compactness coefficients of the dimensionless floods are computed, taking into account that after normalization, and :
- (d)
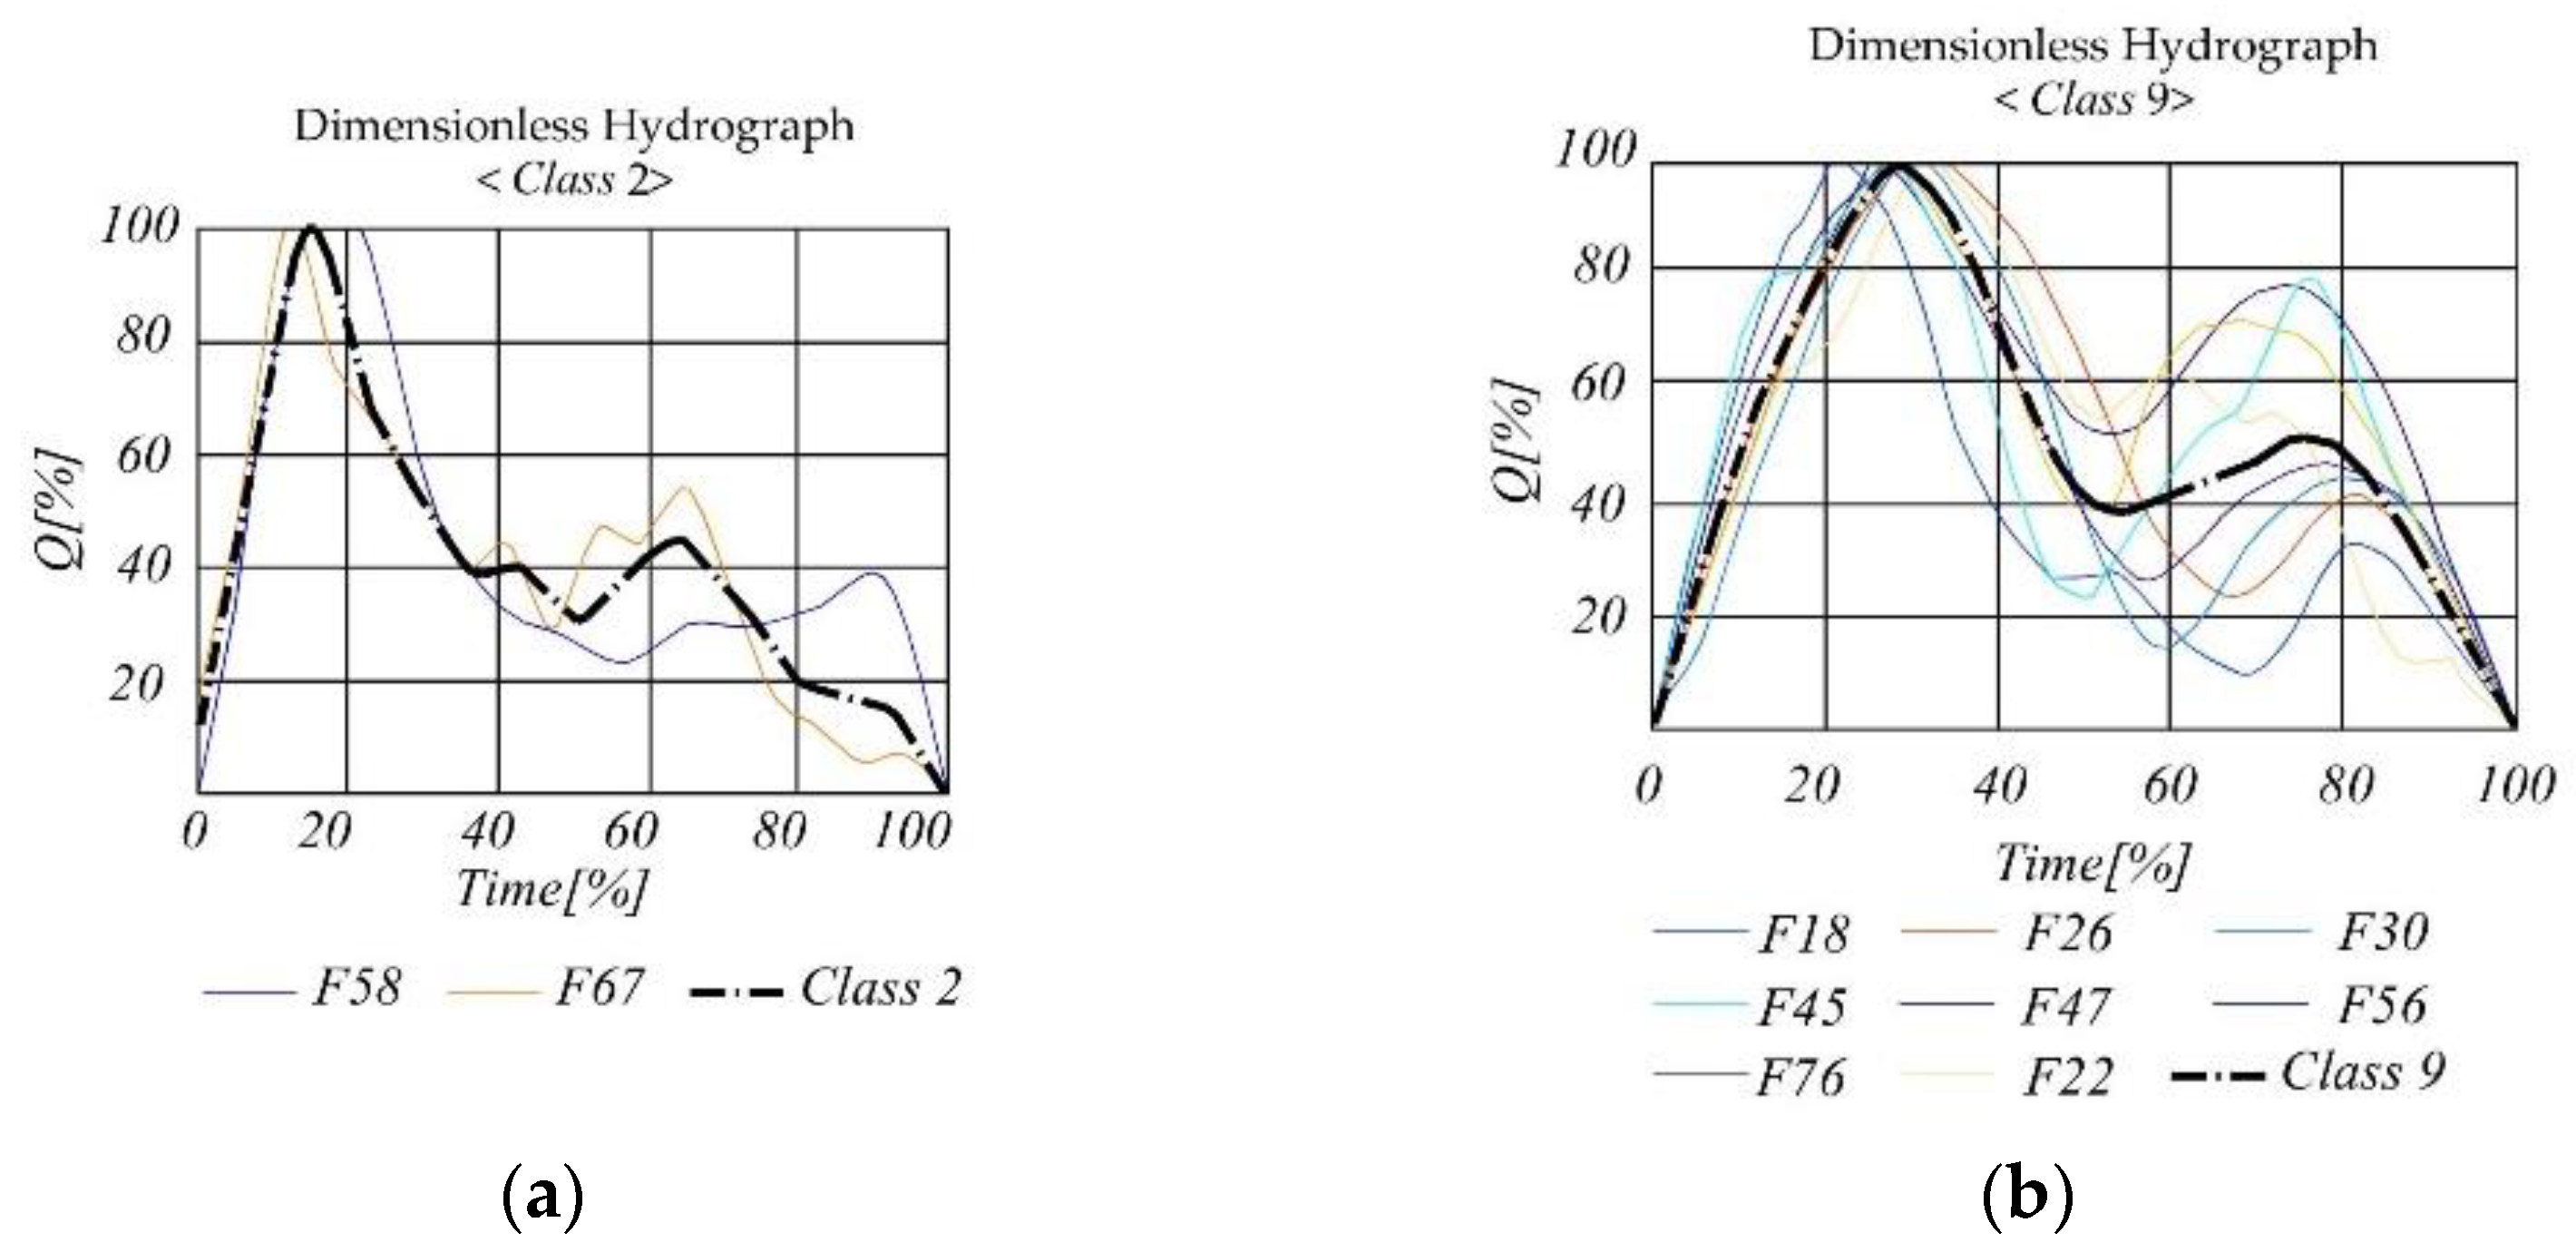
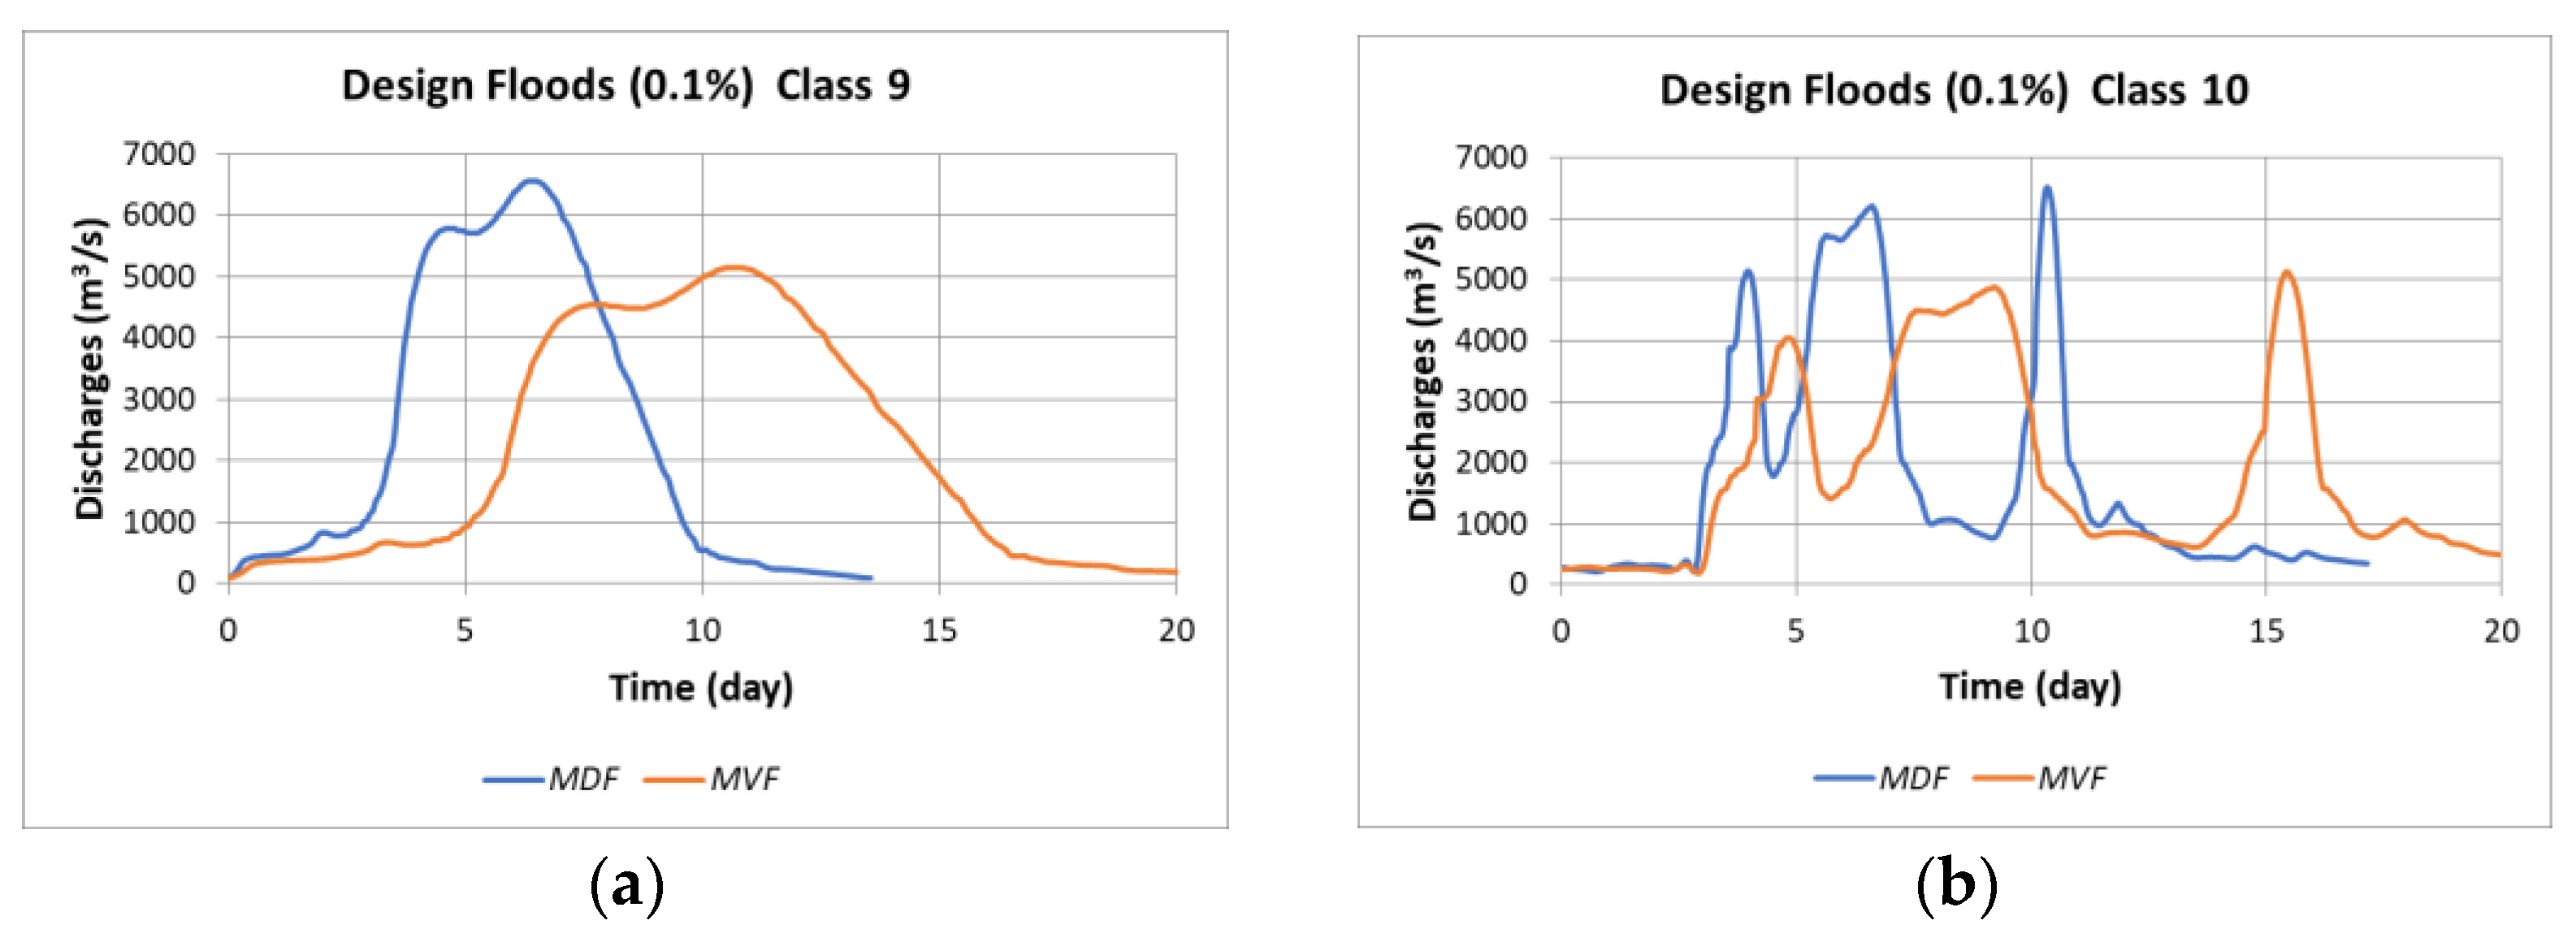
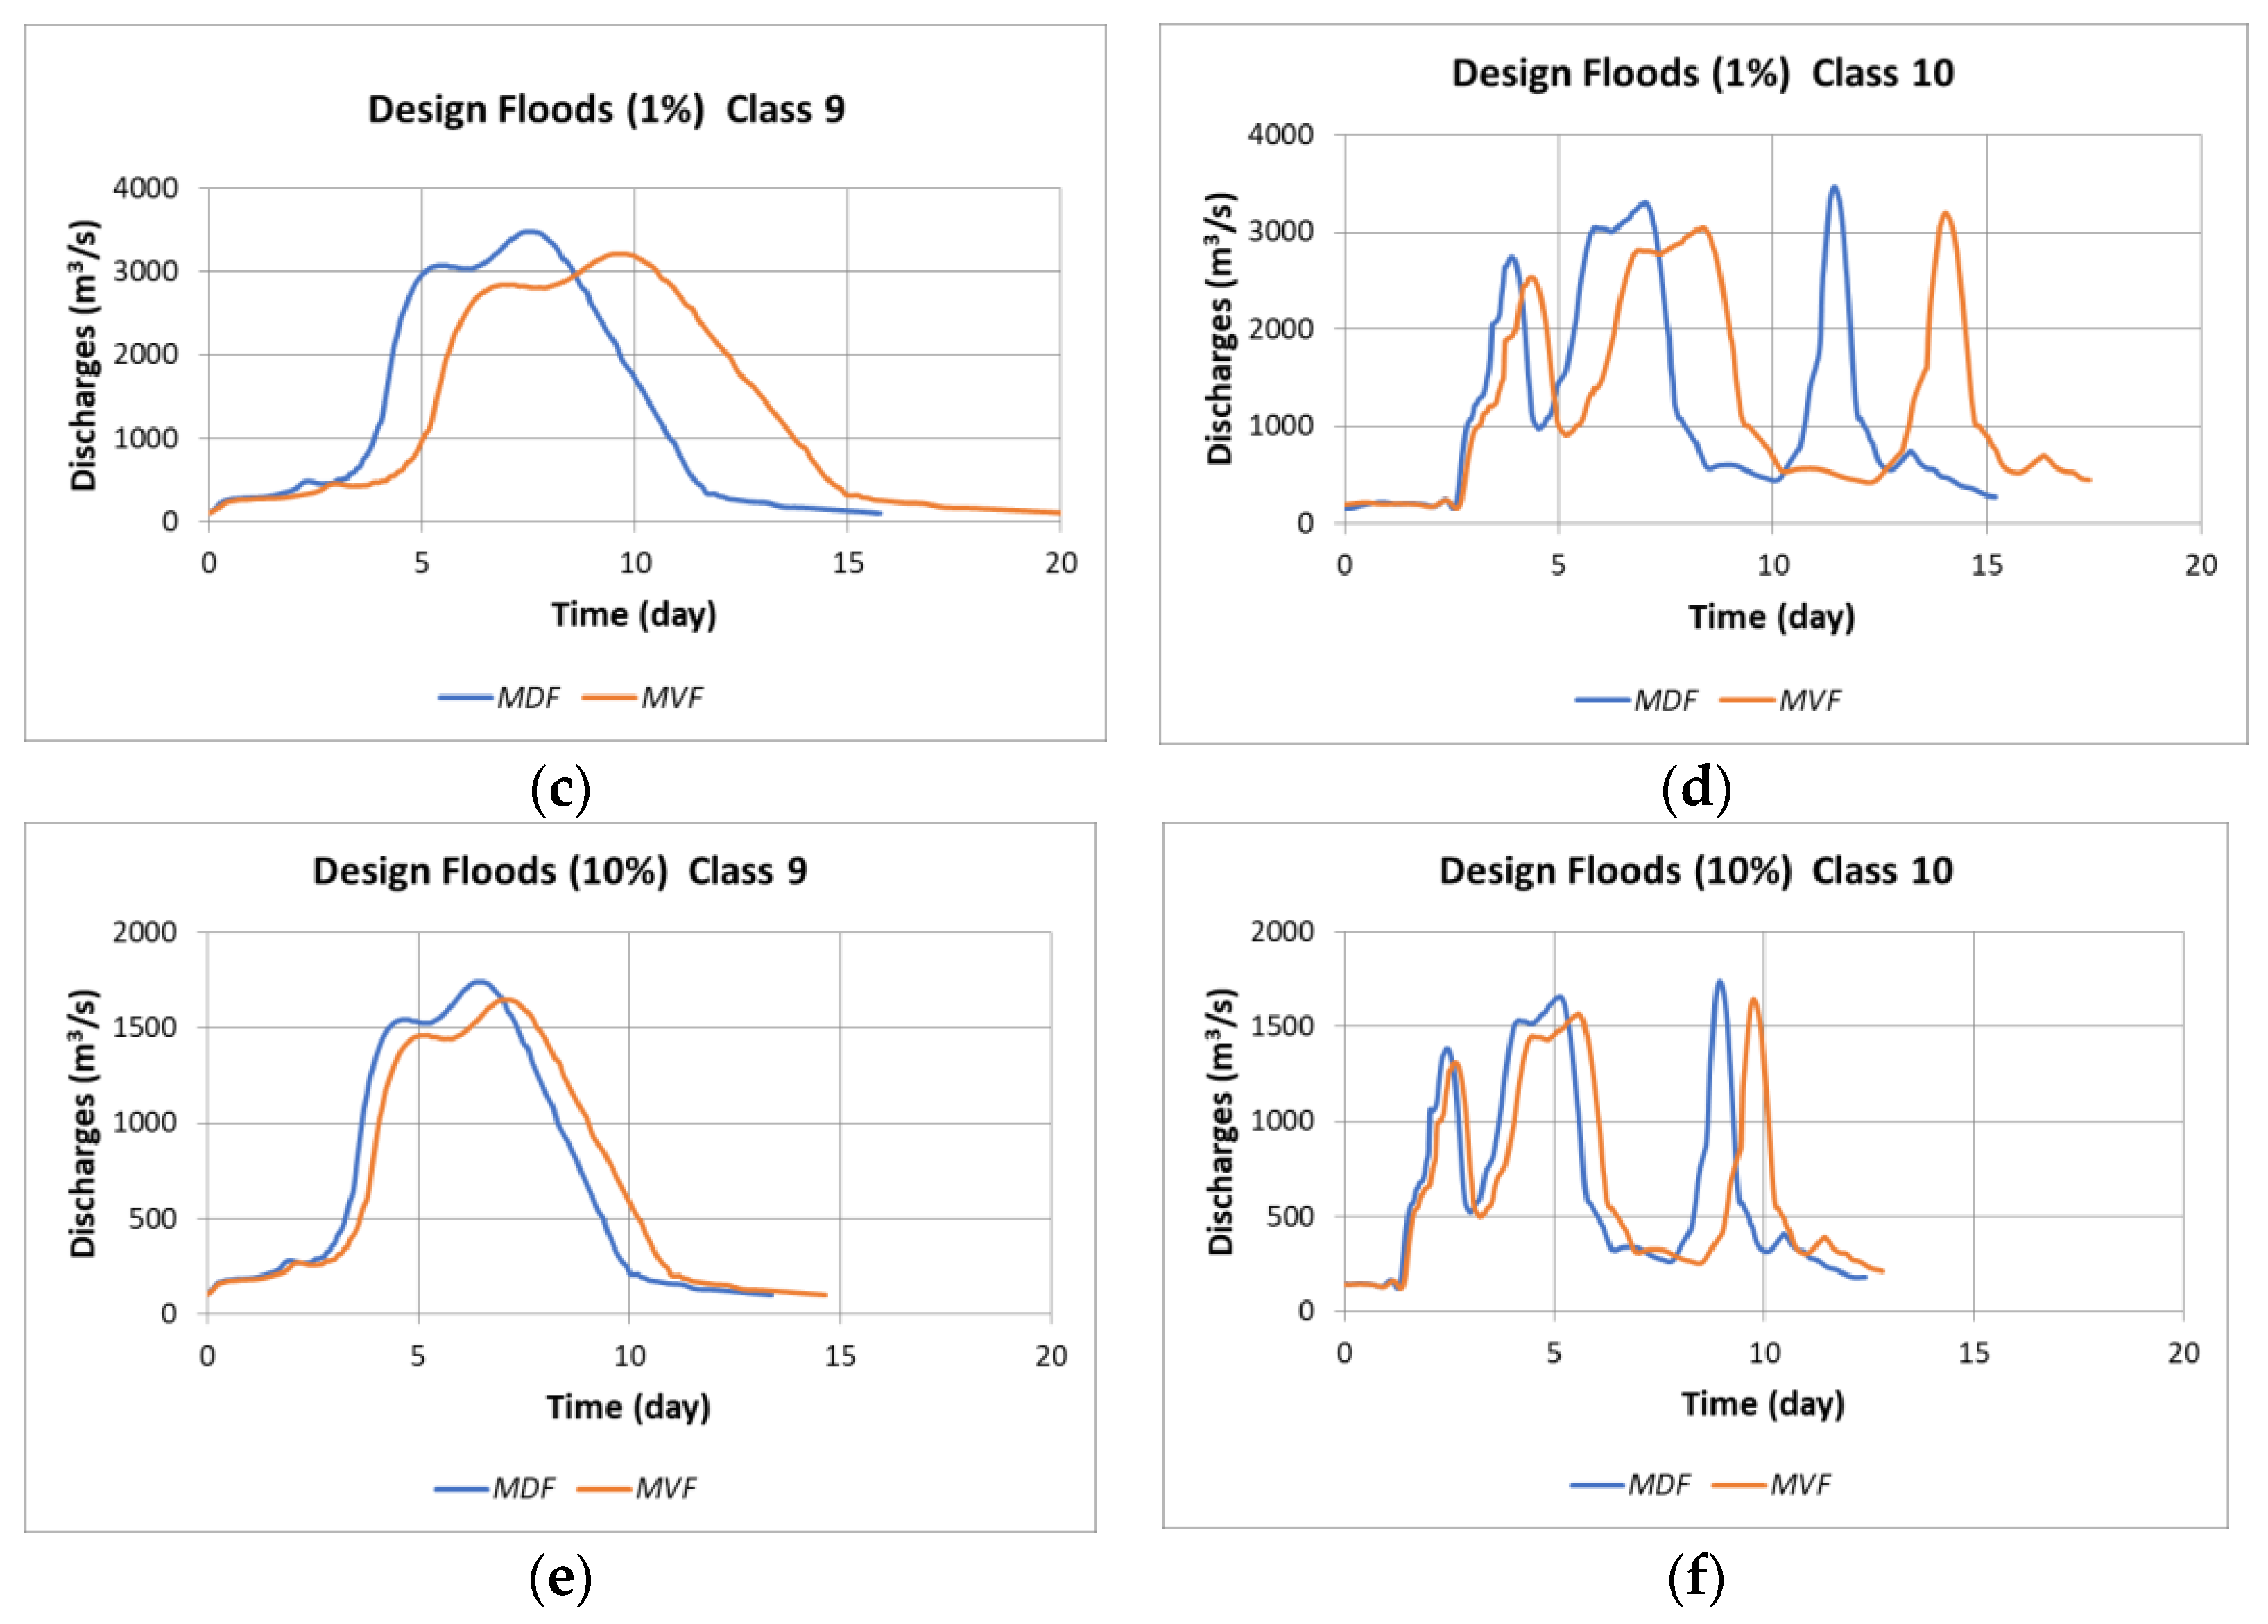
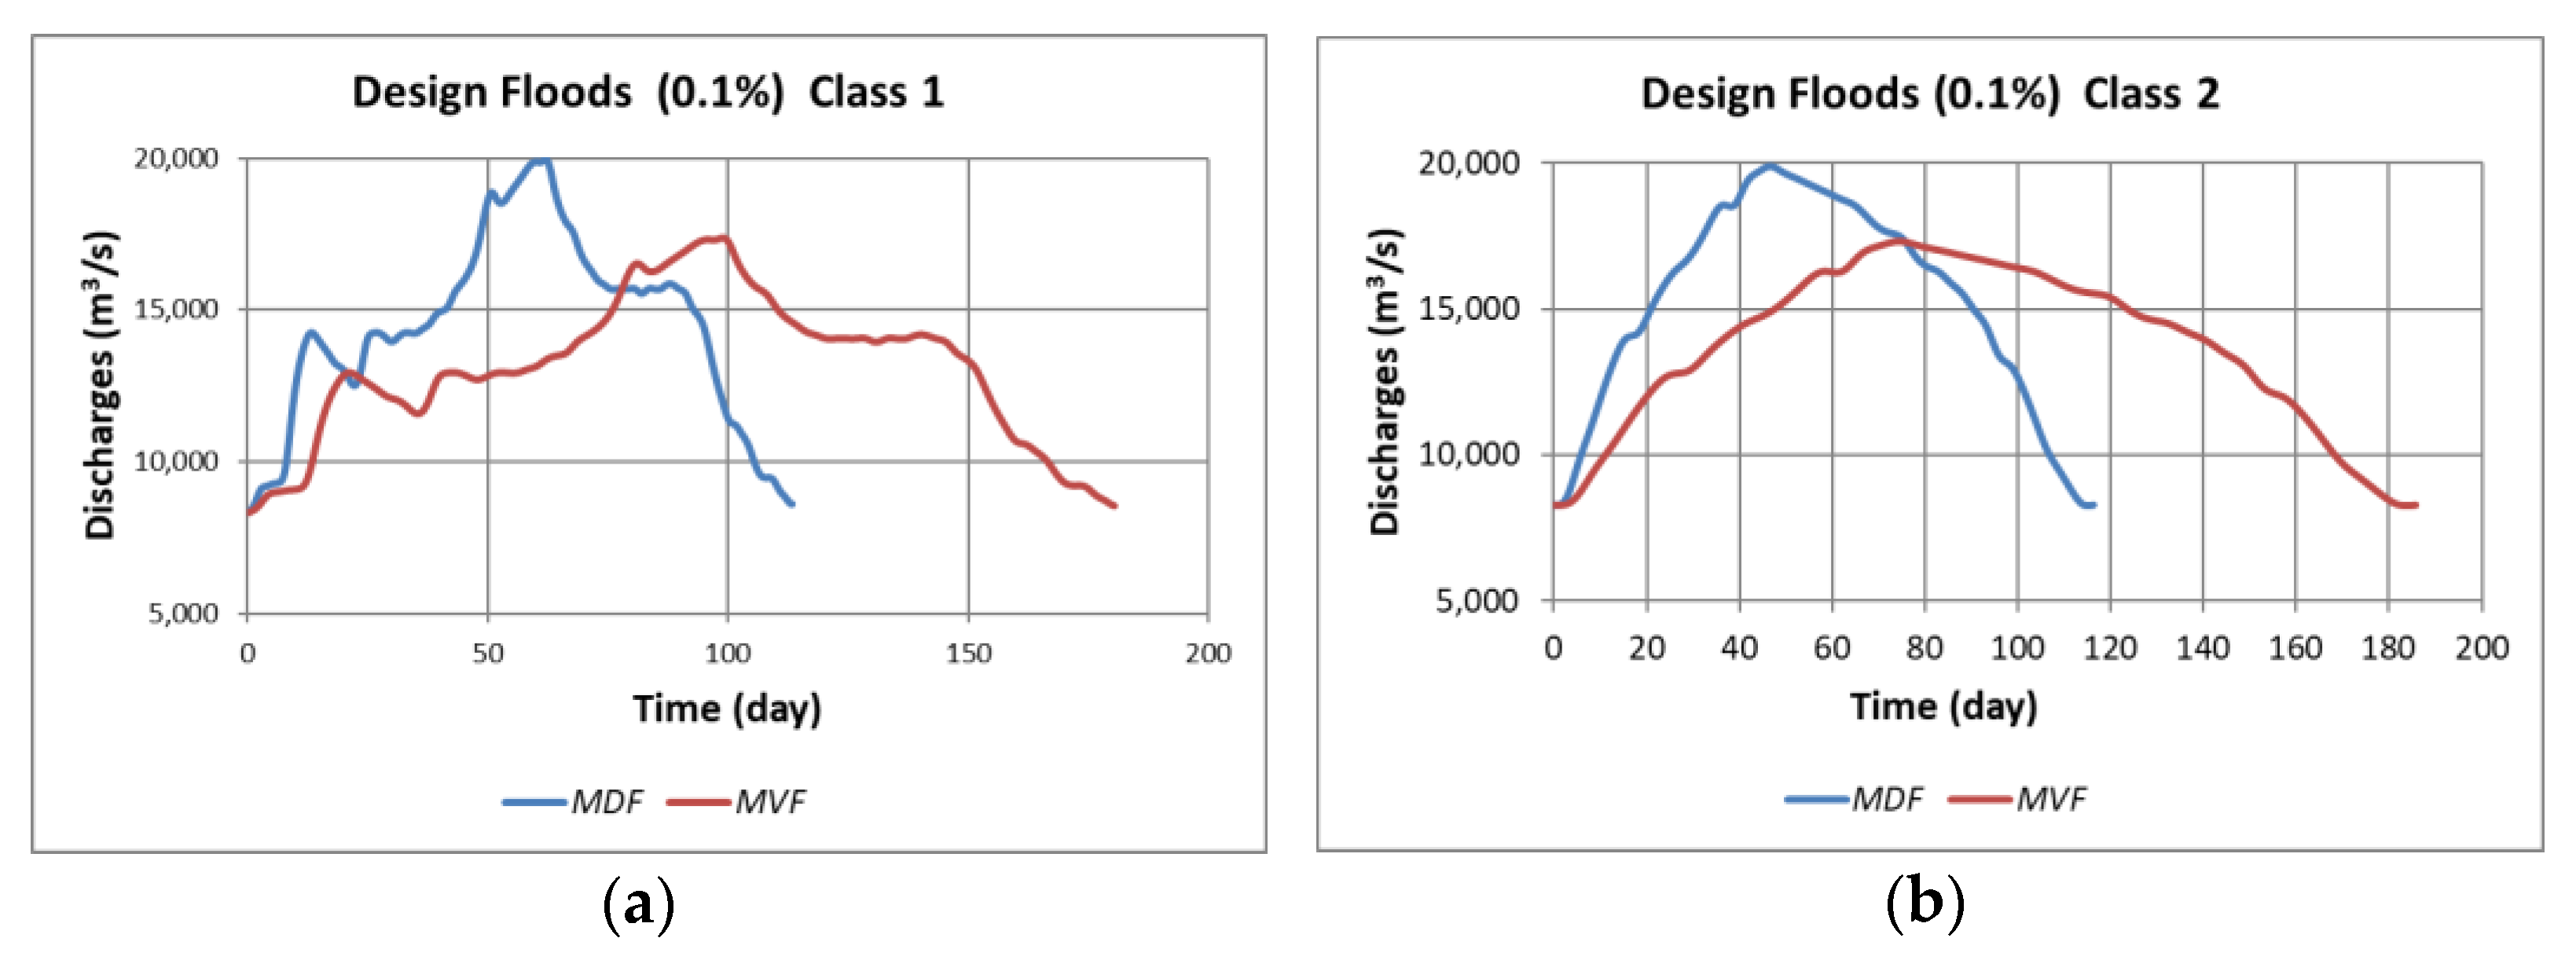
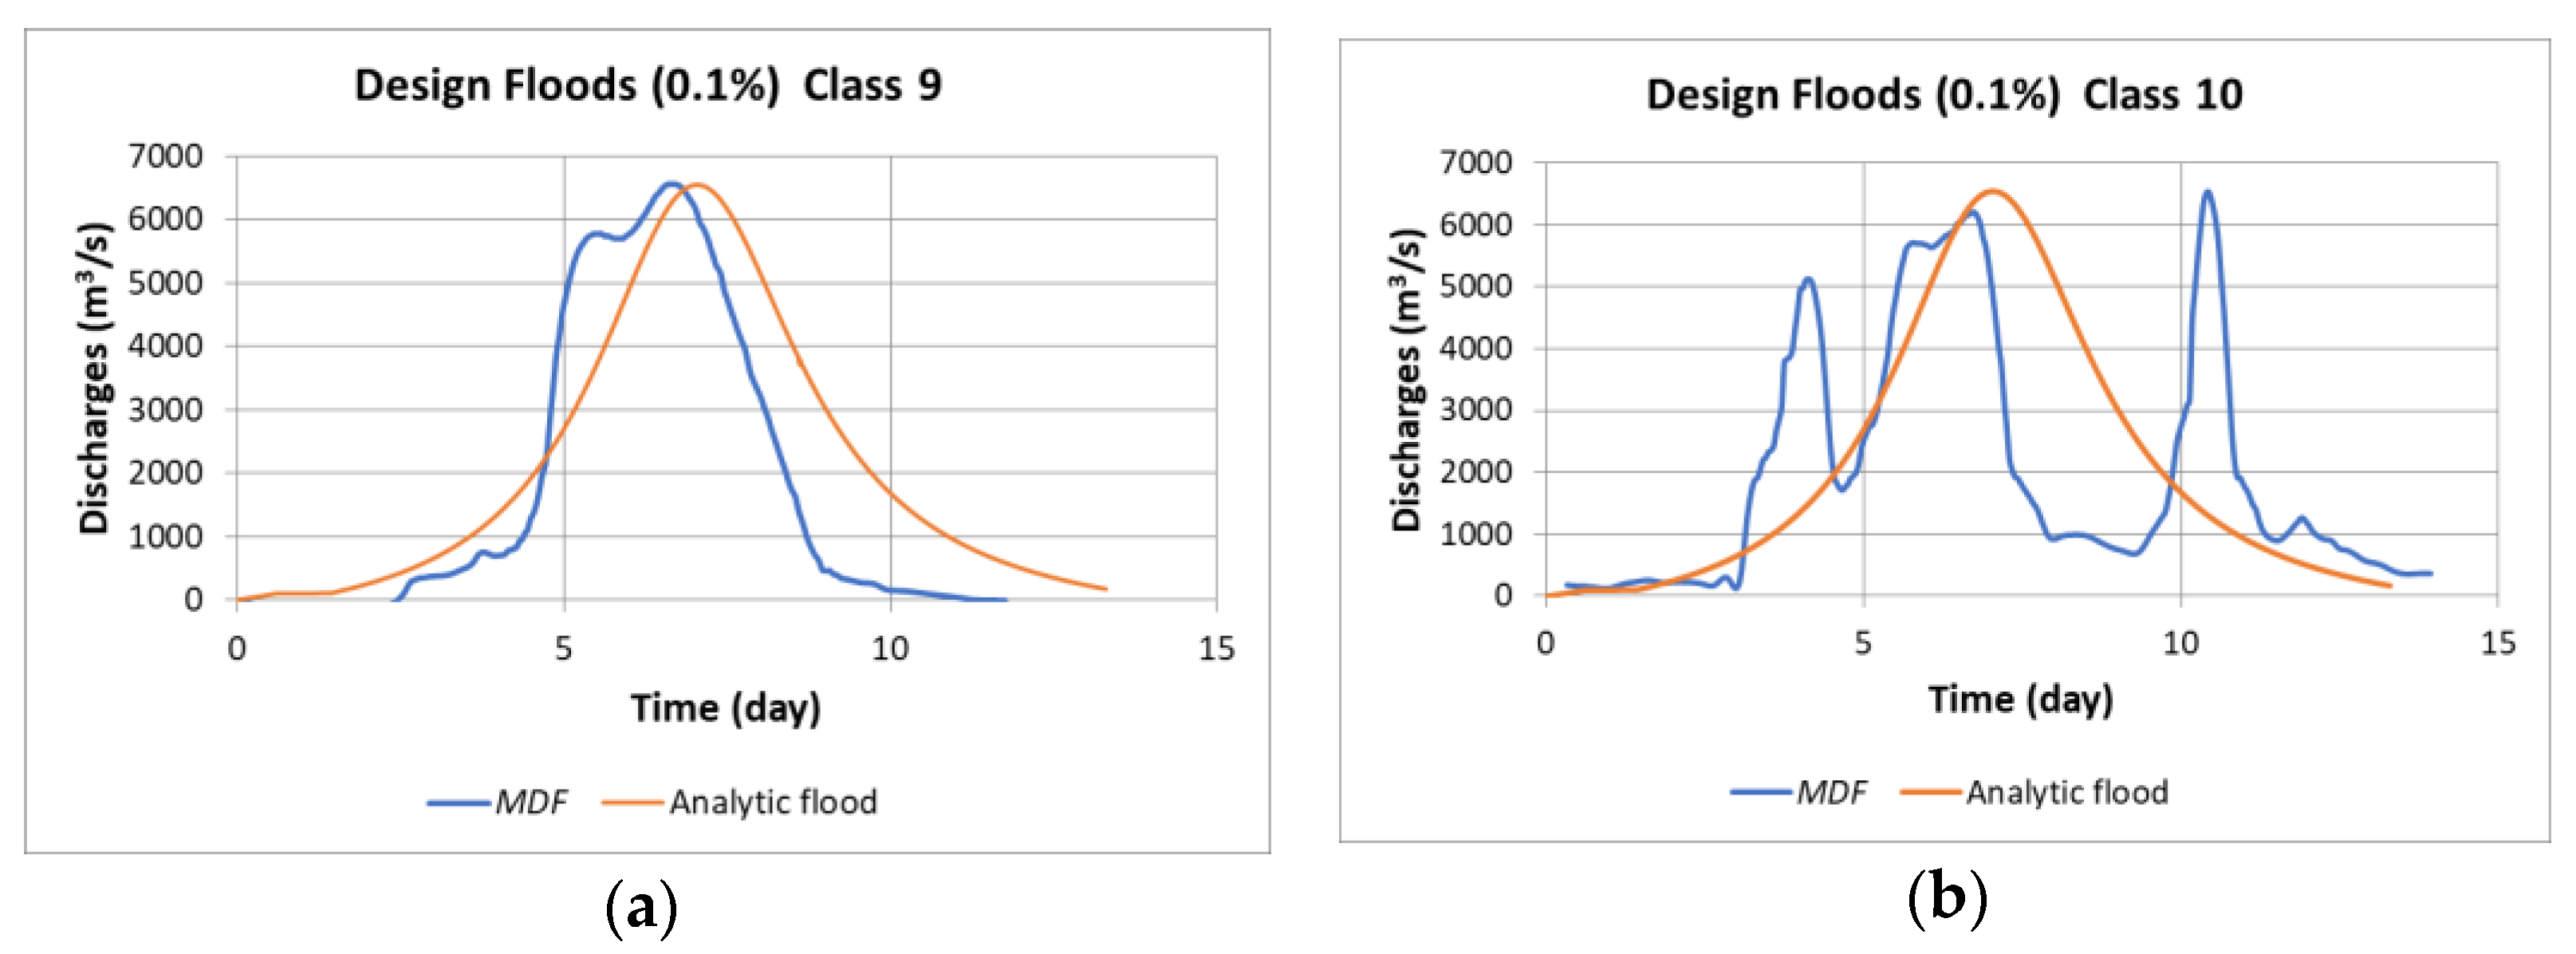
- Maximum discharge flood. The compactness coefficient of the first ranked out of the above processed recorded floods is denoted by (the letter represents discharge). As mentioned before, an average dimensionless flood is derived for each class. The compactness coefficient for MDF will be kept at the value for the set of all classes of shapes, while the time to peak will be different for each class (Figure 5).
- (e)
- Maximum volume flood. As in the case of MDF, the first dimensionless floods in the descending order of the maximum discharges are considered, and the maximum value of the compactness coefficient is chosen:
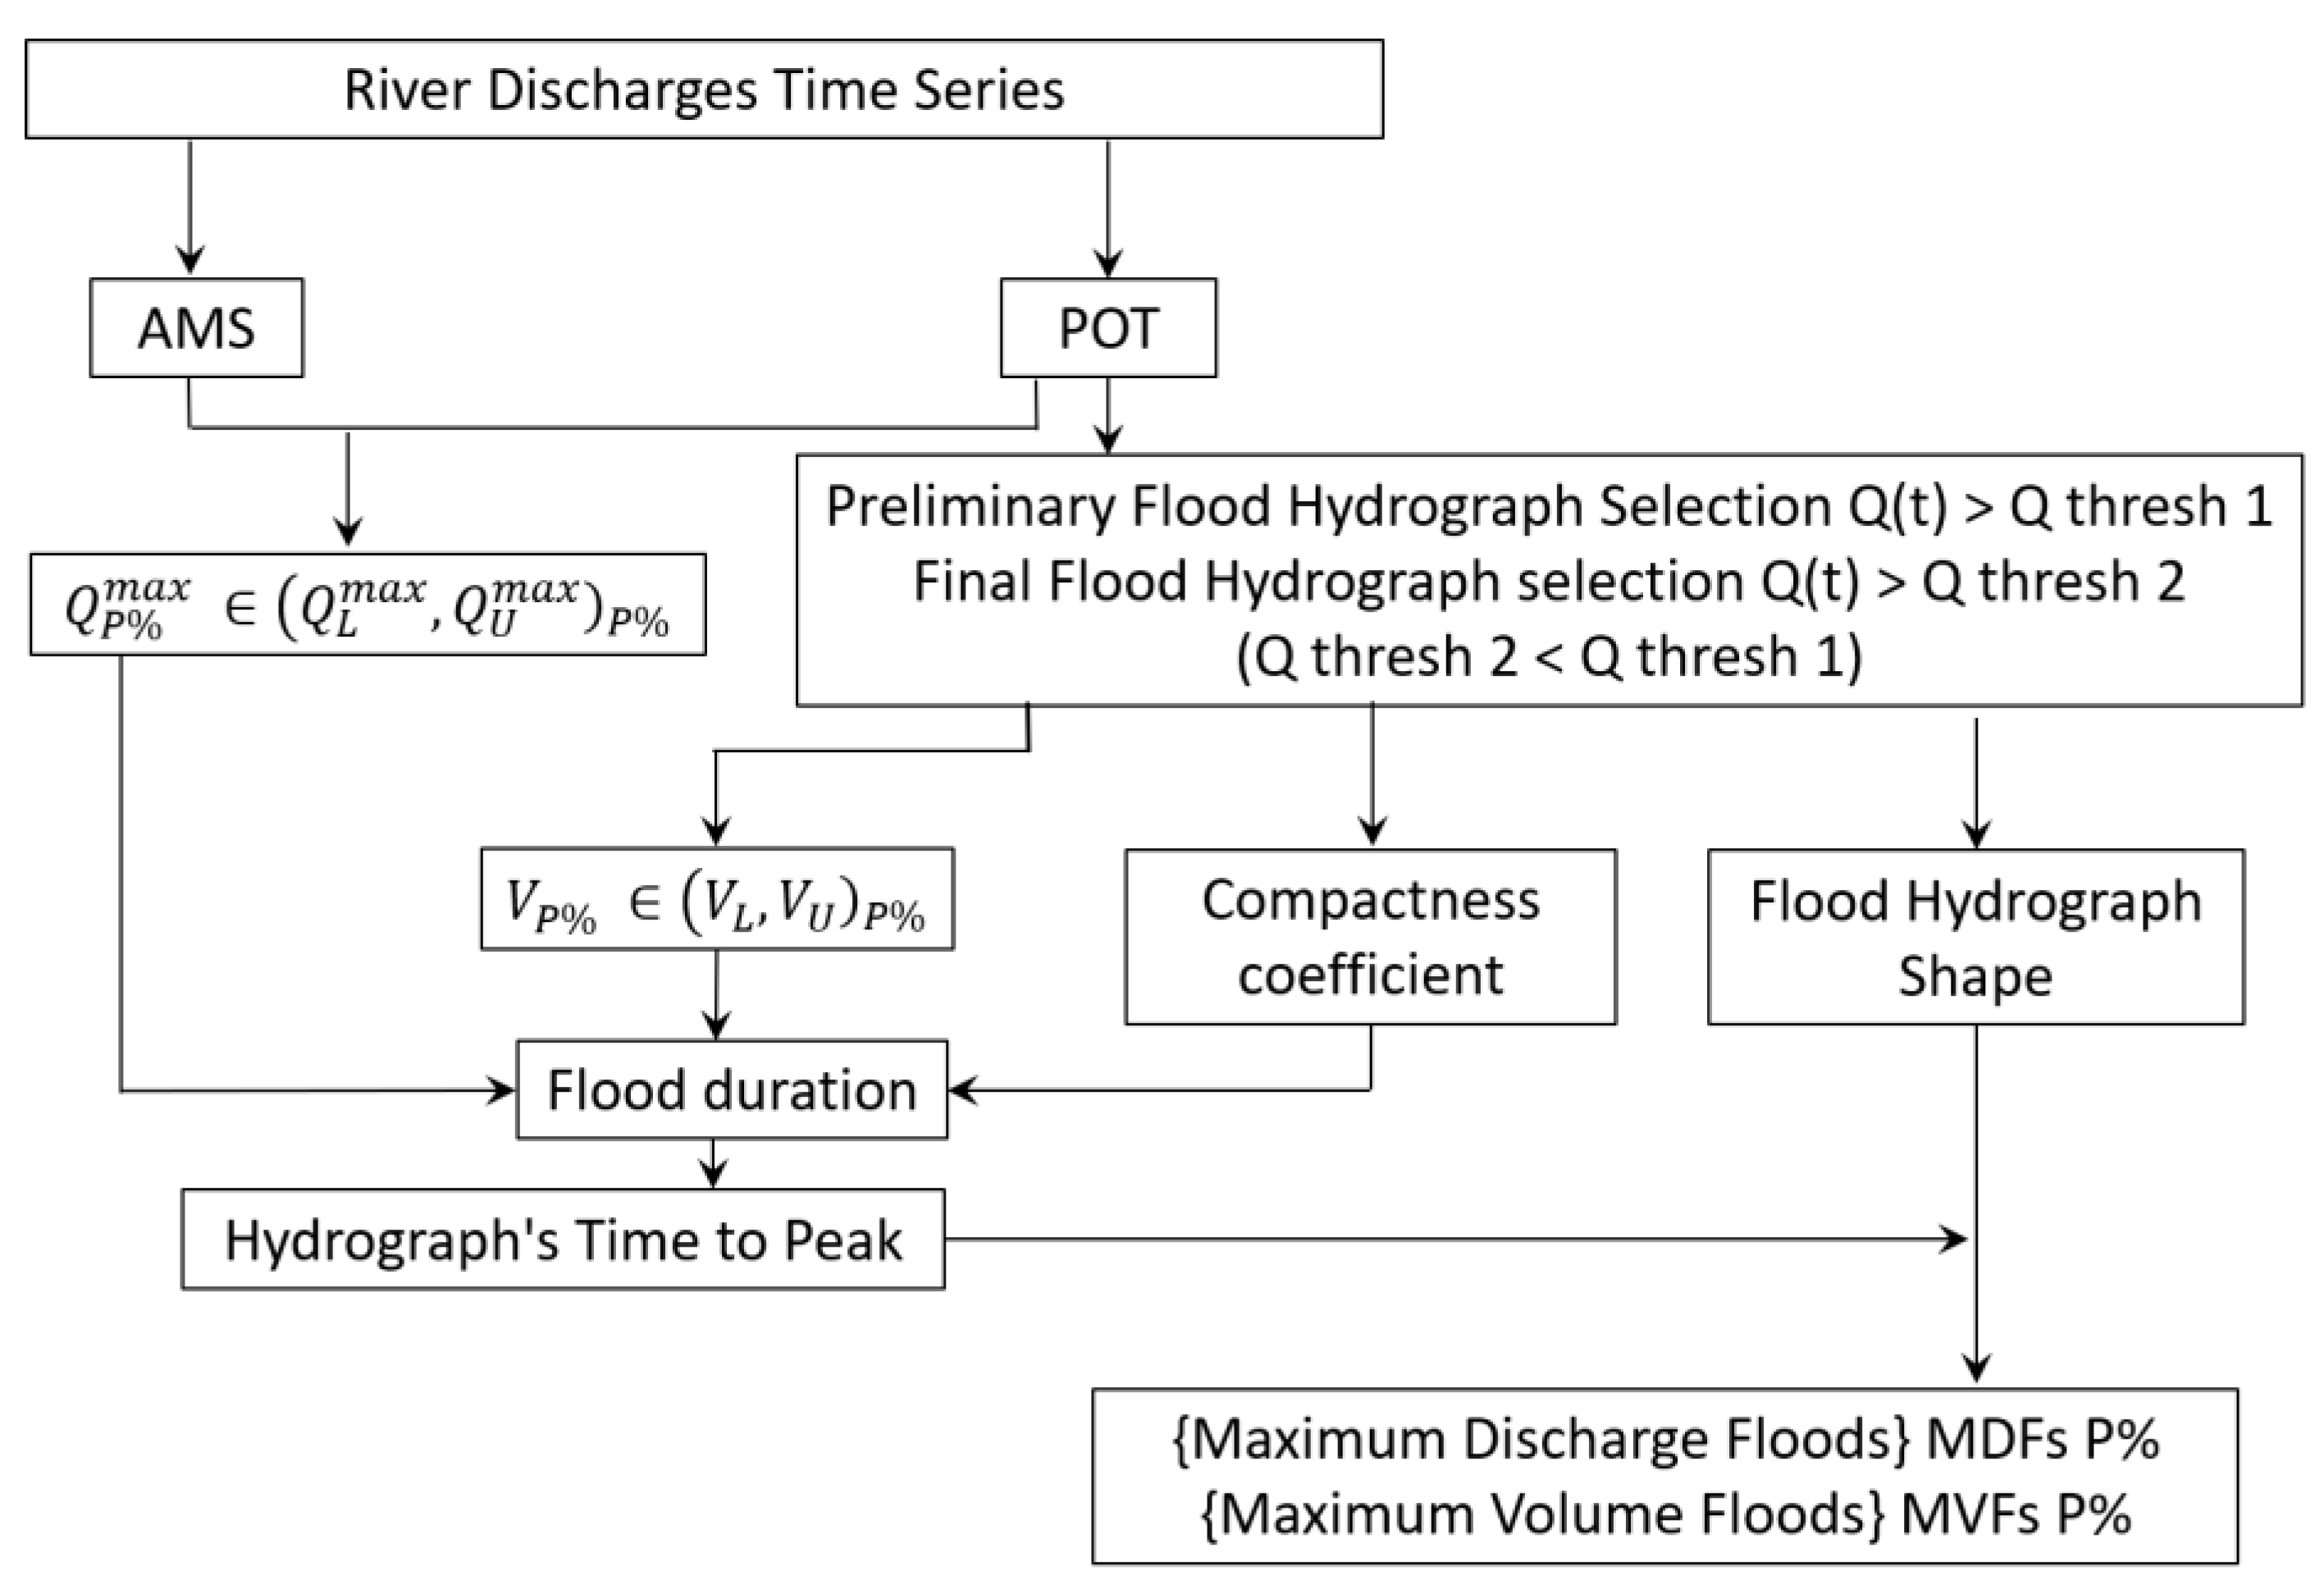
2.6. Duration of the Design Flood Hydrograph
2.7. Time to Peak of the Design Flood Hydrograph
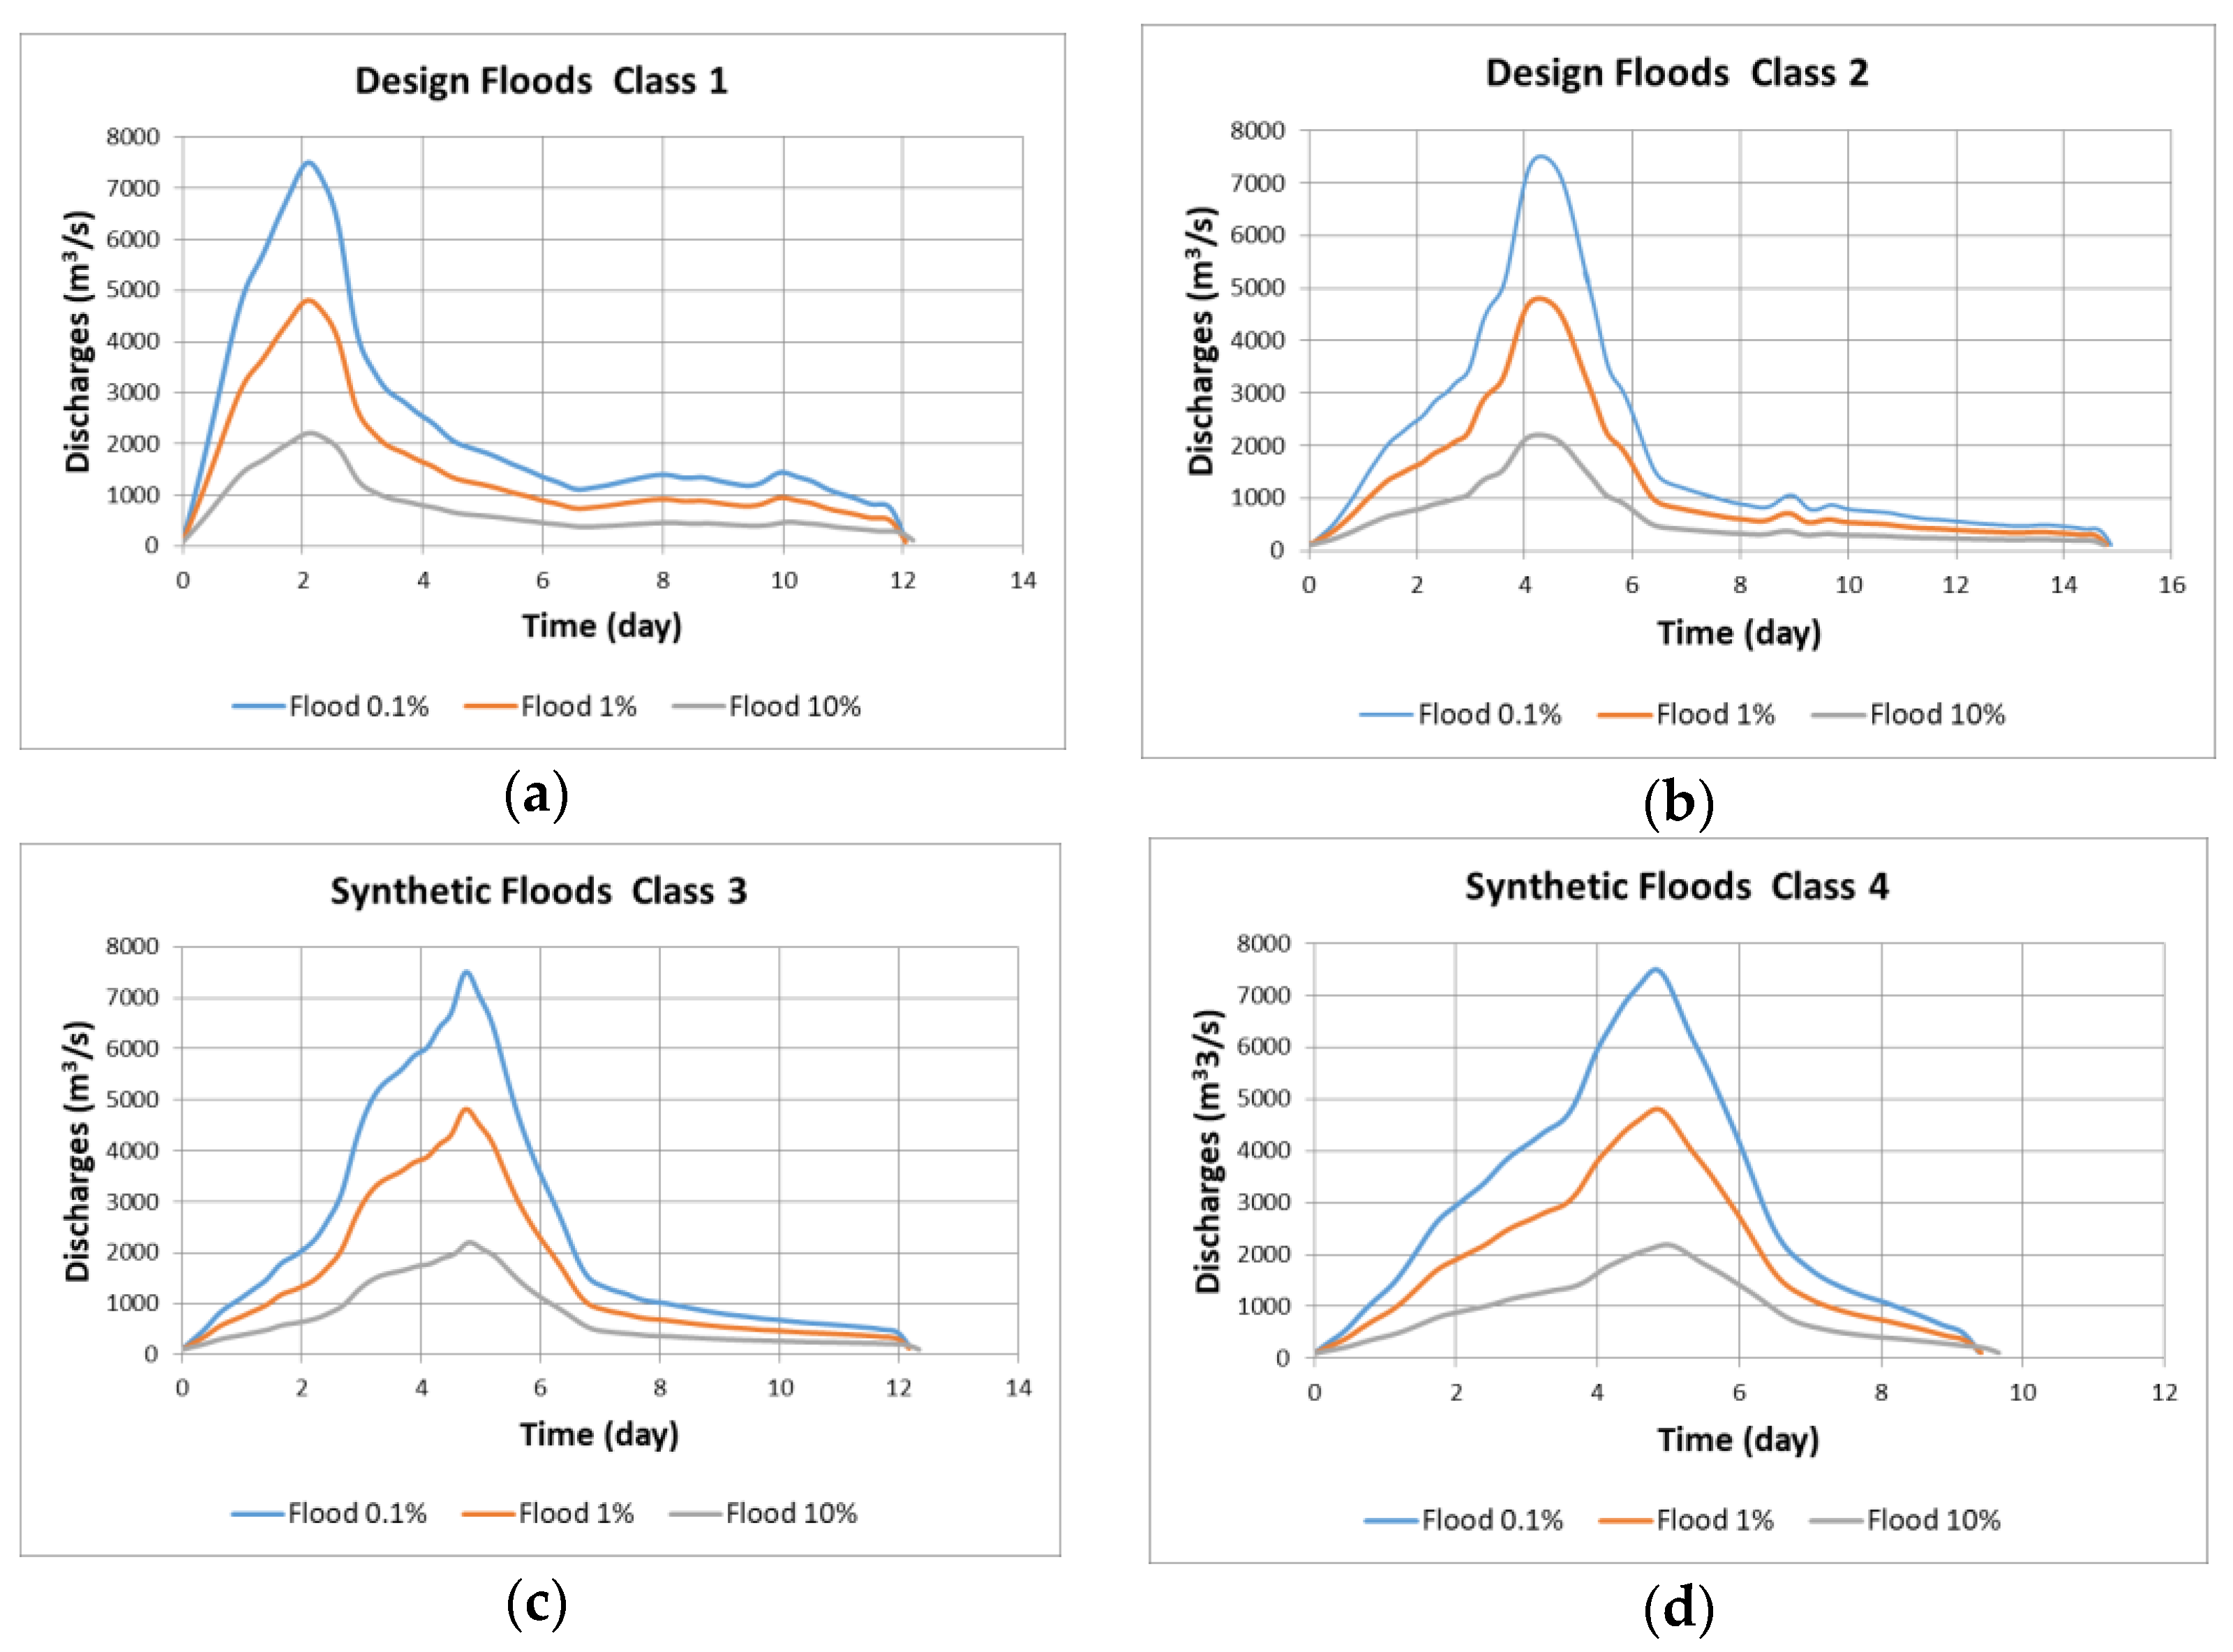
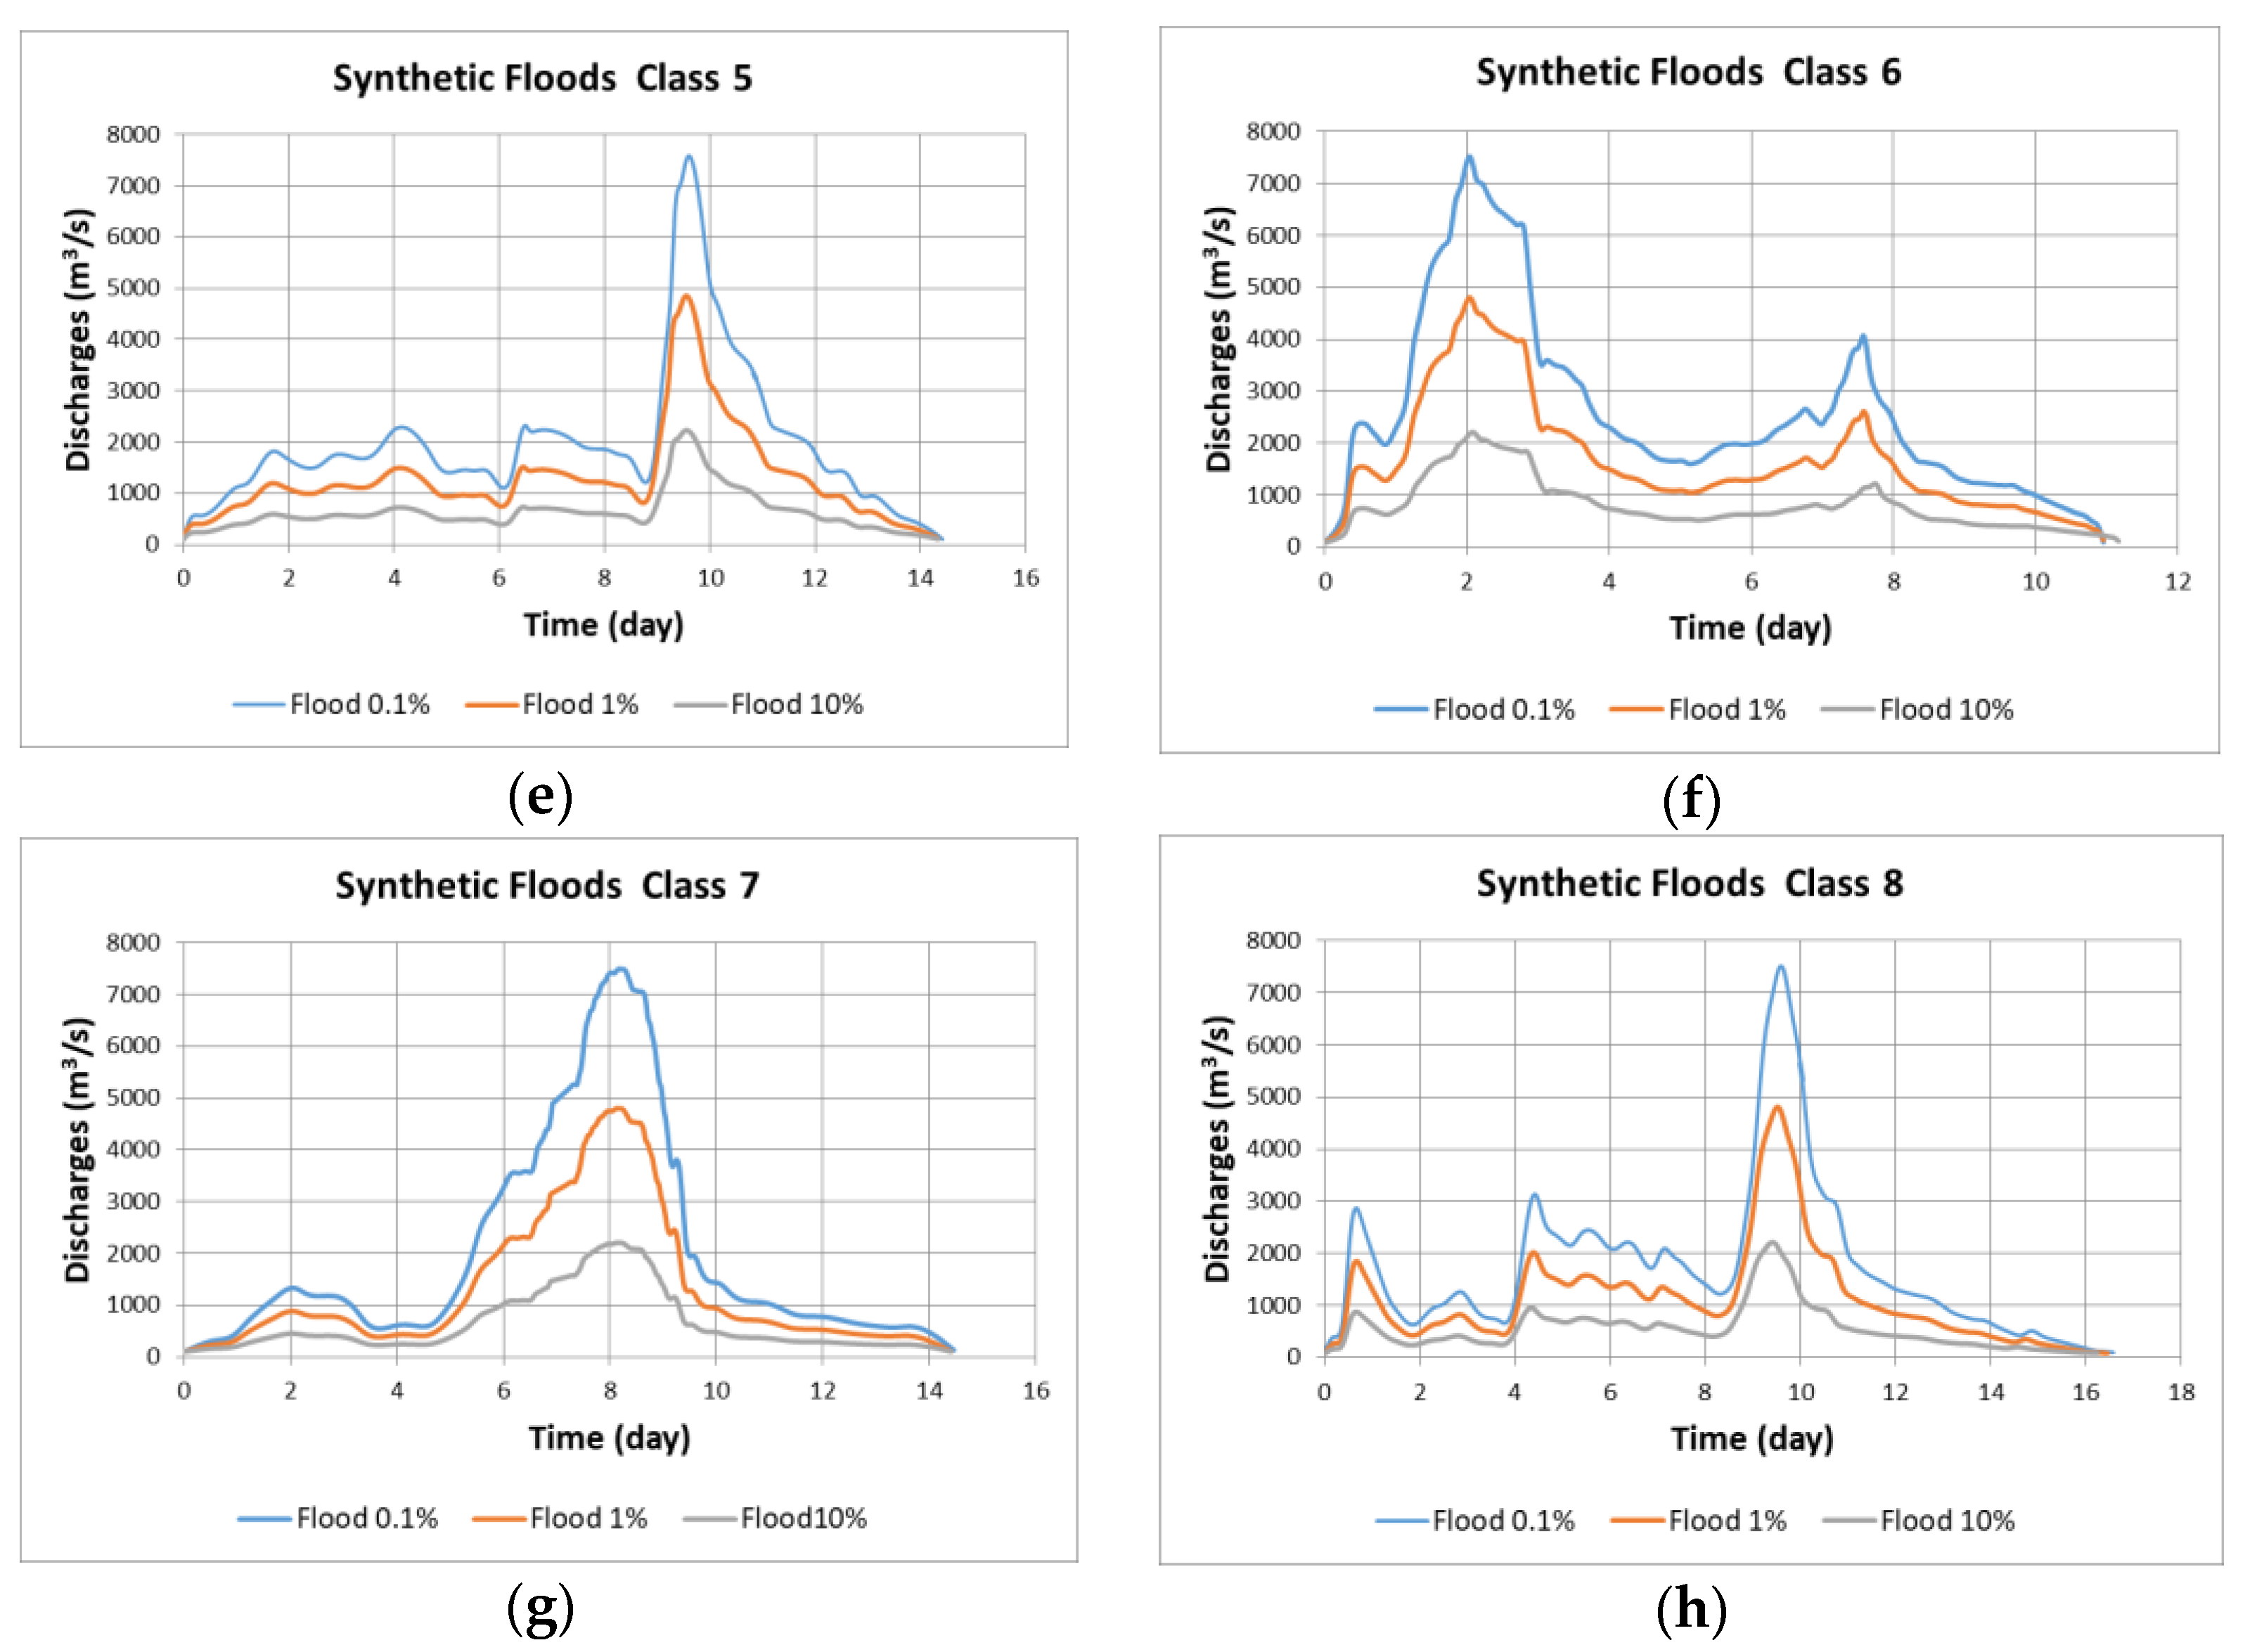
2.8. Construction of the Design Flood Hydrograph
3. Case Studies
3.1. Case Study No. 1
3.1.1. Maximum Discharges
3.1.2. Flood Volumes
3.1.3. Flood Hydrograph Shape
3.2. Case Study No. 2
4. Discussion
- (i)
- By selecting a large number of statistical distributions, such as presented in the previous chapters. The basic idea is to define the upper and lower limits of the uncertainty intervals and further obtain the MDF and MVF by establishing the appropriate combinations for the pairs and ;
- (ii)
- By choosing the best distribution, as based on statistical tests and using the confidence interval to define the lower and the upper limits of the maximum discharges and flood volumes, respectively [35,64]. The recommended confidence level β is 90–95% [52], but it can be reduced to avoid a large difference between the upper and lower limit of the uncertainty interval;
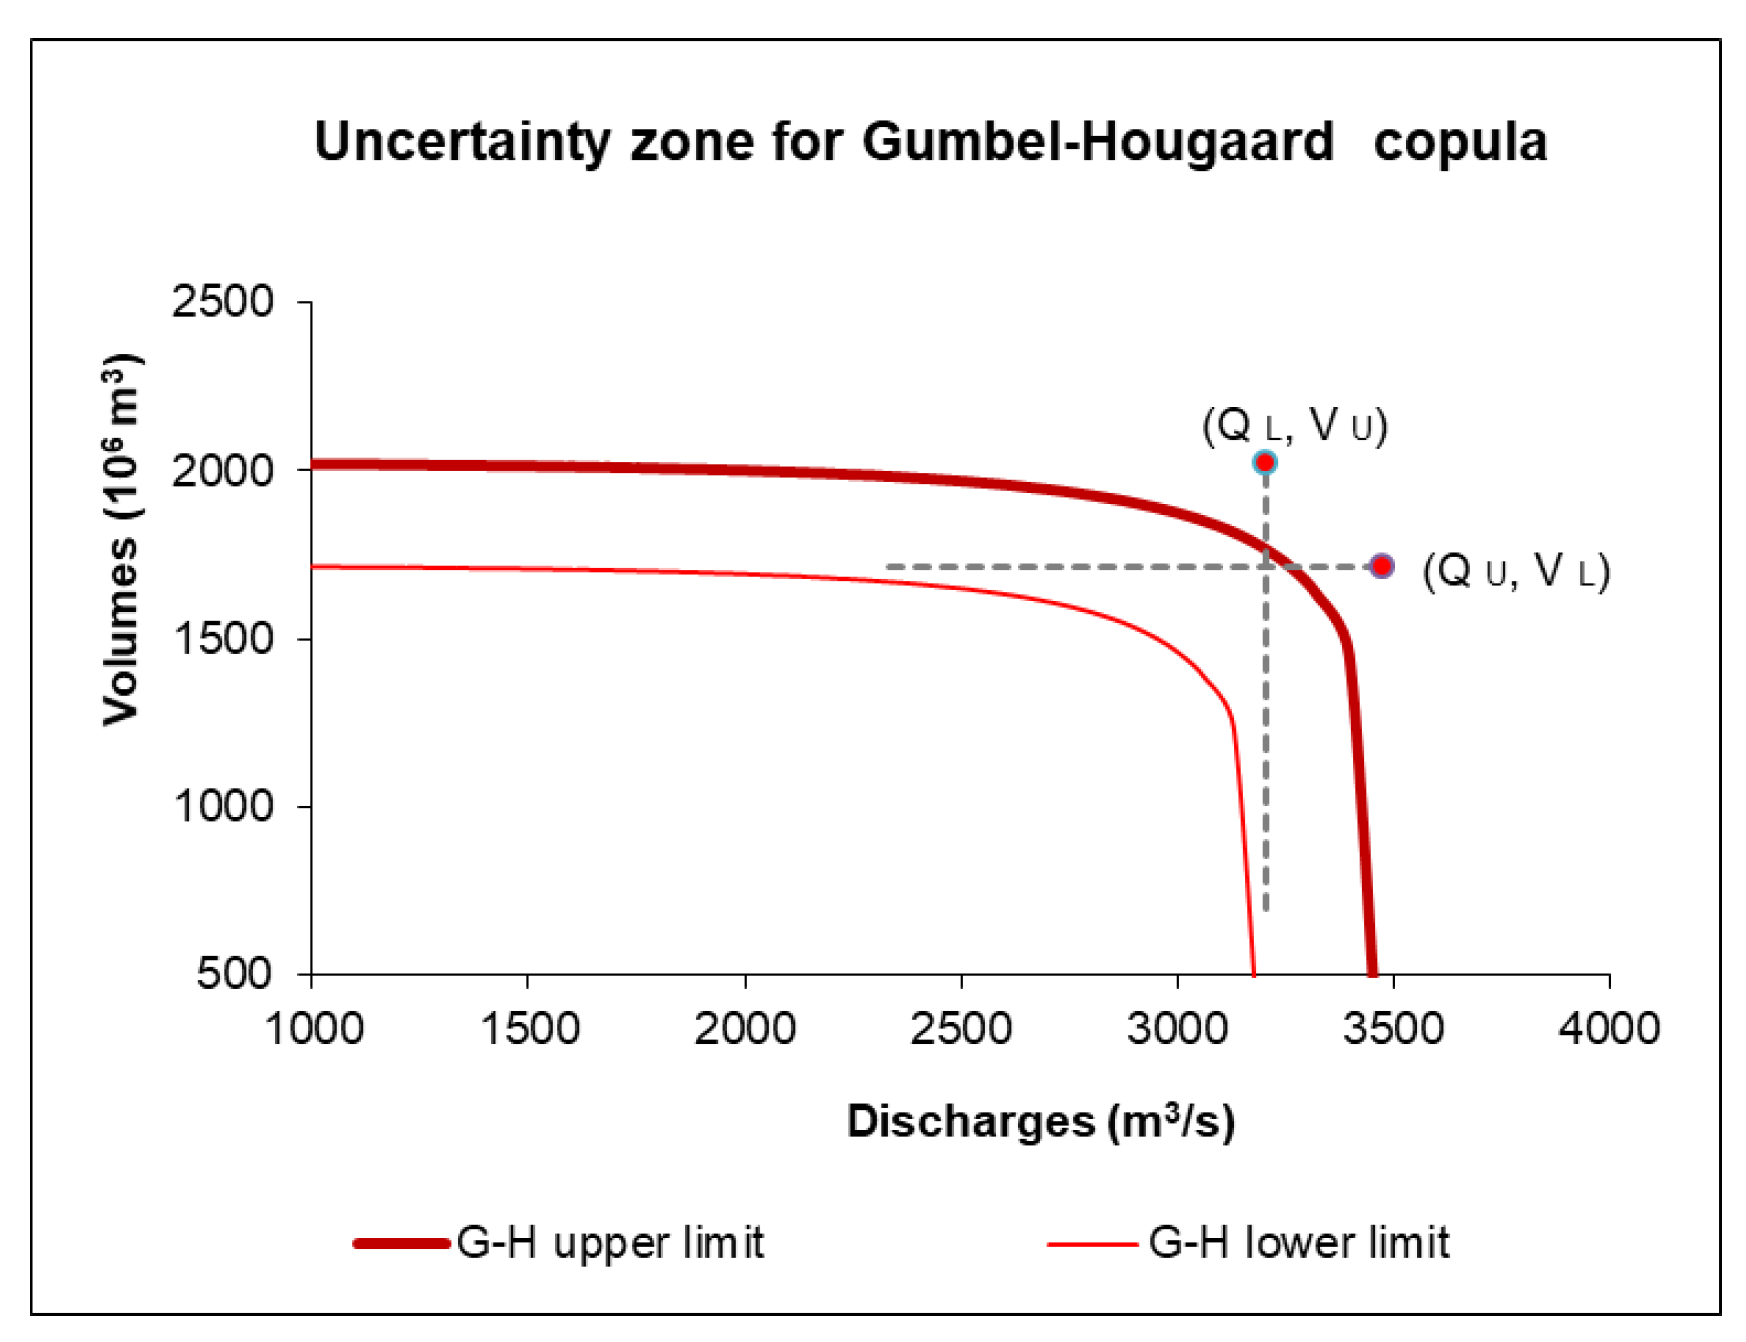
- (iii)
- As based on the uncertainty analysis of bivariate design flood [52], for a given PE, the contour lines (and copula) of the upper and lower bounds of the interval of uncertainty put into evidence an infinite number of hydrograph-coupled characteristics (maximum discharge, flood volume), which approximately satisfy the following condition:
5. Conclusions
Author Contributions
Funding
Institutional Review Board Statement
Informed Consent Statement
Data Availability Statement
Acknowledgments
Conflicts of Interest
Appendix A

References
- Lo, S. Glossary of Hydrology; Water Resources Publications: Littleton, CO, USA, 1992; pp. 346–347. [Google Scholar]
- Xiao, Y.; Guo, S.; Liu, P.; Yan, B.; Chen, L. Design flood hydrograph based on multicharacteristic synthesis index method. J. Hydrol. Eng. 2009, 14, 1359–1364. [Google Scholar] [CrossRef]
- Mediero, L.; Jimenez-Alvarez, A.; Garrote, L. Design flood hydrographs from the relationship between flood peak and volume. Hydrol. Earth Syst. Sci. 2010, 14, 2495–2505. [Google Scholar] [CrossRef] [Green Version]
- European Union. Directive 2007/60/EC of the European Parliament and of the Council of 23 October 2007 on the Assessment and Management of Flood Risks. Available online: http://eur-lex.europa.eu/legal-content/EN/TXT/?uri=CELEX:32007L0060 (accessed on 5 June 2021).
- Stedinger, J.R.; Vogel, R.M.; Foufoula-Georgiou, E. Frequency Analysis of Extreme Events. In Handbook of Hydrology; Maidment, D.R., Ed.; McGraw-Hill: New York, NY, USA, 1993; pp. 18.1–18.66. [Google Scholar]
- Pilgrim, D.H.; McDermott, G.E.; Mittelstadt, G.E. The rational Method for Flood Design for Small Rural Basins. In Catchment Runoff and Rational Formula; Yen, B.C., Ed.; Water Resources Publications: Littleton, CO, USA, 1992; pp. 16–26. [Google Scholar]
- Smithers, J.C. Methods for design flood estimation in South Africa. Water SA 2012, 38, 633–646. [Google Scholar] [CrossRef] [Green Version]
- Yevjevich, V. Probability and Statistics in Hydrology; Water Resources Publications: Littleton, CO, USA, 1972; pp. 118–168. [Google Scholar]
- Kitte, G.W. Frequency and Risk Analysis in Hydrology; 4th Printing; Water Resources Publications: Fort Collins, CO, USA, 1988; pp. 4–26. [Google Scholar]
- Bobée, B.; Ashkar, F. The Gamma Family and Derived Distributions Applied in Hydrology; Water Resources Publications: Littleton, CO, USA, 1991; pp. 121–161. [Google Scholar]
- Rosbjerg, D. Prediction of floods in ungauged basins. In Runoff Prediction in Ungauged Basins. A Synthesis across Processes, Places and Scales; Blöschl, G., Sivapalan, M., Wagener, T., Viglione, A., Savenije, H., Eds.; Cambridge University Press: Cambridge, UK, 2013; Chapter 9; pp. 189–226. [Google Scholar] [CrossRef]
- Gaur, A.; Gaur, A.; Simonovic, S. Future changes in Flood Hazard s across Canada under a Changing Climate. Water 2018, 10, 1441. [Google Scholar] [CrossRef] [Green Version]
- Liu, D.F.; Xie, B.T.; Li, H.J. Design Flood Volume of the Three Gorges Dam Project. J. Hydrol. Eng. 2011, 16, 71–80. [Google Scholar] [CrossRef]
- Favre, A.-C.; El Adlouni, S.; Perreault, L.; Thiémonge, N.; Bobée, B. Multivariate hydrological frequency analysis using copulas. Water Resour. Res. 2004, 40, W01101. [Google Scholar] [CrossRef] [Green Version]
- De Michele, C.; Salvadori, G.; Canossi, M.; Petaccia, A.; Rosso, R. Bivariate statistical approach to check adequacy of dam spillway. J. Hydrol. Eng. 2005, 10, 50–57. [Google Scholar] [CrossRef]
- Volpi, E.; Fiori, A. Design event selection in bivariate hydrological frequency analysis. Hydrol. Sci. J. 2012, 57, 1506–1515. [Google Scholar] [CrossRef]
- Brunner, M.I.; Seibert, J.; Favre, A.-C. Bivariate return periods and their importance for flood peak and volume estimation. Wiley Interdiscip. Rev. Water 2016, 3, 819–833. [Google Scholar] [CrossRef] [Green Version]
- Gaal, L.; Szolgay, J.; Bacigal, T.; Kohnova, S.; Hlavcova, K.; Vyleta, R.; Parajka, J.; Bloschl, G. Similarity of empirical copulas of flood peak-volume relationships; a regional case study of North-West Austria. Contrib. Geophys. Geod. 2016, 46, 155–178. [Google Scholar] [CrossRef] [Green Version]
- Stojkovic, M.; Prohaska, S.; Zlatanovic, N. Estimation of flood frequencies from data sets with outliers using mixed distribution functions. J. Appl. Stat. 2017, 44, 2017–2035. [Google Scholar] [CrossRef]
- Kang, L.; Jiang, S.; Hu, X.; Li, C. Evaluation of Return Period and Risk in Bivariate Non-Stationary Flood Frequency Analysis. Water 2019, 11, 79. [Google Scholar] [CrossRef] [Green Version]
- Brunner, M.I.; Sikorska-Senoner, A.E. Dependence of flood peaks and volumes in modelled discharge time series: Effect of different uncertainty sources. J. Hydrol. 2019, 572, 620–629. [Google Scholar] [CrossRef]
- Prohaska, S.; Ilić, A. Ch. 8. Theoretical Design Hydrographs at the Hydrological Gauging Stations along the Danube River. In Flood Regime of Rivers in the Danube River Basin; CD ROM; Pekárová, P., Miklánek, P., Eds.; IH SAS: Bratislava, Slovakia, 2019. [Google Scholar]
- Yue, S.; Rasmussen, P. Bivariate frequency analysis: Discussion of some useful concepts in hydrological applications. Hydrol. Process. 2002, 16, 2881–2898. [Google Scholar] [CrossRef]
- Salvadori, G.; De Michele, C. Frequency analysis via copulas: Theoretical aspects and applications to hydrological events. Water Resour. Res. 2004, 40, W12511. [Google Scholar] [CrossRef]
- Chuntian, C.; Chau, K.W.; Chunping, O. Flood Control Management System for Reservoirs as Non-Structural Measures. Available online: https://www.academia.edu/239915/Flood_Control_Management_System_for_Reservoirs_as_Non_structural_Measures (accessed on 5 June 2021).
- Grimaldi, S.; Serinaldi, F. Asymmetric copula in multivariate flood frequency analysis. Adv. Water Resour. 2006, 29, 1155–1167. [Google Scholar] [CrossRef]
- Karmakar, S.; Simonovic, S.P. Bivariate flood frequency analysis: Part1. Determination of marginals by parametric and nonparametric techniques. J. Flood Risk Manag. 2008, 1, 190–200. [Google Scholar] [CrossRef]
- Li, T.; Guo, S.; Liu, Z.; Xiong, L.; Yin, J. Bivariate design flood quantile selection using copulas. Hydrol. Res. 2017, 48, 997–1013. [Google Scholar] [CrossRef]
- Brunner, M.I.; Viviroli, D.; Sikorska, A.E.; Vannier, O.; Favre, A.-C.; Seibert, J. Flood type specific construction of synthetic design hydrographs. Water Resour. Res. 2017, 53, 1390–1406. [Google Scholar] [CrossRef] [Green Version]
- Mazzorana, B.; Hubl, J.; Fuchs, S. Improving risk assessment by defining consistent and reliable system scenarios. Nat. Hazards Earth Syst. Sci. 2009, 9, 145–159. [Google Scholar] [CrossRef]
- Mazzorana, B.; Comiti, F.; Fuchs, S. A structured approach to enhance flood hazard assessment in mountain streams. Nat. Hazards 2013, 67, 991–1009. [Google Scholar] [CrossRef]
- STAS 4068/1-82. Determination of Maximum Water Discharges and Volume of Watercourses; Romanian Institute of Standardization: Bucharest, Romania, 1982. (In Romanian) [Google Scholar]
- Drobot, R.; Dragia, A.F. Design Floods Obtained by Statistical Processing. In Proceedings of the 24th Congress on Large Dams, Q94, Kyoto, Japan, 12 June 2012. [Google Scholar]
- Stănescu, V.A.; Ungureanu, V.; Mătreață, M. Regional analysis of the annual peak discharges in the Danube catchment. In The Danube and Its Catchment—A Hydrological Monograph; Follow-up Volume No. VII; Regional Cooperation of the Danube Countries: Bucharest, Romania, 2004. [Google Scholar]
- Chow, V.T.; Maidment, D.; Mays, L. Applied Hydrology; McGraw-Hill: The Synergy, Singapore, 1988; pp. 380–415. [Google Scholar]
- Naden, P.S. Analysis and use of peaks-over-threshold data in flood estimation. In Floods and Flood Management. Fluid Mechanics and Its Applications; Saul, A.J., Ed.; Springer: Dordrecht, The Netherlands, 1992; Volume 15. [Google Scholar] [CrossRef]
- Maidment, D.R. Handbook of Hydrology. In Frequency Analysis of Extreme Events; McGraw-Hill: New York, NY, USA, 1993; pp. 12–13. [Google Scholar]
- Malamoud, B.D.; Turcotte, D.L. The applicability of power-law frequency statistics to floods. J. Hydrol. 2006, 322, 168–180. [Google Scholar] [CrossRef]
- Leadbetter, M.R. On a basis for ‘Peaks over Threshold’ modeling. Stat. Probab. Lett. 1991, 12, 357–362. [Google Scholar] [CrossRef]
- Bhunya, P.K.; Singh, R.D.; Berndtsson, R.; Panda, S.N. Flood analysis using generalized logistic models in partial duration series. J. Hydrol. 2012, 420–421, 59–71. [Google Scholar] [CrossRef]
- Ouarda, T.B.M.J.; Cunderlik, J.M.; St-Hilaire, A.; Barbet, M.; Bruneau, P.; Bobée, B. Data-based comparison of seasonality-based regional flood frequency methods. J. Hydrol. 2006, 330, 329–339. [Google Scholar] [CrossRef]
- Bezak, N.; Brilly, M.; Šraj, M. Comparison between the peaks-over-threshold method and the annual maximum method for flood frequency analysis. Hydrol. Sci. J. 2014, 59, 959–977. [Google Scholar] [CrossRef] [Green Version]
- Razmi, A.; Golian, S.; Zahmatkesh, Z. Non-Stationary Frequency Analysis of Extreme Water Level: Application of Annual Maximum Series and Peak-over Threshold Approaches. Water Resour. Manag. 2017, 31, 2065–2083. [Google Scholar] [CrossRef]
- Meylan, P.; Favre, A.C.; Musy, A. Hydrologie Fréquentielle; Une Science Prédictive; Presses Polytechniques et Universitaires Romandes: Lausanne, Switzerland, 2008; pp. 137–159. [Google Scholar]
- Pettit, A.N. A non-parametric approach to the changepoint problem. Appl. Stat. 1979, 28, 126–135. [Google Scholar] [CrossRef]
- Ang, A.H.-S.; Tang, W.H. Probability Concepts in Engineering, Emphasis on Application to Civil and Environmental Engineering, 2nd ed.; John Wiley & Sons: San Francisco, CA, USA, 2006; p. 432. [Google Scholar]
- Bobée, B.; Cavadias, G.; Ashkar, F.; Bernier, J.; Rasmussen, P. Towards a systematic approach to comparing distributions used in flood frequency analysis. J. Hydrol. 1993, 142, 121–136. [Google Scholar] [CrossRef]
- Koutsoyiannis, D. Uncertainty, entropy, scaling and hydrological statistics. 1. Marginal distributional properties of hydrological processes and state scaling / Incertitude, entropie, effet d’échelle et propriétés stochastiques hydrologiques. 1. Propriétés distributionnelles marginales des processus hydrologiques et échelle d’état. Hydrol. Sci. J. 2005, 50, 381–404. [Google Scholar]
- El Adlouni, S.; Bobée, B.; Ouarda, T.B.M.J. On the tails of extreme event distributions in hydrology. J. Hydrol. 2008, 355, 16–33. [Google Scholar] [CrossRef]
- Shanin, M.; Van Oorschoft, H.J.L.; De Lange, S.J. Statistical Analysis in Water Resources Engineering; Balkema: Rotterdam, The Netherlands, 1993; pp. 81–125. [Google Scholar]
- Guo, S.; Muhammad, R.; Liu, Z.; Xiong, F.; Yin, J. Design flood estimation methods for cascade reservoirs based on copulas. Water 2018, 10, 560. [Google Scholar] [CrossRef] [Green Version]
- Yin, J.; Guo, S.; Liu, Z. Uncertainty analysis of bivariate design flood estimation and its impact on reservoir routing. Water Resour. Manag. 2018, 32, 1795–1809. [Google Scholar] [CrossRef]
- Bačová-Mitková, V.; Onderka, M. Analysis of extreme hydrological Events on the Danube using the Peak over Threshold method. J. Hydrol. Hydromech. 2010, 58. [Google Scholar] [CrossRef] [Green Version]
- Pekárová, P.; Miklánek, P. (Eds.) Flood Regime of Rivers in the Danube River Basin, the Danube and Its Tributaries—Hydrological Monograph Follow-Up Volume IX; CD ROM; IH SAS: Bratislava, Slovakia, 2019. [Google Scholar]
- Merz, B.; Thieken, A.H. Flood risk curves and uncertainty bounds. Nat. Hazards 2009, 51, 437–458. [Google Scholar] [CrossRef]
- Kundzewicz, Z.W.; Robson, A.J. Change detection in hydrological records—A review of the methodology/Revue méthodologique de la détection de changements dans les chroniques hydrologiques. Hydrol. Sci. J. 2004, 49, 7–19. [Google Scholar] [CrossRef]
- Hoffman, F.O.; Hammonds, J.S. Propagation of uncertainty in risk assessments: The need to distinguish between uncertainty due to lack of knowledge and uncertainty due to variability. Risk Anal. 1994, 14, 707–712. [Google Scholar] [CrossRef] [PubMed]
- Apel, H.; Thieken, A.H.; Merz, B.; Bloschl, G. Flood risk assessment and associated uncertainty. Nat. Hazards Earth Syst. Sci. 2004, 4, 295–308. [Google Scholar] [CrossRef]
- Gericke, O.J.; du Plessis, J.A. Evaluation of the standard design flood method in selected basins in South Africa, SAICE-SAISI. J. S. Afr. Inst. Civil Eng. 2012, 54, 2–14. [Google Scholar]
- Darch, G.J.C.; Jones, P.D. Design flood flows with climate change: Method and limitations. Proc. Inst. Civ. Eng. Water Manag. 2012, 165, 553–565. [Google Scholar] [CrossRef]
- Pekárová, P.; Miklánek, P.; Bálint, G.; Belz, J.U.; Biondić, D.; Gorbachova, L.; Kobold, M.; Kupusović, E.; Soukalová, E.; Prohaska, S.; et al. Ch. 1 Average daily discharge and annual peak discharge series collection. In Flood Regime of Rivers in the Danube River Basin; CD ROM; Pekárová, P., Miklánek, P., Eds.; IH SAS: Bratislava, Slovakia, 2019. [Google Scholar]
- Apel, H.; Merz, B.; Thieken, A.H. Influence of dike breaches on flood frequency estimation. Comput. Geosci. 2009, 35, 907–923. [Google Scholar] [CrossRef] [Green Version]
- Hu, L.; Nikolopoulos, E.I.; Marra, F.; Anagnostou, E.N. Sensitivity of flood frequency analysis to data record, statistical model, and parameter estimation methods: An evaluation over the contiguous United States. J. Flood Risk Manag. 2020, 13, e12580. [Google Scholar] [CrossRef] [Green Version]
- FISRWG—Federal Interagency Stream Restoration Working Group. Stream Corridor Restoration: Principles, Processes and Practices; National Technical Information Service U.S. Department of Commerce: Springfield, VA, USA, 1998. [Google Scholar]
- Lang, M.; Ouarda, T.B.M.J.; Bobée, B. Towards operational guidelines for over-threshold modeling. J. Hydrol. 1999, 225, 103–117. [Google Scholar] [CrossRef]
- Bayliss, A.C. Deriving flood peak data. In Flood Estimation Handbook; UK Centre for Ecology and Hydrology, Lancaster University: Bailrigg, UK, 1999; Volume 3, pp. 273–283. [Google Scholar]
- Svensson, C.; Kundzewicz, Z.W.; Maurer, T. Trend detection in river flow series: 2. Flood and low-flow index series/Détection de tendance dans des séries de débit fluvial: 2. Séries d’indices de crue et d’étiage. Hydrol. Sci. J. 2005, 50. [Google Scholar] [CrossRef] [Green Version]
- Šraj, M.; Bezak, N.; Brilly, M. Bivariate flood frequency analysis using the copula function: A case study of the Litija station on the Sava River. Hydrol. Process. 2015, 29, 225–238. [Google Scholar] [CrossRef]
- DANUBE FLOODRISK PROJECT. Available online: https://environmentalrisks.danube-region.eu/projects/danube-floodrisk (accessed on 5 June 2021).
- EASTAVERT PROJECT “The Prevention and Protection against Floods in the Upper Siret and Prut River Basins, through the Implementation of a Modern Monitoring System with Automatic Stations”–MIS ETC 966. Available online: https://www.inbo-news.org/en/documents/eastavert-project-prevention-and-protection-against-floods-upper-siret-and-prut-river (accessed on 5 June 2021).
- IUGG. Ch. 2.7. Statistical Hydrology. In Contributions to Hydrological Sciences, 2011–2014; Romanian Committee of Geodesy and Geophysiscs: Bucharest, Romania, 2015; pp. 194–195. Available online: http://www.iugg.org/members/nationalreports/2011-2014_Report_Romania.pdf (accessed on 5 June 2021).
- Wasko, C.; Westra, S.; Nathan, R.; Orr, H.G.; Villarini, G.; Villalobos Herrera, R.; Fowler, H.J. Incorporating climate change in flood estimation guidance. Phil. Trans. R. Soc. 2021, 379, 20190548. [Google Scholar] [CrossRef]
- Serinaldi, F.; Kilsby, C.G. Stationarity is undead: Uncertainty dominates the distribution of extremes. Adv. Water Resour. 2015, 77, 17–36. [Google Scholar] [CrossRef] [Green Version]


| Statistical Test | Statistics | |Z| Statistics | Z Quantile | First Degree Error | Conclusions |
|---|---|---|---|---|---|
| Wald–Wolfowitz | R = 31 | 1.74264 | 0.0814 | Mutual independence, 5% threshold | |
| Turning point | T = 50 | 0.18115 | 0.85626 | Identical distribution, 10% threshold | |
| Mann–Whitney–Wilcoxon | W = 700 | 0.03179 | 0.97464 | Mutual homogeneity, 10% threshold | |
| Mann–Kendall | T = −115 | 0.49192 | 0.62278 | No trend, 10% threshold |
| P% | POT | POT * | AMS | |||
|---|---|---|---|---|---|---|
| (m3/s) | (m3/s) | (m3/s) | ||||
| 0.1 | 8321 | 11,346 | 16,621 | 19,646 | 17,317 | 19,884 |
| 1 | 7453 | 8238 | 15,753 | 16,538 | 15,825 | 16,888 |
| 10 | 5133 | 5450 | 13,433 | 13,750 | 13,541 | 13,679 |
| P% | ||
|---|---|---|
| 0.1 | 70,384 | 87,390 |
| 1 | 45,768 | 53,677 |
| 10 | 21,633 | 22,428 |
| Flood Number | Starting Date | Maximum Discharge (m3/s) | Flood Volume (106 m3) | Compactness Coefficient (-) | Time to Peak (Days) | Flood Duration (Days) | |
|---|---|---|---|---|---|---|---|
| 80 | 07/03/2006 | 16,300 | 94,198 | 31,880 | 0.53 | 45.9 | 86.9 |
| 38 | 14/02/1970 | 14,940 | 161,521 | 49,641 | 0.55 | 106.3 | 156.0 |
| 31 | 13/03/1962 | 14,700 | 78,827 | 21,642 | 0.49 | 40.7 | 79.7 |
| 55 | 12/03/1981 | 14,400 | 45,298 | 14,292 | 0.63 | 17.2 | 43.2 |
| 54 | 30/04/1980 | 14,400 | 47,509 | 12,370 | 0.48 | 26.0 | 49.0 |
| P% | (m3/s) | (106 m3) | (106 m3) | Flood Duration (Days) |
|---|---|---|---|---|
| 0.1 | 19,884 | 60,145 | 141,508 | 116 |
| 1 | 16,888 | 39,108 | 110,432 | 100 * |
| 10 | 13,679 | 18,485 | 72,359 | 75 |
| P% | (106 m3) | (106 m3) | Flood Duration (Days) | |
|---|---|---|---|---|
| 0.1 | 17,317 | 87,390 | 220,534 | 185 |
| 1 | 15,835 | 53,677 | 151,682 | 137 * |
| 10 | 13,541 | 22,428 | 81,231 | 82 |
| P% | Evaluation 2007 | Re-Evaluation 2018 | |
|---|---|---|---|
| Pearson 3 | LogN 3p | LogN 2p | |
| 0.1 | 4300 | 5143 | 5425 |
| 1 | 2800 | 3203 | 3311 |
| 10 | 1500 | 1670 | 1686 |
| Flood Type | Class 9 | Class 10 | |||||
|---|---|---|---|---|---|---|---|
| D(Days) | D(Days) | ||||||
| 0.1% | MDF | 6543 | 2760 | 7.5 | 13.5 | 6.6 | 13.5 |
| MVF | 5145 | 3598 | 11.0 | 20.0 | 9.3 | 21.8 | |
| 1% | MDF | 3476 | 1713 | 8.0 | 16.2 | 7.1 | 15.2 |
| MVF | 3204 | 2020 | 9.4 | 20.2 | 8.5 | 17.3 | |
| 10% | MDF | 1738 | 719 | 6.7 | 13.2 | 5.2 | 12.3 |
| MVF | 1641 | 743 | 7.4 | 14.7 | 5.7 | 12.8 | |
Publisher’s Note: MDPI stays neutral with regard to jurisdictional claims in published maps and institutional affiliations. |
© 2021 by the authors. Licensee MDPI, Basel, Switzerland. This article is an open access article distributed under the terms and conditions of the Creative Commons Attribution (CC BY) license (https://creativecommons.org/licenses/by/4.0/).
Share and Cite
Drobot, R.; Draghia, A.F.; Ciuiu, D.; Trandafir, R. Design Floods Considering the Epistemic Uncertainty. Water 2021, 13, 1601. https://doi.org/10.3390/w13111601
Drobot R, Draghia AF, Ciuiu D, Trandafir R. Design Floods Considering the Epistemic Uncertainty. Water. 2021; 13(11):1601. https://doi.org/10.3390/w13111601
Chicago/Turabian StyleDrobot, Radu, Aurelian Florentin Draghia, Daniel Ciuiu, and Romică Trandafir. 2021. "Design Floods Considering the Epistemic Uncertainty" Water 13, no. 11: 1601. https://doi.org/10.3390/w13111601
APA StyleDrobot, R., Draghia, A. F., Ciuiu, D., & Trandafir, R. (2021). Design Floods Considering the Epistemic Uncertainty. Water, 13(11), 1601. https://doi.org/10.3390/w13111601