1. Introduction
Water shortage and environmental problems are two of the most challenging topics in the world, which need more attention to tackle [
1]. Formaldehyde is extensively used in different fields, such as wood processing; the chemical and petrochemical industries; the production of preservative, resin and textile industries and sterilizing and disinfection [
2,
3]. Furthermore, contaminated liquids with a high concentration of formaldehyde remain after the dehydrogenation or oxidation of methyl alcohol in various industries, which are discharged to the aquatic environment. The concentrations of formaldehyde in industrial effluents can vary from 100 to 10,000 mg/L [
3,
4]. Formaldehyde is a harmful compound and human carcinogen imposing damages on the environment and human health. According to the International Agency for Research on Cancer (IARC), formaldehyde has been classified as a group I carcinogenic substance for humans. Additionally, its teratogenic effect in both humans and animals has been established [
5,
6]. A threshold concentration of 1.61-mg/L formaldehyde has been proposed for protecting the aquatic ecosystem [
4]. Therefore, effluents containing formaldehyde must be treated before their discharge into the environment in order to protect aquatic ecosystems and human health.
Different processes have been used for the elimination of formaldehyde from wastewater, such as biological processes, adsorption, absorption, condensation, ion exchange and membrane technology [
3,
7]. However, each of these processes has certain limitations. For example, when investigating 100 mg/L of formaldehyde biodegradation by
Pseudomonas putida IOFA1 in the concentrated effluents, formaldehyde cannot be adequately decomposed within 40 min [
8]. In addition, formaldehyde reacts with the RNA and DNA of microorganisms, resulting in their deaths [
4,
8]. Advanced oxidation processes (AOPs) such as Fenton and photo-Fenton, which are based on the generation of one or more oxidants, have been identified as the most applicable processes for the degradation of recalcitrant chemical compounds [
9,
10]. Göde et al. [
11] indicated that Fenton and Fenton-like processes can successfully treat landfill leachate. In addition, different investigations in photo-Fenton, photocatalysis and ozonation revealed the potentials of such processes in the successful elimination of recalcitrant compounds [
12,
13,
14]. However, it has been reported that some recalcitrant compounds cannot be sufficiently decomposed with a single oxidant, and more and faster decompositions of the recalcitrant compounds have been reported with combined AOPs due to the simultaneous applications of various oxidants [
15]. In the Fenton, photo-Fenton and ozonation/Fenton processes, various types of oxidants can be produced and applied for the decomposition of such contaminants [
16,
17]. Up to now, there has been a lack of studies comparing the performances of single and combined processes in formaldehyde removal from wastewater. Besides, to optimize such processes, researchers usually use different experimental procedures, which are time- and cost-consuming. Interestingly, the optimization and investigation of different conditions of the process can be aided by advanced study design and modeling procedures, which are rarely reported.
In order to determine the optimal conditions in a treatment system, the common approach is to keep all except one variable at an unspecified steady state [
18,
19,
20,
21]. The major disadvantage of such a single-parameter optimization procedure is its inability to detect the interactive effects of various independent variables on dependent variables and, hence, to generate correct net effects of these independent variables on the responses. The response surface methodology (RSM) is regarded as one of the most well-known methods in process design, modeling and optimization, as RSM can model the influences of various dependent variables both individually and through interactions on the responses. However, the obtained RSM model may not be sufficiently flexible to show the appropriate response surface [
22].
In contrast to the traditional modeling methods, the artificial neural network (ANN) is an influential and powerful modeling method and demonstrates a great performance in modeling processes that are highly complicated without fully understanding their mechanisms [
23]. Various researches have been reported regarding the application of both RSM and ANN modeling procedures. However, such modeling has not been reported regarding Fenton processes for formaldehyde removal [
24]. In addition, the reported results showed that the performances of these models can be dependent on the type of phenomena that are being modeled [
24,
25]. Furthermore, a deep analysis will identify the relative importance of the variables affecting this process and help to improve the efficiency of the process, therefore addressing the deficiency and knowledge gap as well.
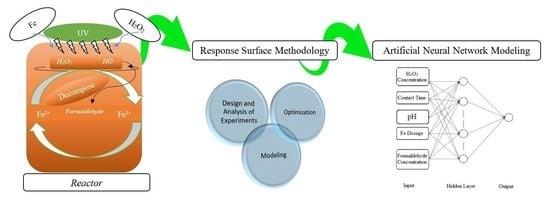
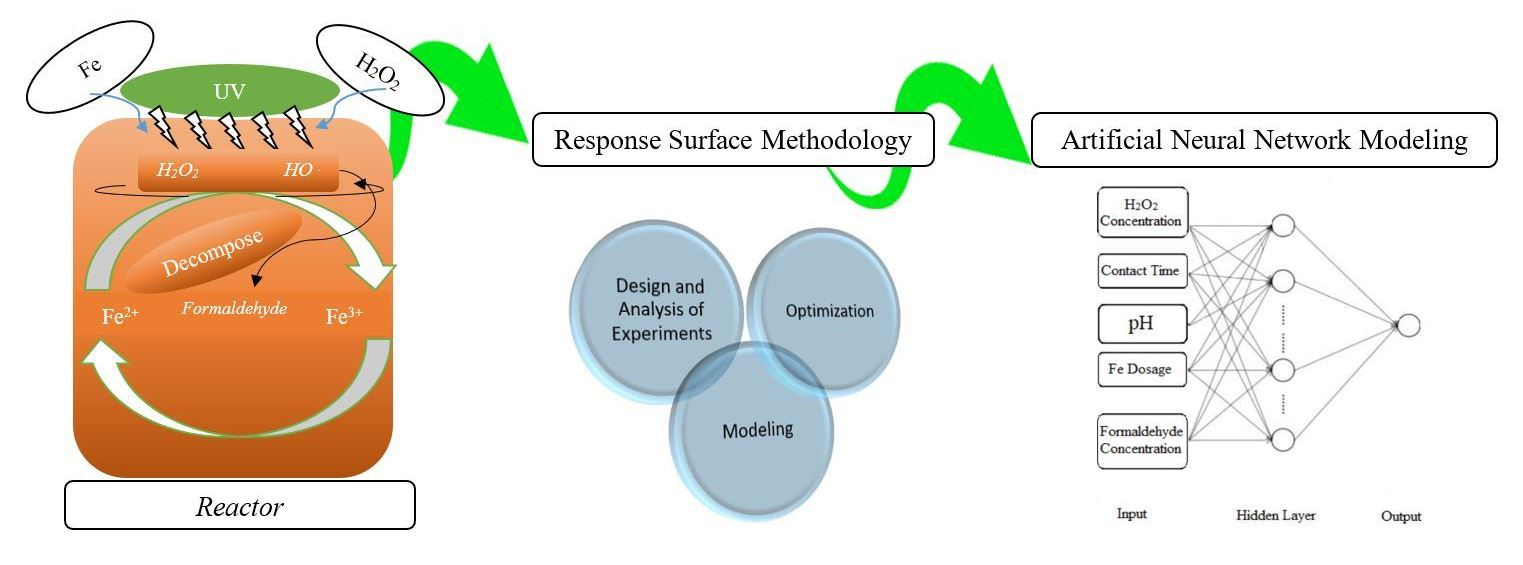
The objective of this study was to assess, compare and optimize the efficiencies of the Fenton, photo-Fenton and ozonation/Fenton processes in the elimination of formaldehyde from water and real wastewater from the adhesive manufacturing industry with respect to the effects of pH, contact time, initial concentration of formaldehyde, UV, dosage of Fe, H2O2 concentration and ozonation. In addition, RSM and ANN were employed to model and compare the Fenton process performance in formaldehyde elimination from wastewater. Furthermore, a sensitivity analysis was conducted to determine the relative importance of the independent variables that are important to design more efficient studies in the future.
2. Materials and Methods
2.1. Materials
All of the chemicals, including formaldehyde, hydrochloric acid, sodium hydroxide, ethanol, ferric chloride, sodium sulfite, sulfuric acid, hydrogen peroxide and thymolphthalein, were of analytical grade and were provided by Merck, Germany. Wastewater was obtained from a wastewater treatment plant for the adhesive manufacturing industry, Mashhad, Iran. Stock solutions of formaldehyde and hydrogen peroxide were prepared by the dilution of 2.7 mL and 97.2 mL to 1 L, with a final concentration of 1000 mg/L and 1 mol/L, respectively. Ferric chloride and sodium sulfite solutions were prepared by dissolving 2.42 g and 126.043 g in distilled water and diluting up to 1 L, with a final concentration of 2420 mg/L and 1 mol/L, respectively. In order to prepare a solution for the determination of the consumed acid proportion, 1 g of thymolphthalein was dissolved in 1 L of methanol.
2.2. Experimental Procedure and Analysis
For the Fenton process, the experiments were carried out in a batch system using a cylindrical glass reactor of 250 mL. According to the designed runs by RSM, after pH adjustment and the addition of appropriate proportions of ferric chloride and hydrogen peroxide, the prepared samples containing formaldehyde were stirred during the contact times (15–90 min). Then, the samples were adjusted to pH ≥ 9 through the addition of a NaOH solution, from which 2-mL samples were filtered and titrated in 50 mL of sodium sulfite, using sulfuric acid with phenolphthalein as an indicator [
26]. The formaldehyde proportion was calculated using Equation (1):
where
W is the weight of formaldehyde (%),
V is the volume of H
2SO
4 for the sample titration (mL),
B is the volume of H
2SO
4 for the blank titration (mL),
M is the normality of H
2SO
4,
F is 0.03003 (formaldehyde milliequivalent weight) and
S is sample mass (g). After completing the experiments designed by the RSM for the Fenton process, the optimization of photo-Fenton and ozonation/Fenton were conducted. Finally, the optimized Fenton, photo-Fenton and ozonation/Fenton processes were applied to treat real industrial wastewater. For both the ozonation and photo-Fenton processes, the aforementioned reactor was applied, although a moveable UV lamp (40 W) covered in a quartz tube was horizontally installed on top of the reactor and completely covered with an aluminum foil in photo-Fenton process.
2.3. Experimental Design
A central composite design (CCD) as a standard RSM methodology was used to design the investigation procedure to model formaldehyde removal by Fenton process and determine the efficiency of the process. According to this procedure, the number of required experiments was calculated using Equation (2):
where
N is the number of required runs,
n is the number of independent variables and
nc is the number of center points that are applied for assessing the experimental error and the data reproducibility [
22]. Thus, for formaldehyde removal processes with five different independent variables (
n = 5), including pH, contact time, initial concentration of formaldehyde, Fe dosage and H
2O
2 concentration, as shown in
Table 1, all of the considered runs were computed as Equation (3):
The dependent response variable was the efficiency of the formaldehyde removal using the three aforementioned processes. The calculation of the achieved experimental results was performed in accordance with the second-order polynomial Equation (4):
In order to decrease the effects of uncontrolled parameters, all of the runs were replicated twice, and the sequences of the runs were randomized [
22].
A Design Expert
® 7.0 software program was applied to generate the quadratic model of the obtained experimental results, and the developed model was assessed using the analysis of variances (ANOVA). The determination coefficients (
), along with the F-test, were used for the model goodness of fit and statistical significance assessments [
22,
27].
2.4. Optimization
The optimization of the Fenton process efficiency in the formaldehyde removal from water was carried out by the Design Expert® program. This program looks for a group of independent factor levels with the best efficiency in formaldehyde removal. During the optimization stage, each independent variable, including H2O2 concentration, initial concentration of formaldehyde, Fe dosage, contact time and pH, was chosen and optimized. Within the range, the maximum, minimum and none (only for the dependent parameters), coupled with setting an accurate value (only for the response factor), were the possible targets in this regard. Finally, an overall desirability was achieved from these possible targets. Additionally, after the optimization of the Fenton process parameters, the optimized Fe dosage, H2O2 concentration and initial formaldehyde concentration for Fenton were optimized in five different pH (3, 5, 7, 9 and 11) and four various contact times (15, 30, 60 and 90 min) with 20 experiments. In order to optimize the ozonation process, the same condition with a different contact time (15, 30, 60 and 80 min) was repeated in an ozone injection of 1.4 mg/(L min). It is worth mentioning that the formaldehyde concentration was 215.91 mg/L based on the Fenton optimization results. In addition, all the experiments were repeated to ensure the reproducibility of the results.
2.5. Formaldehyde Removal from Wastewater by FENTON, Photo-Fenton and Ozonation/Fenton Processes
The optimized Fenton, photo-Fenton and ozonation/Fenton processes were applied to treat real industrial wastewater from a wastewater treatment plant for adhesive manufacturing industry effluent located in Mashhad, Iran containing formaldehyde. During the 24-h sampling period, 4-L samples were taken every 2 h from the influent of the treatment plant. After the formaldehyde analysis and sedimentation for 48 h, the efficiency of the Fenton, photo-Fenton and ozonation/Fenton processes in formaldehyde elimination were assessed.
2.6. Artificial Neural Network Modeling
A multilayer perceptron feedforward artificial neural network (MLP-FFANN) was applied to model the removal efficiency of formaldehyde from water by the Fenton process. Based on the proportions of the independent and dependent parameters, five and one nodes were used in the input and output layers to model the process, respectively. To obtain the best model, numerous proportions of nodes ranging from 1 to 20 were loaded in the hidden layer, and the performances of the built neural networks were evaluated using the mean squared error (MSE) in all the training, validation and test phases. The used training backpropagation algorithm for the development of the models was Levenberg-Marquardt. Additionally, the sigmoid transfer function (tansig) and linear transfer function (purelin) were used in the hidden and output layers, consecutively [
23]. In order to model, 70%, 15% and 15% of the experimental results were allocated to the training, validation and test phases, respectively. In contrast to the output data, the experimental results were normalized in a range from 0.1 to 0.9 according to Equation (5) [
23]:
The reduction of the computational complexity, as well as prevention from overtraining, are two of the most important reasons for data normalization.
2.7. Comparison between RSM and ANN Models
In order to compare the models of the Fenton process, all of the experimental results were used to predict the formaldehyde removal efficiency by both the RSM and ANN models. Four different statistical parameters, including the root mean square error (RMSE), sum square error (SSE), Adjusted
R2 (Adj-
R2) and
R2, were calculated using the equations presented in
Table 2 to evaluate the strengths of the developed models [
28]. It is worth highlighting that higher proportions of the
R2, as well as Adjusted
R2 (Adj-
R2), along with lower proportions of the RMSE and SSE, principally demonstrated the model with a higher prediction strength.
2.8. Sensitivity Analysis
In order to assess the importance percentages of the independent variables in prediction of the response, Equation (6) was used.
where
Ij and
Ni are the importance and the number of independent variables, consecutively;
Nh,
W,
m,
n and
k are, correspondingly, the number of hidden layer nodes, ANN weight, the number of hidden nodes, the number of response factor (output) and the number of independent factors and
i,
h and
o are, respectively, related to the input, hidden and output layers [
29].
3. Results and Discussion
3.1. ANOVA and Assessment of Model Fitness
In order to determine the effects of five different independent variables on the formaldehyde elimination from water, fifty runs were designed and accomplished. The experimental results, coupled with the predicted results and the experimental conditions, are presented in
Table 3.
At first, an empirical relationship was demonstrated between the coded independent variable and response factors by the fitted polynomial model. The fitted modified quadratic equation for the Fenton process is presented in Equation (7):
where
Y is the efficiency of Fenton process in the elimination of formaldehyde, and A, B, C, D and E are the coded independent parameters demonstrated in
Table 1. The validation and adequacy of the developed model were assessed using an ANOVA.
Table 4 displays the significance of the coefficients, as well as the results of the ANOVA for the modified model. The F-test was applied to assess the goodness of fit of the model. According to the obtained output, the F-value was 77.34 for formaldehyde removal from water by the Fenton process. This demonstrated that the developed model for formaldehyde removal was significant (
p-value < 0.05). The adequacy of the obtained model for formaldehyde removal was also assessed by a statistical factor (
R2), which was 0.9185, meaning that 8.15% of the variability in the formaldehyde removal efficiency was not described by the developed model. The calculated values of the predicted
R2 and Adj.
R2 for the Fenton process in the formaldehyde removal from water were 0.9186 and 0.9169, correspondingly, establishing the model’s goodness-of-fit. Additionally, the differences between the proportions of the predicted
R2 and Adj.
R2 indicated that there was a good agreement between these two parameters in the developed model. In addition, the achieved Adeq Precision for this developed model was 23.46, demonstrating that there was a desired signal-to-noise ratio, which was higher than 4 [
30]. Therefore, the obtained model was able to navigate in the designed spaces.
3.2. Optimization of Different Fenton Processes in Formaldehyde Removal
Based on the experimental results from the Fenton process, the maximum formaldehyde removal was 75.0%. Further experiments were carried out to evaluate the validity of the developed RSM model and optimized condition. The proposed optimum conditions for the pH, initial concentration of formaldehyde, Fe dosage, H2O2 concentration and contact time were 5.32, 215.91 mg/L, 33.9 mg/L, 0.5 mol/L and 72 min, under which, the estimated formaldehyde removal efficiency was 73.8%. This value was very close to the experimentally derived removal of 75% obtained under the optimum condition.
On the basis of the optimized Fenton conditions, the effect of UV alone on formaldehyde removal during the photo-Fenton process was assessed at 215.91 mg/L of formaldehyde; various pH (3–11) and at four contact times (15 min, 30 min, 60 min and 90 min). As shown in
Table 5. the highest removal efficiency was 14.3% at pH 5 and a contact time of 90 min. Regarding the fact that the optimum contact time was achieved in 72 min for the Fenton process, in order to investigate the possibility of this 18-min difference in time, the removal efficiency was evaluated at pH 5 in 15 min, 30 min, 60 min and 80 min. As shown in
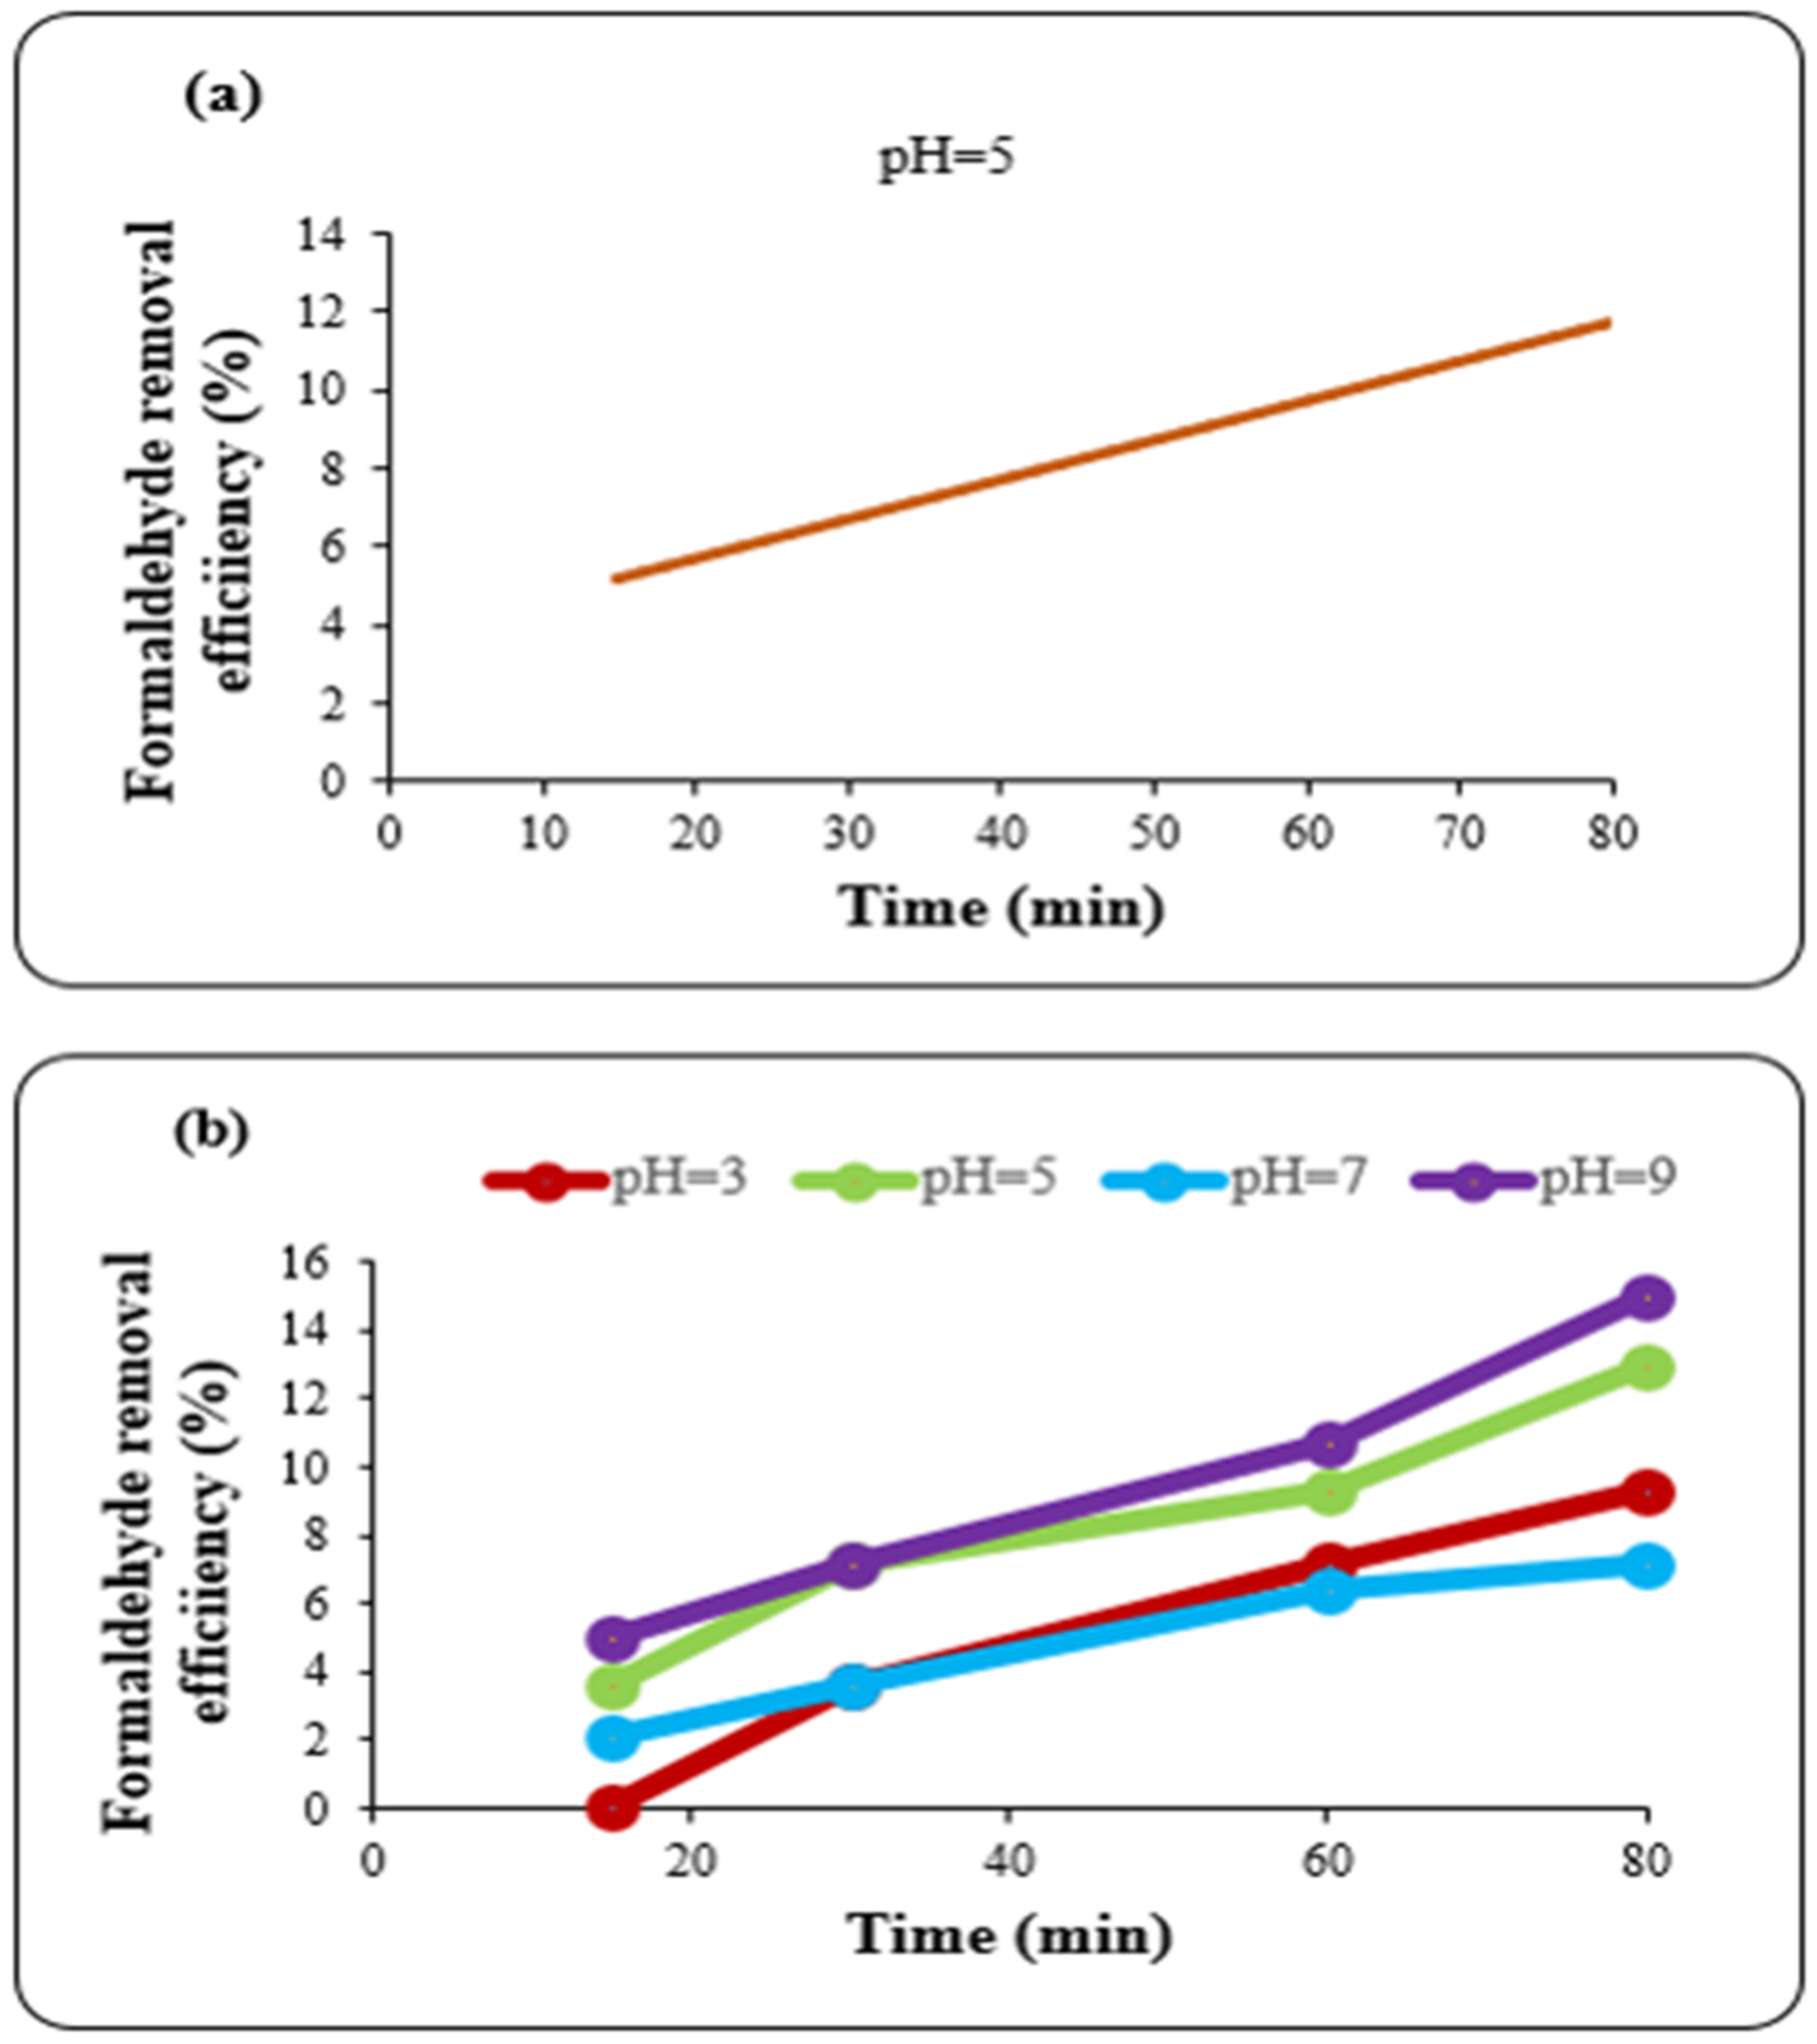
Figure 1a, the experimental results for the formaldehyde elimination efficiency were 5.0%, 7.1%, 9.3% and 12.0%, respectively. Thus, the optimized conditions were selected as pH 5 and a contact time of 80 min, based on the formaldehyde treatment efficiency.
During the ozonation/Fenton treatment, the influence of ozonation on formaldehyde removal from water was investigated under the previously optimized Fenton conditions for the Fe dosage; H
2O
2 concentration and initial concentration of formaldehyde at various contact times (15 min, 30 min, 60 min and 80 min) with different pH (3, 5, 7, 9 and 11). The results (
Figure 1b) showed that ozonation alone had the best efficiency of 15.0% removal at pH 9 and a contact time of 80 min.
Based on the chemical analysis, the formaldehyde concentration in real wastewater samples was 375 mg/L. Following wastewater treatment under the optimized Fenton, photo-Fenton and ozonation/Fenton processes, the formaldehyde removal was found to be 60%, 72% and 80%, respectively. The results therefore showed that the ozonation/Fenton process demonstrated the best performance in formaldehyde removal from real industrial wastewater.
3.3. Effects of Variables on Formaldehyde Removal
With respect to the obtained model, the mentioned intercept proportion (58.56%) that was gained for formaldehyde removal was not dependent on the independent factors or their quadratic and interaction terms. In the statistical analysis, the parameters E (H2O2 concentration) and B (contact time) were regarded as the most important factors, with coefficients of −7.97 and +7.92, respectively (Equation (7)). After these two parameters, the other significant parameters influencing the formaldehyde elimination in decreasing order were the quadratic contact time and quadratic H2O2 concentration, concentration of formaldehyde, quadratic Fe dosage, Fe dosage, solution pH, interaction between the contact time and H2O2 concentration, interaction between the formaldehyde concentration and H2O2 concentration, interaction between the formaldehyde concentration and pH and interaction between the Fe dosage and contact time.
3.3.1. Effects of H2O2 Concentration
As shown in Equation (7), there was an inverse relationship between the initial concentration of H
2O
2 (E) and removal efficiency (Y), with a coefficient of −7.97. When the concentration of H
2O
2 was increased from 0.36 to 0.74 mol/L, the formaldehyde removal efficiency decreased from 60.1% to 7.7%. This can be due to the fact that, in higher concentrations of H
2O
2, some oxidants with lower oxidation power can be generated [
31]. In addition, Evgenidou et al. [
32] reported that high concentrations of H
2O
2 demonstrated an inhibitory effect on degradation owing to its plausible scavenger function for free radicals. However, lower concentrations of H
2O
2 can result in a lower production of active radicals and, consequently, a slower rate of oxidation [
31]. It is worth highlighting that, in agreement with the obtained results, there have been many studies in which the effect of H
2O
2 on the degradation of pollutants followed the same pattern [
33,
34]. Similarly, it has been reported that there is a strong dependence between H
2O
2 and ferrous ions during pollutant degradation [
35].
3.3.2. Effects of Contact Time
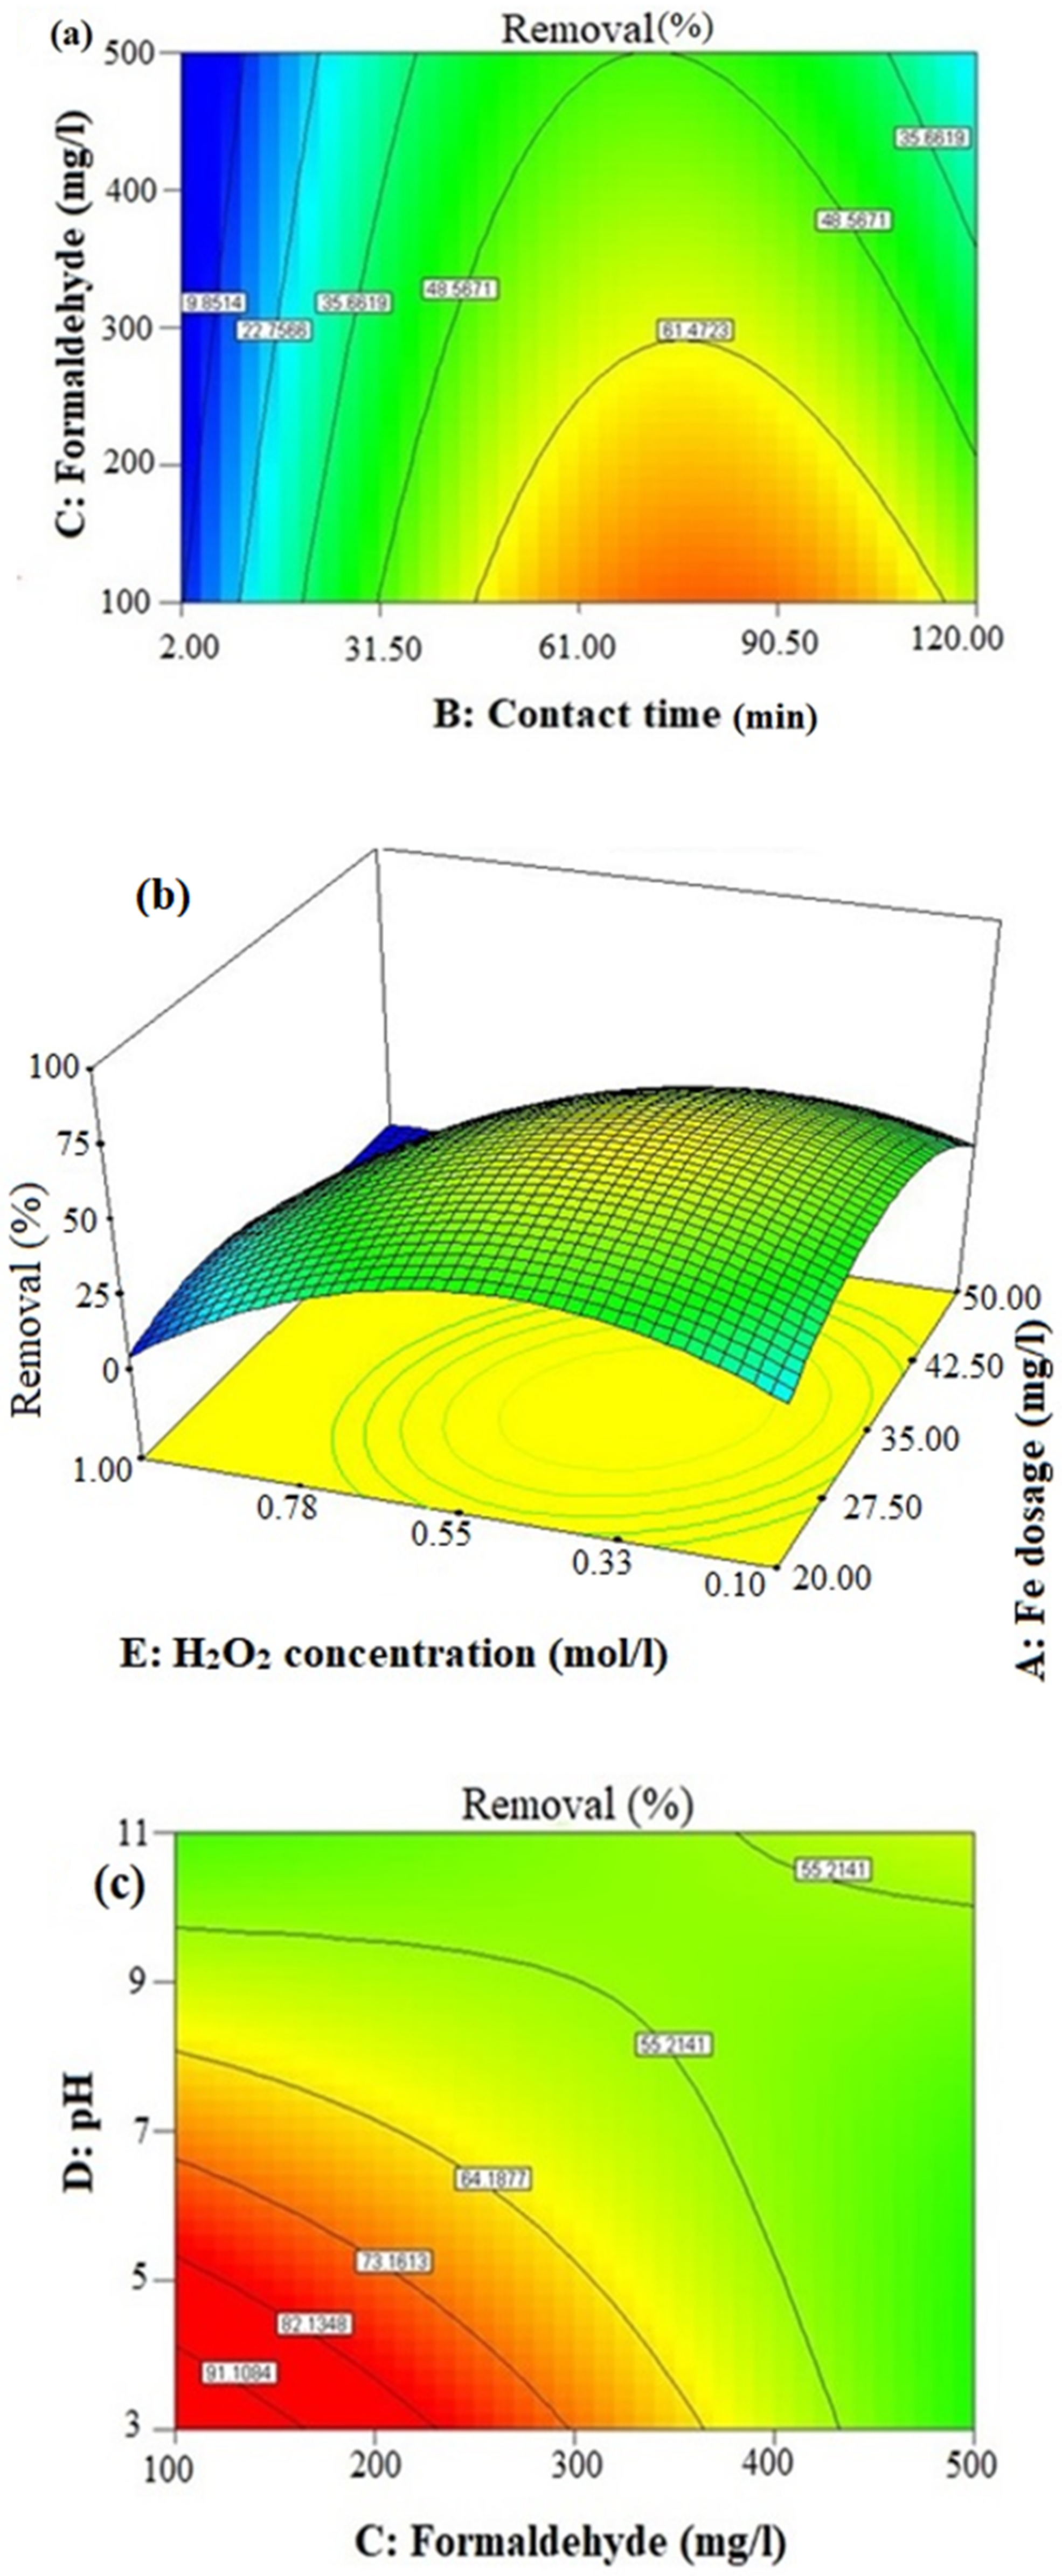
According to Equation (7) and
Figure 2a, the higher the contact time, the greater the removal efficiency of formaldehyde was obtained after 120 min. The results can be due to the fact that the production of active species from H
2O
2 decomposition increased with the contact time, increasing the interactions between the pollutant molecules with active species occurring. Based on the results and cost implications, a contact time of 72 min was chosen as the optimum. Similarly, an experimental duration of 60 min was proposed for formaldehyde decomposition in other studies [
35,
36]. In contrast to other AOPs, the production of radicals in the Fenton process occurs with high concentrations during the first few minutes; hence, a duration of 72 min is appropriate for both radical production and cost minimization [
37].
3.3.3. Effects of Initial Formaldehyde Concentration
With respect to the stoichiometric aspect for decomposition, it is of great significance to consider the ratio of oxidant to contaminant in order to ensure sufficient active species for formaldehyde. As the formaldehyde concentration may affect the Fenton process efficiency, it was examined in a range from 100 to 500 mg/L. As shown in
Figure 2a and Equation (7), there was an inverse linear relationship between the initial formaldehyde concentration (C) and formaldehyde elimination efficiency (Y). This relationship is likely due to the number of active species, particularly hydroxyl radicals per formaldehyde molecule, which become smaller with the increasing formaldehyde concentration. This also explains the negative relationship between formaldehyde and H
2O
2 concentrations [
38].
3.3.4. Effects of Fe Dosage
According to
Figure 2b, the efficiency of the Fenton process in formaldehyde removal increased with the Fe concentrations (up to 35 mg/L), then decreased with a further increase to 50 mg/L of Fe. Regarding the other performed studies, Fe, especially its ferrous form, is so important for the adequate production of hydroxyl radicals, suggesting a direct relationship between the Fe dosage and production of hydroxyl radicals. Similarly, these explanations can justify the interactive positive effects of the Fe dosage and contact time [
39,
40]. In another study by Kitis and Kapalan [
41], the inhibitory function of higher Fe concentrations to generate free radicals was demonstrated; therefore, its downward trend may also result from a scavenger function of Fe for the formation of free radicals. The results in another study demonstrated that the effect of zero-valent iron on dye removal by the Fenton process was not significant, which can be explained by the different interactions among Fe and other active species under different conditions [
41,
42].
3.3.5. Effects of pH
The solution pH is regarded as one of the most important factors affecting the Fenton process efficiency. As shown in
Figure 2c, there was an inverse relationship between the pH and formaldehyde removal in the Fenton process, due to the reaction of
∙OH with Fe and precipitation of iron in alkaline conditions [
43]. Another reason for this may be attributed to the hydrolysis of hydrogen peroxide into H
2O and O
2 at an alkaline pH. Moreover, the formation of carbonates produced in alkaline pH may be another plausible reason, which can deactivate the hydroxyl radicals [
44].
3.3.6. Effects of UV
As demonstrated in
Figure 1a, the UV alone can eliminate formaldehyde from water up to 12% in 80 min. UV is able to photolyze both Fe(III)-peroxo complexes and ferric ions to ferrous ions (Fe
2+), which are more effective than Fe
3+ for hydroxyl radical generation, and directly produce hydroxyl radicals from the mentioned compound. Therefore, UV can increase the production of active species and, consequently, formaldehyde oxidation. Equations (8)–(10) show the related reactions for the formation of free radicals [
17,
45,
46,
47]:
3.3.7. Effects of pH on Formaldehyde Removal in Ozonation Process
According to
Figure 1b, there is a direct relationship between the formaldehyde removal efficiency and pH value. As ozone reacts with pollutants in two ways, including direct oxidation occurring in acidic conditions and indirect oxidation at which hydroxyl radicals generated from ozone hydrolysis oxidize the pollutant. Ozone hydrolysis is completely dependent upon the pH, and there is a direct relationship between these two parameters. Ozone can be easily hydrolyzed in alkaline conditions, because hydroxyl ions, being primers of hydroxyl radical formation and ozone hydrolysis reactions, are abundant in alkaline conditions. The generation of hydroxyl radicals from ozone is carried out as shown in Equations (11) and (12) [
48]:
Therefore, from the above discussion and higher oxidation potential of hydroxyl radicals than ozone, the better efficiency of the ozonation process in formaldehyde removal can be justified in agreement with other studies [
16].
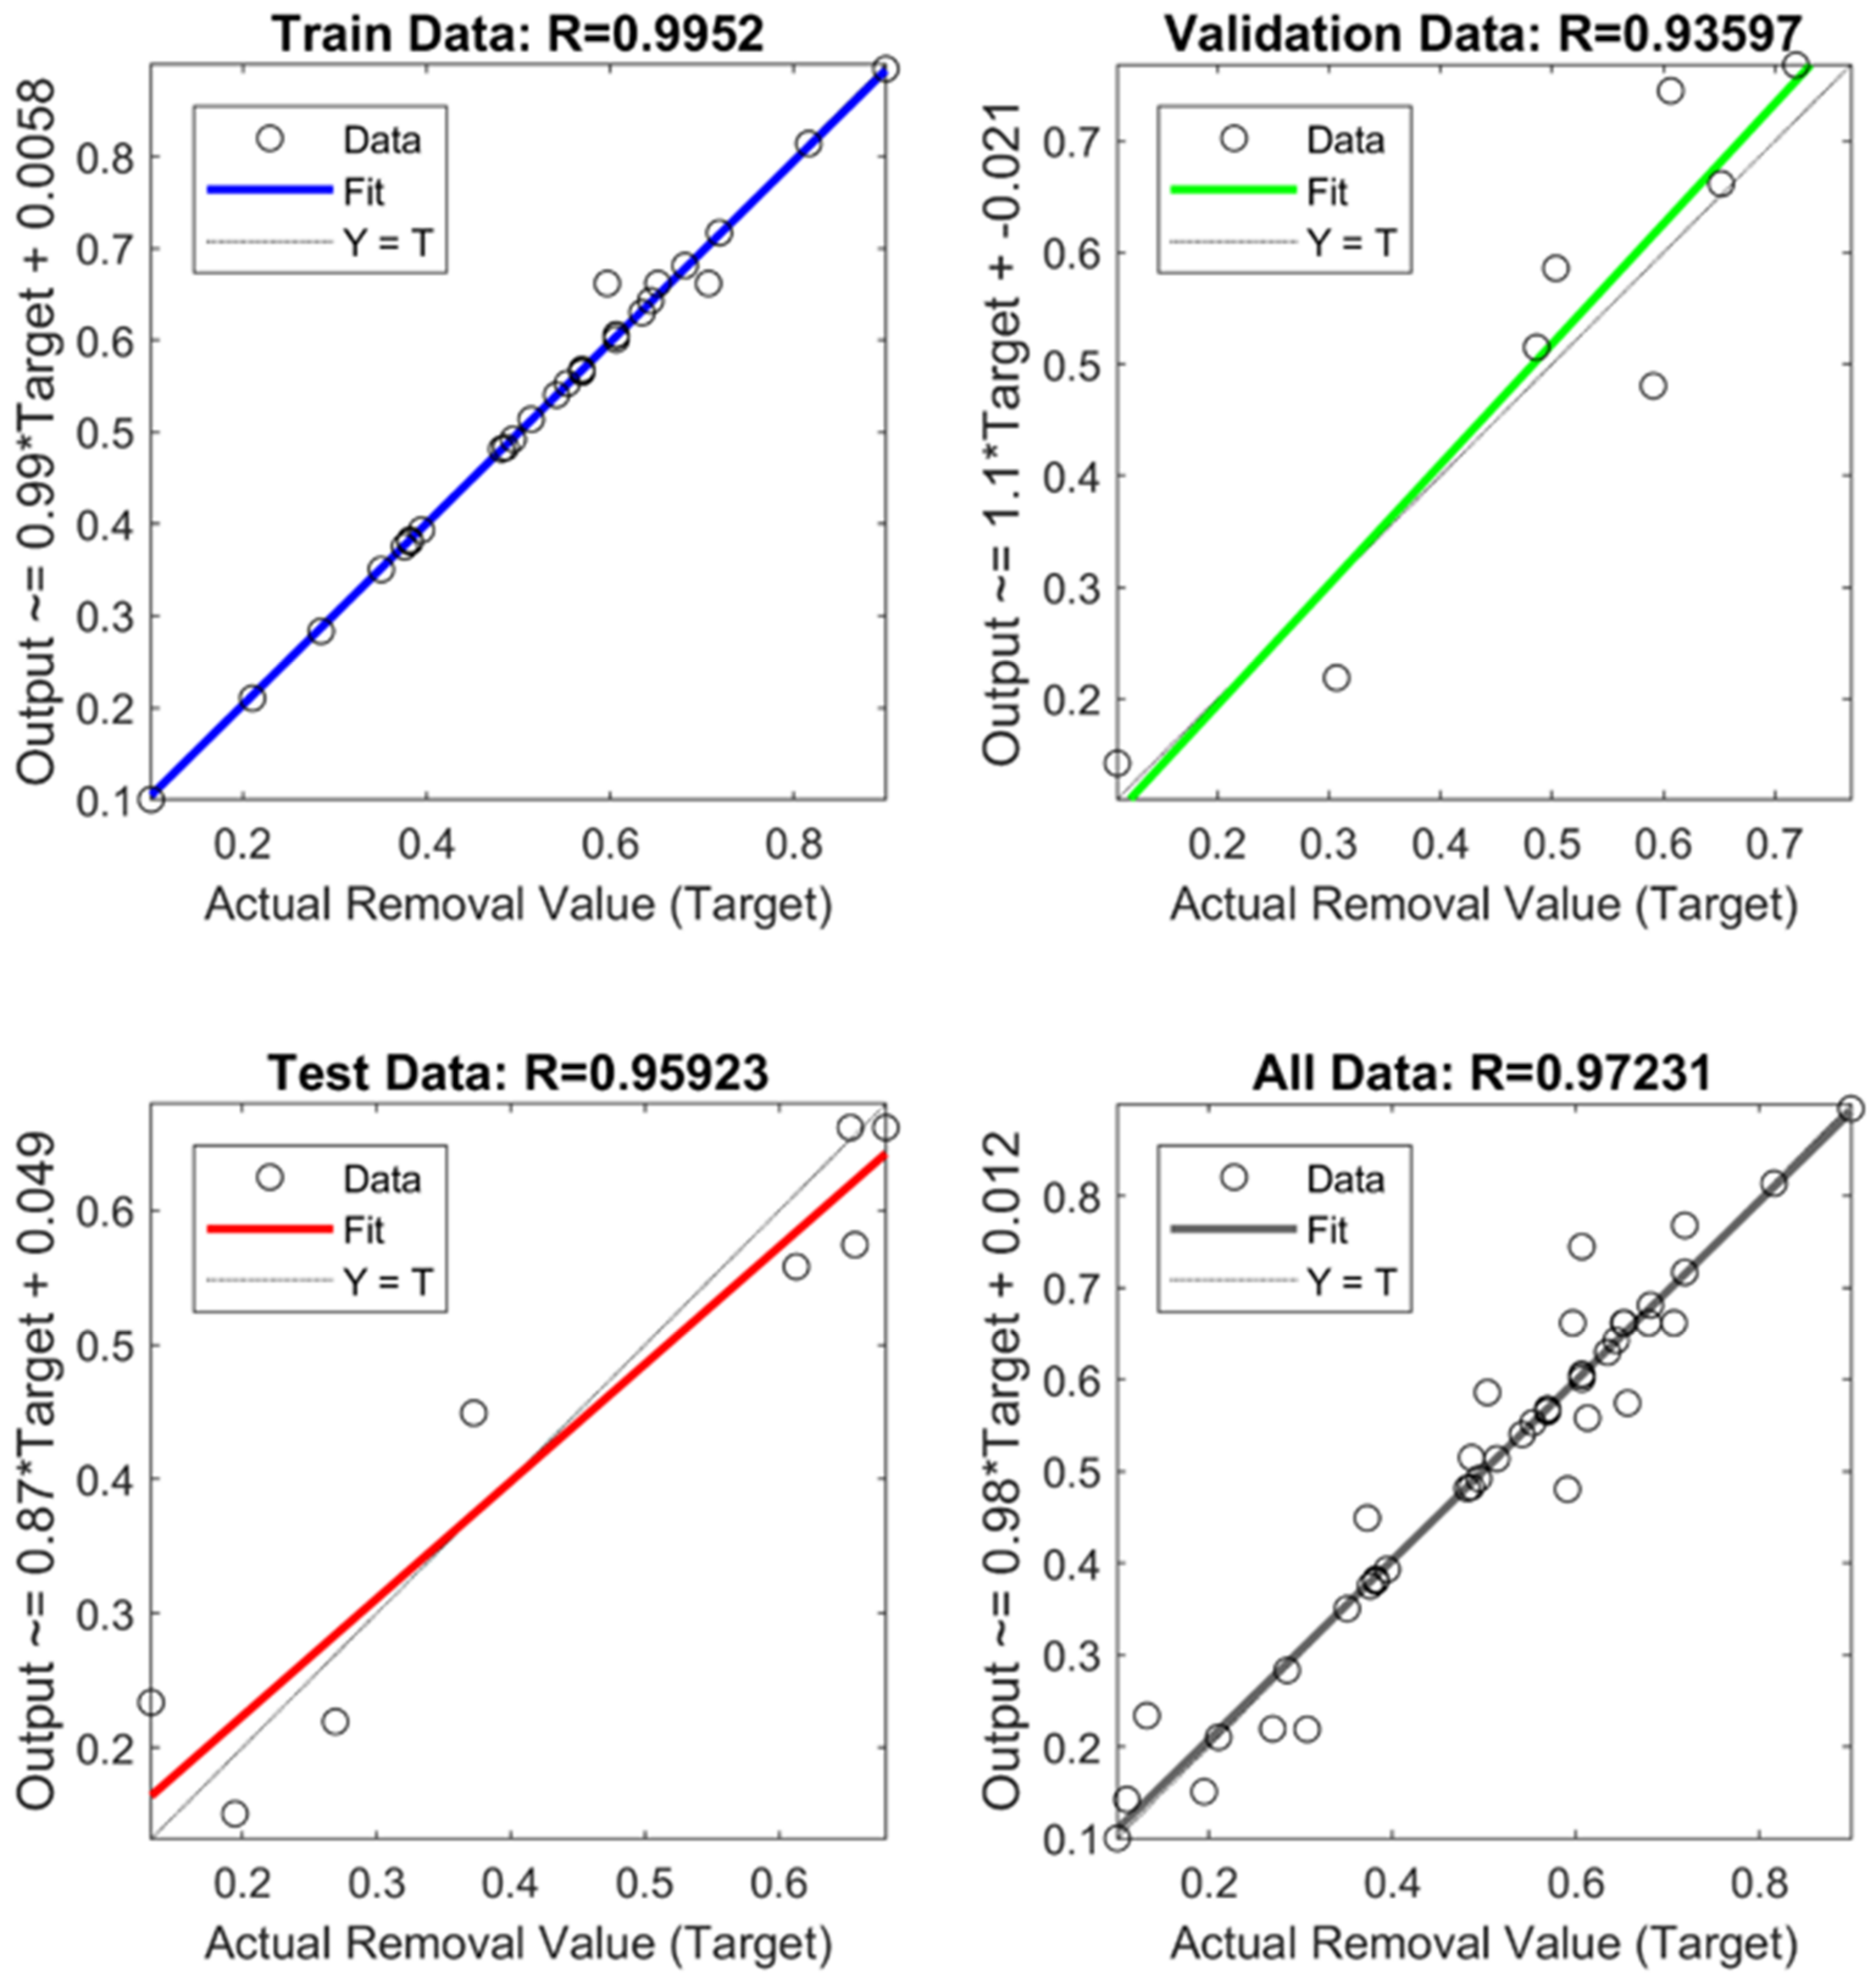
3.4. Artificial Neural Network
According to the results for the Fenton process, a model with a topology of 5–7–1 was the best model. The prediction of the ANN model for formaldehyde removal efficiency by the Fenton process was obtained from Equation (13). The predicted proportions of the formaldehyde removal vs. the experimental ones are depicted by
Figure 3, showing the
R proportions of the developed models in the training (0.9952), validation (0.9359) and test (0.9592) phases.
where W1, W2, b
1 and b
2 are the connection weights of the output and hidden layers and the biases of the hidden and output layers, consecutively. The obtained connection weights are listed in
Table 6.
The best linear fit together with the
R2 of the constructed model is presented in Equations (14) and (15):
where x and y are the actual and predicted values of the formaldehyde removal.
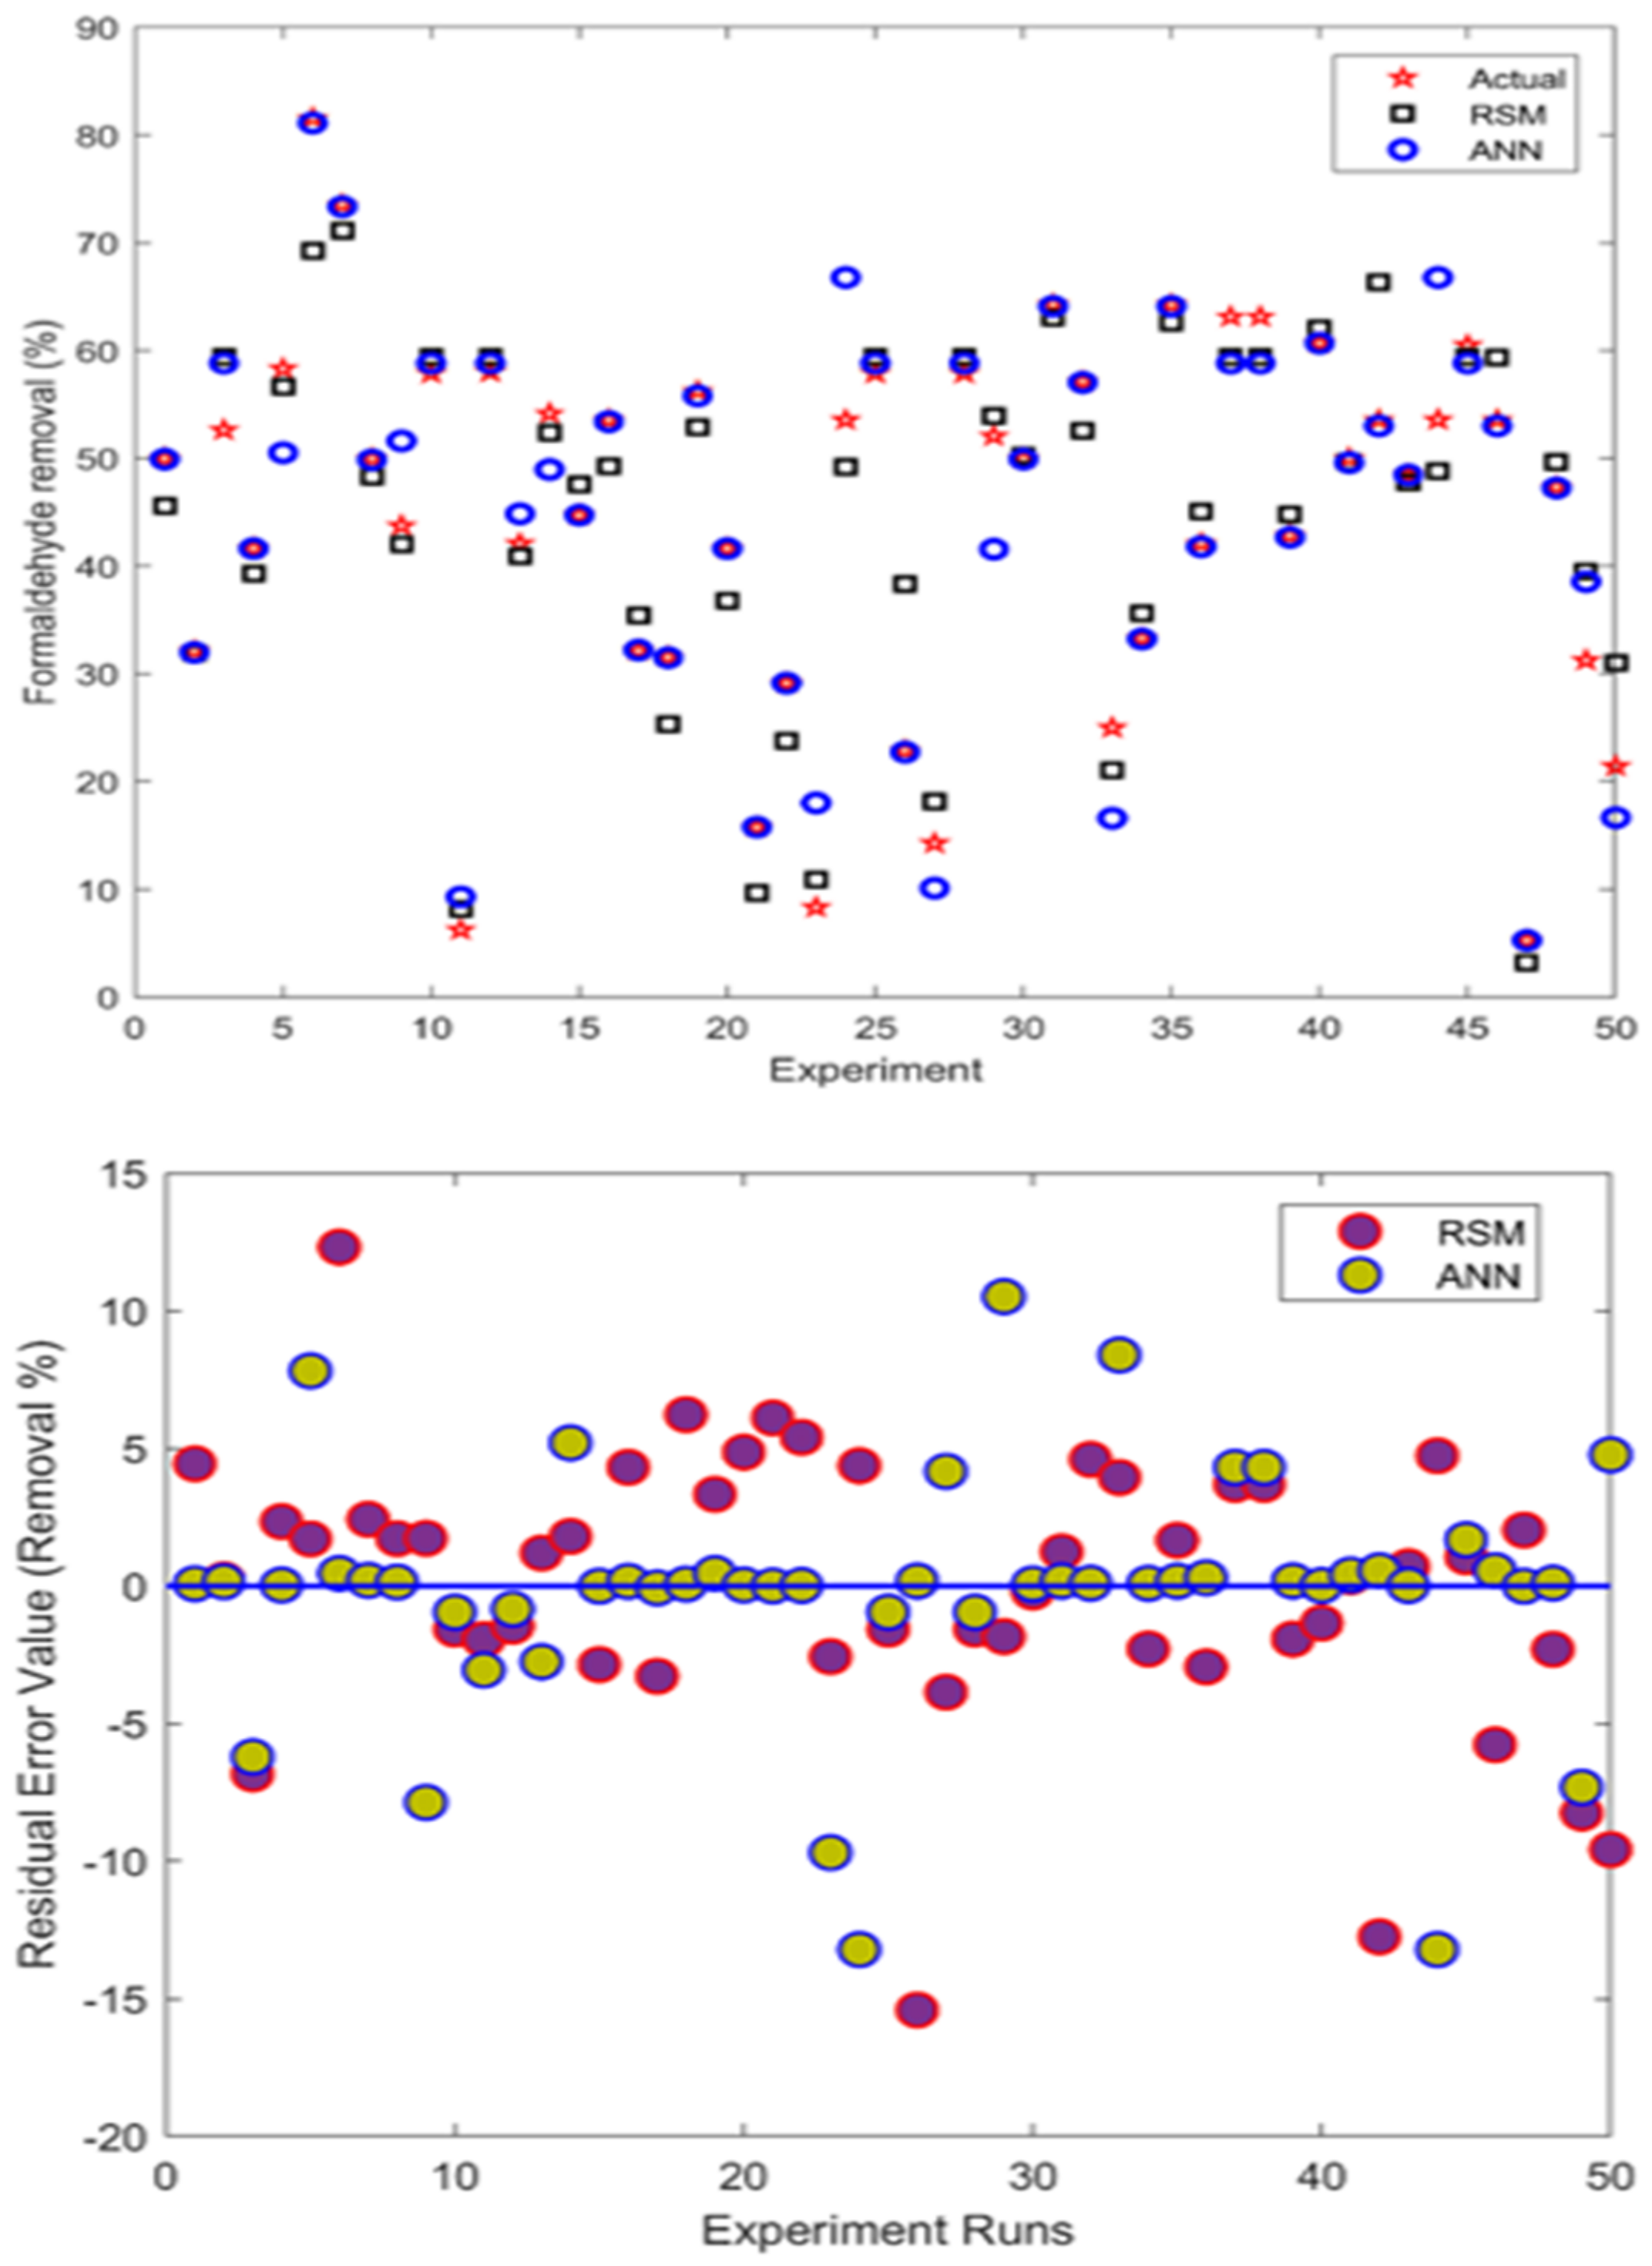
Figure 4 depicts the residual errors distribution and the predicted proportions of the response variable by the developed RSM and ANN models. The results showed that the prediction strength of the ANN model was better than the RSM model.
3.5. Comparison between the RSM and ANN Models
In order to compare the performances of these two models in the prediction of formaldehyde removal from water by the Fenton process, four statistical indexes, including the RMSE, SSE, R-squared and adj-
R2, were used. The RMSE and SSE showed the errors of the models’ predictions in two different ways, and the R-squared and adj-
R2 show the strengths and goodness of fit of the models in two different ways, which can be seen in detail in
Table 2. The obtained results for the mentioned indexes are presented in
Table 7. In addition, the predicted values of the response variables by the RSM and ANN models coupled with the actual ones are listed in
Table 3. According to the results for the statistical indices, the ANN model showed a higher
R2 (0.9454) and Adj-
R2 (0.9443) and a lower RMSE (4.03) and SSE (8.15) than those of the RSM model, with 0.9186, 0.9169, 4.882 and 11.91, respectively. Therefore, the ANN can predict the process efficiency slightly better than the RSM.
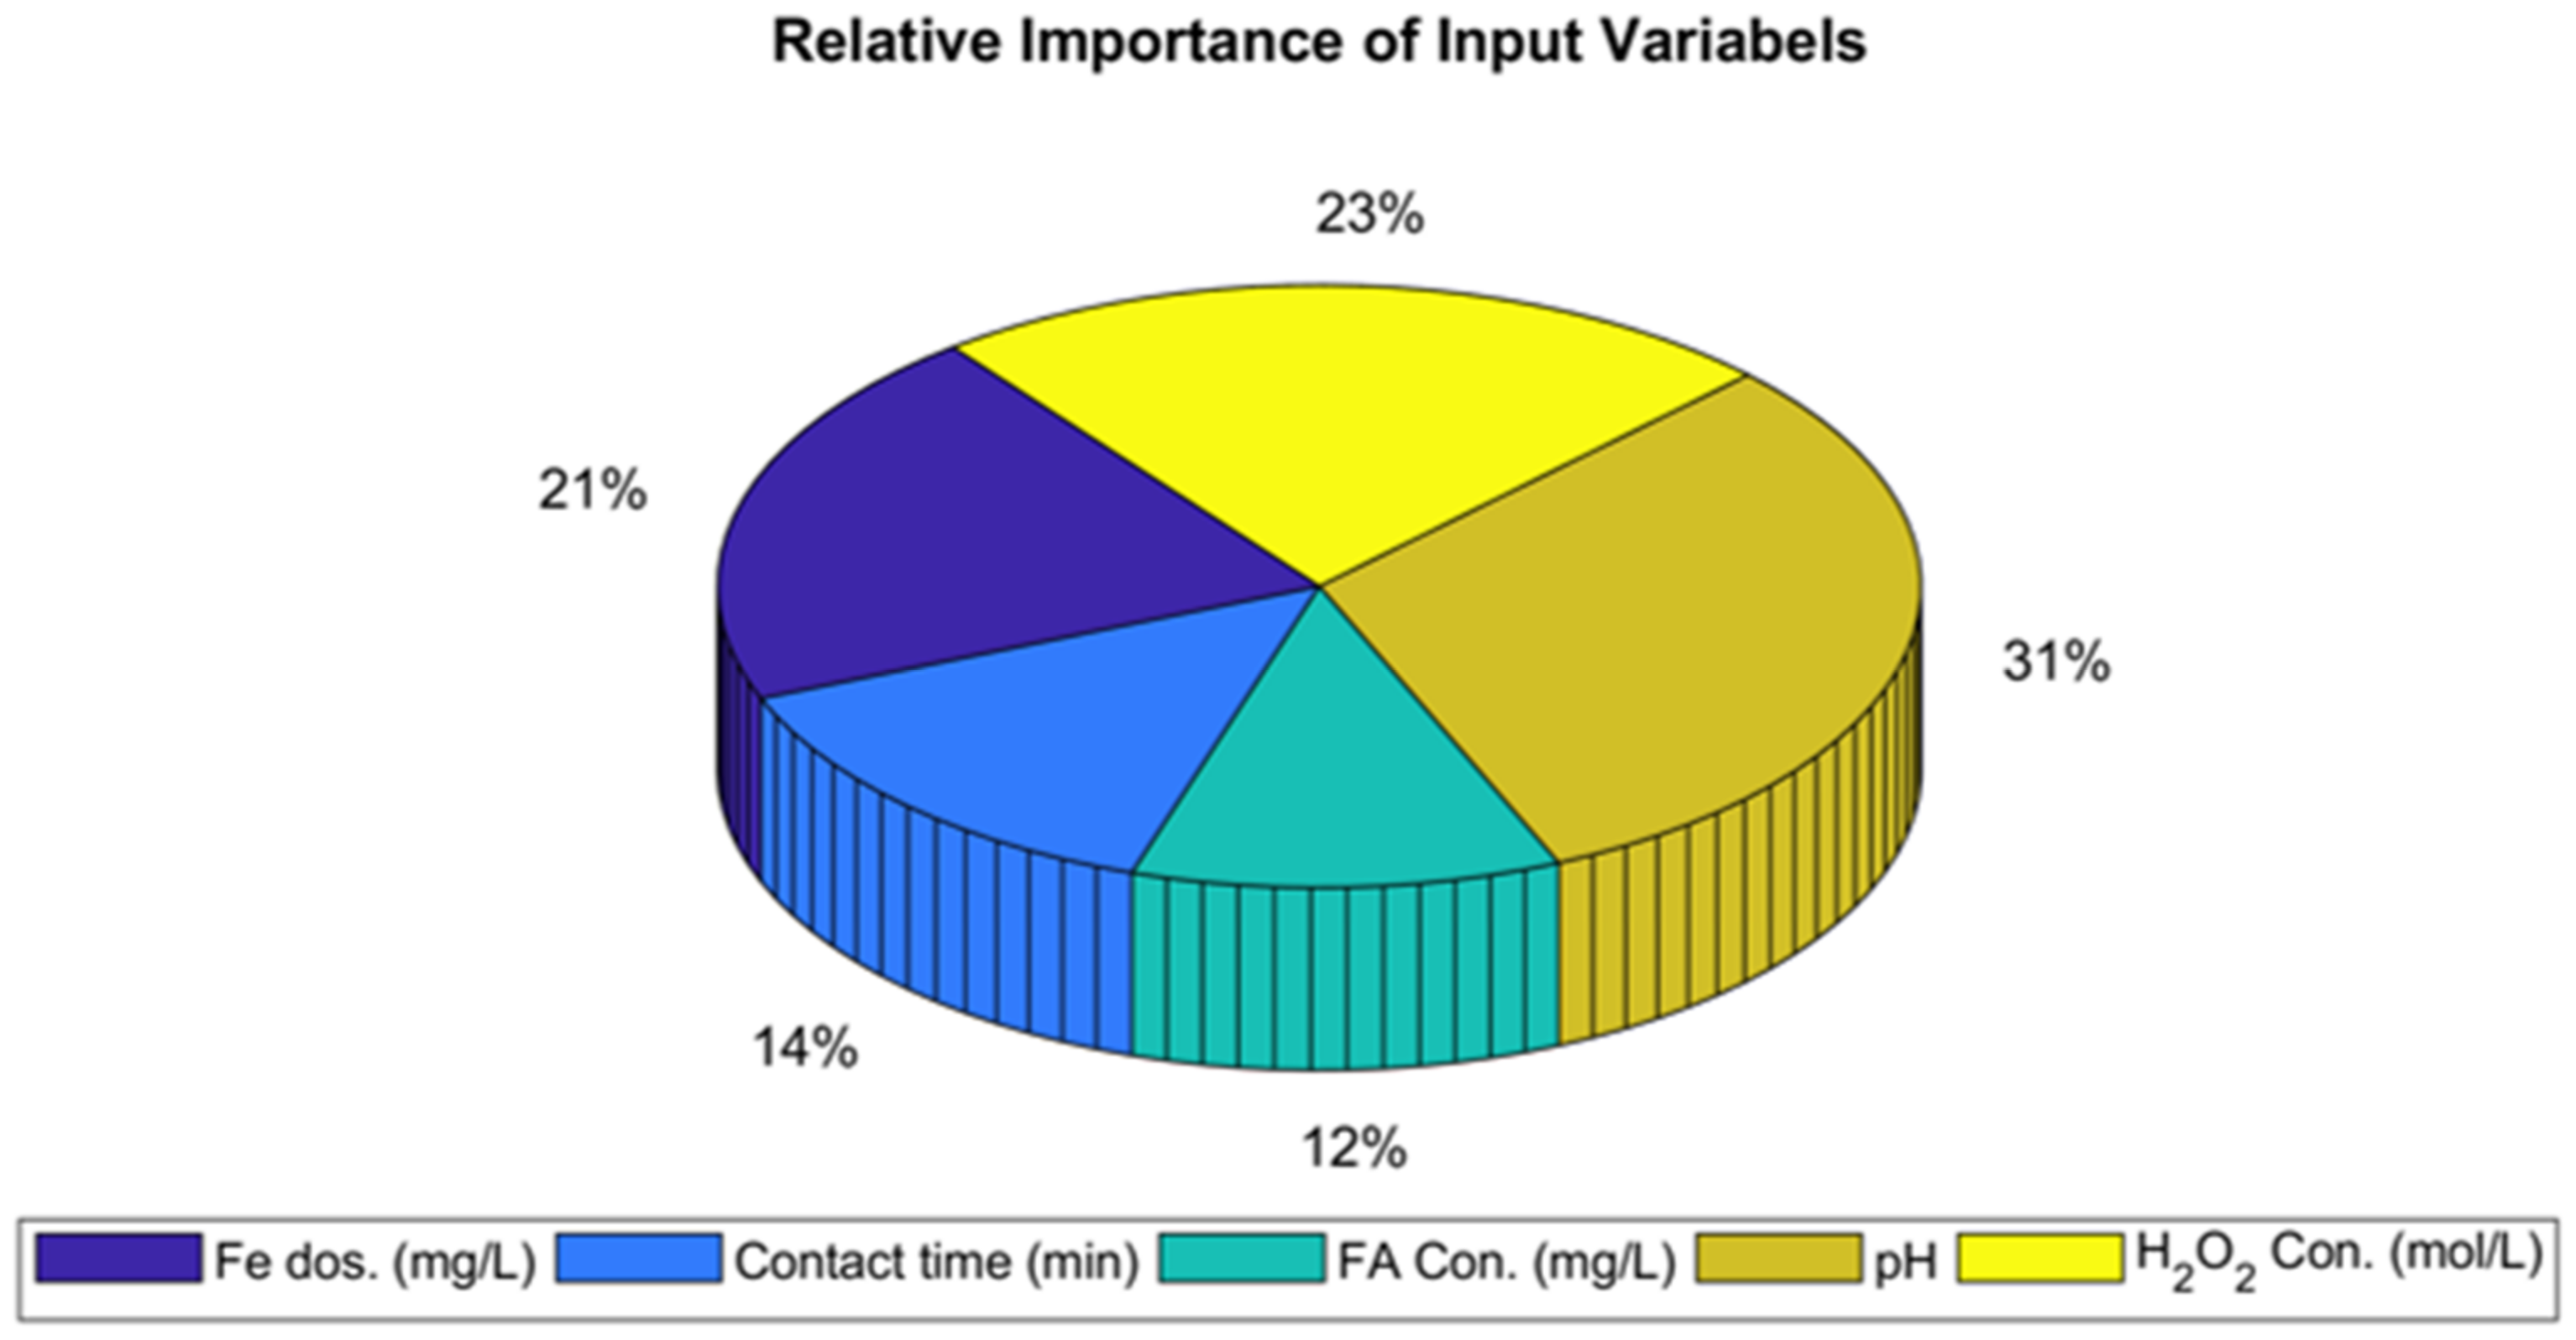
3.6. Sensitivity Analysis
The effective portions (%) of the dependent variables, including the Fe dosage, contact time, pH, H
2O
2 and initial concentration of formaldehyde in the Fenton process, were evaluated. The obtained connection weights for the built model presented in
Table 6 were applied by this method.
Figure 5 depicts the importance of the independent variables. As can be observed, the solution pH was ranked as the most critical factor with 31% importance, followed by the H
2O
2 concentration (23%), Fe dosage (21%), contact time (14%) and initial formaldehyde concentration (12%).
4. Conclusions
This study assessed and optimized the performances of the Fenton, photo-Fenton and ozonation/Fenton processes in formaldehyde removal from water and wastewater with respect to the effects of the pH, formaldehyde concentration, contact time, H2O2 concentration, Fe dosage and UV. The maximum formaldehyde removal efficiency of 73.8% was obtained during the Fenton process under the optimum conditions of a pH of 5.32, initial concentration of formaldehyde of 215.91 mg/L, Fe dosage of 33.9 mg/L, H2O2 concentration of 0.5 mol/L and contact time of 72 min. Regarding the effect of UV, the highest formaldehyde removal was 14.3% under a pH of 5 and contact time of 90 min. With respect to the ozonation, a formaldehyde removal of 15% was achieved under a pH of 9 and contact time of 60 min. Finally, the performances of the optimized Fenton, photo-Fenton and ozonation/Fenton processes in a real wastewater treatment containing 375-mg/L formaldehyde were 60.0%, 72.0% and 80.0%, correspondingly. Moreover, the comparison of the RSM and ANN models’ strengths in the prediction of the process efficiency for formaldehyde removal and the sensitivity analysis were accomplished. The sensitivity analysis showed that the most important factor affecting formaldehyde removal by the Fenton process was the pH, followed by the H2O2 concentration, Fe dosage, contact time and formaldehyde initial concentration in decreasing order. In addition, the combined ozonation/Fenton process was identified as the best one for a formaldehyde removal efficiency of 80.0% from real wastewater, followed by photo-Fenton (72.0%) and Fenton (60.0%). Therefore, the ozonation/Fenton process is recommended for industrial wastewater treatment in the removal of formaldehyde and similar carcinogenic compounds.


 ,
, 


