
Determining the Risk Level of Heavy Rain Damage by Region in South Korea


Abstract
:1. Introduction
2. Theoretical Background (Materials and Methodology)
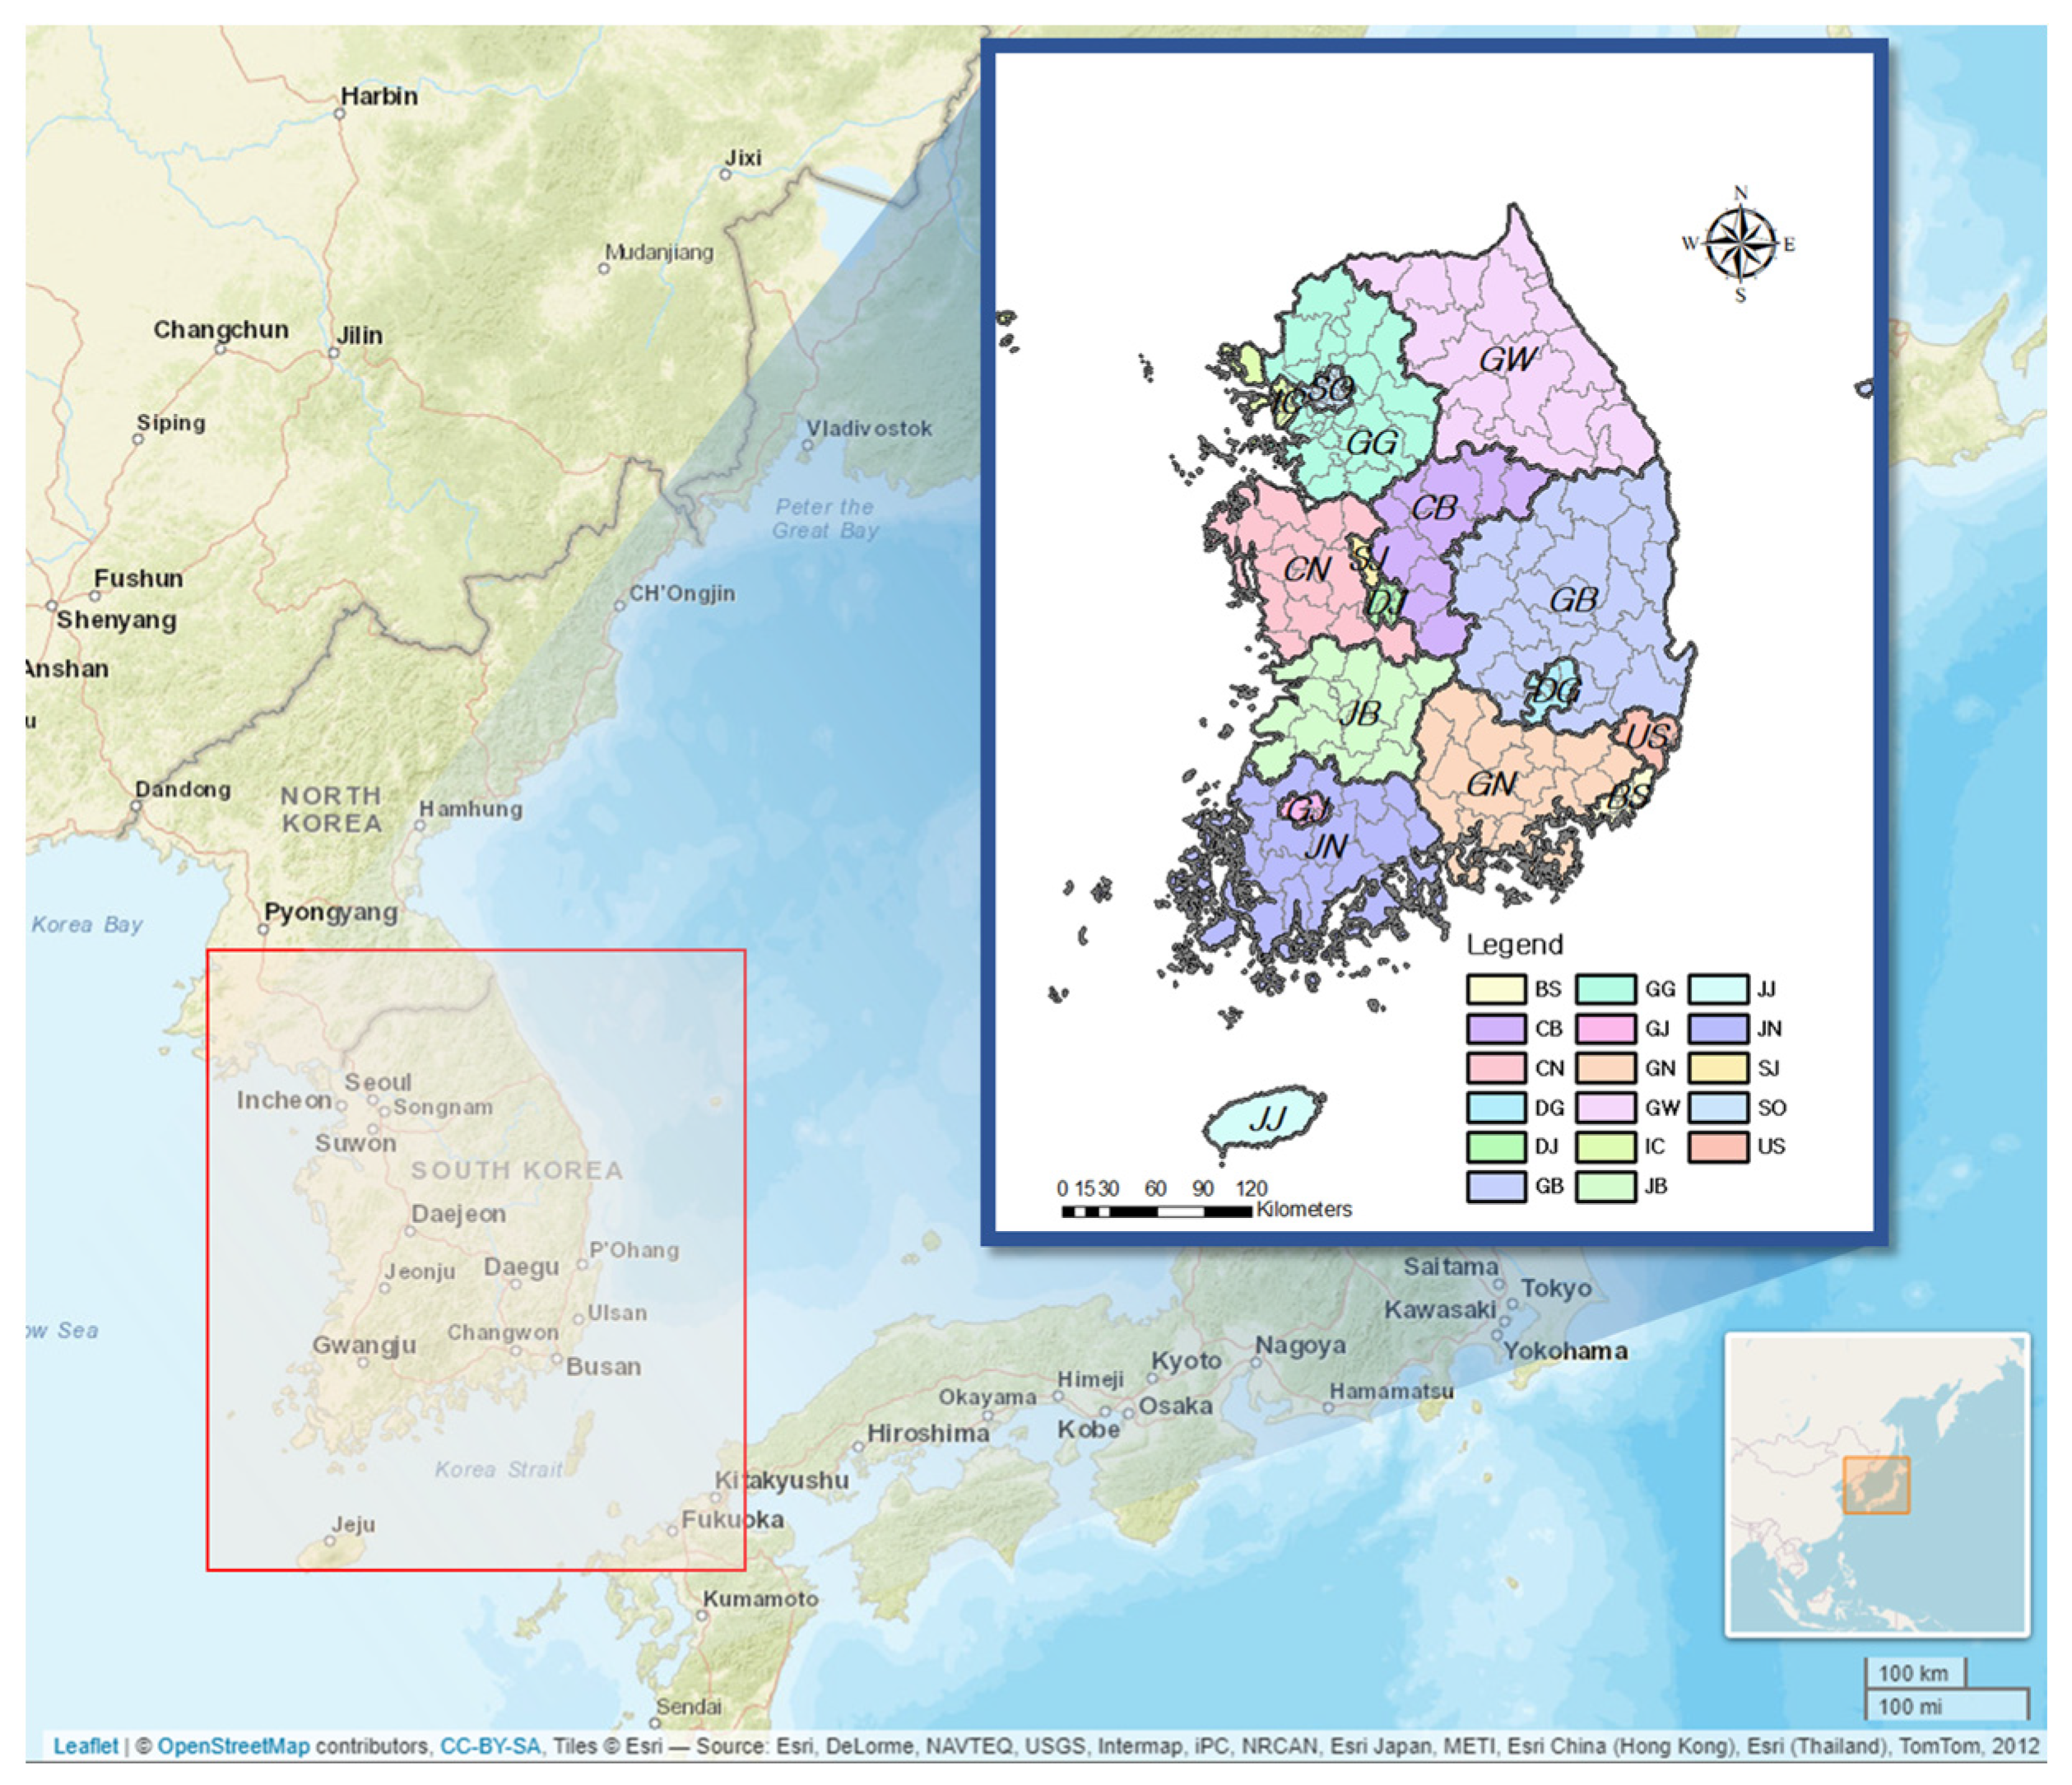
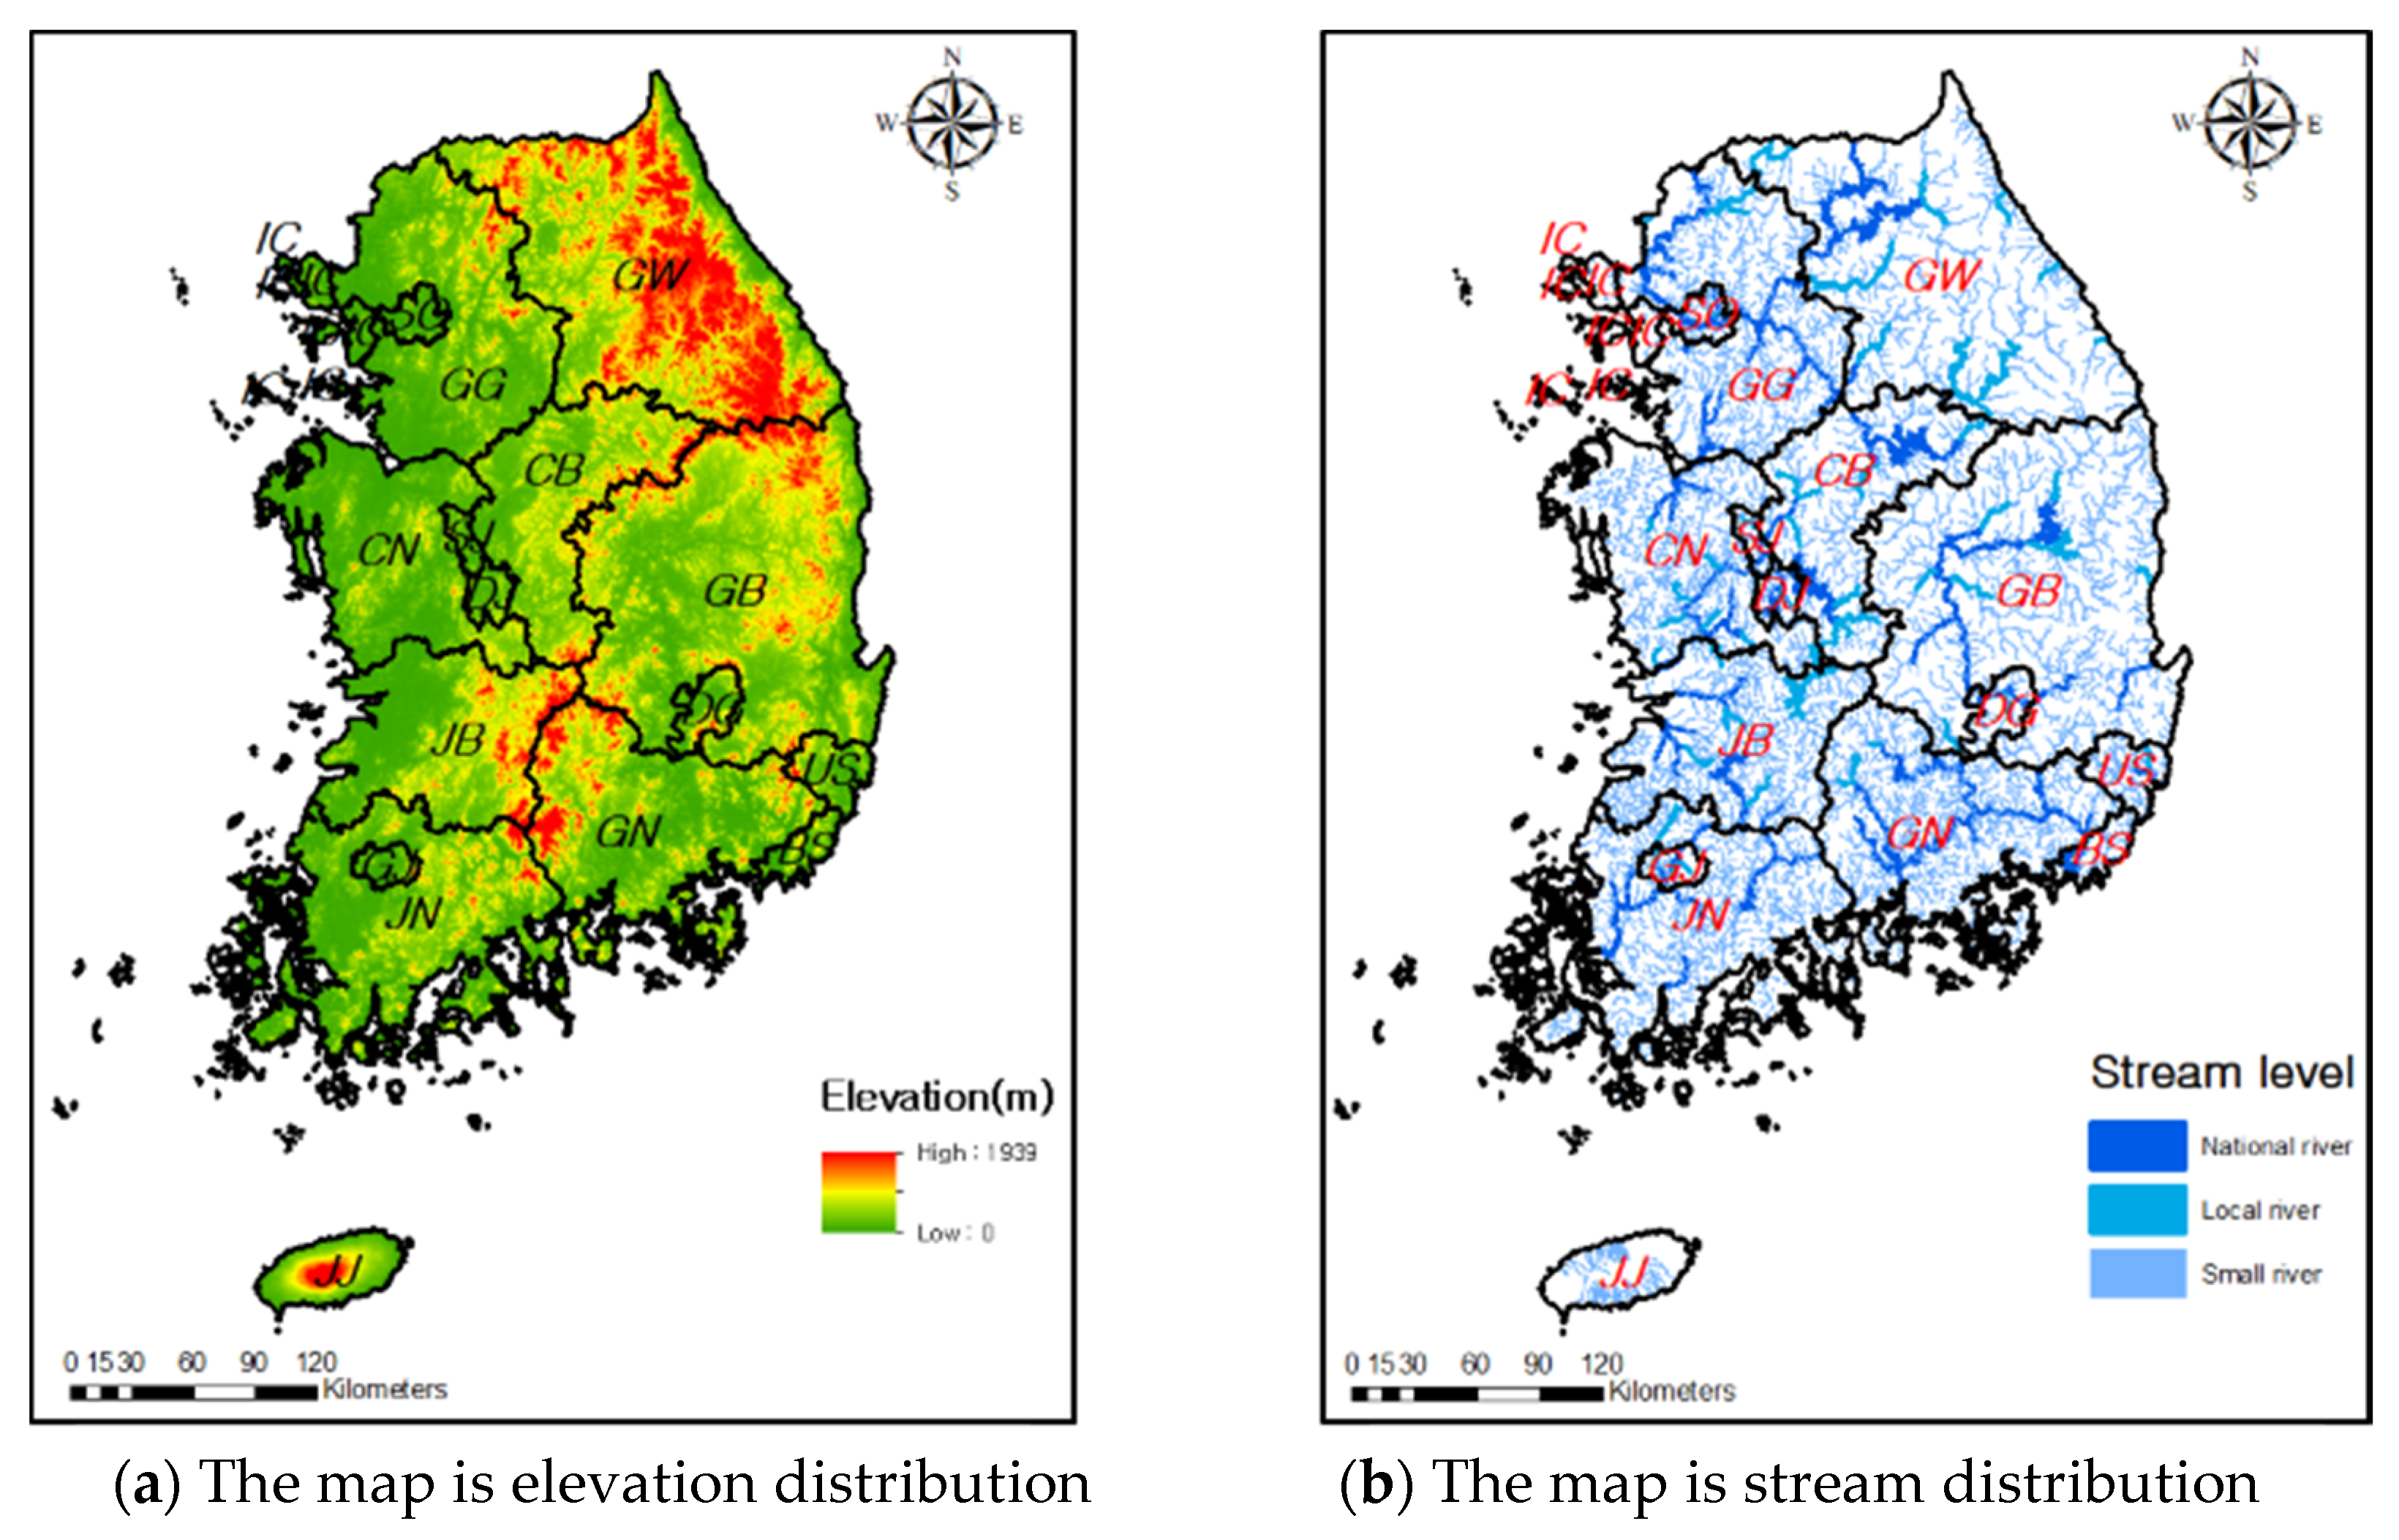
2.1. Characteristics of the Study Area
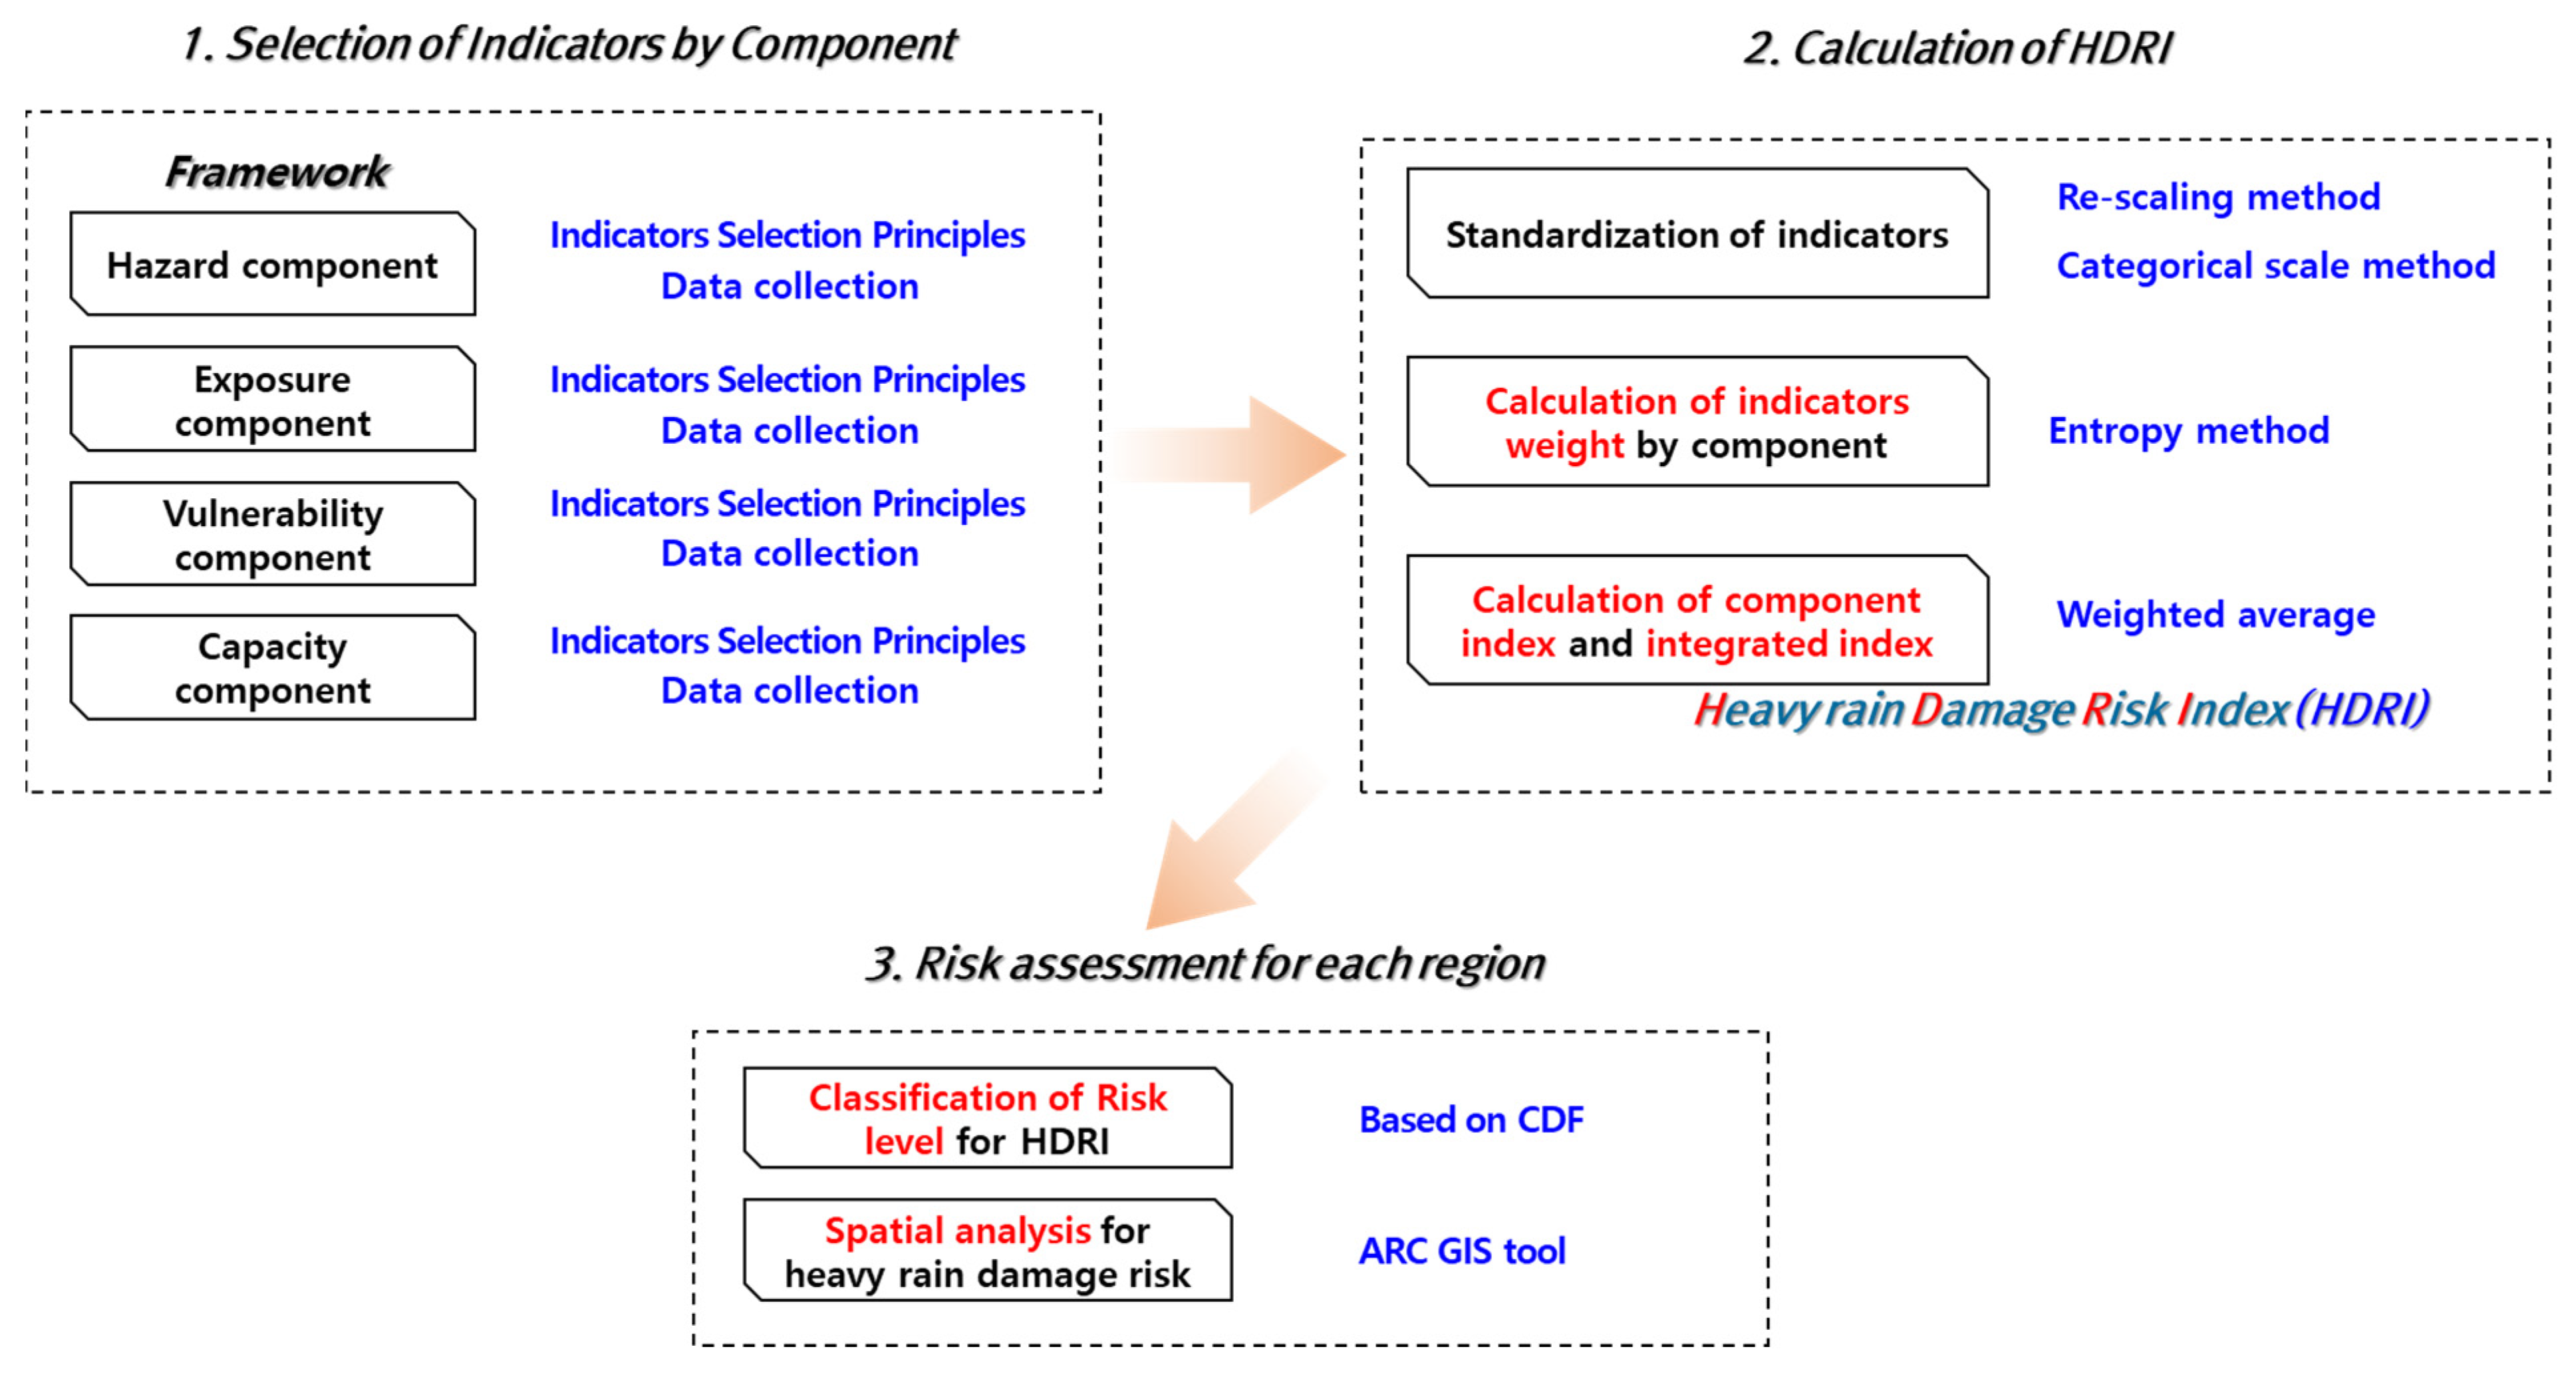
2.2. Qualitative Risk Assessment Method
2.2.1. Principle for Selecting Assessment Indicators
2.2.2. Standardization Method for Assessment Indicators
2.2.3. Method of Calculating Weights
2.3. Hierarchical Cluster Analysis
3. Result of Analysis
3.1. Risk Assessment of Heavy Rain Damage
3.1.1. Selection and Construction of Assessment Indicators
3.1.2. Standardization and Calculation of Weights of Assessment Indicators
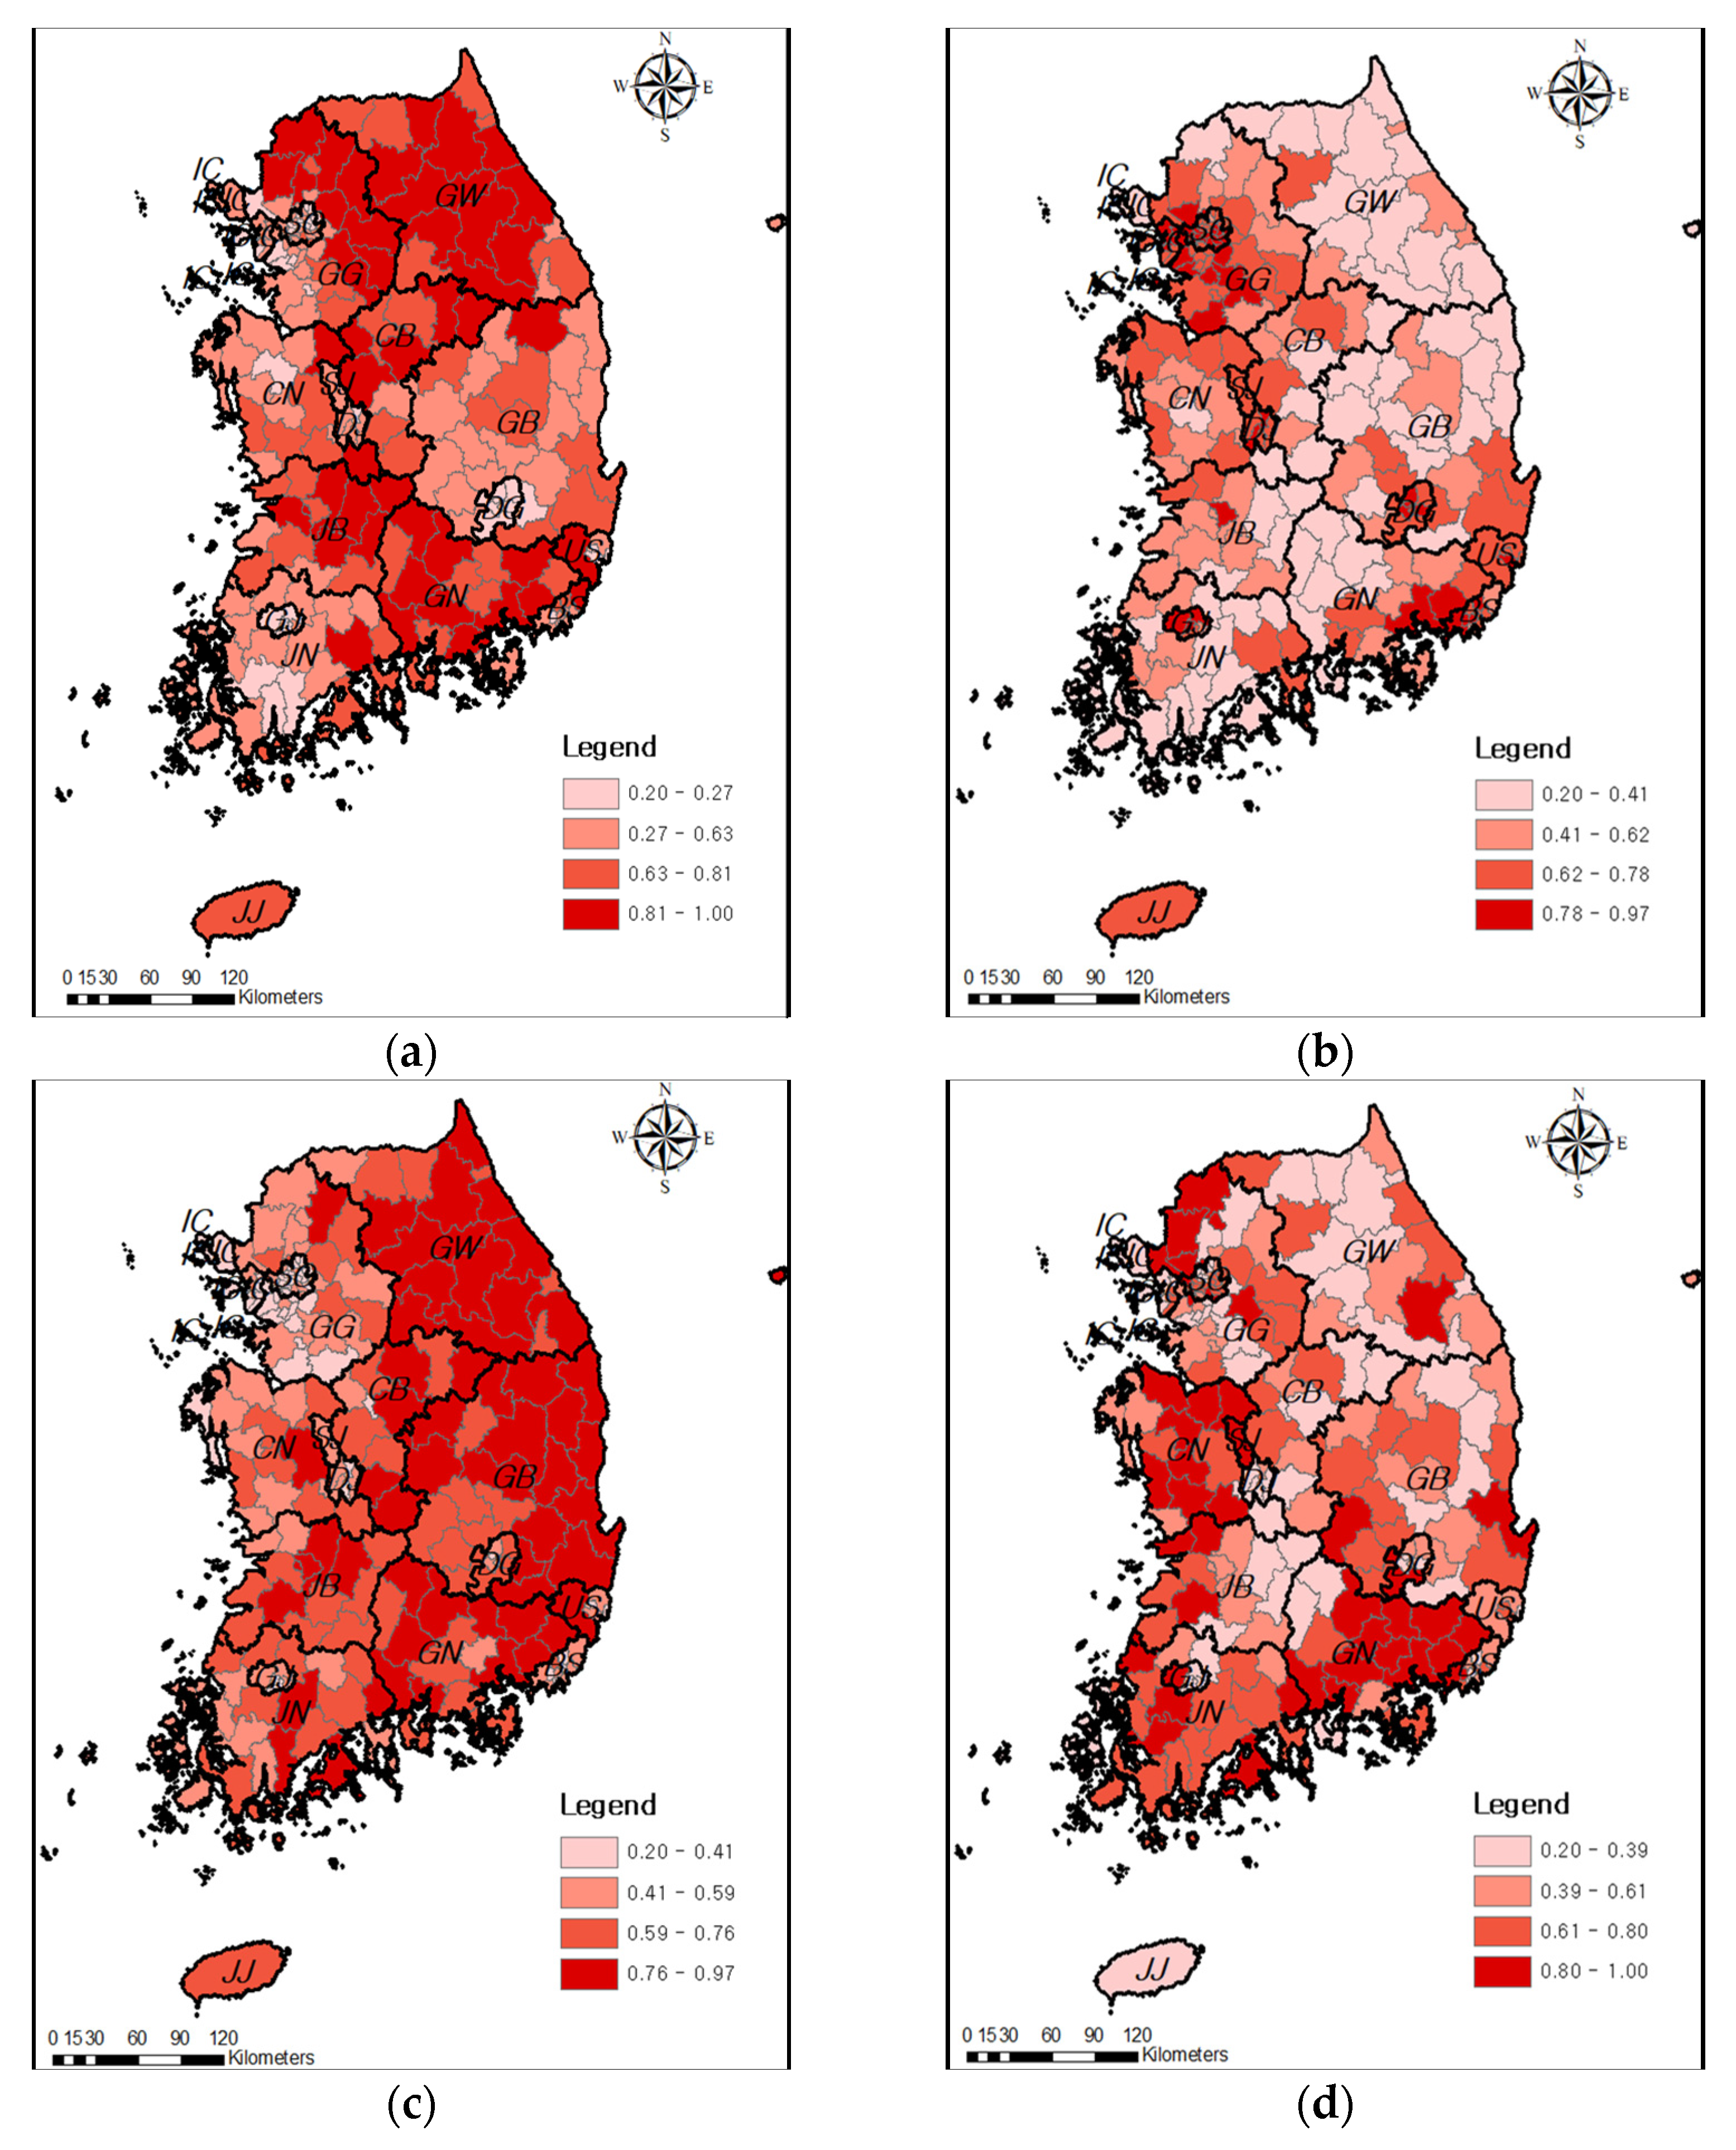
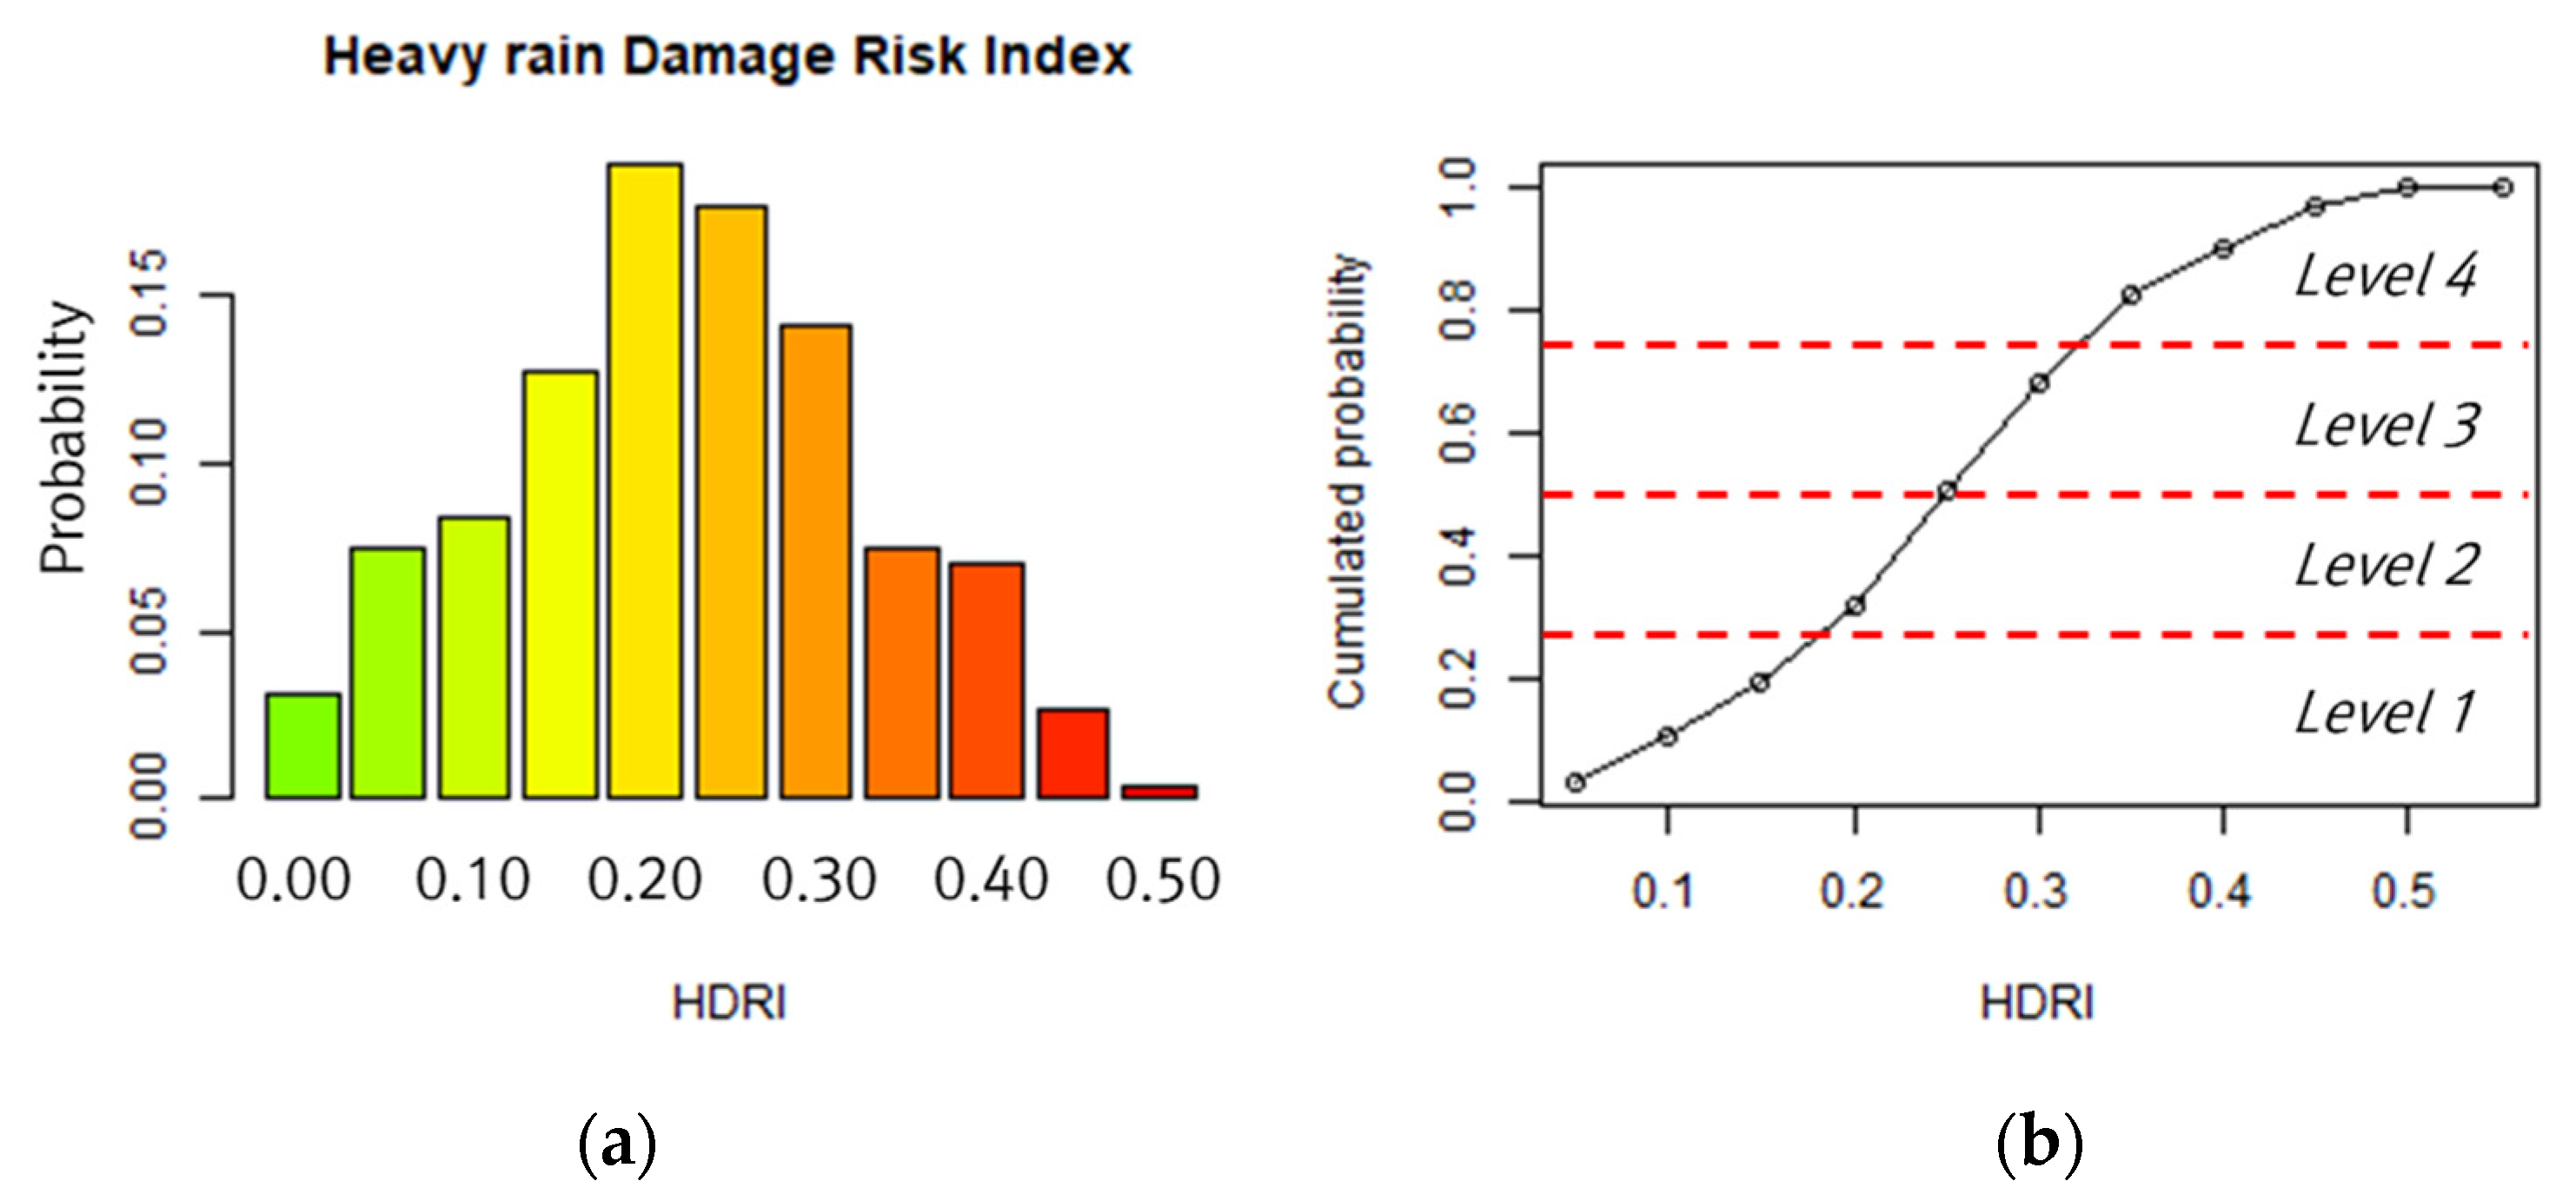
3.1.3. Definition of the Risk Level of Heavy Rain Damage by Region
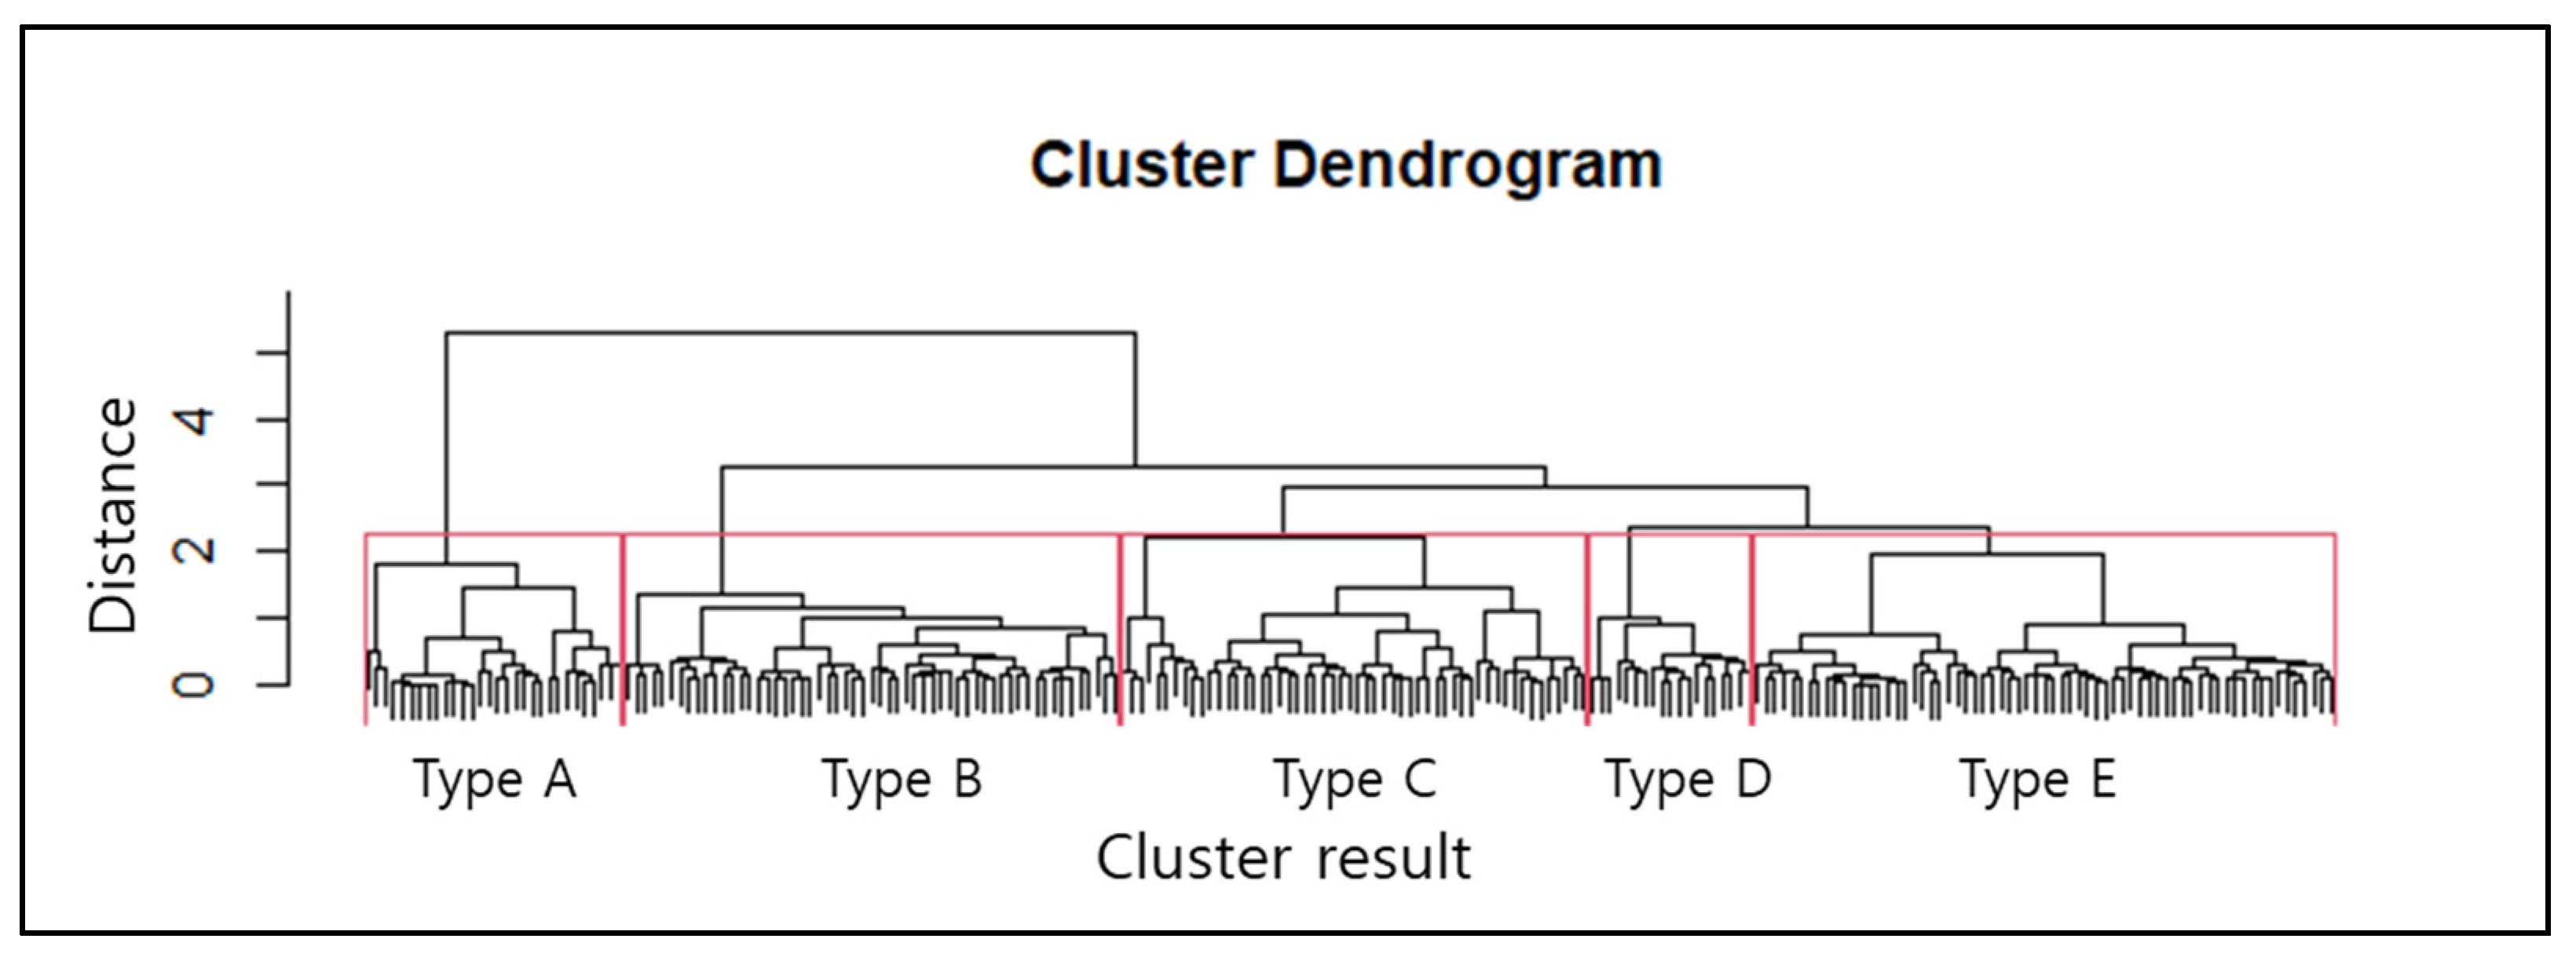
3.2. Classification of Heavy Rain Damage Types Based on Hierarchical Cluster Analysis
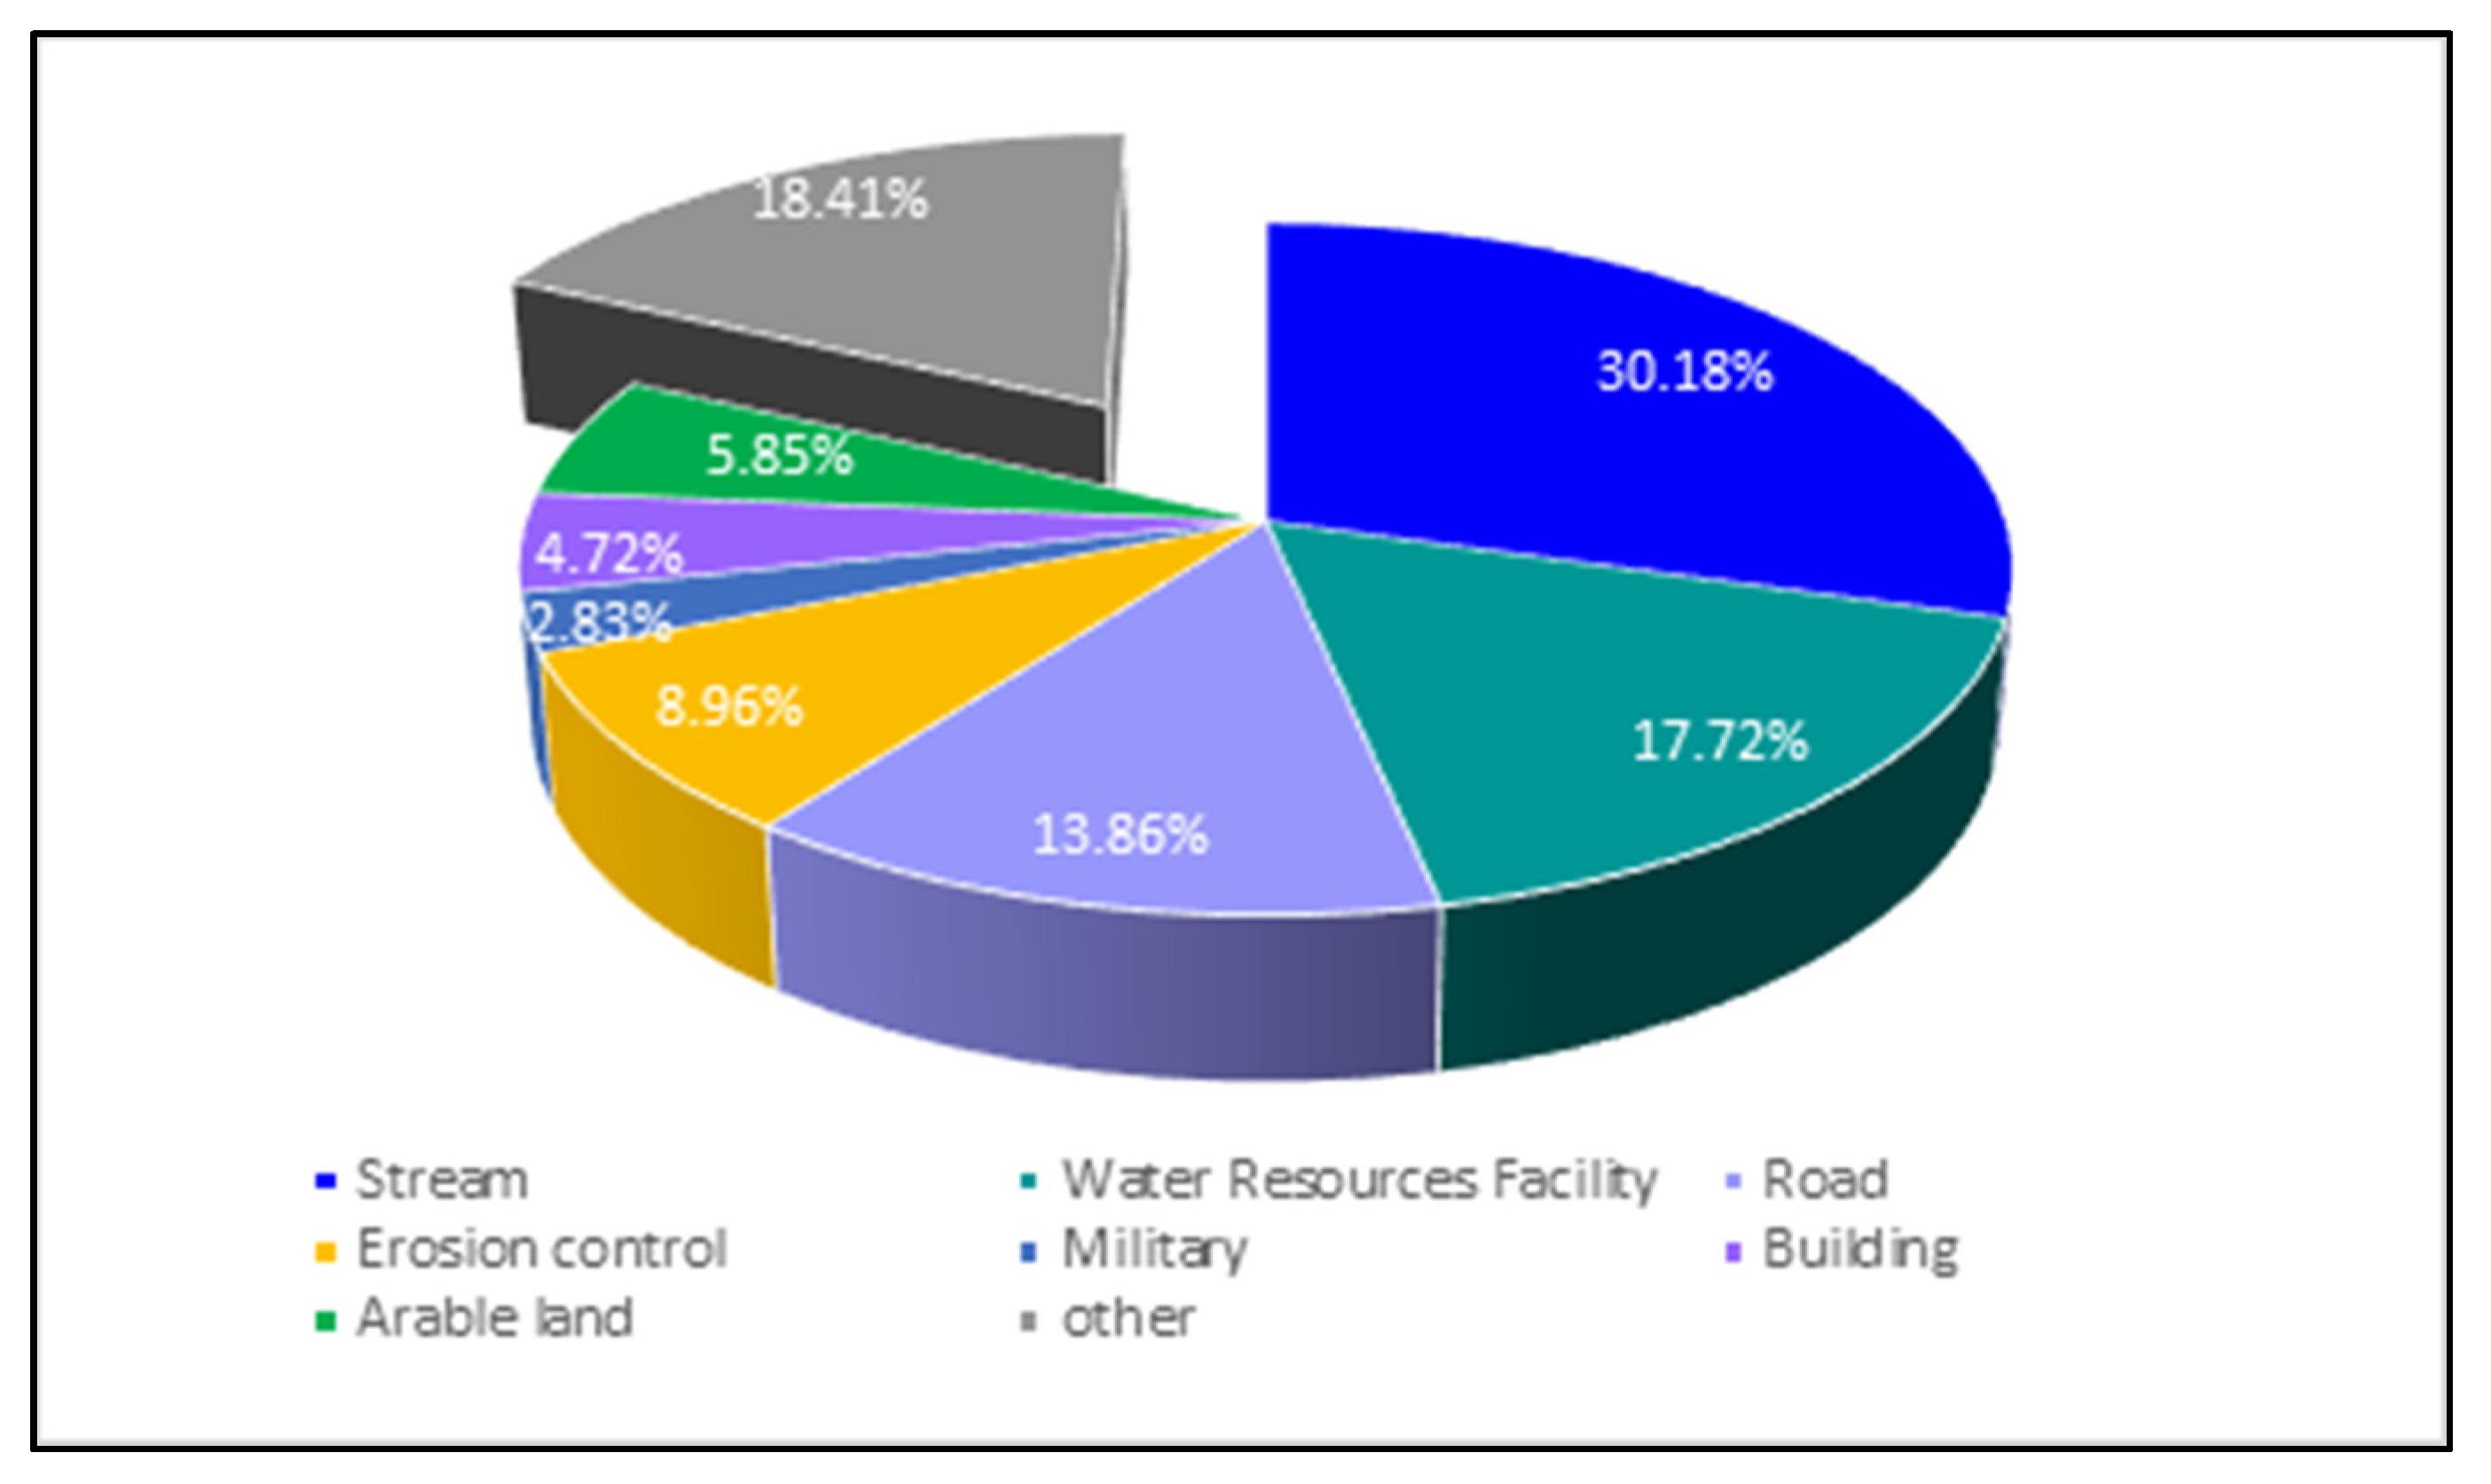
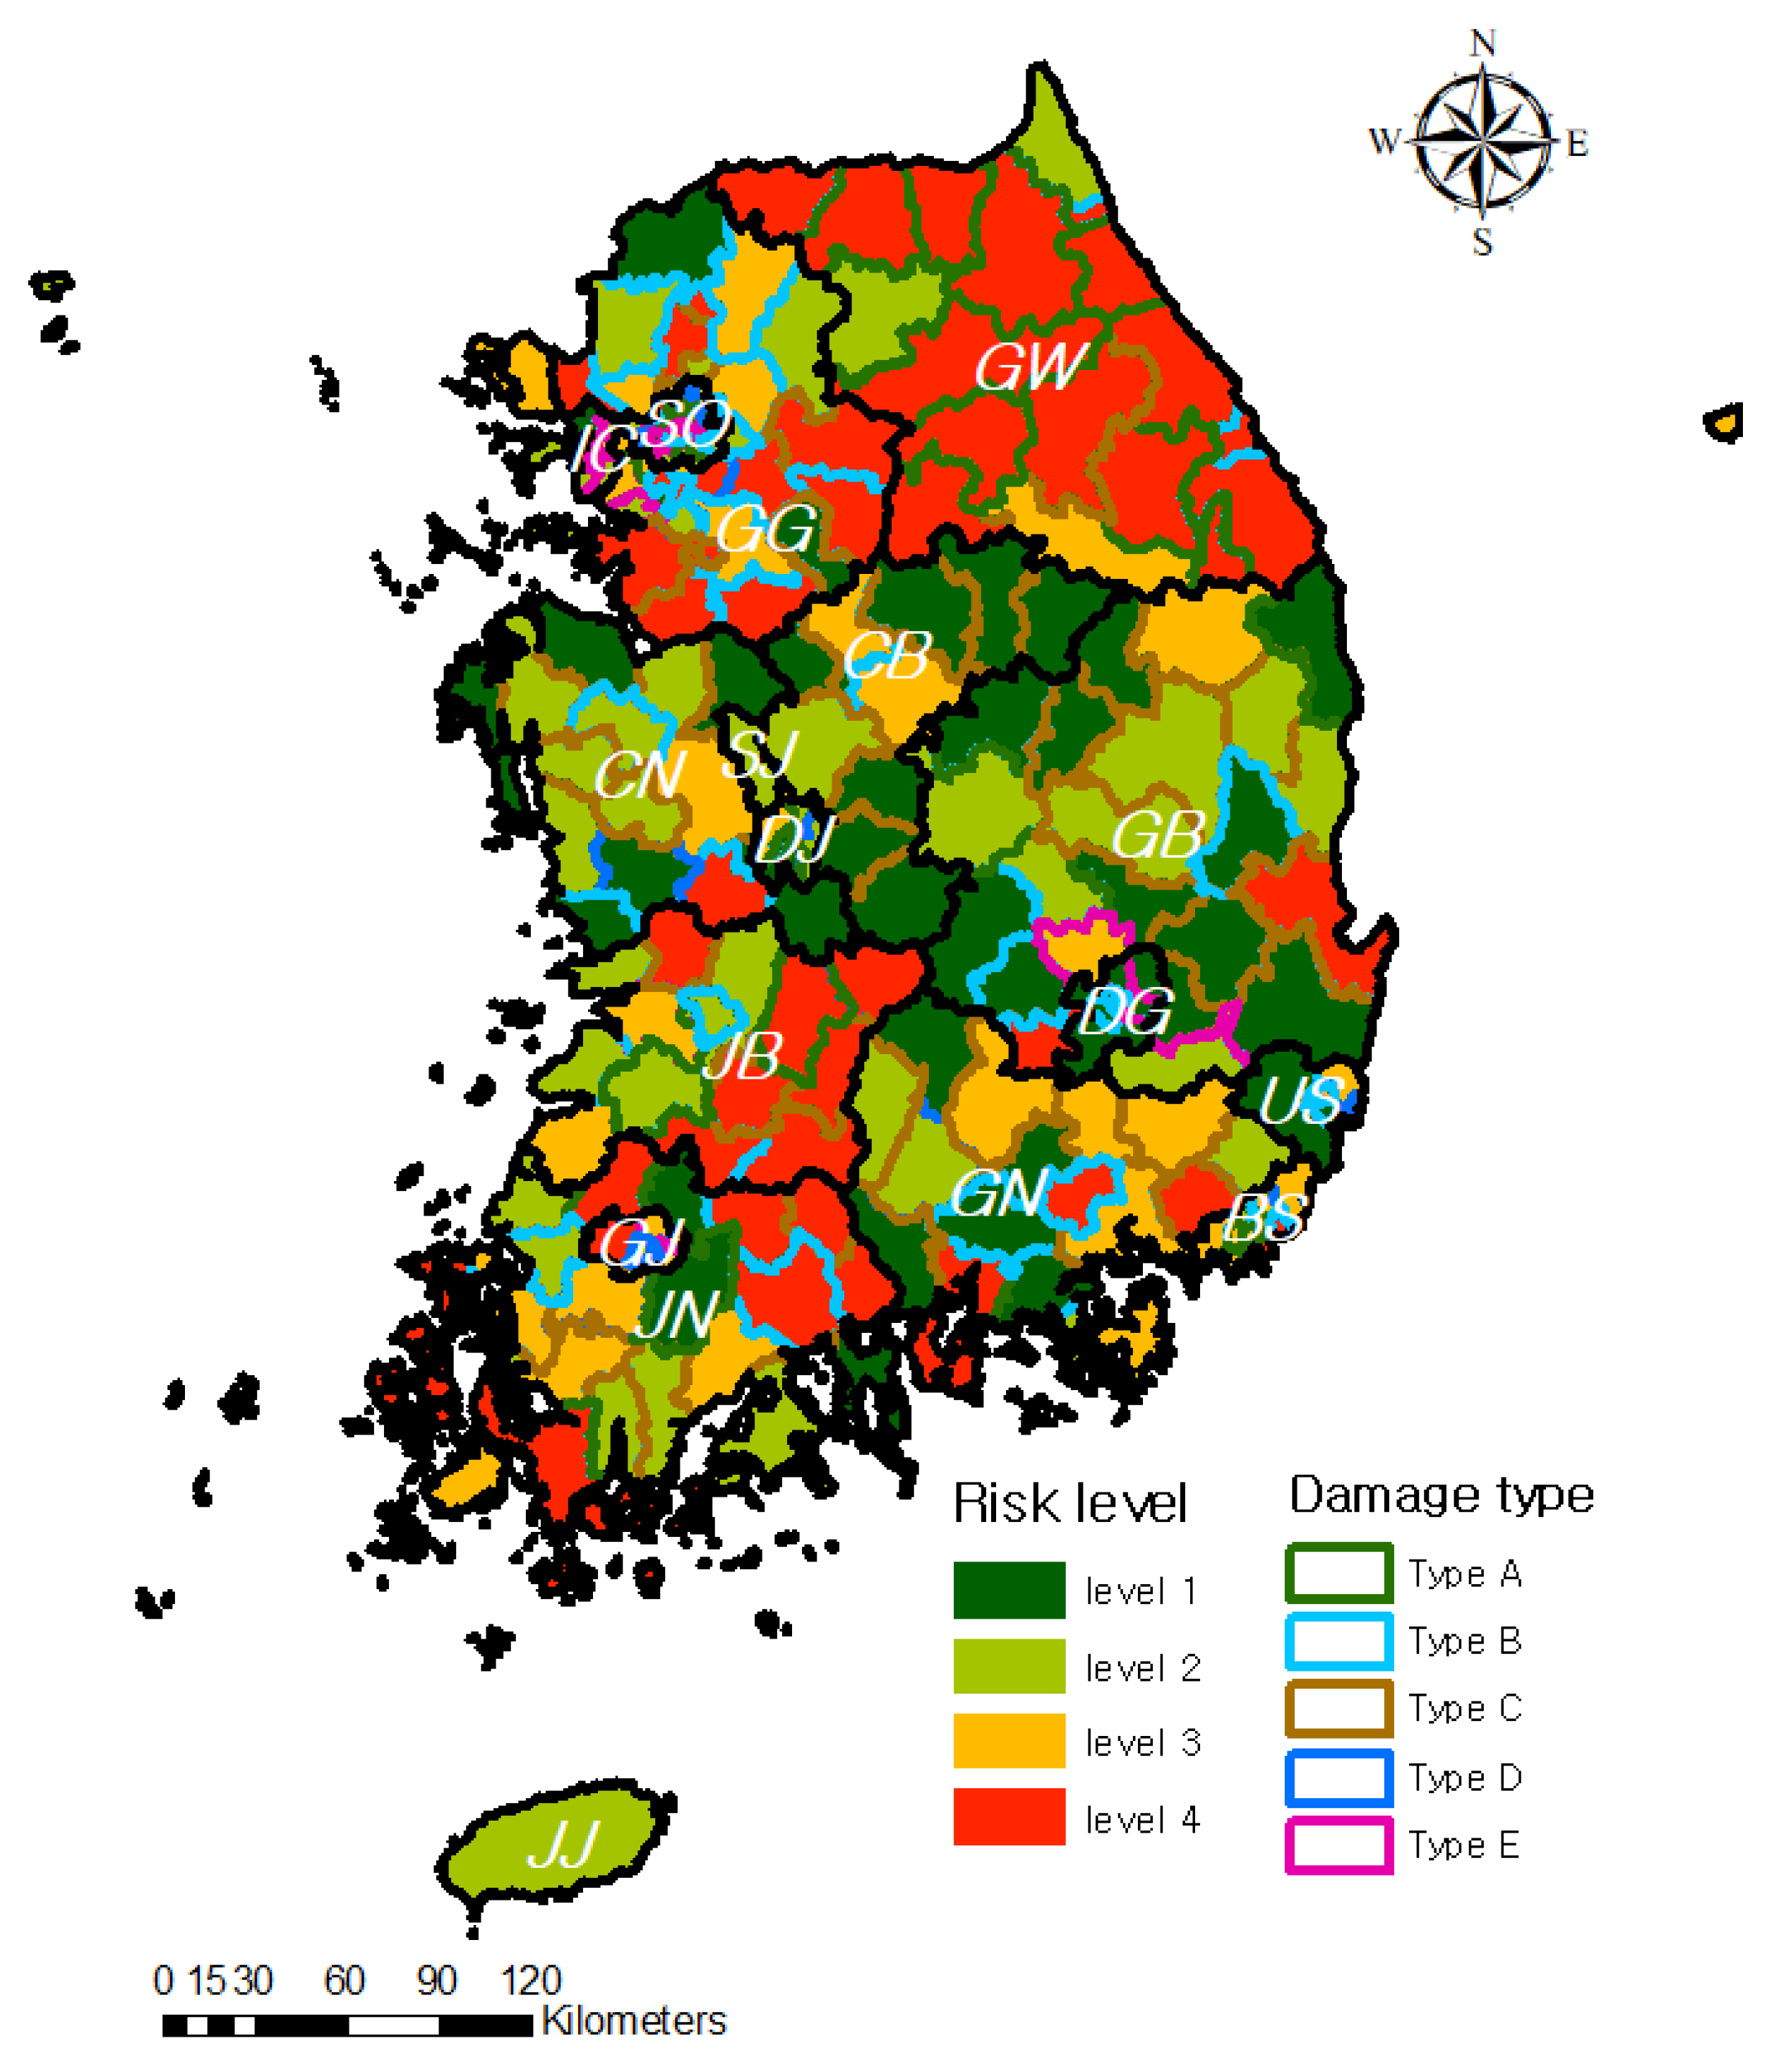
3.3. Analysis for Heavy Rain Damage Risk and Damage Type in Each Region
4. Discussions and Conclusions
Author Contributions
Funding
Institutional Review Board Statement
Informed Consent Statement
Data Availability Statement
Acknowledgments
Conflicts of Interest
References
- UNDP. Sendai Framework for Disaster Risk Reduction (2015–2030). Available online: https://www.undrr.org/publication/sendai-framework-disaster-risk-reduction-2015-2030 (accessed on 18 March 2021).
- Ministry of the Interior and Safety (MOIS). The Statistical Yearbook of Natural Disaster; MOIS: Korea, Sejong, 2019.
- Țîncu, R.; Zêzere, J.L.; Crăciun, I.; Lazăr, G.; Lazăr, I. Quantitative micro-scale flood risk assessment in a section of the Trotuș River, Romania. Land Use Policy 2020, 95, 103881. [Google Scholar] [CrossRef]
- Di Mauro, M.; De Bruijn, K.M.; Meloni, M. Quantitative methods for estimating flood fatalities: Towards the introduction of loss-of-life estimation in the assessment of flood risk. Nat. Hazards 2012, 63, 1083–1113. [Google Scholar] [CrossRef]
- Zhang, J.; Okada, N.; Tatano, H.; Hayakawa, S. Risk Assessment and Zoning of Flood Damage Caused by Heavy Rainfall in Yamaguchi Prefecture, Japan. Flood Def. 2002, 2002, 162–169. [Google Scholar]
- Fekete, A. Validation of a social Vulnerability index in context to river-floods in Germany. Nat. Hazards Earth Syst. Sci. 2009, 9, 393–403. [Google Scholar] [CrossRef] [Green Version]
- Shivaprasad Sharma, S.V.; Parth Sarathi, R.; Chakravarthi, V.; Srinivasa Rao, G. Flood risk assessment using multi-criteria analysis: A case study from Kopili River Basin, Assam, India. Geomat. Nat. Hazards Risk 2017, 9, 79–93. [Google Scholar] [CrossRef]
- Amira, R.F.; Surjandari, I.; Laoh, E. Jakarta Flood Risk Mapping Using Index-based Approach and Spatial Analysis. In Proceedings of the 2020 International Conference on ICT for Smart Society (ICISS), Bandung, Indonesia, 19–20 November 2020. [Google Scholar] [CrossRef]
- Lim, K.S.; Choi, S.J.; Lee, D.R.; Moon, J.W. Development of Flood Risk Index using causal relationships of Flood Indicators. J. Korean Soc. Civ. Eng. 2010, 30, 61–70. [Google Scholar]
- OECD. OECD Environmental Indicators 2001—Towards Sustainable Development; OECD: Paris, France, 2001. [Google Scholar] [CrossRef]
- Mustika Anindita, R.; Susilowati, I.; Muhammad, F. Flood risk spatial index analysis in the coastal Pekalongan, Central Java, Indonesia. In E3S Web of Conferences; EDP Sciences: Les Ulis City, France, 2020; Volume 202, p. 06028. [Google Scholar]
- IPCC. Climate Change 2007: The Physical Science Basis, Contribution of Working Group I to the Fourth Assessment Report of the Intergovernmental Panel on Climate Change; IPCC: Switzerland, Geneva, 2007. [Google Scholar]
- Korea Institute of Civil Engineering and Building Technology. Construction of Calculation Process and Advancement for Flood Damage Risk Index to Assess Qualitative Risk; KICT: Ilsan, Korea, 2020. [Google Scholar]
- 2009 UNISDR Terminology on Disaster Risk Reduction. Available online: https://www.undrr.org/publication/2009-unisdr-terminology-disaster-risk-reduction (accessed on 18 March 2021).
- Rygel, L.; O’Sullivan, D.; Yarnal, B. A method for constructing a social Vulnerability index: An Application to Hurricane Storm Surges in a Developed Country. Mitig. Adapt. Strateg. Glob. Change 2006, 11, 741–764. [Google Scholar] [CrossRef]
- Joo, H.; Choi, C.; Kim, J.; Kim, D.; Kim, S.; Kim, H.S. A Bayesian network-based integrated for flood risk assessment (InFRA). Sustainability 2019, 11, 3733. [Google Scholar] [CrossRef] [Green Version]
- Kim, J.S.; Choi, C.H.; Lee, J.S.; Kim, H.S. Damage prediction using heavy rain risk assessment:(1) Estimation of heavy rain damage risk index. J. Korean Soc. Hazard Mitig. 2017, 17, 361–370. [Google Scholar] [CrossRef]
- Birkmann, J. Measuring vulnerability to promote disaster-resilient societies: Conceptual frameworks and definitions. Meas. Vulnerability Nat. Hazards Disaster Resilient Soc. 2006, 1, 9–54. [Google Scholar]
- Choi, H.C.; Sirakaya, E. Sustainability indicators for managing community tourism. Tour. Manag. 2006, 27, 1274–1289. [Google Scholar] [CrossRef]
- Berry, D. Sustainable Development in the United States: An Experimental Set of Indicators; Interim Report; US Interagency Working Group on Sustainable Development Indicators: Washington, DC, USA, 1997.
- Bundesregierung, D. Perspektiven fur Deutschland. Unsere Strategie fur Eine Nachhaltige Entwicklung. 2002. Available online: https://www.nachhaltigkeit.info/media/1326188329phpYJ8KrU (accessed on 10 May 2021).
- Nardo, M.; Saisana, M.; Saltelli, A.; Tarantola, S. Tools for composite indicators building. Eur. Com. Ispra 2005, 15, 19–20. [Google Scholar]
- Forman, E.H.; Gass, S.I. The analytic hierarchy processan exposition. Oper. Res. 2001, 49, 469–486. [Google Scholar] [CrossRef]
- MacCallum, R. A comparison of factor analysis programs in SPSS, BMDP, and SAS. Psychometrika 1983, 48, 223–231. [Google Scholar] [CrossRef]
- Dalkey, N.; Helmer, O. An experimental application of the Delphi method to the use of experts. Manag. Sci. 1963, 9, 458–467. [Google Scholar] [CrossRef]
- Ozkul, S.; Harmancioglu, N.B.; Singh, V.P. Entropy-based assessment of water quality monitoring networks. J. Hydrol. Eng. 2000, 5, 90–100. [Google Scholar] [CrossRef] [Green Version]
- Joo, H.; Kim, S.; Lee, M.; Kim, H. A study on determination of investment priority of flood control considering flood vulnerability. J. Korean Soc. Hazard Mitig. 2018, 18, 417–429. [Google Scholar] [CrossRef]
- Kyoung, M.S.; Kim, S.D.; Kim, B.K.; Kim, H.S. Construction of hydrological drought severity-area-duration curves using cluster analysis. J. Korean Soc. Civ. Eng. 2007, 27, 267–276. [Google Scholar]
- Han, S.M.; Hwang, G.S.; Choe, S.Y.; Park, J.W. A study on classifying algorithm of disaster recovery resources using statistical method. J. Korean Soc. Hazard Mitig. 2014, 14, 49–58. [Google Scholar] [CrossRef] [Green Version]
- Nam, W.H.; Kim, T.; Hong, E.M.; Hayes, M.J.; Svoboda, M.D. Water supply risk assessment of agricultural reservoirs using irrigation vulnerability model and cluster analysis. J. Korean Soc. Agric. Eng. 2015, 57, 59–67. [Google Scholar]
- Pham, D.T.; Afify, A.A. Engineering applications of clustering techniques. In Intelligent Production Machines and Systems, ScienceDirect; Elsevier: Amsterdam, The Netherlands, 2006; pp. 326–331. [Google Scholar] [CrossRef]
- Son, Y.; Chung, M. Digital Forensics for Android Location Information using Hierarchical Clustering. J. Inst. Electron. Inf. Eng. 2014, 51, 143–151. [Google Scholar] [CrossRef]


| Province | Abbreviation | City | Abbreviation |
|---|---|---|---|
| Gyeonggi-do | GG | Seoul | SO |
| Gangwon-do | GW | Incheon | IC |
| Gyeongsangbuk-do | GB | Busan | BS |
| Gyeongsangnam-do | GN | Daegu | DG |
| Chungcheongbuk-do | CB | Ulsan | US |
| Chungcheongnam-do | CN | Daejeon | DJ |
| Jeollabuk-do | JB | Sejong | SJ |
| Jeollanam-do | JN | Gwangju | GJ |
| JeJu-do | JJ |
| Indicator Selection Principles | Abbreviations | Descriptions |
|---|---|---|
| Correlation | C | Examines whether the meanings of the components are similar |
| Simplicity | S | Examines whether the meanings of individual indicators are easy to understand |
| Quantitative | Q | Examines whether indicators can be quantified numerically |
| Validity | V | Examines whether the conceptual basis of the relevant indicator is clear |
| Redundancy | R | Examines whether any of the indicators have overlapping meanings |
| Ease | E | Examines whether it is easy to continuously collect data |
| Methods | Equation | Description |
|---|---|---|
| Categorical scale | A method of classifying categories by quantile and assigning scores even if the range of specific indicator values is very wide. | |
| means the value of the th data, and scores are given according to the range to which the value belongs. | ||
| Re-Scaling | A transformation method based on the range of indicators. Standardized values are included in the range of 0 to 1. | |
| means the value of the th data, and max(x) and min(x) represent the maximum and minimum values of the data, respectively. |
| Framework | Components | Potential Assessment Indicators | Indicator Selection Principles | Final Selection | |||||
|---|---|---|---|---|---|---|---|---|---|
| C | S | Q | V | R | E | ||||
| Hazard | Meteorological | Probable rainfall | ☓ | ○ | ○ | ○ | ○ | ○ | ☓ |
| Number of days of rainfall of 80 mm | ○ | ☓ | ○ | ○ | ☓ | ○ | ☓ | ||
| Maximum rainfall per day | ○ | ○ | ○ | ○ | ☓ | ○ | ☓ | ||
| Maximum rainfall during the duration (24 h) | ○ | ○ | ○ | ○ | ○ | ○ | ○ (H1) | ||
| Annual average rainfall | ○ | ○ | ○ | ○ | ○ | ○ | ○ (H2) | ||
| Historical Damage | Flood damage | ○ | ○ | ○ | ○ | ○ | ○ | ○ (H3) | |
| Scale of flood damage | ○ | ○ | ○ | ○ | ☓ | ○ | ☓ | ||
| Frequency of flood damage | ○ | ○ | ○ | ○ | ○ | ○ | ○ (H4) | ||
| Flooded area | ○ | ○ | ☓ | ☓ | ○ | ☓ | ☓ | ||
| Exposure | Socio-economic | Total population | ○ | ○ | ○ | ○ | ○ | ○ | ○ (E1) |
| GRDP | ○ | ○ | ○ | ○ | ○ | ○ | ○ (E2) | ||
| Per capita income | ○ | ○ | ○ | ○ | ☓ | ○ | ☓ | ||
| Average official land price | ○ | ○ | ○ | ○ | ☓ | ○ | ☓ | ||
| Population density | ○ | ○ | ○ | ○ | ☓ | ☓ | ☓ | ||
| Physical | Number of buildings | ○ | ○ | ○ | ○ | ○ | ○ | ○ (E3) | |
| Infrastructure (road) | ○ | ○ | ○ | ○ | ○ | ○ | ○ (E4) | ||
| Slope | ☓ | ○ | ○ | ○ | ☓ | ○ | ☓ | ||
| River density | ○ | ○ | ○ | ○ | ○ | ○ | ○ (E5) | ||
| Vulnerability | Social | Vulnerable population | ○ | ○ | ○ | ○ | ○ | ○ | ○ (V1) |
| Poor population | ○ | ○ | ○ | ○ | ☓ | ☓ | ☓ | ||
| Infant mortality | ○ | ○ | ○ | ○ | ☓ | ☓ | ☓ | ||
| TV distribution rate | ☓ | ○ | ○ | ○ | ○ | ☓ | ☓ | ||
| Number of semi-basement households | ○ | ○ | ○ | ○ | ○ | ☓ | ☓ | ||
| Population in flooded areas | ○ | ○ | ☓ | ☓ | ○ | ☓ | ☓ | ||
| Number of households not supplied with electricity | ☓ | ○ | ○ | ○ | ☓ | ☓ | ☓ | ||
| Physical | Area of the lowland area | ○ | ☓ | ○ | ☓ | ☓ | ☓ | ☓ | |
| Runoff curve index | ○ | ○ | ○ | ○ | ○ | ☓ | ☓ | ||
| Disaster-prone districts | ○ | ○ | ○ | ○ | ○ | ○ | ○ (V2) | ||
| Steep slope | ○ | ○ | ○ | ○ | ○ | ○ | ○ (V3) | ||
| Old buildings | ○ | ○ | ○ | ○ | ○ | ○ | ○ (V4) | ||
| Capacity | Disaster Prevention Capability | Number of disaster prevention facilities | ○ | ○ | ○ | ○ | ○ | ☓ | ☓ |
| Preventive facilities | ○ | ○ | ○ | ○ | ☓ | ☓ | ☓ | ||
| Drainage pump station | ○ | ○ | ○ | ○ | ○ | ○ | ○ (C1) | ||
| Dam and reservoir | ○ | ○ | ☓ | ○ | ○ | ☓ | ☓ | ||
| River management personnel | ☓ | ○ | ☓ | ○ | ○ | ☓ | ☓ | ||
| Financial independence | ○ | ○ | ○ | ○ | ○ | ○ | ○ (C2) | ||
| Disaster Prevention History | Cumulative disaster prevention budget | ○ | ○ | ○ | ○ | ○ | ○ | ○ (C3) | |
| Promotion of preventive measures | ○ | ○ | ☓ | ○ | ☓ | ☓ | ☓ | ||
| River embankment ratio | ☓ | ○ | ☓ | ☓ | ○ | ☓ | ☓ | ||
| Assessment Indicators | Re-Scaling | The Percentage of Standardized Value | ||||
|---|---|---|---|---|---|---|
| Min | Max | 20% | 40% | 60% | 80% | |
| H1 | 833.18 | 1443.75 | 0.2245 | 0.3503 | 0.4490 | 0.5518 |
| H2 | 96.43 | 200.625 | 0.2906 | 0.3778 | 0.4889 | 0.6391 |
| H3 | 0 | 156 | 0.2321 | 0.3654 | 0.4679 | 0.5923 |
| H4 | 0 | 635,553,387 | 0.0024 | 0.0065 | 0.0161 | 0.0407 |
| E1 | 16,993 | 1,194,465 | 0.0245 | 0.0709 | 0.1753 | 0.3181 |
| E2 | 431,322 | 60,407,392 | 0.0171 | 0.0446 | 0.0853 | 0.1725 |
| E3 | 2257 | 180,936 | 0.1184 | 0.1718 | 0.2508 | 0.3608 |
| E4 | 0.000421 | 0.281286 | 0.0233 | 0.0346 | 0.0712 | 0.1614 |
| E5 | 0 | 0.209904 | 0.0444 | 0.0712 | 0.1098 | 0.1740 |
| V1 | 7382 | 258,384 | 0.0491 | 0.1038 | 0.2135 | 0.3627 |
| V2 | 0 | 20 | 0.0250 | 0.0500 | 0.1500 | 0.3000 |
| V3 | 0 | 71.76 | 0.0002 | 0.0025 | 0.0224 | 0.1015 |
| V4 | 337 | 67,767 | 0.1235 | 0.1843 | 0.2463 | 0.3156 |
| C1 | 0 | 283,740 | 0.0008 | 0.0016 | 0.0081 | 0.0250 |
| C2 | 0 | 453,722.3 | 0.0176 | 0.0352 | 0.0851 | 0.1341 |
| C3 | 8.5 | 69.2 | 0.1081 | 0.1951 | 0.2965 | 0.4870 |
| Percentile | Score | Percentile | Score |
|---|---|---|---|
| 0.2 | 0.8 | ||
| 0.4 | 1.0 | ||
| 0.6 | - | - |
| Framework | Assessment Indicators | Indicators Weight | Sub-Index Weight |
|---|---|---|---|
| Hazard | H1 | 0.0043 | 0.3198 |
| H2 | 0.0075 | ||
| H3 | 0.0867 | ||
| H4 | 0.9014 | ||
| Exposure | E1 | 0.139 | 0.1978 |
| E2 | 0.1861 | ||
| E3 | 0.0613 | ||
| E4 | 0.189 | ||
| E5 | 0.4245 | ||
| Vulnerability | V1 | 0.123 | 0.186 |
| V2 | 0.2937 | ||
| V3 | 0.518 | ||
| V4 | 0.0654 | ||
| Capacity | C1 | 0.7646 | 0.2963 |
| C2 | 0.1983 | ||
| C3 | 0.0371 |
Publisher’s Note: MDPI stays neutral with regard to jurisdictional claims in published maps and institutional affiliations. |
© 2022 by the authors. Licensee MDPI, Basel, Switzerland. This article is an open access article distributed under the terms and conditions of the Creative Commons Attribution (CC BY) license (https://creativecommons.org/licenses/by/4.0/).
Share and Cite
Kim, J.; Kim, D.; Lee, M.; Han, H.; Kim, H.S. Determining the Risk Level of Heavy Rain Damage by Region in South Korea. Water 2022, 14, 219. https://doi.org/10.3390/w14020219
Kim J, Kim D, Lee M, Han H, Kim HS. Determining the Risk Level of Heavy Rain Damage by Region in South Korea. Water. 2022; 14(2):219. https://doi.org/10.3390/w14020219
Chicago/Turabian StyleKim, Jongsung, Donghyun Kim, Myungjin Lee, Heechan Han, and Hung Soo Kim. 2022. "Determining the Risk Level of Heavy Rain Damage by Region in South Korea" Water 14, no. 2: 219. https://doi.org/10.3390/w14020219
APA StyleKim, J., Kim, D., Lee, M., Han, H., & Kim, H. S. (2022). Determining the Risk Level of Heavy Rain Damage by Region in South Korea. Water, 14(2), 219. https://doi.org/10.3390/w14020219