1. Introduction
Wave overtopping directly affects populations, causing flooding and damages (in infrastructures, buildings, equipment, etc.). The frequency, volume and flow velocities of overtopping events substantially influence the performance and safety of defence structure [
1,
2,
3,
4]. To mitigate the consequences of this phenomenon, it is necessary to evaluate the relationship between the overtopping events, flooding discharge volumes and consequent damage costs. However, the uncertainty in estimating overtopping flow volumes is high [
5,
6,
7]. On the other hand, the consequences of flooding damages depend on the soil occupation and land uses of the area protected by the coastal defence works. So, the relationship between the discharged volumes in flooded areas and their damage costs is site-specific. This work aims to improve understanding of overtopping and its flooding impact costs through an approach that relates the wave runup and corresponding overtopping events over the structure with the associated costs caused by flooding. This relationship allows discussion of the costs and benefits of different interventions to mitigate coastal floods.
The starting point of this approach is the simplified estimation of the wave runup and overtopping events and their corresponding flooding flow volumes, considering the wave climate effect in a mean sea level condition, not requiring other assumptions about the future forcing agents related to tide conditions or storm surge effects. It is considered that a constant mean sea level can be representative of the average number of overtopping events and flow discharge volumes in a long time series. In Portugal, the importance of storm surges is low. According to Picado et al. [
8], the maximum values of the storm surge amplitudes in the study site coastal region are 0.58 m, 0.84 m and 1.17 m, respectively, for 2, 10 and 100 return periods. A wide range of programs and numerical models can be used to simulate the process of overtopping, such as PC-OVERTOPPING [
9]. Gallien et al. [
10] presented an integrated hydrodynamic flood model that accounts for the combined effects of overland flow, flood defences, dynamic sea level changes, temporally variable wave overtopping volume and urban drainage. In the same work, two empirical wave overtopping models were used to estimate temporally variable overtopping flows [
9,
11,
12,
13] and represent substantial improvements over static methods. Le Roy et al. [
14] intended to propose and apply a methodology to simulate simultaneously wave overtopping and the resulting flood in an urban area at a very high resolution. Few studies have attempted to validate flooding from wave overtopping. Field observations on a central California beach suggest that empirical models moderately overestimate overtopping rates [
15]. Cheung et al. [
16] and Lynett et al. [
17] presented numerical overtopping models along with qualitative validation data (e.g., high water marks or level of damage) and, in the case of Lynett et al. [
17], empirical and numerical estimations differed by a factor of 10.
Considering costs, Vousdoukas et al. [
18] estimated that European countries alone spend EUR 1.4 billion per year on coastal flood damage, an amount that is expected to increase significantly by the end of the century. Vitousek et al. [
19] found that coastal flooding will become twice as frequent within the coming decades in the tropics, a region that is already socio-economically challenged. According to Barzehkar et al. [
20], various marine-driven hazards may cause damage to infrastructure and human livelihoods in populated coastal areas [
21,
22] and climate-influenced hazards may disrupt core ecological values, such as biodiversity and marine and coastal ecosystem services [
23]. However, it is hard to estimate the unit cost of flood management measures in terms of finding reliable data for the following reasons [
24]: cost estimations are mostly made during the design phase of a flood adaptation measure [
25]; the unit cost differs greatly across the literature in terms of what cost components (labour, land purchase, materials, etc.) are included, which makes the comparison of unit cost prices difficult [
26]; for the same flood management measures, the unit cost estimates can vary across countries and regions, depending on local geographic and socio-economic conditions [
27]; and the unit cost estimates vary over time due to changes in socio-economic fluctuations, which affect labour cost, materials supply and land values [
28,
29]. Historical flooding data, land cover maps and land cover values were used in Roebeling et al. [
30] to assess direct impacts and costs from overtopping in artificialized areas, where the potential damage costs are assessed using depth–damage functions (DDFs) for structure and contents [
31,
32].
Overtopping of coastal structures, which can be attributed to sea level rise and increased storminess, is a major design issue. It is likely that many existing structures are undersized based on future predicted climate changes and will not be able to adequately protect shores from future wave forces. Current structures may also become damaged due to the undermining of the structure as a result of regular overtopping. This can have disastrous effects on coastal areas and communities, such as damage to properties, infrastructure, agriculture and loss of life [
33].
Finally, by evaluating the structure construction and maintenance costs and the costs due to overtopping and flooding damages, it is possible to discuss full costs along a defined time horizon, leading to optimised coastal intervention solutions. To better understand the proposed methodology, a real case study on the Portuguese northwest coast (Ovar municipality) was analysed, evaluating data recorded by the Portuguese Environment Agency (APA). Note that Ovar is one of the most critical coastal erosion areas in Portugal, where wave overtopping and coastal floods are frequent [
34,
35]. The methodology developed in this work allowed coastal intervention options to be discussed, supported by a systematic procedure that quantifies the overtopping costs and the coastal intervention costs, in order to optimise the predesign of the structure. The proposed methodological approach aims to improve the knowledge about flooding and overtopping costs in artificialised coastal areas by coastal defence structures (longitudinal revetments), which fills a gap in knowledge regarding this type of forecast, in a medium to long-term perspective.
This paper describes the methodology to estimate overtopping and flooding costs and its application to a real case, the Furadouro beach, located in the Ovar municipality (Portugal). Future scenarios are presented, which encompass the intervention scenarios, climate change impacts and the analysis of the uncertainty of economic parameters. The results are discussed and the major conclusions are presented.
2. Methodology
The proposed methodology is based on the history of coastal protection costs, the number of damage events recorded in the past and their impact costs, being applicable to each specific site. Thus, the definition of a past period of analysis is required, for which it is essential to know the wave climate, coastal structures construction and/or maintenance costs, flooding events and corresponding damage costs. Knowledge about wave climate is of paramount importance to characterise overtopping and flooding events. There are two ways to collect data to assess the past wave climate of a specific zone, considering the offshore wave characteristics (significant wave height, , wave period, , and wave direction, ): numerical models (hindcast) and/or data of a nearby wave buoy. After collecting the data on the past (wave climate, flooding events and related costs), a reference scenario needs to be defined, which should encompass the definition of a characteristic overtopping flow volume unit cost, coastal works intervention and their maintenance representative costs. Finally, scenarios must be defined to predict the future overtopping frequency and consequent flooding costs for the study area along the defined time horizon. Thus, the methodology considers the definition of a past period, in which the characterisation of local wave climate, past damage events and related costs should be performed, allowing the definition of a reference scenario. Then, considering the time horizon of analysis, it is possible to forecast overtopping future costs in different scenarios. Note that the methodology is not dependent of runup and overtopping formulae used, which should simplify the process, as it may be adapted to each specific situation. As an example, the next sections present the approach applied in this manuscript.
2.1. Overtopping and Flooding Phenomena
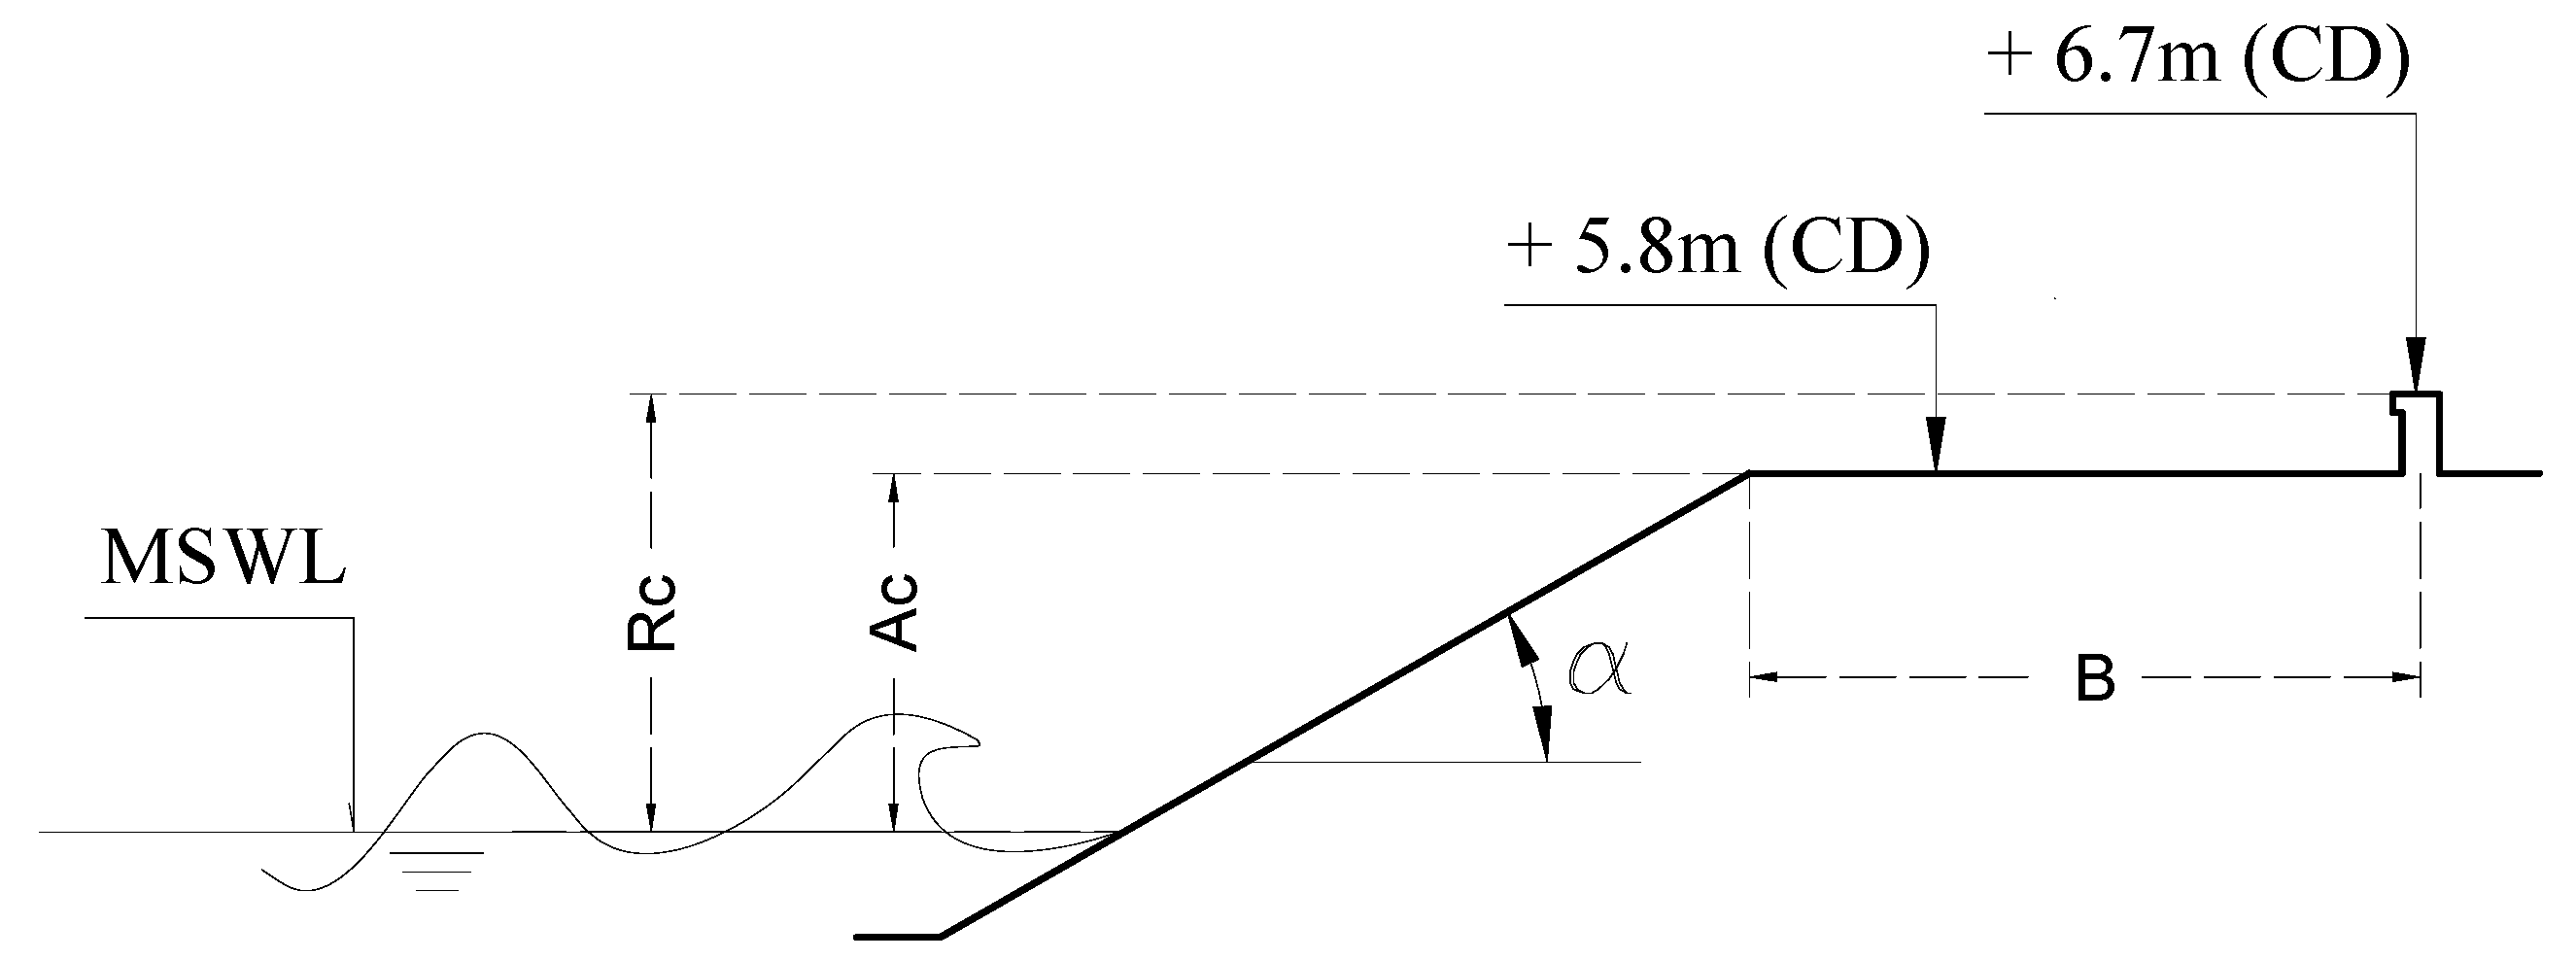
The wave climate and water levels registered in the past are needed to perform a proper evaluation of wave propagation, runup and overtopping over a longitudinal revetment. However, bathymetry, waves and tides registered in the past are not frequently available. Thus, representative forcing agents need to be discussed, supported by simplified formulations that better characterise the observed overtopping and flooding events. The longitudinal revetment here analysed is classified as a sloped structure with a crest wall (schematised in the
Figure 1).
The maximum runup level depends, at each point, on the characteristics of the coastline and, at each moment, on the sum of the following vertical components [
36]: (1) sea level—determined by the astronomical tide, plus storm surge and (2) wave set-up, which causes an increase in water levels due to waves breaking as they travel shoreward, and wave runup, understood as the vertical distance reached by the waves at the structure. The runup height is measured vertically from the still water line [
13] and it also depends on the bottom bathymetry, porosity, roughness, permeability of the core and the slope angle. Due to the complexity to describe overtopping and flooding phenomena and characterise the variables involved, the application of a simplified expression with less complexity is attractive and meets the objectives of the proposed methodology.
Based on the analysis and categorisation of different formulations to calculate the wave runup at the northwest coast of Portugal, Teixeira [
37] obtained, by linear regression, a simplified empirical formulation (Equation (1)) to represent the study area. This simplified formula is presented as an example and other formulations can be considered adequate for other study areas without compromising the validity of the methodology.
where
represents the significant wave height and ξ represents the Iribarren number (Iribarren number is a dimensionless parameter which relates the slope,
with the wave steepness,
:
, with
).
After the number of overtopping events are identified, flow discharge volume needs to be quantified. The formulae presented in Burchart and Hughes [
38], Equation (2), represents the dimensionless average discharge per meter (
), in which the form and coefficients are adjusted to reproduce hydraulic test results for specific geometries. In this equation,
is the dimensionless freeboard (see also
Figure 1).
The formula of Pedersen and Burcharth [
39] and Pedersen [
40], suitable for rock-armoured permeable slopes with a berm in front of a crown wall and irregular, head-on waves (see Equations (3) and (4)), was considered adequate for the study area because the revetment structures there present these characteristics, as shown in
Figure 1 and described in
Section 3. These equations do not directly consider reduction factors and a certain conservative bias for small values of
was observed, as referred by Pedersen and Burcharth [
39].
dimensionless average discharge [-];
dimensionless structure freeboard [-];
average overtopping discharge per unit length of structure (m3/s/m);
offshore significant wave height (m);
mean wave period in deep water (s);
deepwater wave length corresponding to mean wave period (m);
vertical distance from the sea water level to the top of the crown wall face (m);
armour crest freeboard defined as the vertical distance from the sea water level to the armour crest (m);
front berm width (m);
structure slope.
Note that the notational permeability of the core is considered 0.4.
2.2. Coastal Structures and Flooding Damages Costs
The existing coastal structure maintenance costs need to be characterised, allowing their extrapolation for future scenarios. At the same time, flooding events records should be available to validate the flooding estimates. Damage costs related to these events allow defining of a cost per unit of discharged volume. Thus, when future scenarios are tested and overtopping events are discussed, flooded volumes may be represented as a monetary unit result, comparable with the coastal structure reinforcement costs.
Establishing the relationship between economic losses and overtopping and flooding events is a crucial step in developing flood damage assessments in coastal areas [
41]. According to the same authors, these relationships take the form of damage cost curves and are used by researchers to estimate the economic damage due to sea level rise, overtopping and flooding events. Since it is difficult to define these functions, in the present methodology, the overtopping discharges in the past are estimated and summed. All the registered damage costs and structure maintenance costs were also summed, allowing a direct relationship to be defined between the flooded volumes and consequent costs.
To economically analyse the future scenarios, the cost values are updated over time for a reference year through Equation (5).
where
is the updated costs (damages of overtopping and flooding events and coastal structures maintenance along time);
is the constant discount rate; and
is the time horizon of the analysis. The reference value of the discount rate is generally considered to be 3% but should be defined according to each case study.
More specific details of the methodology are referred to throughout its application to the study area (
Section 3).
3. Application to a Study Area
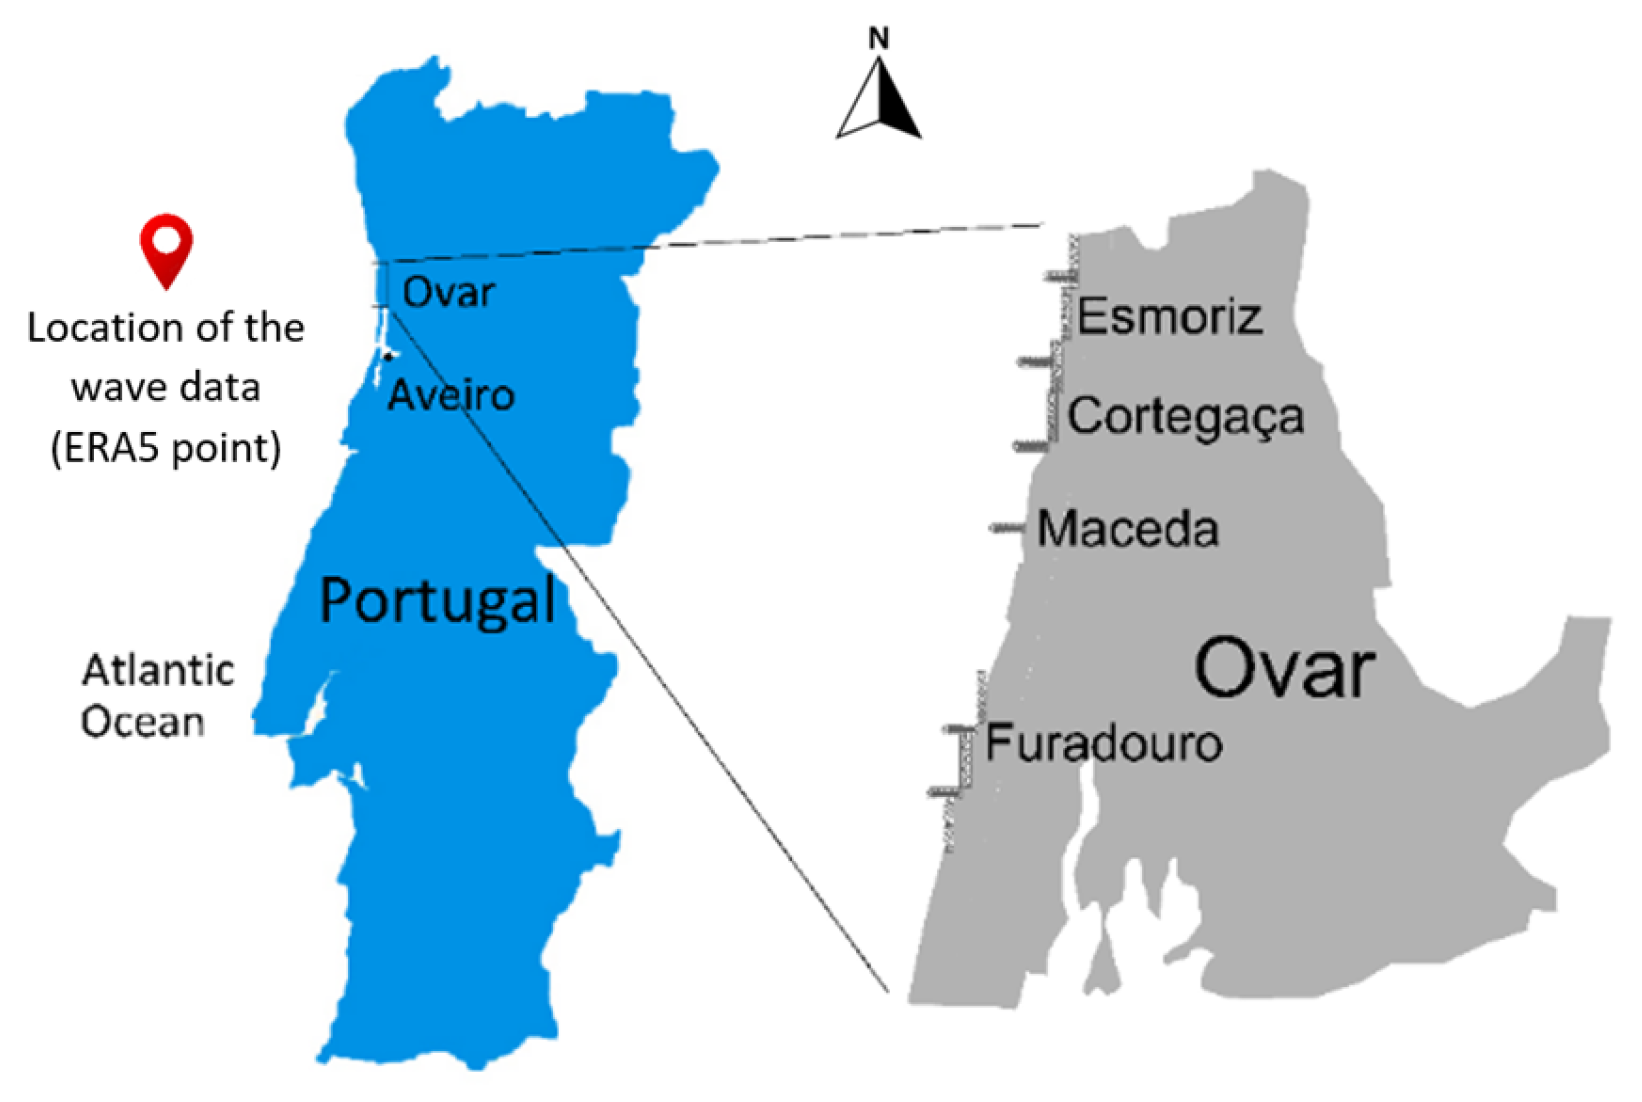
The municipality of Ovar, Aveiro district, with a total area of about 147.70 km
2 and more than 55,000 inhabitants, is located on the northwest coast of Portugal (
Figure 2). This coast is exposed to the Atlantic Ocean in a shore extension of about 15 km, presenting important coastal erosion problems [
42,
43].
Along the Ovar municipality coast, Furadouro beach is the most densely populated area. The southern limit of the urban waterfront is protected by a longitudinal rocky revetment as schematized in
Figure 1 (the coastal structure analysed in this work). Due to the current exposure of Furadouro urban waterfront to wave actions during storms, the occurrence of damage events, such as overtopping, flooding of public roads and facilities, and damage to infrastructures along the coast, are frequent. Furadouro beach also has the highest number of damage events in Ovar municipality, keeping a clear upward trend in the number of occurred events in recent decades [
44].
3.1. Wave Climate
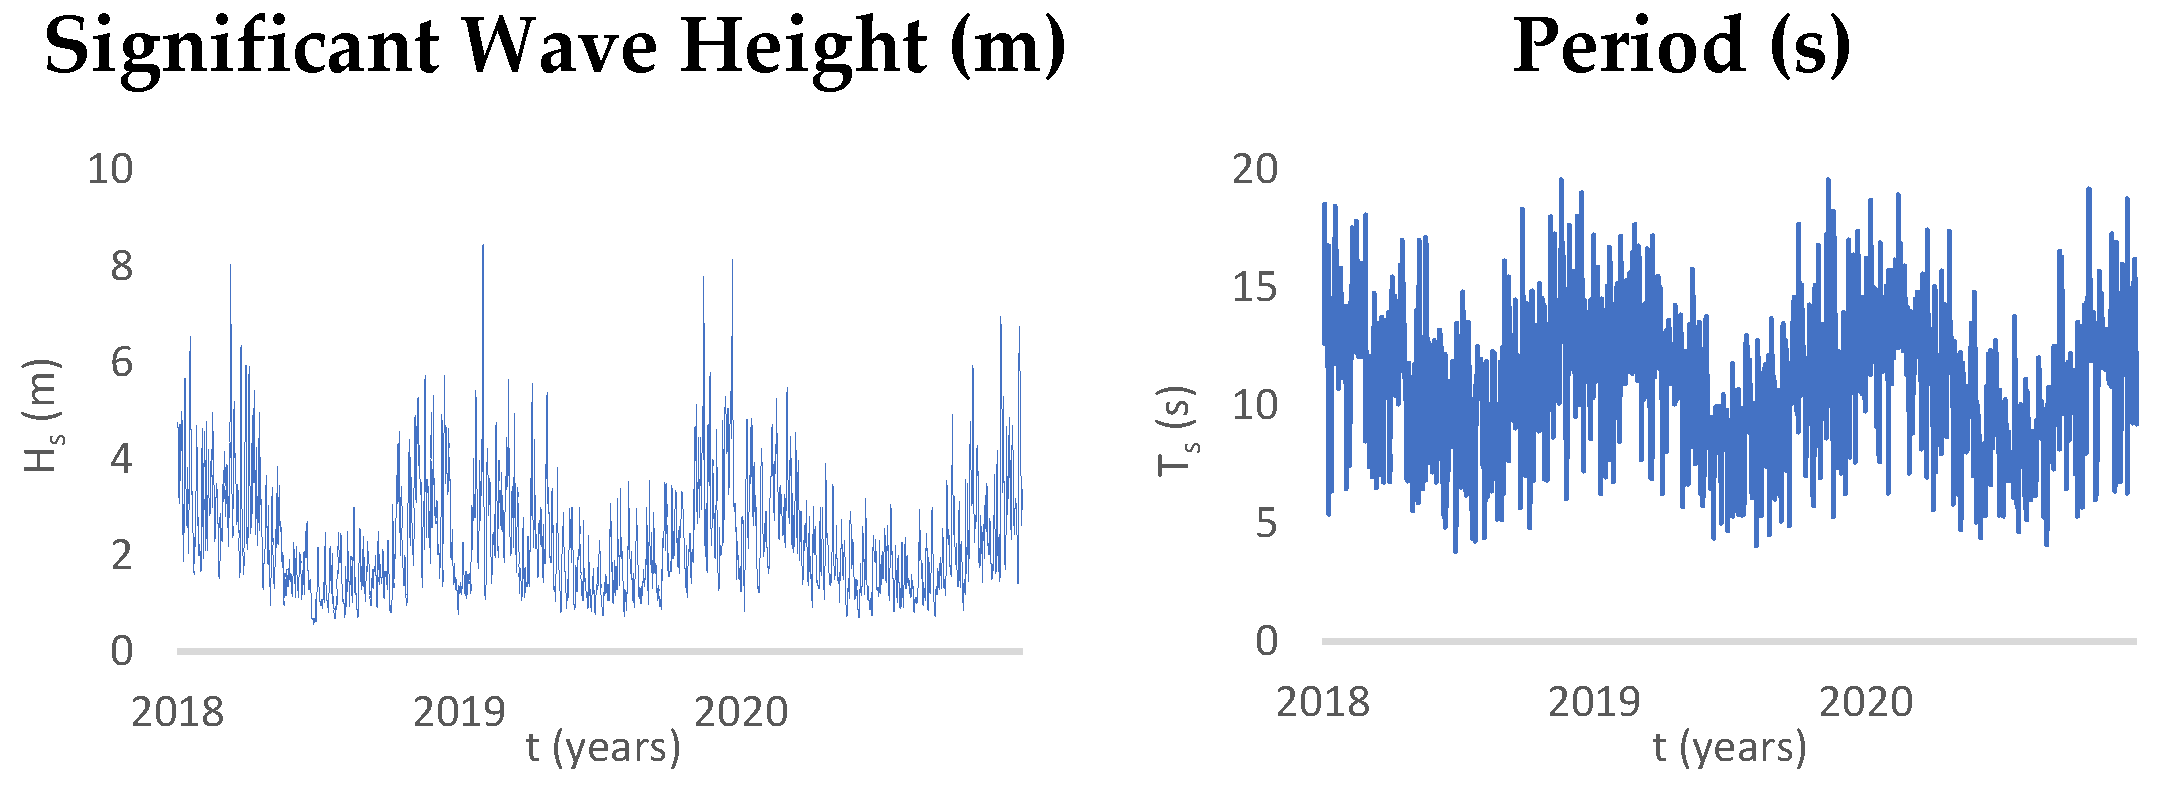
The wave data records between 2018 and 2020 correspond to the period of damage events reported by APA (Portuguese Environment Agency). Data from the ERA5 (available at
https://cds.climate.copernicus.eu, accessed in April 2021) point were collected by Oliveira et al. [
43], with the following geographic co-ordinates: 41°00′0.00″ N and 9°50′0.00″ W, see
Figure 2. These data correspond to periods of 3 h, which represent 8 records per day, between 1 January 2018 and 31 December 2020, resulting in a total of 92,064 values (
Figure 3). It can be observed that the most frequent wave heights vary between 1 and 2 m, with the maximum significant wave height of 8.45 m. The predominant wave period varies between 12 and 14 s, with a minimum wave period of 3.83 s and a maximum wave period of 19.60 s.
However, 3 years of data are not considered enough to provide a good projection of the future. Thus, a comparison of the overtopping flow of the period between 2018 and 2020 and the overtopping flow in a 20-year wave climate series was performed to ensure proper representativeness. On the other hand, to assess the effect of climate change, two of the Intergovernmental Panel on Climate Change (IPCC) scenarios from its 5th Assessment Report, AR5, have been considered: RCP4.5 and RCP8.5 (RCP—representative concentration pathway). Thus, three wave climate series of 20 years were adopted: historical, RCP4.5 and RCP8.5, based on [
46]. These series were produced in the scope of the research project MarRisk [
47] and characterise the offshore wave climate at the study area. In this project, MeteoGalicia carried out an assessment of past and present trends and average and extreme regimes of wave climate on the Atlantic coast of the Iberian Peninsula using different models from the Coupled Model Intercomparison Project 5 (CMIP5 project). The results indicated that the Model for Interdisciplinary Research On Climate (MIROC5 model) had the best fit. The wave data obtained after performing the dynamic downscaling were provided for an offshore point in the coastal region of Aveiro (40.50° N 10° W).
The first series considered was the historical one, which presents 20 years of records and characterises the past offshore wave climate (1986–2005). The future series contains two series of 20 years of records (a short-term future scenario 2026–2045 and a long-term future scenario 2081–2100) and projects the future wave climate scenarios for different greenhouse gas concentrations indicated by Baills et al. [
48].
Figure 4 shows the five series analysed (historical, RCP4.5 short- and long-term and RCP8.5 short- and long-term).
Table 1 summarizes a statistical analysis of the wave data series presented in
Figure 3 and
Figure 4.
As observed in
Table 1, historical waves present a lower average wave height and lower maximum when compared to the 2018–2020 records. Future trends can represent increasing waves heights if the RCP 4.5 is considered but the opposite if RCP 8.5 is adopted. These results make evident the uncertainties of future scenarios and highlight the importance of simple tools to test the sensitivity to different situations. The wave period and the wave direction are kept more uniform in all wave time series. The results of 2018–2020 and historical wave series show the importance of longer data series to achieve a greater representativeness.
3.2. Coastal Defence Works
To counteract the shoreline retreat, which collides with the urban uses, and limit the damage caused by energetic wave climate events, the coast of the Ovar municipality is artificialised by coastal defence structures [
34]. Currently, there are six groins and eight longitudinal revetments structures at the Esmoriz, Cortegaça, Maceda and Furadouro beaches, mostly built between the 1960s and 1980s of the 20th century, which highlights the vulnerability to erosion and exposure to the energetic wave climate [
34].
Jesus [
49] presents a database, adapted from Lamy [
50], Eurosion [
51], Cruz [
52], INAG (National Water Institute; currently, Portuguese Environment Agency), CMO (Ovar Municipality) and SIARL (Littoral Resource Management System), with the costs related to the construction, maintenance and rehabilitation of coastal defence works in the municipality of Ovar. In
Table 2, the coastal defence works studied in the municipality of Ovar are identified, as well as the respective construction dates. The total construction and maintenance costs in Esmoriz, Cortegaça and Furadouro are also presented between 1959 and 2020.
The global analysis of Jesus [
49] database shows that Furadouro and Esmoriz are the places with the highest intervention costs. The coastal structure maintenance costs at Furadouro in the period between 2018 and 2020 (214,882.00 EUR/year) represent the necessary input to calculate the global unit costs of overtopping and flooding.
3.3. Overtopping and Flooding Events
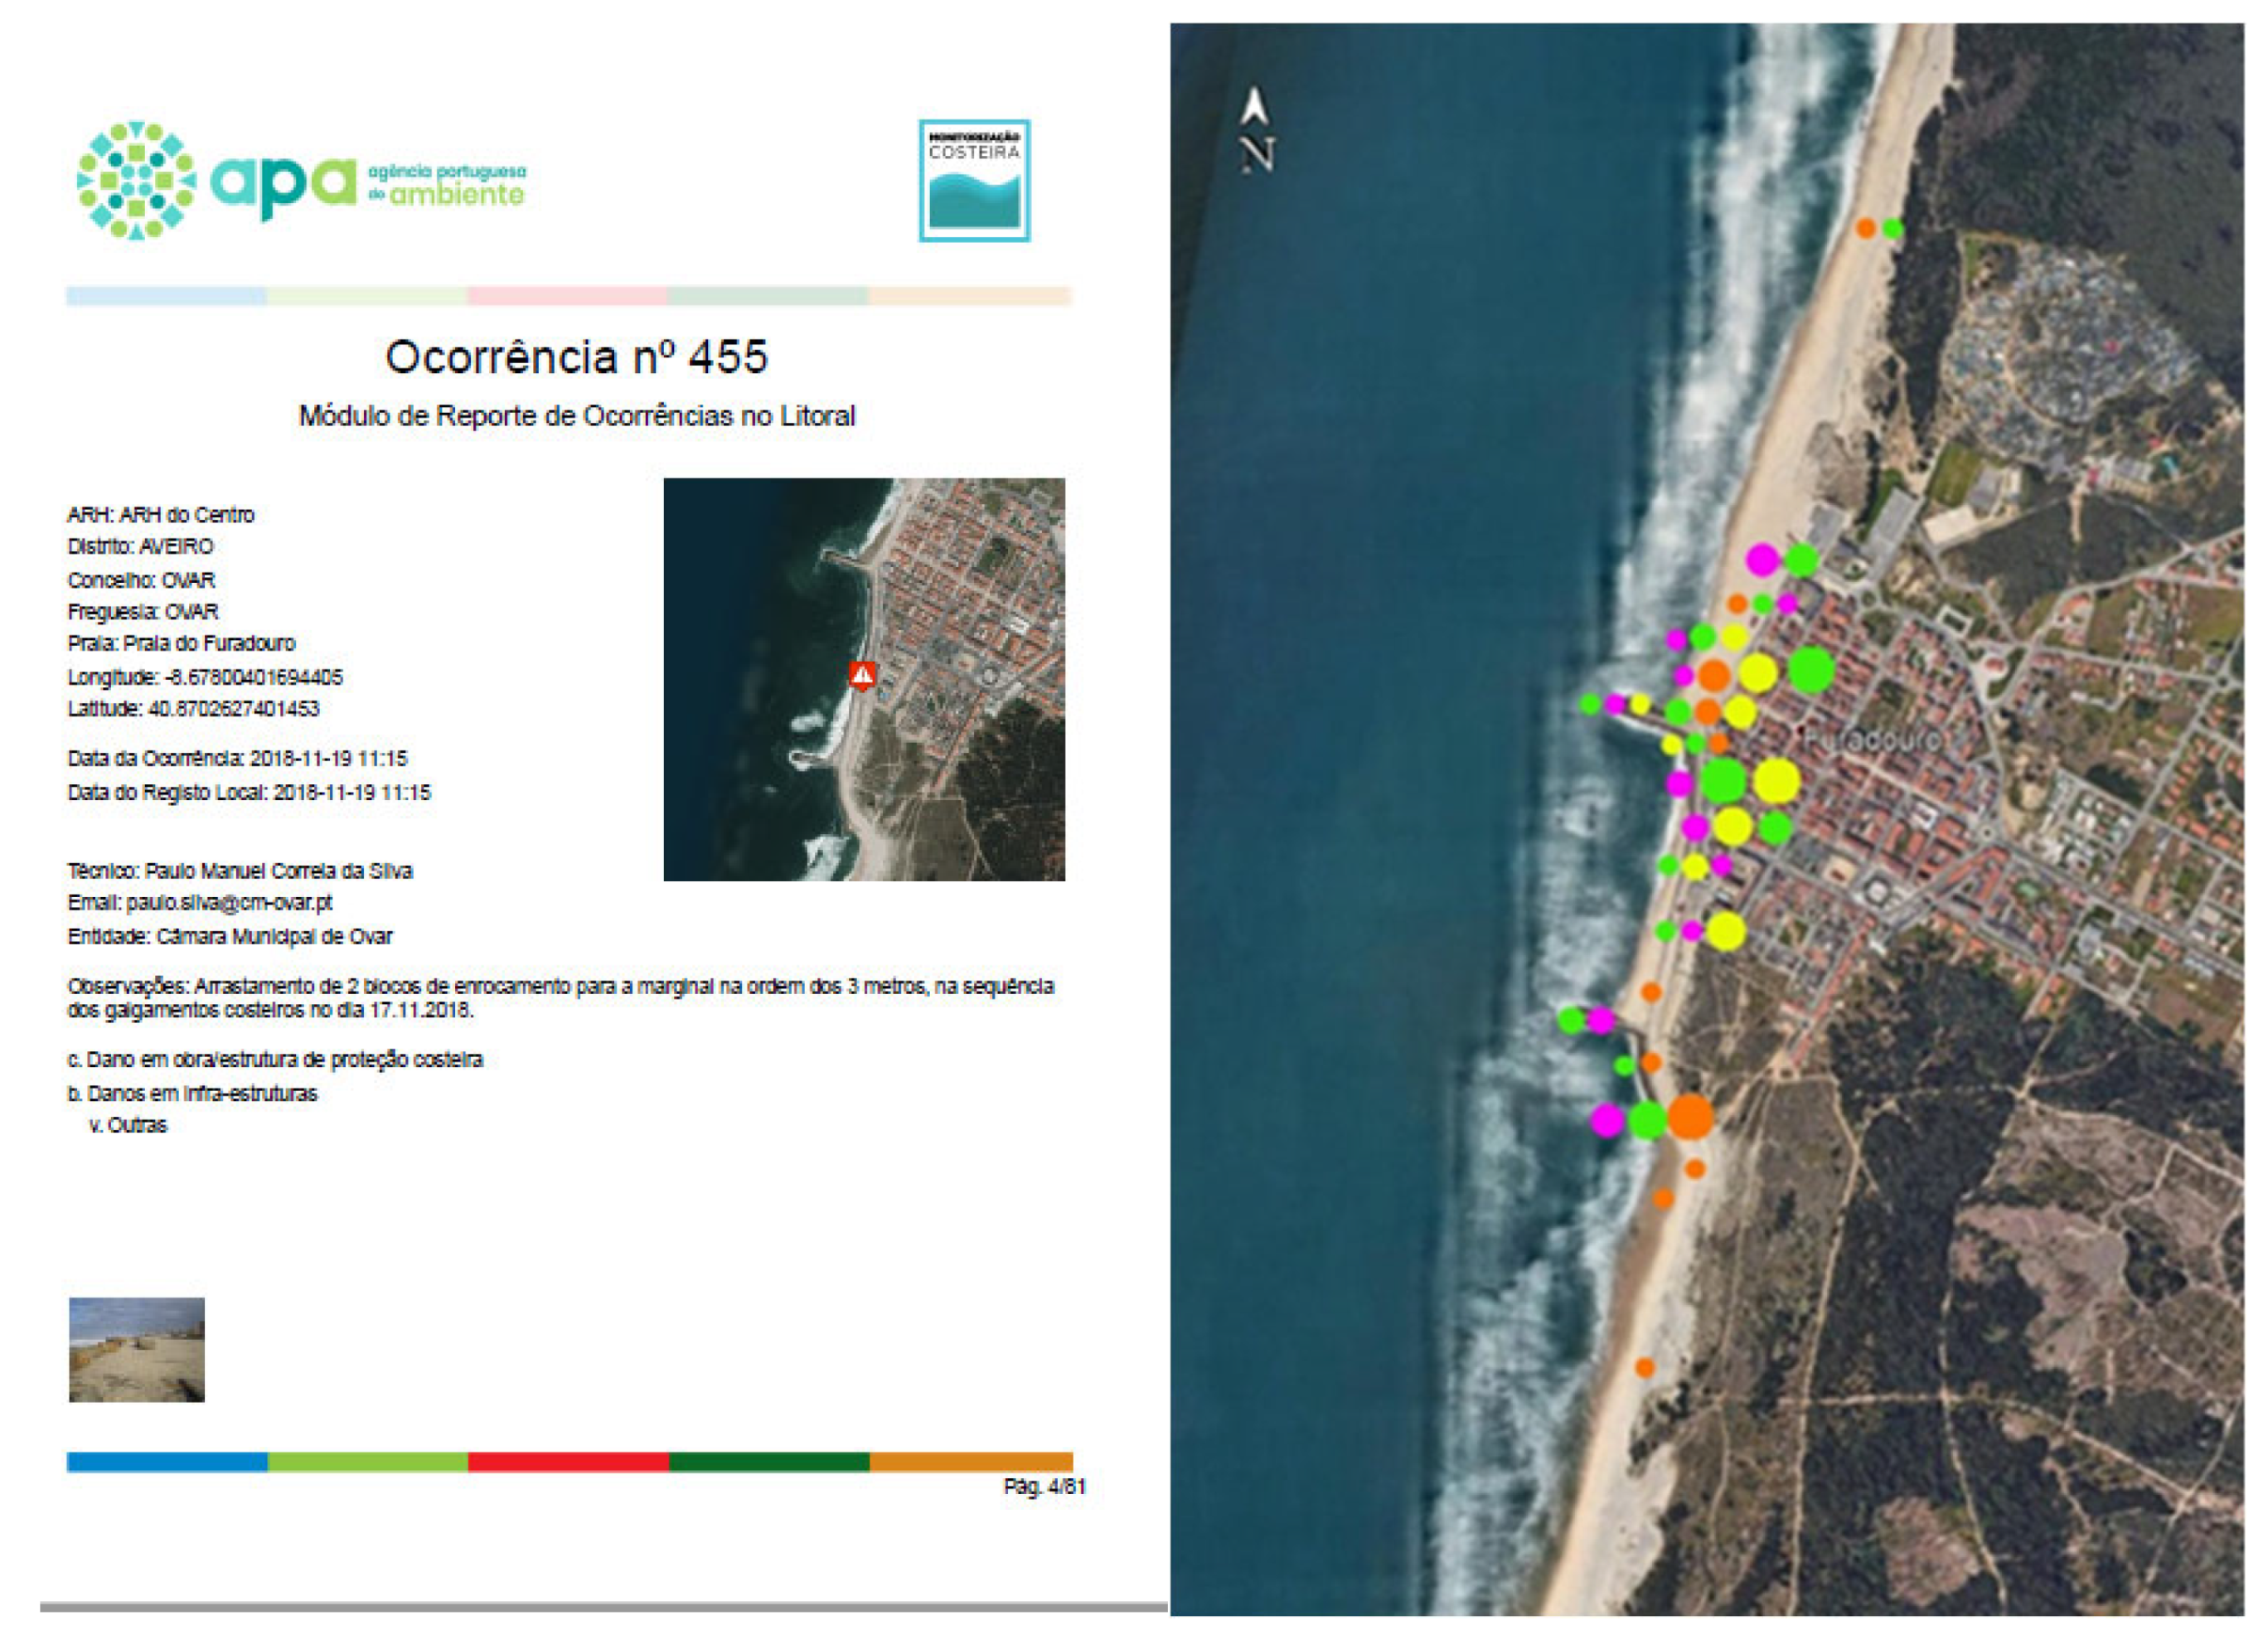
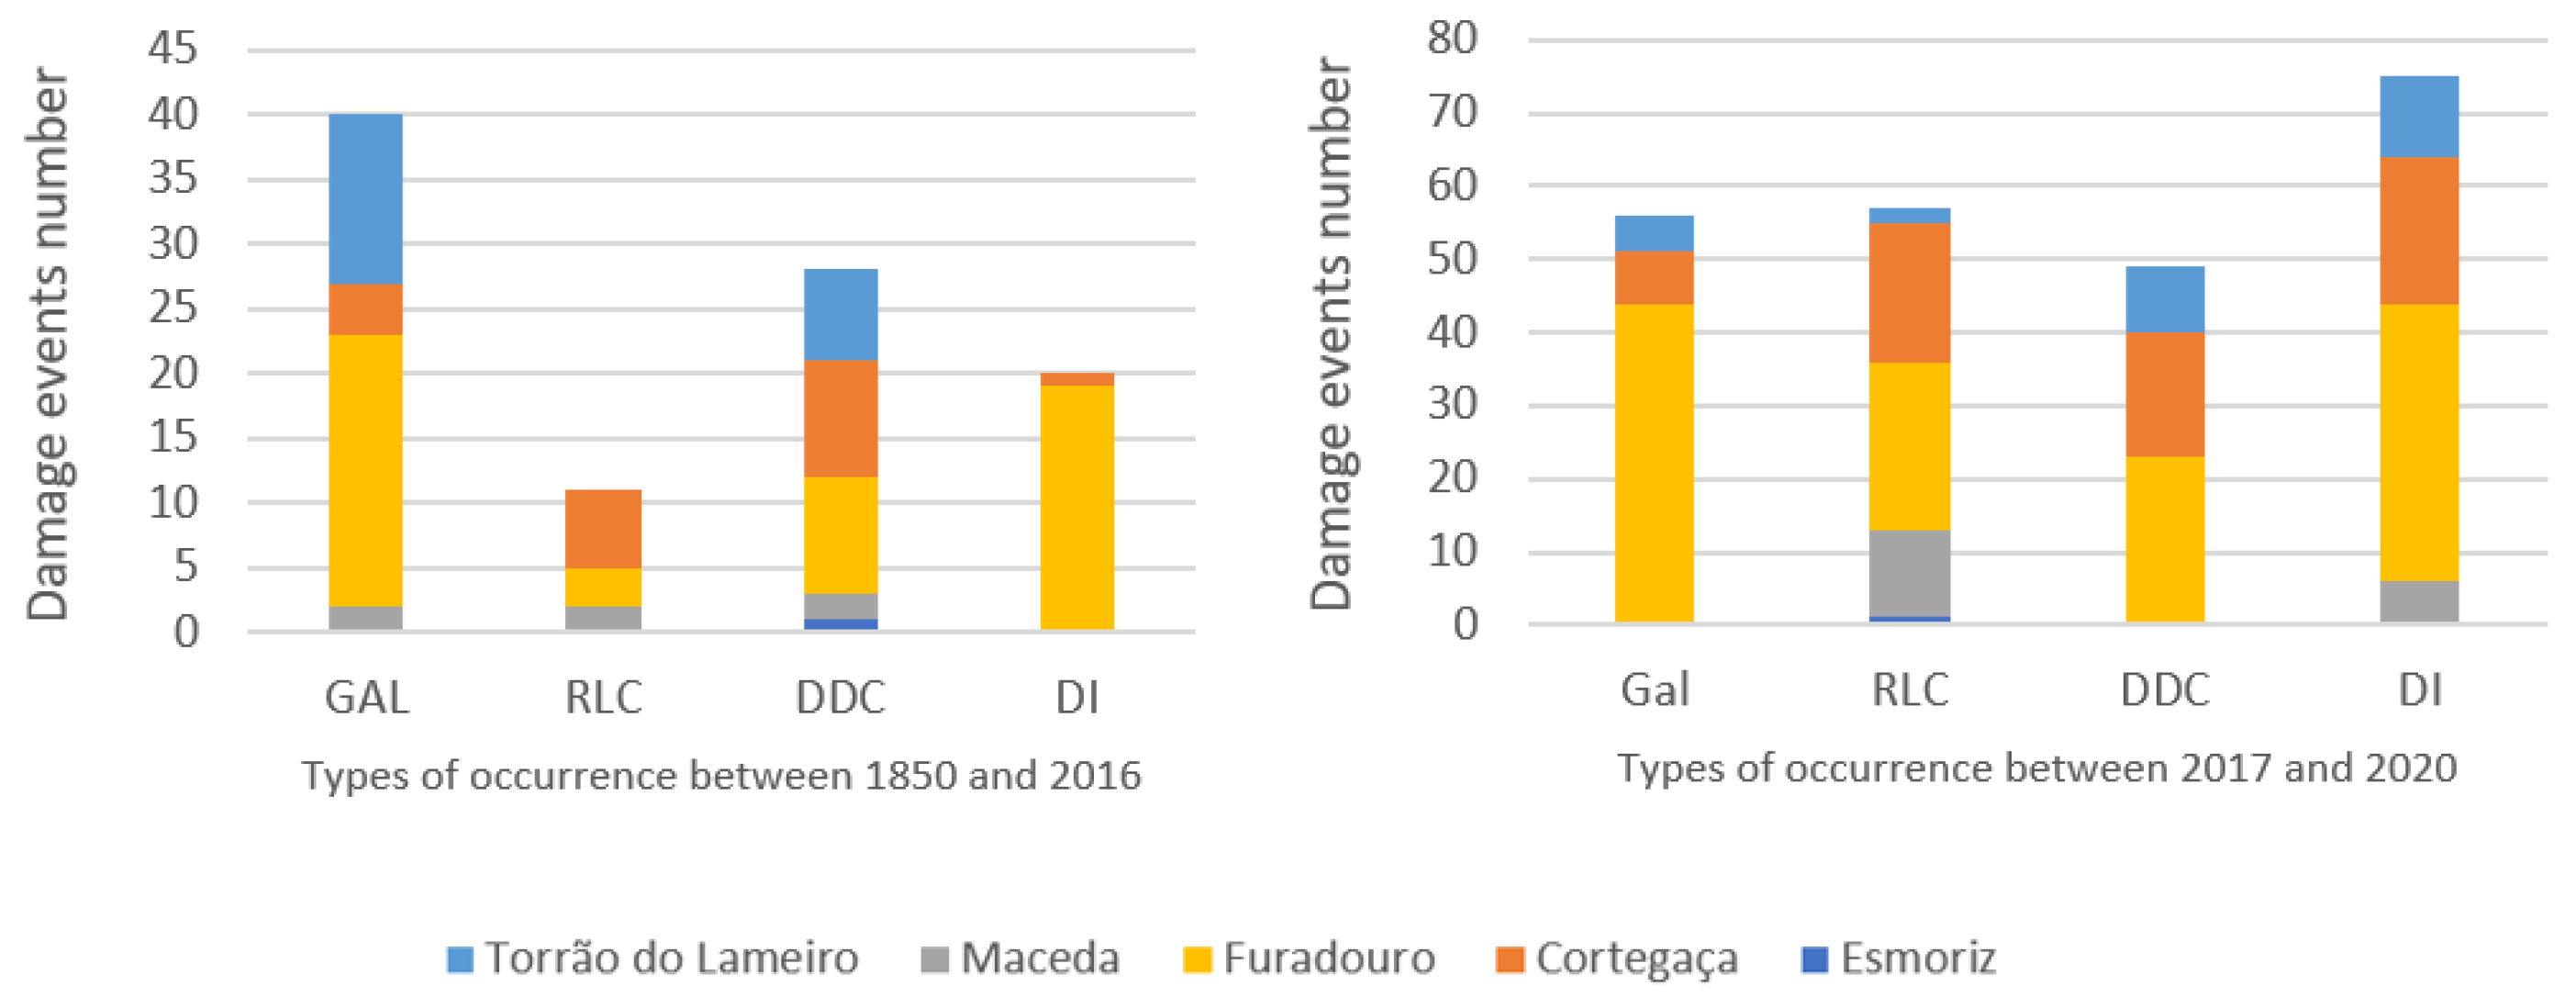
Damage events such as overtopping, flooding of public roads and facilities and damages on infrastructures along the study area are frequent. Five types of occurrences were distinguished [
44]: shoreline retreat (SR); overtopping (OV); dune system destruction (DD); damage to infrastructure (DI); and damage to coastal defence works (DC). Jesus [
49] updated this database and gathered the history of damage events related to wave climate at Ovar municipality coast between 1857 and 2020. Since mid-2017, this type of occurrence has been registered by the Portuguese Environment Agency (APA) in record sheets with flooding extension and the observed damages data within the scope of a monitoring program.
Figure 5 represents an example of these sheets and the location and type of the 44 events registered between 2018 and 2020 at Furadouro beach.
Figure 6 represents the number of occurrences by type and local distribution (Esmoriz, Cortegaça, Furadouro, Maceda and Torrão do Lameiro). Furadouro beach has the highest number of damage events of the Ovar municipality and a clear upward trend in the number of events is observed in recent decades.
Please note that, while the information about most historical events is scarce, this does not necessarily mean that the number of events is lower than that observed more recently [
44]. The older the event, the greater the difficulty in finding records. Similarly, when the damage event does not directly affect the population, it may be not reported. Given the lower population density in the past, it is also possible that some events have not been identified.
3.4. Reference Scenario
Considering the uncertainties related to sea water level and wave characteristics (offshore, nearshore and at breaking) to be applied in the formulas to estimate runup and overtopped discharges, 18 runup scenarios were defined (see
Table 3, where CD represents chart datum and MSWL represents mean sea water level). These scenarios correspond to combining three sea water levels (mean sea water level, +2.0 m CD, an intermediate situation, +3.0 m CD, and the maximum high tide, +4.0 m CD), with three situations of wave propagation (offshore wave climate,
, wave propagation considering the phenomena of refraction and shoaling,
, and the wave breaking, limiting the wave height due to depth,
, to a maximum height of
,
) and with the two levels of the structure crest level (the real crest level of the structure, +5.8 m CD, and the crest level of the existing wall in the longitudinal revetment, +6.7 m CD). The scenarios allowed comparison of overtopping formulation estimative with the APA records sheets between 2018 and 2020, which show 44 overtopping events registered at Furadouro beach.
In
Table 3, an overtopping event corresponds to at least one full day of overtopping waves, with a minimum of one day without overtopping between each event. Comparing the projected scenarios and the 44 overtopping events recorded by the APA at Furadouro beach between 2018 and 2020, it was considered that the runup scenario RS4 (mean sea level, +2.0 m CD, refraction and shoaling), with 57 overtopping events and 409 overtopping waves, is the scenario more suited to the study area. This option is due to the satisfactory approximation to the number of events really recorded and a reasonable number of overtopped waves when compared to scenario RS7, which overestimates the number of overtopped waves.
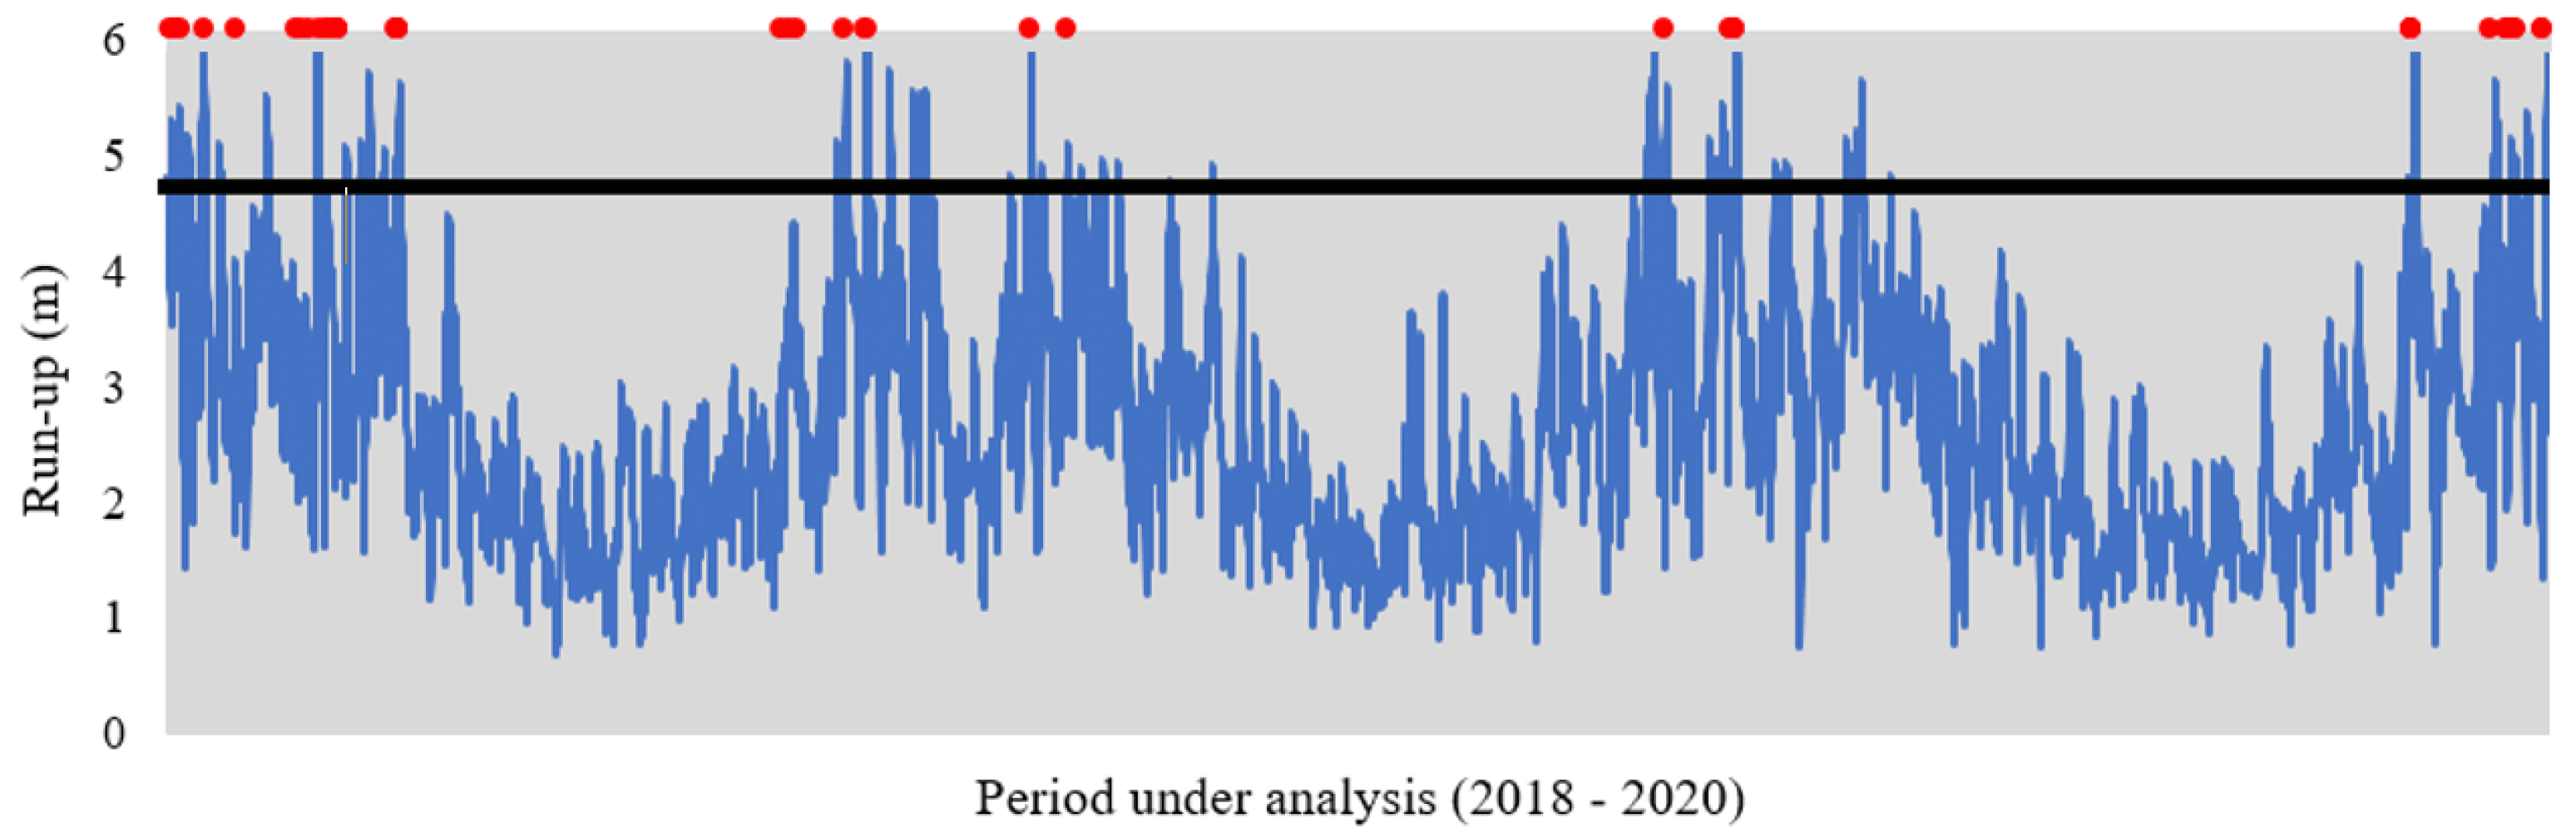
According to
Figure 1, the rocky revetment slope was defined as 30 degrees, the crest level was considered equal to +5.8 m (CD) and overtopping was assumed if the runup exceeded the top of the wall (+6.7 m CD) represented in
Figure 1, which corresponds to the black line level in
Figure 7. The red dots represent the 44 events registered between 2018 and 2020 at Furadouro beach (according to Portuguese Environment Agency data sheets). The results show a good convergence between the overtopping prediction when wave runup exceeds the crest of the wall (blue curve above the black line in
Figure 7, calculated according to Equation (1)) and the real events registered (red dots in the same figure, corresponding to overtopped waves). However, total convergence of results is not achieved. This is maybe due to the mean sea levels adopted at those moments when red dots are not coincident with overtopping predictions or due to inaccurate registration of the data sheets. However, for the intended goal of the approach, the results are not diminished by these missing results, as a good overall approximation is obtained (in
Figure 7, red dots are coincident with the main blue line peaks). Please note that future wave climate scenarios should also be in this range of uncertainty.
For the waves that result in overtopping, Equations (2)–(4) were applied to estimate the flooding volumes. If several consecutive waves result in overtopping, only one event was considered and the overtopped volume of each wave was added.
Table 4 represents the results and the relationship between the estimated flow and the observed consequences. The difficulty of adjusting formulas to the site-specific characteristics of the places where overtopping events occur may explain some of the discrepancies between flooding volumes and observed flood extension/damage.
As previously mentioned, a wave climate record of approximately 20 years provides enough data to project the future and to have a good representation of the past.
Table 5 shows the number of overtopping waves, the number of overtopping events and the overtopping discharge in each of the previously defined wave climate series, carrying out the entire process with the same sea water level and the same wave propagation phenomena considered in the reference scenario, RS4.
3.5. Costs Quantification
Table 6 presents the overtopping discharge volumes per year and the coastal structure maintenance costs at Furadouro (referred to in
Table 2) for the period between 2018 and 2020. To define the overtopping costs, the total cost of interventions between 2018 and 2020 (EUR 214,882) was divided by the total overtopped water volume in the same period (403 × 10
3 m
3/m), reaching a value of 0.53 EUR/m
3/m. As the mean overtopped volume per year in the historical series (895 × 10
3 m
3/m, see
Table 5) is higher than the average overtopped value between 2018 and 2020 (403 × 10
3 m
3/m), a proportion to the unit cost of overtopping was considered, assuming the representative final value of 0.25 EUR/m
3/m.
Based on Coelho et al. [
34] and data from the municipality of Ovar, as well as the Portuguese Environment Agency (APA), Cruz [
52] established a benchmark for rehabilitation costs of longitudinal revetments and the costs of repairing infrastructure due to the occurrence of overtopping. Cruz [
52] achieved values indicative of the unit cost of the material of 50 EUR/m
3 and estimated that around 200 × 10
3 EUR/year was spent in the past, in Furadouro. As this former value is similar to the values presented in
Table 6 (214,882 EUR/year), it is considered that this value (50 EUR/m
3) is representative of the future costs of intervention in the Furadouro coastal structure.
For longitudinal revetment maintenance costs, Lima et al. [
53] considered 30% of the initial cost every 5 years, which is equivalent to a maintenance cost of 6% per year. However, in the same study, overtopping was not considered, so it was decided to conservatively use 10% of the cost of the intervention as an annual reference value.
In summary, to apply the proposed approach, the value of 0.25 EUR/m3/m as unit cost of overtopping discharges, 50 EUR/m3 for the intervention cost and 10% of the initial cost per year for the maintenance cost were considered. Updated costs (Equation (5)) were calculated considering the constant discount rate of 3% in a 20 years’ time horizon.
4. Future Scenarios
This section aims to assess future overtopping scenarios (OS) at Furadouro over a 20-year projection (
Table 7). Thus, future wave and mean sea level under climate change effects (
Section 4.1), changes in the structure cross-section (
Section 4.2) and economic factors (
Section 4.3) are discussed by comparison with the reference scenario. The analysed scenarios considered changes in the sea water level or the wave climate and reinforcement of the structure characteristics by decreasing the slope or increasing the height of the crest. The uncertainty associated with the economic values defined in the reference scenario is also discussed by considering variations in the discount rate, overtopping and related flooding costs, intervention costs and the respective annual maintenance costs for scenarios OS7 to OS10.
4.1. Climate Change Impacts
Recent studies show that, for the case of no coastal protection or adaptation and a mean RCP8.5 scenario, there will be an increase of 48% of the world’s land area, 52% of the global population and 46% of global assets at risk of flooding by 2100. A total of 68% of the global coastal area flooded will be caused by tide and storm events, with 32% due to projected regional sea level rise [
54]. The authors of [
55] quantitatively assessed the risk in the overtopping performance of berm breakwaters due to sea level rise and the results indicated that the future design and maintenance of berm breakwaters need to consider the effects of SLR on the overtopping performance, especially in shallow water zones.
In Portugal, the local average sea level annual growth was 1.5 mm/year between 1882 and the 1990s [
56]; however, this value has been growing ever since. Between 1977 and 2000, the average sea level growth was 2.1 mm/year and, between 2005 and 2015, this value was 4.1 mm/year (Cascais tide gauge), and it is expected to continue to rise in the next years [
57]. The same work, based on Miranda and Santos [
58], concludes that climate change impacts in Portuguese coastal areas are related to the increase in frequency, duration and intensity of extreme events; the intensification of coastal erosion; and the rise in sea level and consequent retreat of coastline, which may lead to saline intrusion and high sedimentation in estuarine and lagoon areas.
Considering the above, the influence of climate change was analysed through two scenarios of average sea level (OS1 and OS2, based on [
59,
60,
61,
62]) and four scenarios of wave climate (OS3 to OS6), see
Table 7. The definition of the formulations’ forcing agents for future projections require assumptions on the climate change scenarios. It is important to keep in mind when planning integrated adaptation to climate change in coastal areas that the probability of occurrence of the various International Panel for Climate Change climate scenarios varies over time, representing important uncertainties.
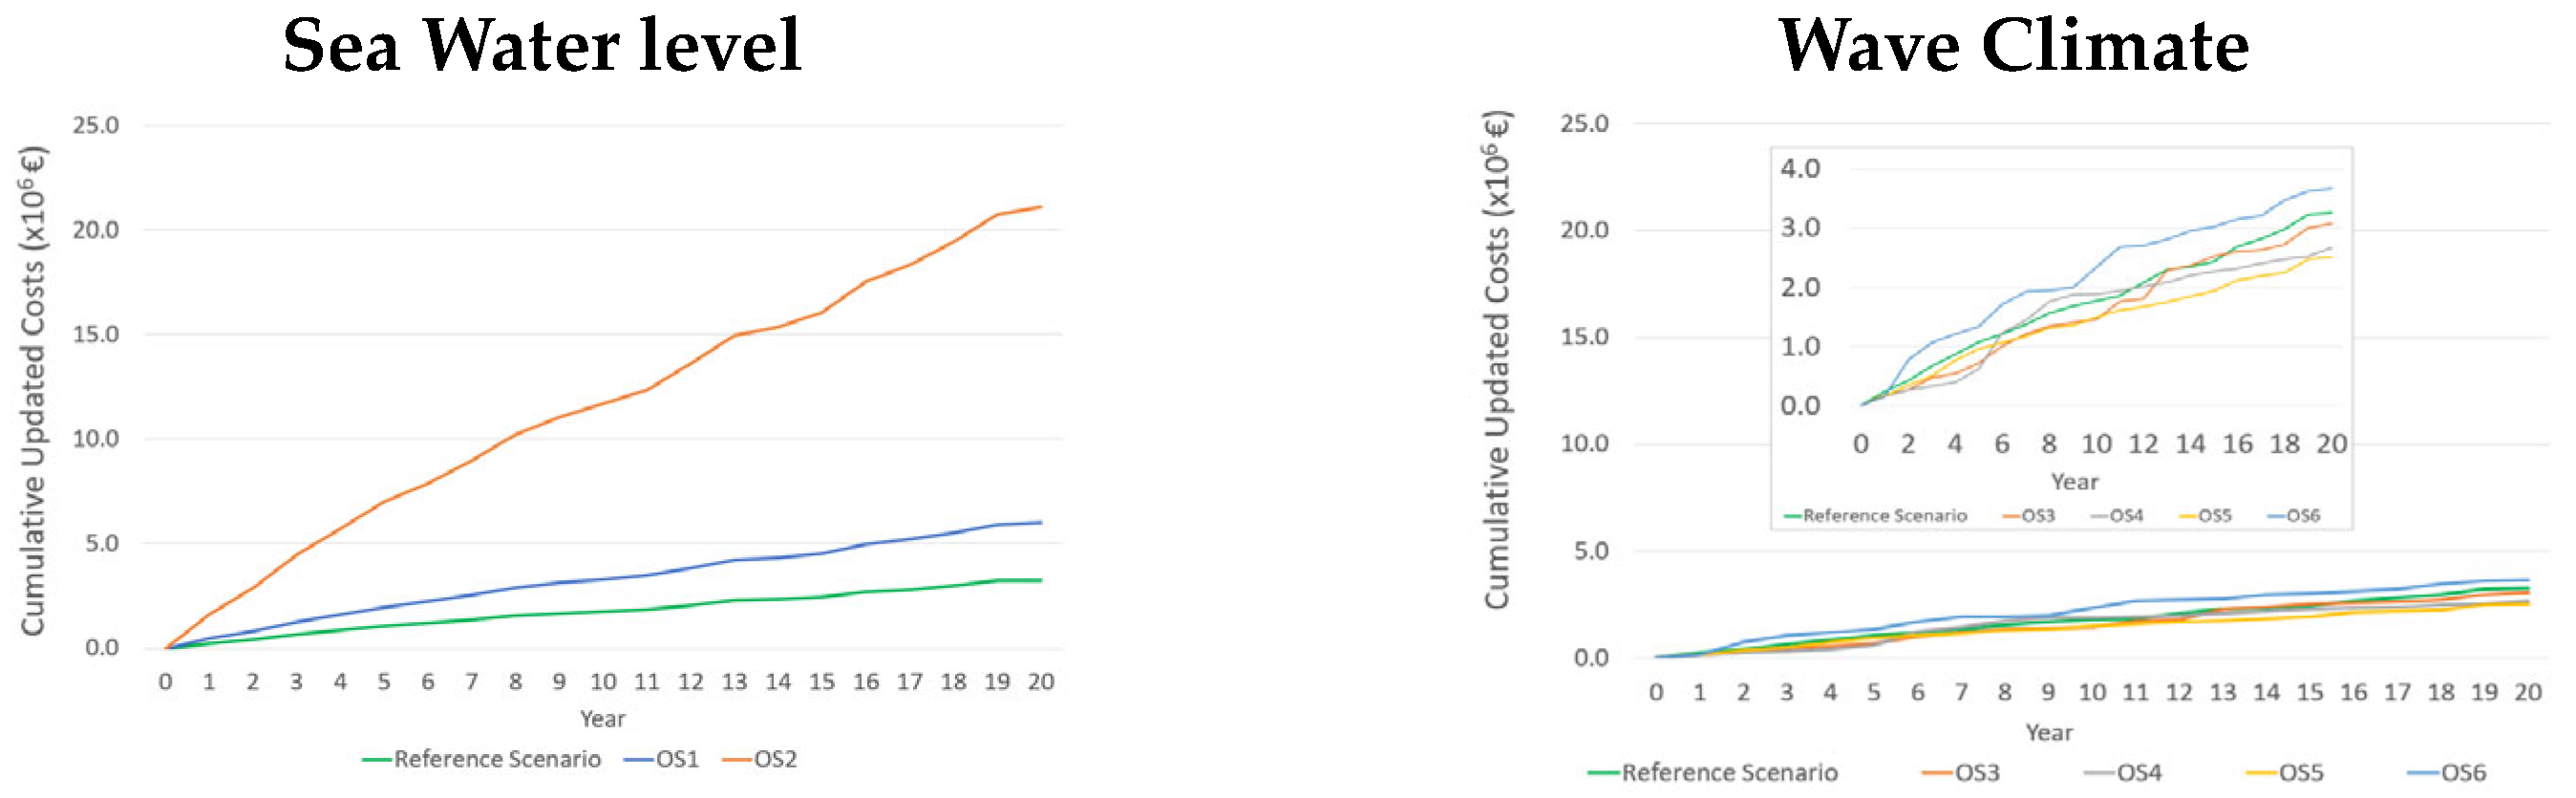
Table 8 shows the number of overtopping waves, the number of overtopping events, the overtopping discharge and corresponding cumulative updated costs (CUC) in each of the previously defined climate change scenarios, and
Figure 8 shows the evolution of the cost of each scenario over 20 years. Please note that the reference scenario in
Table 8 refers to the historical wave series.
4.2. Coastal Structure Interventions
In case of future sea level rise, crest heights should be increased significantly, which potentially leads to significant costs and environmental and societal consequences [
63]. So, two types of intervention scenarios in the characteristics of the longitudinal revetment (slope angle and crest level) were analysed in order to evaluate whether the reduction in the frequency of overtopping and the consequent costs can be optimized.
The reduction in the slope angle induces a decrease in the maximum runup level, decreasing the probability of overtopping (scenario OS7 and OS8,
Table 7). However, decreasing the slope of the structure extends it seawards, increasing its dimension, which implies more rocky material and higher costs (structure cross-section increases by 5.0 and 12.2 m
2, which results in intervention costs of around EUR 250 × 10
3 and EUR 610 × 10
3, respectively, for scenario OS7 and OS8). On the other hand, increasing the crest level allows a reduction in the number of overtopping events, which represent, respectively to OS9 and OS10 scenarios, an increase of 6.1 and 10.5 m
2 in the cross-section area of the structure, which results in intervention costs of around EUR 300 × 10
3 and EUR 530 × 10
3. It should be noticed that only the maintenance value related to the changed part of the structure was used, since the existing structure is common to all the scenarios. Eventual costs related to new negative visual impacts of the increased dimension of the structure were not considered.
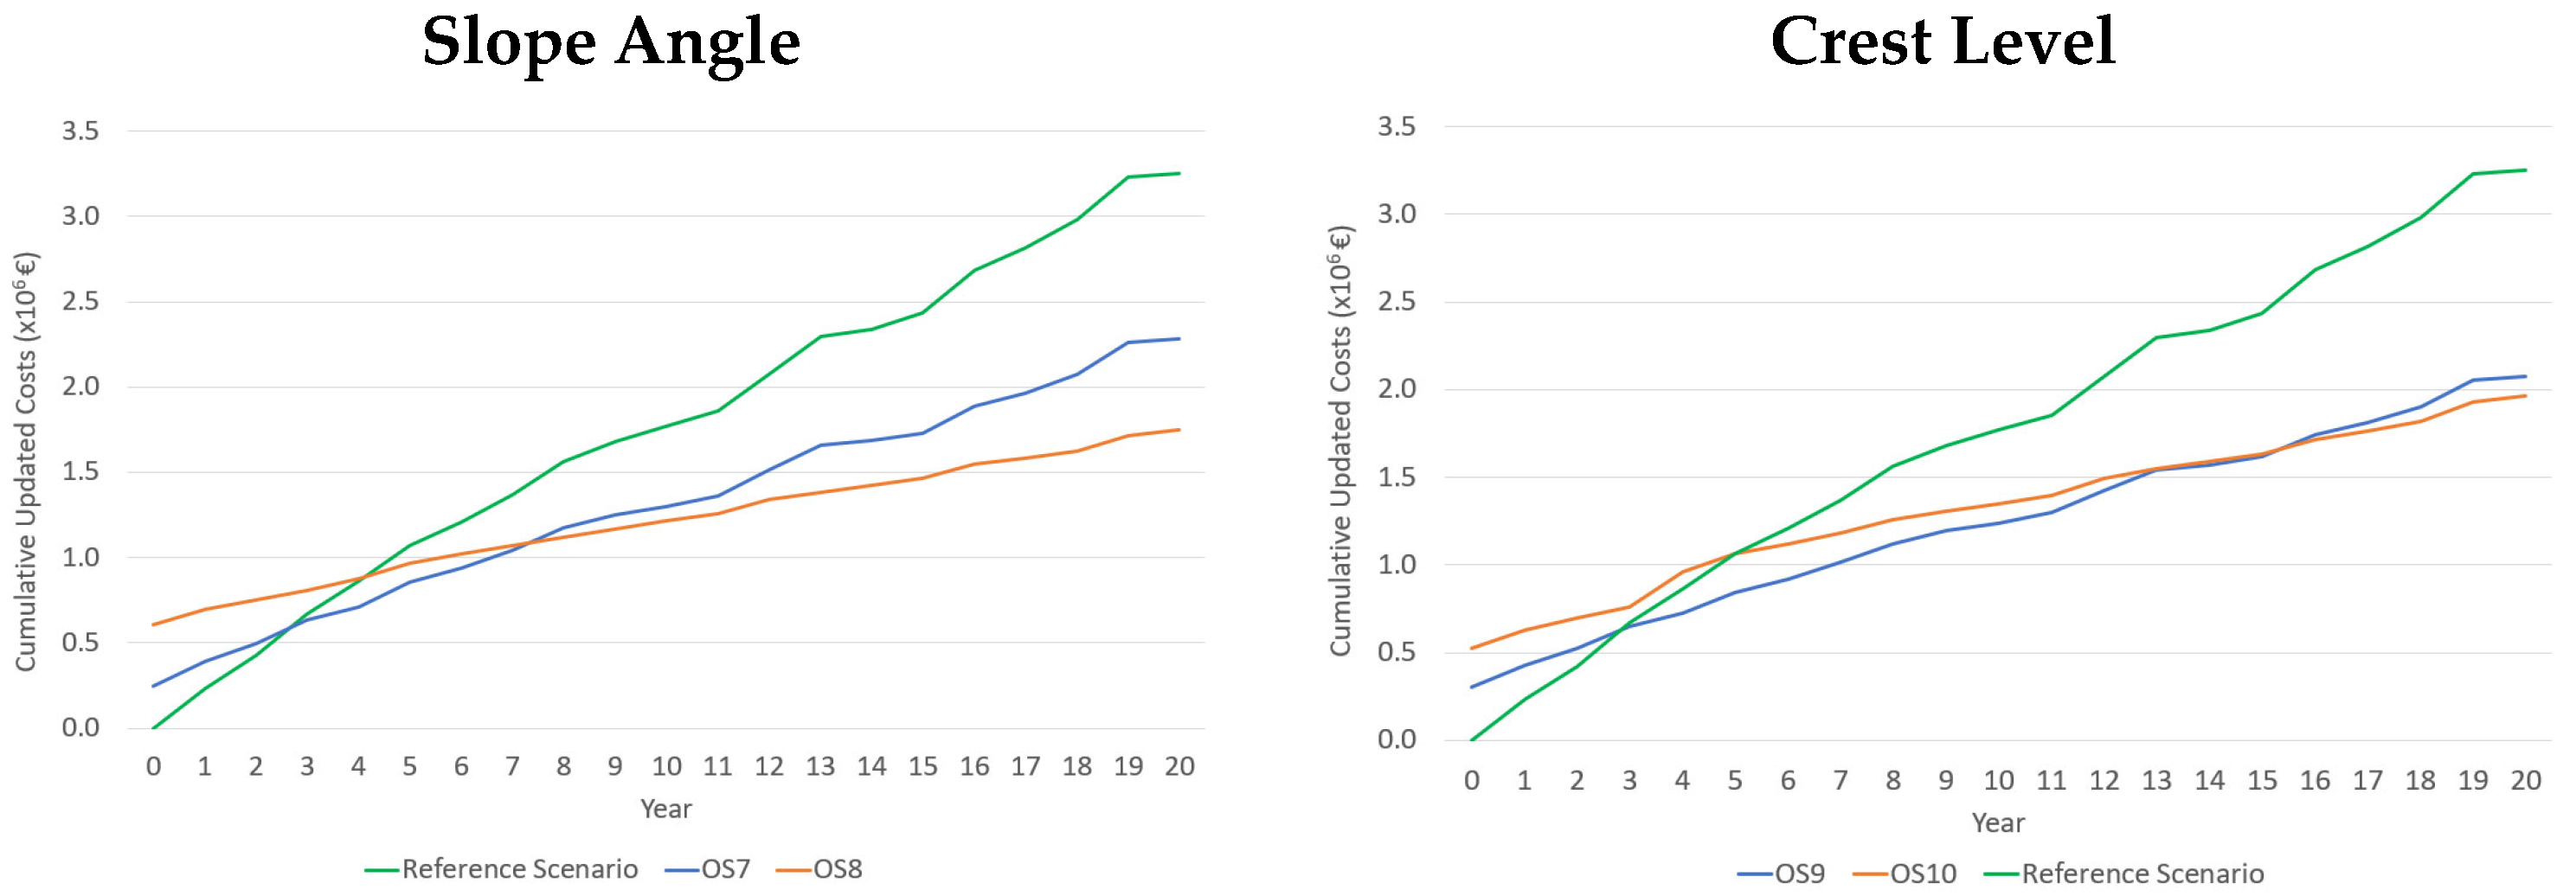
Table 9 shows the overtopping predictions and corresponding cumulative updated costs in each of the scenarios and
Figure 9 shows the cost evolution for each scenario over 20 years. Again, the reference scenario in
Table 9 refers to the historical wave series.
4.3. Economic Parameters Influence
The influence of the variation in the discount rate, overtopping costs, intervention costs and the respective annual maintenance costs for scenarios OS7 to OS10 was also analysed. In what concerns the discount rate, four different values other than the reference scenario (3%) were compared: 0%, 1%, 7% and 12%. With regard to the other economic parameters analysed (overtopping and flooding damages, intervention and maintenance costs), two additional different values were adopted: +50% and −50% of the reference scenario value.
Table 10 shows the cumulative updated costs in each of the economic scenarios considered.
4.4. Results Discussion
Two sea level rise scenarios were analysed: +0.50 m (OS1) and +1.50 m (OS2). The OS2 corresponds to the worst-case scenario, reaching an overtopping flow of around 110 million cubic meters per meter, which corresponds to a cost of around EUR 21 million at the end of the 20 years of analysis. The 0.50 m sea level rise corresponds to an overtopping flow of around 33 million cubic meters per meter and an associated cost of around EUR 6 million in the same 20 years. Thus, if no other measures are considered, the estimated impact of sea level rise as a result of climate change can increase the present overtopping and flooding damage costs by around 2 to 7 times. Four different scenarios of wave climate were also compared: two future series divided into two 20-year scenarios, short-term (OS3 and OS5) and long-term (OS4 and OS6). OS6 has the highest total cost over the 20 years analysis (EUR 3.7 × 10⁶), with an overtopping flow of 19.5 × 10⁶ m3/m, while OS5 is the least burdensome, with only 13.6 × 10⁶ m3/m, which corresponds to EUR 2.5 × 10⁶ of costs related to damages caused by overtopping and flooding. Uncertainty in future wave climate shows that overtopping-associated costs over 20 years could fluctuate between around EUR 2.5 and 3.7 million if no other interventions are adopted.
The structure slope in the reference scenario is 30 degrees; in scenario OS7, it decreased by 5 degrees and, in scenario OS8, it decreased by 10 degrees, extending the structure seawards. Naturally, results show that the OS8 scenario is the one with the lowest overtopping flow over the 20 years of analysis (about 1.37 × 10
6 m
3/m). Since extending the structure’s slope increases its dimension, which implies more material and higher costs, the reference scenario is the least expensive up to the third year, becoming the scenario with the most associated costs from the fourth year onwards (
Figure 9). The OS8 scenario is the most expensive up to the third year of the analysed period (due to the higher first investment costs) but, from the eighth year forward, it is the most attractive scenario, with around EUR 1.75 × 10
6 costs at the end of the studied period. It should be referred that, in the OS8 scenario, the costs are mostly related to the maintenance of the longitudinal revetment, since, in 12 of the 20 years analysed, there are no overtopping events predicted. Note that, in this analysis, any impacts on the dimension of the beach in front of the structure were not considered in the long term.
Two scenarios were analysed, increasing the top level of the structure by 1 and 2 m, respectively, OS9 and OS10. Increasing the crest level by 2 m instead of 1 m reduces the number of overtopping waves and the number of overtopping events, bringing the overtopping discharge to less than one third of the OS9 scenario (reduction of 5.45 × 10⁶ m3/m, OS9, to 1.44 × 10⁶ m3/m, OS10). The reference scenario presents the most effective cost–benefit ratio up to the third year, and, in this period, the worst-case scenario is OS10. Between the third and ninth years, the most attractive scenario is OS9. From the ninth year onwards, the scenario with the lowest associated cost is OS10, with the reference scenario being the one with the highest cost since the third year (at the end of the 20 years analysis, it exceeds twice the cost of OS10). The results allow it to be concluded that, in the long term, increasing the crest level is economically more advantageous, despite the higher initial investment cost.
Four different discount rate values (0%, 1%, 7% and 12%), different from the reference scenario (3%), were also compared for sensitivity analysis to economic considerations. The scenario with the best cost–benefit ratio is OS9, with a discount rate of 12% (about EUR 1 × 10⁶), and the worst scenario is OS7, with a discount rate equal to 0% (about EUR 3 × 10⁶). Thus, lower discount rate values induce higher costs after 20 years of analysis. Related to overtopping and flooding damage unit cost, two values were considered, allowing discussion on the uncertainty of its evaluation: 0.12 EUR/m3/m and 0.37 EUR/m3/m, respectively, −50% and +50% of the value considered for the reference scenario (0.25 EUR/m3/m). A difference in behaviour between scenarios was observed, since either for the reference value (0.25 EUR/m3/m) or for +50%, the OS7 scenario is economically more onerous than the OS8 scenario but, when considering the value of −50%, the situation is reversed. The coastal intervention cost was also evaluated, with values between 25 EUR/m3 (50%) and 75 EUR/m3 (+50%). In this comparison, the reference scenario is the one with the highest damages and consequent costs. The sensitivity analysis to the structure slope costs shows that the best scenario is OS8, with a 50% decrease in rocky material construction cost (with a cumulative updated cost over the 20-year horizon of EUR 993 × 103), while, in the sensitivity analysis to the crest level elevation costs, the best scenario is OS10, also with a reduction in the rocky material construction cost (EUR 908 × 103). Finally, two scenarios of coastal structure maintenance costs were compared, considering 5% and 15% of the reference maintenance cost. The results present similar scenario behaviours. The crest level intervention cost increase of +50% shows that the cumulative updated costs at the end of the 20-year horizon obtained are very similar (EUR 1.97 × 10⁶ for OS9 and EUR 1.96 × 10⁶ for OS10).
5. Conclusions
The high maintenance costs of longitudinal revetments, caused by overtopping and flooding events, require improved knowledge of their performance. Thus, this work aimed to improve the evaluation of the overtopping and flooding impacts and their related costs through an approach that combines the estimative of wave runup, overtopping events over the coastal structure and costs caused by flooding damages. The proposed methodology makes it possible to better understand those costs in artificialised coastal areas, which fills a knowledge gap regarding the structural cross-section design in a medium- to long-term perspective. Supported by a systematic procedure that quantifies the overtopping and flooding damage costs and the coastal intervention costs, it is possible to optimise the predesign of the coastal structure, following several simple steps: (1) definition of the past period for the analysis; (2) characterisation of local wave climate; (3) collection and characterisation of past damage events and related costs; (4) definition of a reference scenario; (5) definition of the time horizon of analysis; and (6) forecasting of overtopping future costs in different scenarios. Note that the methodology is not dependent on runup and overtopping formulae used, which must be adapted to each specific situation.
By evaluating data recorded by the Portuguese Environment Agency, APA, a real case study on the Portuguese northwest coast (Furadouro beach, at Ovar municipality) was analysed. The 10 future scenarios presented allowed discussion of climate change impacts and cross-section changes in the existent structure. A sensitivity analysis of economic parameters, by varying the discount rate, overtopping and flooding damage costs, coastal structure intervention costs and the respective annual maintenance costs, was also performed.
The proposed approach for future projections allowed a better understanding of the uncertainties associated with climate change impacts and the influence of longitudinal revetment structural changes on the overtopping frequency and their related costs. Results show that the impact of the sea level rise as a result of climate change, if no other measures are taken, can increase the overtopping costs by around 2 to 7 times. On the other hand, uncertainty in future wave climate shows that costs associated with overtopping over 20 years can fluctuate between around EUR 2.5 and 3.7 million if no other interventions are adopted. A reduction of 10 degrees on the slope of the existent longitudinal revetment means that, in 12 of the 20 years of analysis, there are no predictable overtopping events, considering the present wave climate conditions. Although the extended slope of the structure increases its dimension, which implies more material and higher initial costs, the corresponding scenario still presents the lowest cumulative updated cost over the 20-year horizon. Increasing the crest level of the revetment is economically more advantageous, despite the higher initial investment. Finally, the sensitivity analysis to structure economic parameters’ influence, in general, showed similar behaviour between scenarios, which increases the confidence in the methodology, in spite of the natural difficulties in evaluating some of the required parameters. However, when looking at the overtopping and flooding damages unit cost, there is a difference in behaviour between scenarios, since, either for the reference value or for +50%, the scenario with the steepest slope is economically more onerous but, when considering the value of −50%, the situation is reversed. This highlights the importance of considering and quantifying the flooding damage costs when performing the optimised predesign of a coastal structure.
In fact, there is still a great deal of uncertainty related to the quantification of costs. Overtopping and flooding damage costs were estimated based on data available for Furadouro beach between 2018 and 2020, which is a short period of time. Thus, an attempt should be made to mitigate this uncertainty with the help of the entities responsible for coastal management, identifying real values in more extensive data series. Finally, it is important to note that this work only intends to assess the cost of the longitudinal revetment and the respective overtopping and flooding damages, without considering the effect on the shoreline evolution and its impacts. Integrated coastal zone management needs these studies to ensure sustainable coastal zones, mitigating erosion and climate change effects with optimised solutions that allow better performances at lower costs [
60,
64,
65,
66]. Despite the relationship between the discharged volumes in flooded areas and their damage costs being site-specific, the results of this study can be used as guidelines for future economic-assessment studies on overtopping adaptation measures.


