1. Introduction
In recent years, the mismatch between supply and demand of irrigation water resources has become increasingly serious [
1,
2]. Simultaneously, seasonal drought is becoming increasingly common and agricultural irrigation is increasingly reliant on ponds [
3]. Irrigation ponds are a type of water-supply structure that is small in size, and are also referred to as on-farm irrigation tanks or on-farm reservoirs. These structures are widely distributed in Southern China, Southern India, and Sri Lanka [
4,
5,
6,
7]. The ponds play an important role in decreasing peak flow in main irrigation channels, reallocating water in irrigation districts, enhancing water-efficient irrigation, and supplying water for crop production [
2,
4,
8,
9,
10,
11,
12,
13]. Ponds in Southern China not only capture surplus water from the irrigation system and agricultural return water from upstream fields, but also supply water to downstream fields [
9,
10,
14]. The water provided by ponds for irrigation accounts for over 60% in the Zhanghe Irrigation District (ZID) [
3].
For irrigation water allocation, controversial and conflict-laden water-allocation issues have raised increasing concerns in recent decades [
15,
16,
17,
18]. Many models and methods have been developed for agricultural water management and planning. Specifically, Du
et al., Zhou
et al., and Shangguan
et al., used models of deficit irrigation and uncertainty to determine the optimal allocation in a multi-source and multi-crop irrigation area [
19,
20,
21]. Li
et al., and Huang
et al., constructed two-stage water allocation models for irrigation water sustainability and planning [
22,
23]. Zhang proposed a multi-objectives allocation model with Particle Swarm Optimization (PSO) algorithm to develop an irrigation schedule for a winter wheat-summer maize rotation system [
24]. Zhang
et al., used a large system level transfer model to optimize the regional agricultural water allocation [
25]. Sarwar and Eggers used a conjunctive model to evaluate alternative management options for surface and groundwater resources [
26]. Other models based on simulation techniques and genetic algorithms with computer modeling have been widely applied in irrigation water resources allocation [
27,
28]. Remote sensing technology is gradually being incorporated as an assisting tool for irrigation water management by estimating crop water use, evapotranspiration, and soil moisture conditions [
29,
30,
31].The above models and methods mostly focus on the goals of maximizing the economic benefits, optimizing the multiple-objectives of the irrigation system, and minimizing the ratio of relative water deficiency, but they do not take ponds into consideration or regard ponds as just supporting resources. This causes distorted estimates of the irrigation water allocation strategy failure by ignoring the important role of ponds in the water supply.
Therefore, this study proposes a new irrigation mode, the channel-pond joint water supply mode (CPJM), which is a water resource allocation mode that combines channel water supply (CWS) and pond water supply (PWS) to determine the irrigation water supply strategy. Then, the corresponding risk analysis of the mode was obtained. Since the failure of the mode is caused by the interaction of multiple factors, a single variable-based analysis is unable to reflect the relationships among the multiple factors. Consequently, the results derived from a one-dimensional analysis tend to distort the physical mechanisms involved in the irrigation system. To describe the relationships among multiple variables, many methods have been introduced in hydrologic studies, e.g., multivariate normal distribution function [
32,
33,
34,
35], exponential distribution [
36], Gamma distribution [
37], two-dimensional normal distribution, and two-dimensional Gumbel distribution [
32,
38]. However, all of these multivariate distribution functions assume certain requirements in terms of the marginal distribution of variables; thus, the partial distortion of information is inevitable [
39]. Moreover, new ideas and methods have played an important role in water allocation risk analysis. For example, Zhang proposed a risk analysis model involving two phases of environmental and public demand during the program period [
40]. Gu
et al., performed a multi-objective risk assessment of the optimal deployment of water resources based on stochastic simulations [
41]. Additionally, Guo
et al., demonstrated the risk of water resource allocation using indices based on the entropy principle [
42].However, the literature summary of the risk analysis of water resource allocation lacks quantitative descriptions and the research focuses more on the effects of configuration schemes than on the risk ratio calculation.
Recently, copula theory has been widely applied in constructing joint probability distributions of multivariate data. It provides a general and flexible way to model nonlinear dependences among multivariate data in isolation from their marginal distribution functions [
43]. A copula-connected function in which the marginal distribution is stochastic offers us an available solution to describe the relationships between different factors [
44,
45]. This technique has been widely applied in multivariate hydrological calculations and analyses [
46,
47,
48,
49,
50,
51,
52,
53,
54,
55,
56,
57,
58,
59,
60,
61]. On the agricultural side, Cisty
et al., and Mirabbasi
et al., introduced a bivariate copula methodology to describe the characteristics and probability of drought [
62,
63]. Shiau and Modarres used a copula-based distribution function for drought severity, duration and frequency analysis [
64]. Wang
et al., constructed a trivariate copula-based model to analyze annual extreme rainfall events in Connecticut [
65]. Rauf and Zeephongsekul used non-parametric copulas and marginal distributions to describe rainfall severity and duration in water resource management [
66,
67]. However, the risk analysis of the irrigation water allocation strategy is rarely conducted using copula theory.
Therefore, the objective of this paper is to propose a new irrigation water-use mode, the CPJM, and estimate the failure probability of the mode with copula-based approaches. In
Section 2, the methodology and procedures are explained and illustrated in detail. In
Section 3, the CPJM is applied to the second channel in the ZID as a case study.
Section 4 describes the results and provides a corresponding discussion. Finally, the conclusions are summarized in
Section 5. The CPJM can satisfy the irrigation demand and offer technical support for pond engineering construction and water management.
3. Case Study
3.1.Study Area Background
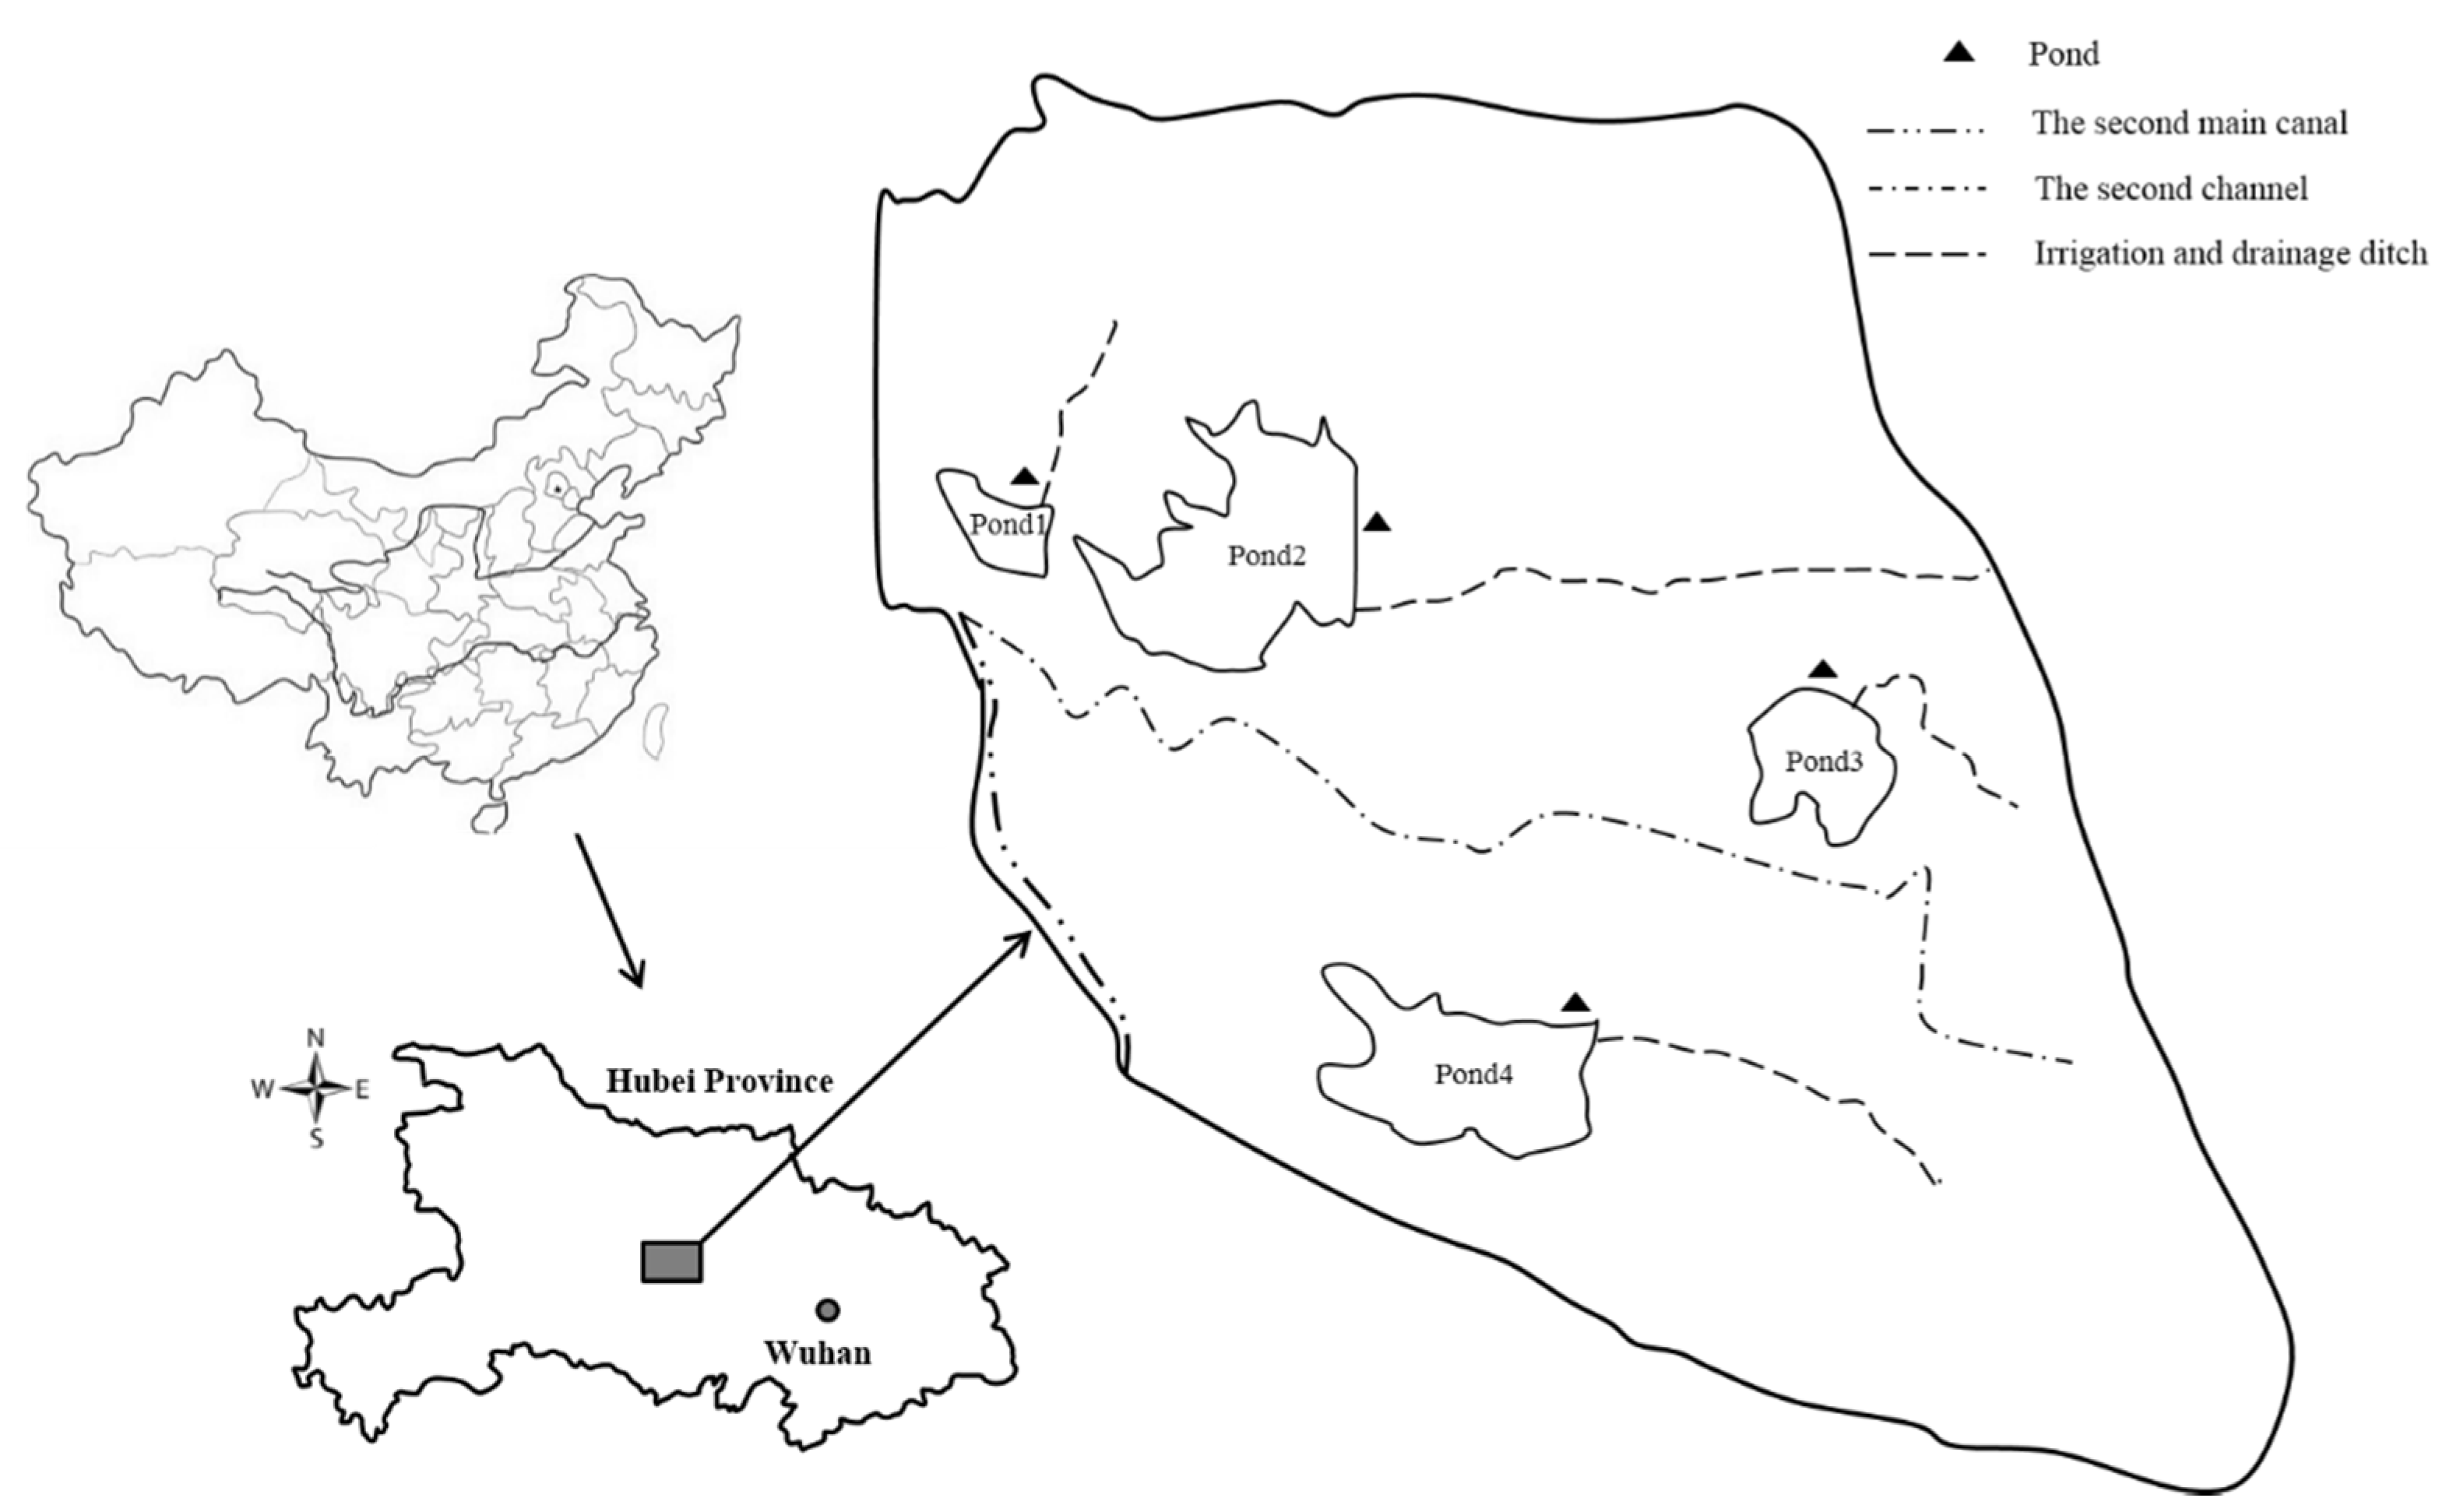
The second channel in the ZID was chosen as the study object (
Figure 1). The ZID in the Yangtze River basin, China, has drawn international attention for its success in sustaining rice production despite the dramatic reallocation of water for domestic, industrial, and hydropower uses. Considerable research has also been conducted to study the performance of irrigation tanks as supplemental irrigation sources and to study agricultural non-point source pollutants [
5,
9]. This irrigation district is located in a subtropical monsoon region with an average annual rainfall of 905 mm. The controlled irrigation area is 504 hm
2, and the majority of the water consumption is for paddy rice. Early rice, semi-late rice, and late rice are cultivated in this district and cover areas of 142 hm
2, 310 hm
2, and 176 hm
2, respectively. This study is based on data observed during 1981–2010 by the Tuanlin Climate Observation Station and CWS data measured during 1981–2010.
The observed rainfall data from 1981–2010 are ranked in descending order, and the empirical probability can be estimated with the Weibull formula. Hydrological years with frequencies of 50%, 75%, and 95% (namely, the years 2006, 1990, and 2010, respectively) are selected to represent three types of typical situations, i.e., normal, dry, and extremely dry years, by assuming that the historical hydro-climatic conditions would occur again in the future. The pond water supply frequency (PWSF) in the selected typical years is 17.86%, 67.86%, and 28.57%, respectively, and the corresponding channel water supply frequency (CWSF) is 42.86%, 89.29%, and 53.57%, respectively. The results suggest inconsistency in the water supply frequency and rainfall frequency. Thus, an irrigation water strategy failure analysis based on different water supply frequencies is essential.
3.2. Determination of Pond Water Supply
Since the research region is located in an irrigation district in Southern China, the water transformation mechanism is complex. Though ponds are an important irrigation water resource, measured PWS data is scarce. The storage period of a pond is defined as the period between the second day of the last irrigation of the year and the day before irrigating the field in the following year, and the water storage of a pond can be determined by the water balance equation, which is assumed to be the initial supply capacity.
Combining the irrigation schedule of paddy rice with the climate data, the PWS can be calculated day by day, thereby determining the annual PWS during 1981–2010. The pond water storage can be calculated according to the following water balance as follows:
where
and
are the pond water storage of day
t+1 and
t in m
3, respectively;
is the incoming water entering the pond on day
t in m
3;
is the wasted water of the pond on day t in m
3;
is the water evaporated from the pond on day t in m
3, which is obtained by multiplying the measured data an E-601 evaporation pan by the water evaporation conversion coefficient of Yichang Station; and
is the leakage amount of the pond in m
3, which is assumed to be constant in this paper, as it is difficult to monitor.
The water quantity in pond is defined as on day t, the rainfall is , the irrigation amount is , and the total seepage amount of the farmland is, which is assumed to be constant. The variables herein are all in m3. Therefore, the water supply constraints of ponds can be described as follows:
If the water quantity of the pond and rainfall is greater than the quantity of the irrigation water demand and seepage, the relational expression can be described as . In other words, if the water supply by pond and rainfall can meet the water demand, then PWS is . In other words, if , PWS is ,based on the water use strategy described previously.
The PWS of early, semi-late, and late rice during the whole growth period can be calculated based on the cumulative daily water supply, and the annual PWS during 1981–2010 can thereby be obtained.
3.3. Optimization of Marginal Distribution and Copula
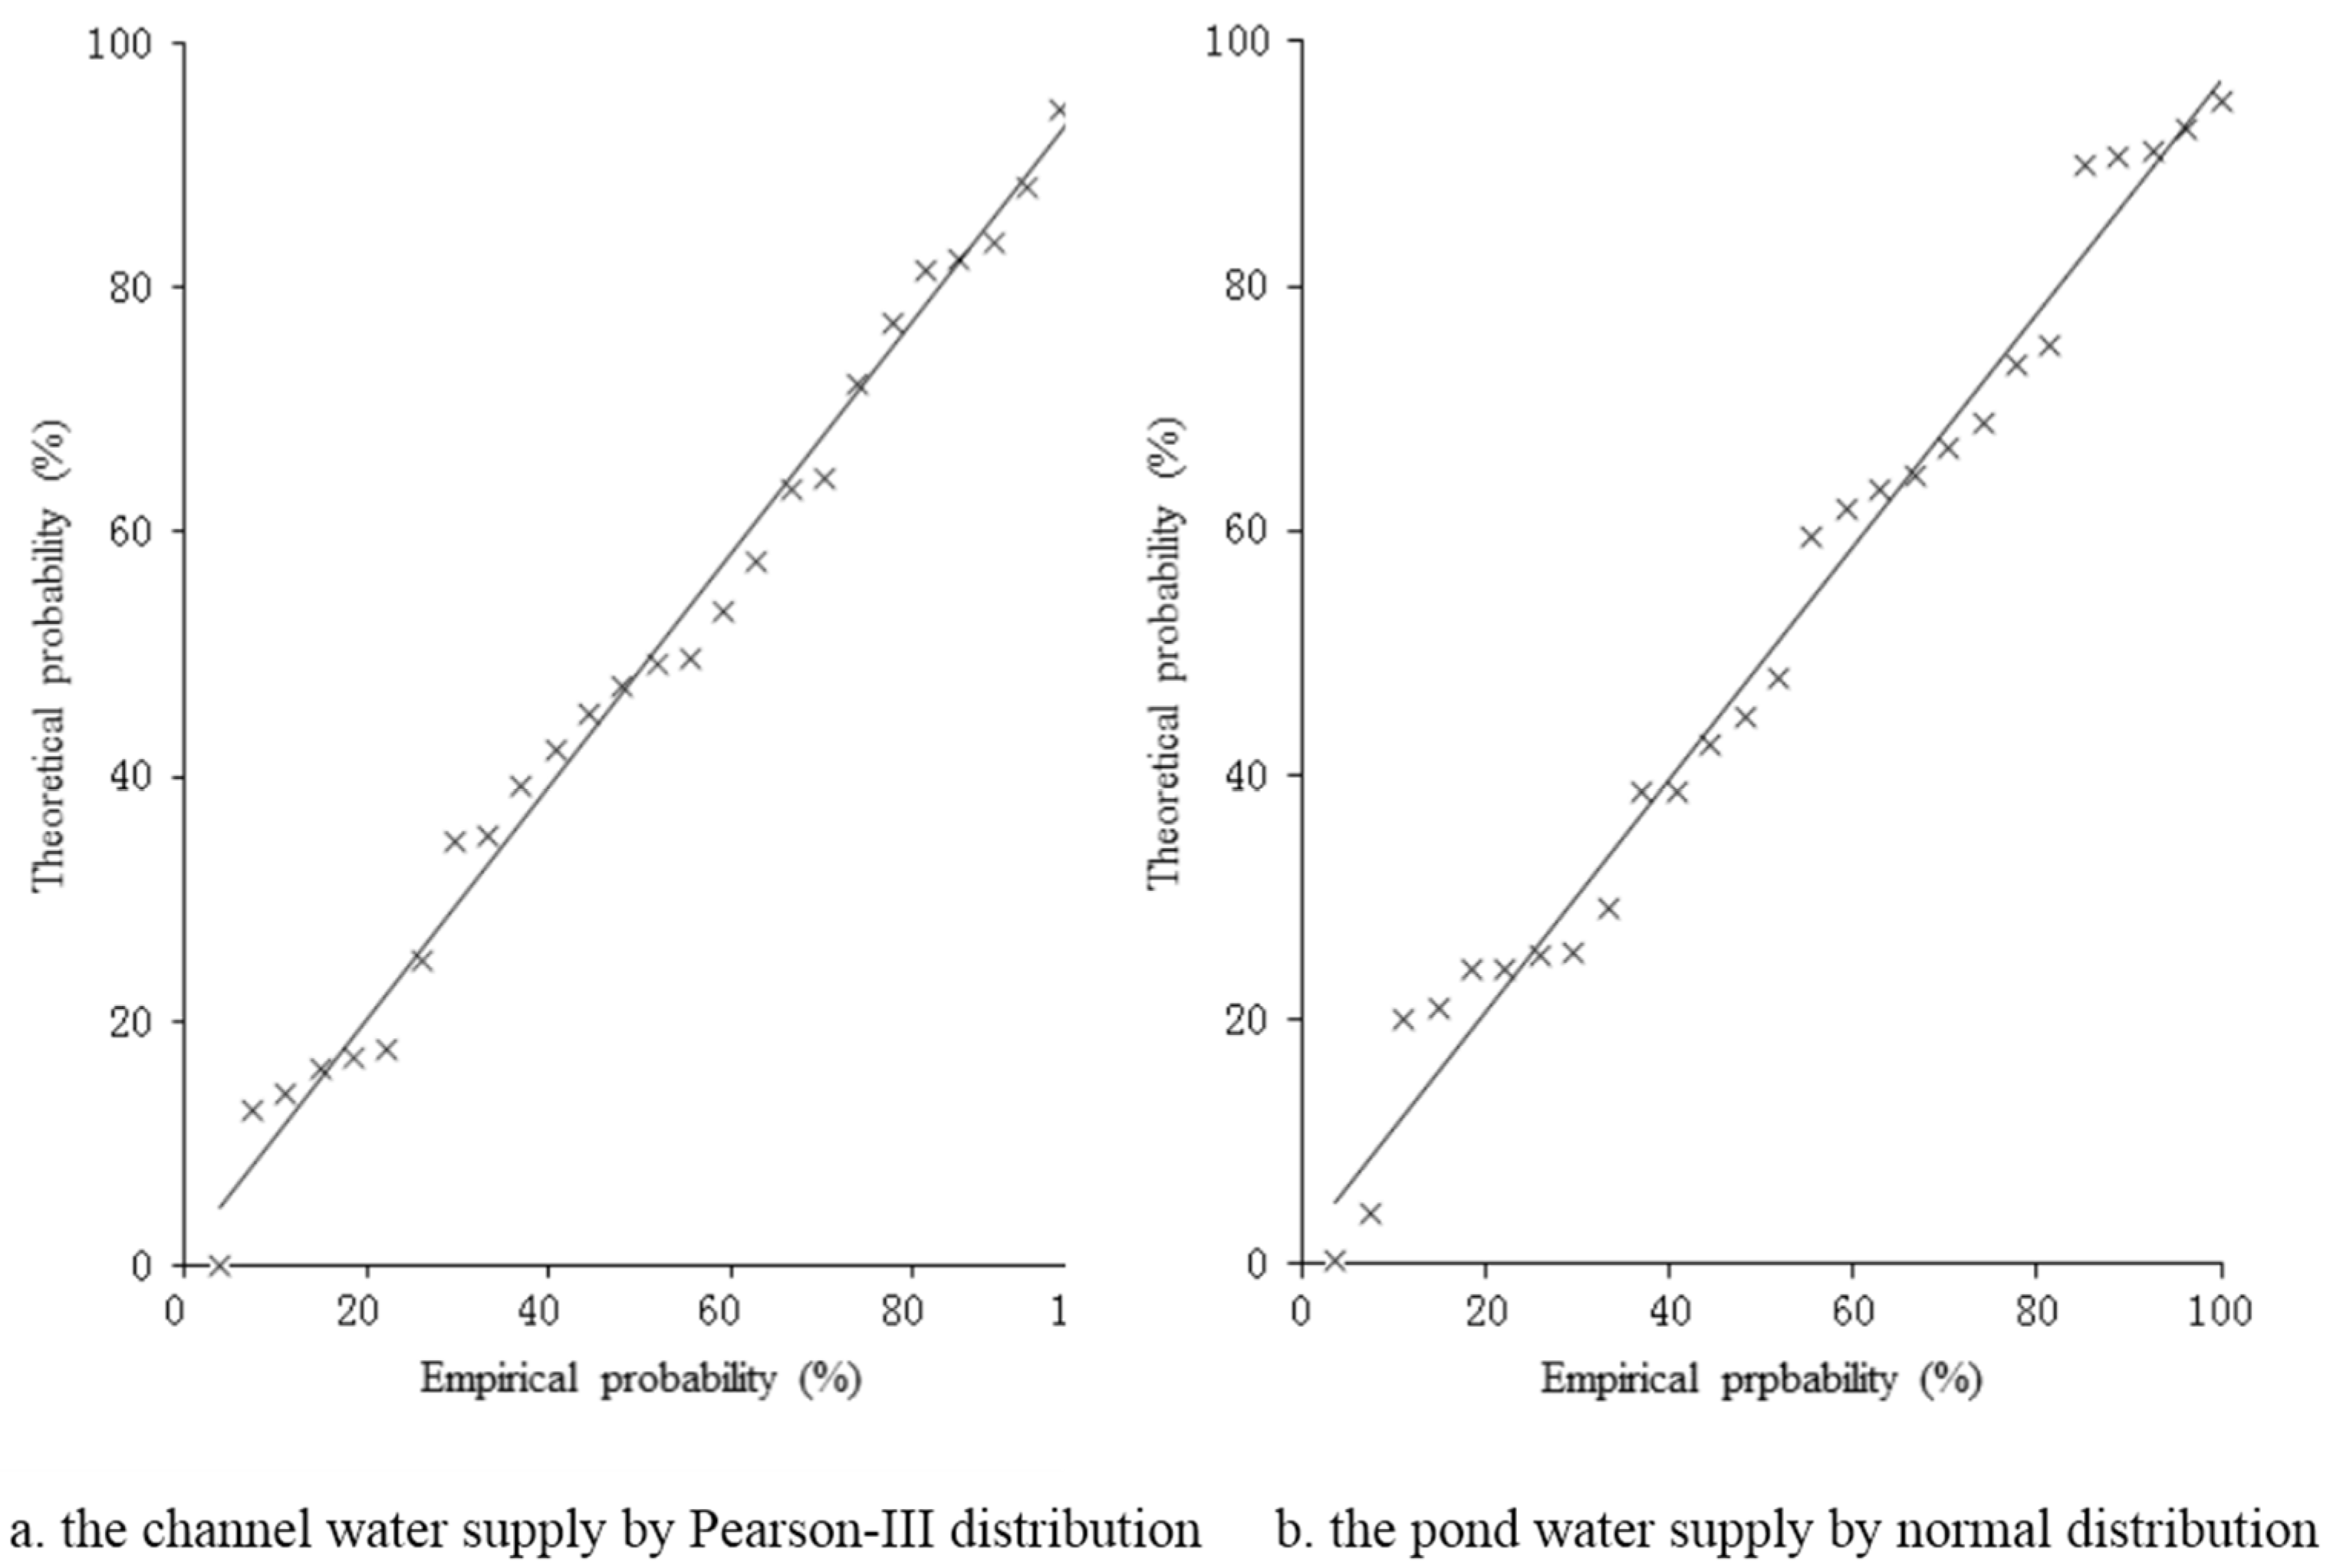
For the variables, several types of candidate probability density functions are tested, including a Pearson-III distribution, an exponential distribution, a normal distribution, and a log-normal distribution, to fit the observation data. According to the results of the Kolmogorov-Smirnov test, the CWS follows a Pearson-III distribution, normal distribution, and log-normal distribution, while the PWS follows a normal distribution and log-normal distribution. Based on the results of RMSE and AIC calculated using Equations(6) and (7) shown in
Table 2,the Pearson-III distribution and normal distribution are selected as the marginal distribution functions for CWS and PWS, respectively. The fitting of CWS and PWS is illustrated in
Figure 2.
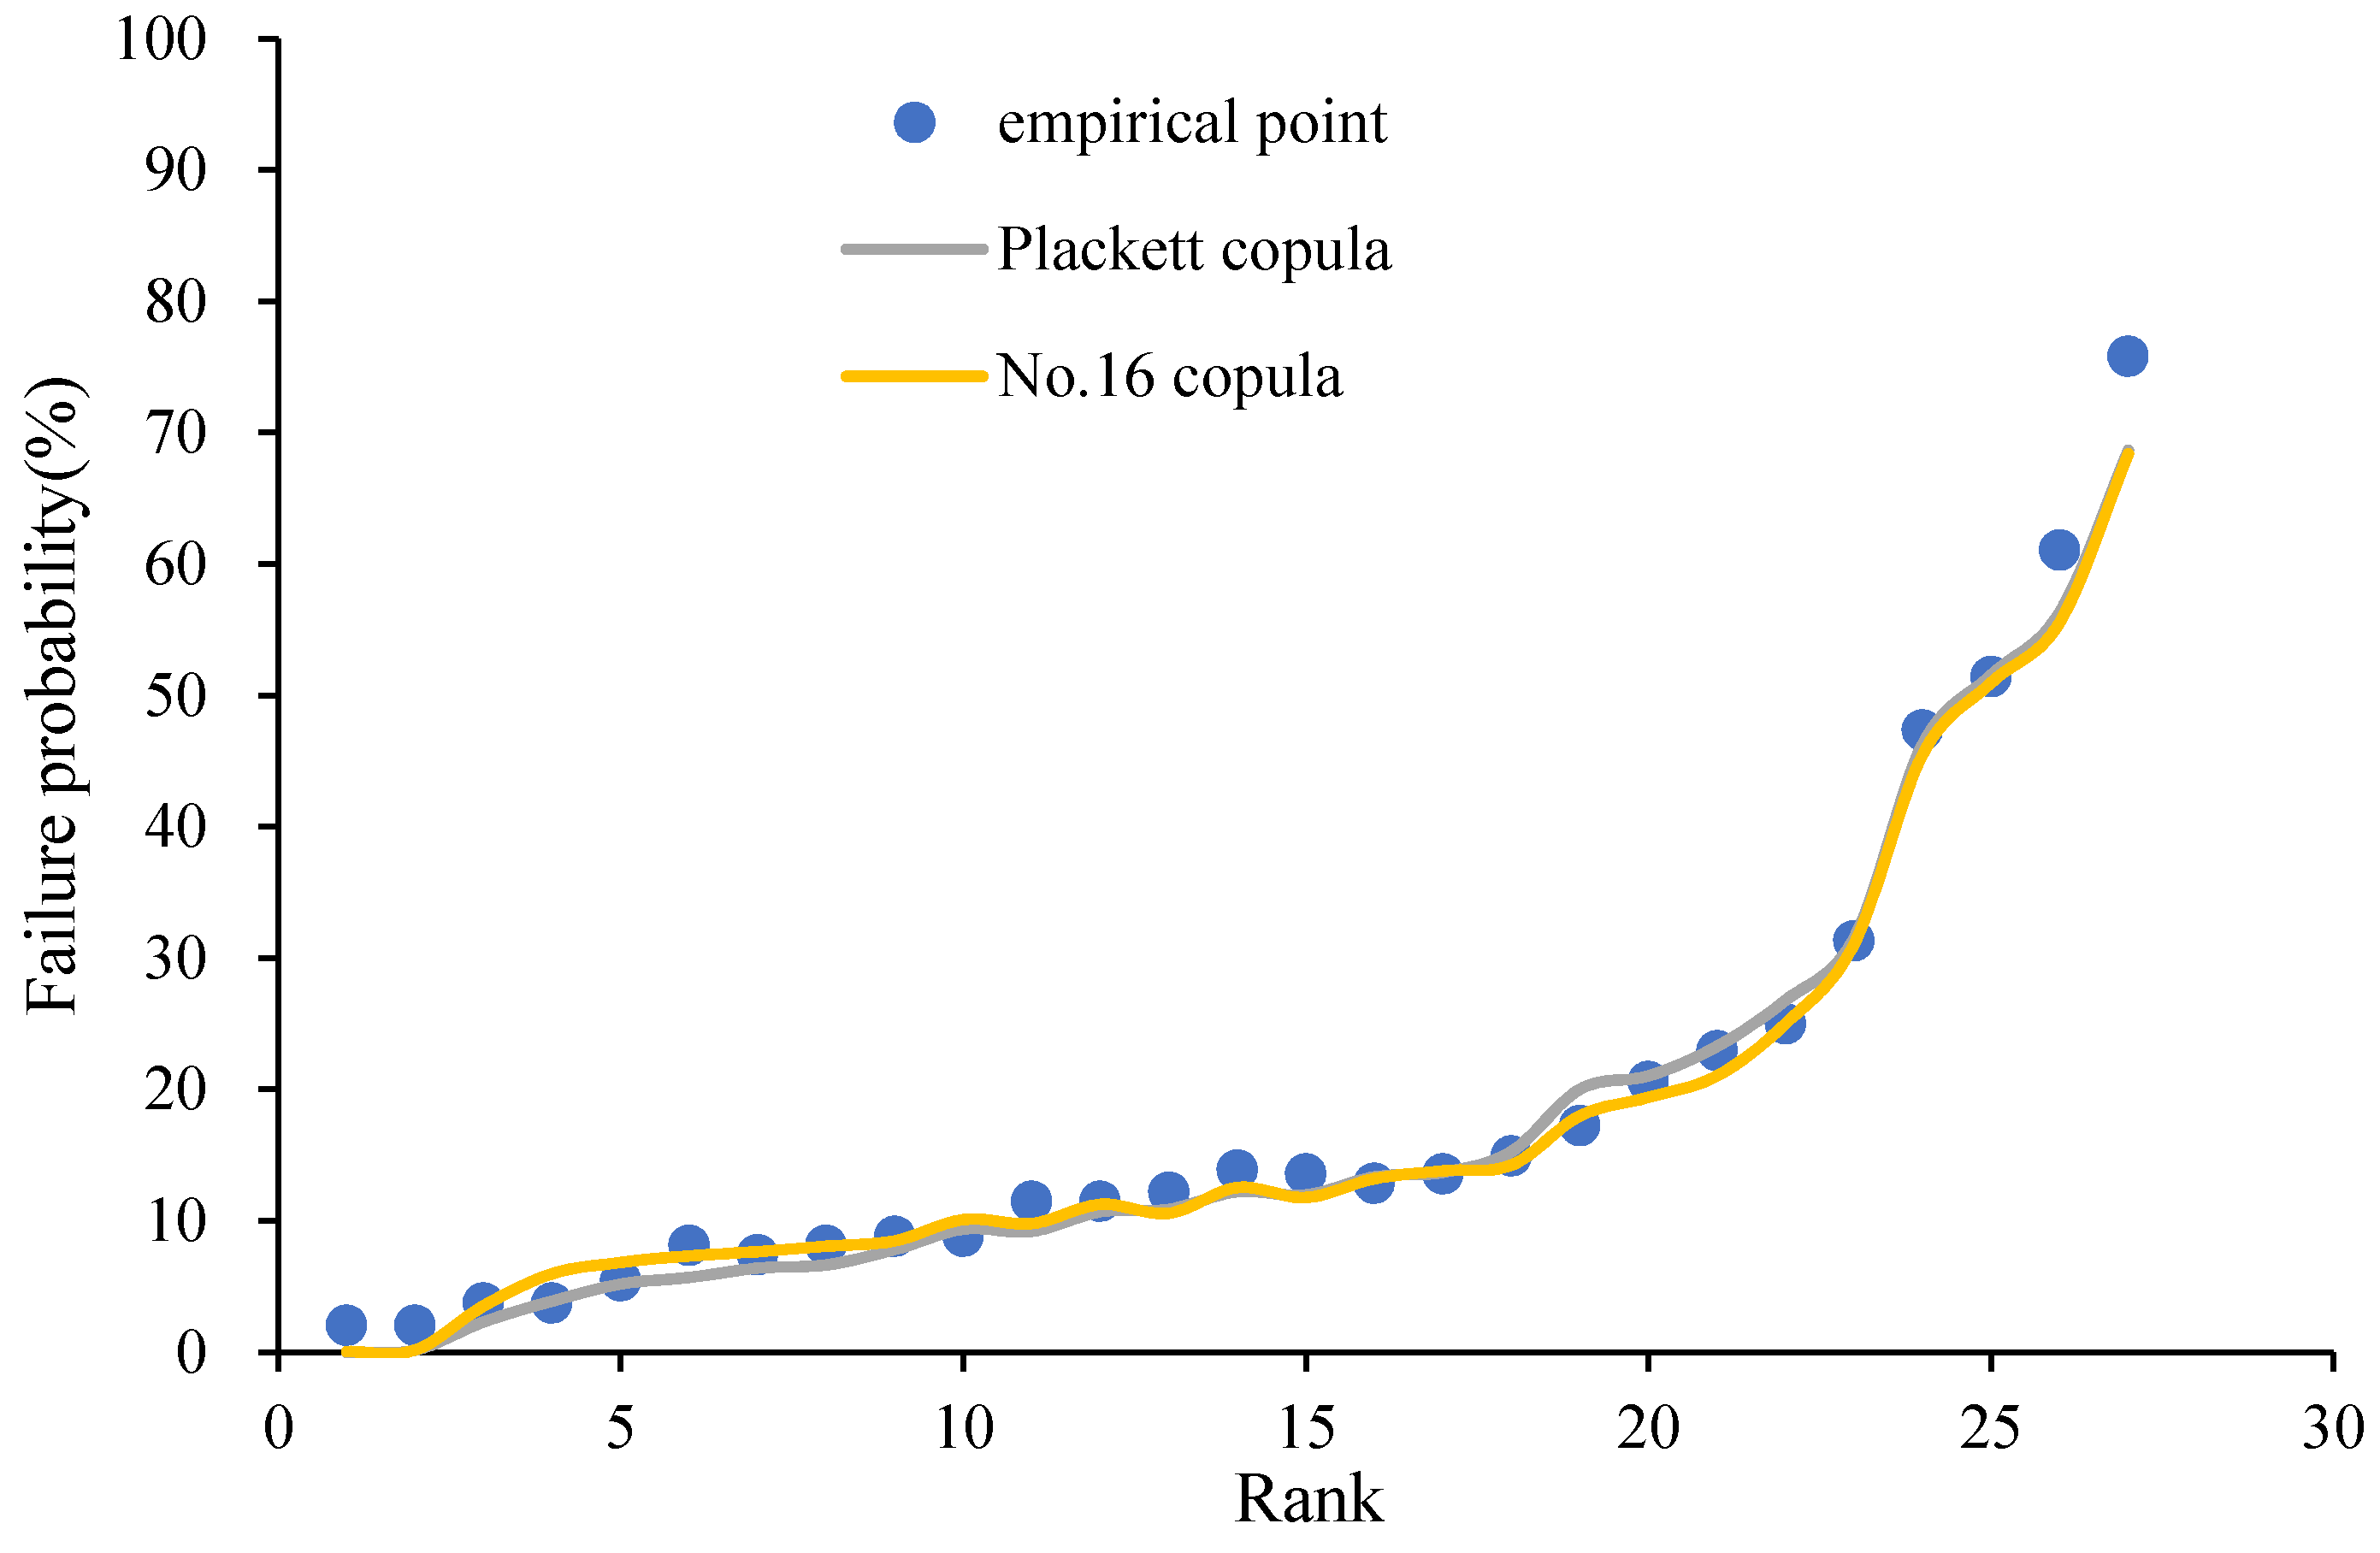
Using Equations (2) and (3), the parameter
of the four copulas can be obtained. Then, the AIC, BIC, and
of the copulas can be calculated using Equations (7)–(9). The values are shown in
Table 3. The best fitting copula function is the Plackett copula and the No.16 copula using the previously proposed method 1 and method 2, respectively. The fitting effect of the Frank copula function is demonstrated in
Figure 3.
4. Results and Discussion
In this section, the two preferred copulas, Plackett copula and No.16 copula, are used to evaluate the risk of the CPJM. The objective is to provide a more reasonable estimation of the probability of the CPJM failure. The two copulas chosen by the two methods are used for risk assessment in view of the physical condition of the irrigation water allocation strategy and reasonable engineering conditions. The water supply frequency of CWS and PWS is set to 50% (normal year), 75% (dry year), and 95% (extremely dry year); thus, nine combinations are proposed for the analysis of the joint probability, the conditional probability, and the corresponding return period of CPJM failure.
4.1. Plackett Copula and No.16 Copula for Evaluating the Probability of CPJM Failure
With the two copulas, the joint probability and corresponding return period estimated with Equations (10) and (12) with given frequencies of CWS and PWS are summarized in
Table 4 and
Table 5.
Given the PWSF, the conditional probability and corresponding return period can be estimated with Equations (11) and (13), respectively. Assuming the water supply frequency of the PWS is 50% (normal year), 75% (dry year), and 95% (extremely dry year), the conditional probabilities and return period of CPJM failure are estimated in
Table 6 and
Table 7.
Table 4 and
Table 5 show that the joint probability of failure is from 0.02%–16.54% as estimated by the two copulas, while the probability for the research region according to an existing study is 33.3% [
72]. Therefore, taking PWS into consideration is necessary for objective failure analysis of the irrigation water allocation strategy and in water resource planning and management in irrigation districts. For example, given the dry year, as determined by rainfall frequency, the corresponding CWSF should be 97.31%, while the actual value is 89.29%, in reality, for the same year. Correspondingly, the CWS could be reduced by 301,937.2 m
3. This volume of saved water, which can be shifted to other fields, is equalto the benefit of agricultural water saving. In
Table 6 and
Table 7, when the PWSF is 50%–95%, the conditional probability of CPJM failure ranges between 0.45%–33.08%, which is greater than the JP between 0.02%–16.54%. Therefore, with the same failure probability, the corresponding CWSF and PWSF are higher, and the CWS and PWS exhibit higher values for the conditional probability than for the joint probability. In fact, the predicted CWS corresponding to the CWSF calculated with Equation (11) is greater than the actual demand, which ensures irrigation water supply security to a certain extent.
The assurance rate of irrigation water in the irrigation district, where paddy rice is cultivated as a major crop, is between 75%–95%, which indicates that the designed return period ranges from four to 20 years. When the channel and pond water supply frequencies are between 75% and 95%, the return periods of the joint probability and the conditional probability of CPJM are 42–5000 years and 10–222 years, respectively. Therefore, the risk rarely happens in CPJM. The return period of irrigation system failure is greatly improved in the CPJM with an appropriate irrigation water allocation strategy. Thus, the CPJM helps to estimate the resistance of the actual irrigation water allocation strategy to drought damage compared with the single water supply model used in irrigation projects.
According to the information collected over 30 years, the annual average of CWS and PWS are 698,004 m
3 and 407,796 m
3, respectively. With a water supply frequency of 50%, the CWS and PWS are 634,206 m
3 and 403,700 m
3, respectively. Therefore, channels and ponds can generally supply water at a frequency of 50%, and the CPJM failure is at relatively low joint probabilities of 16.54% and 14.92%. Similarly, with the conditional probability analysis, the CPJM failure is 33.08% and 29.84% with a return period of three years when the CWSF is 50% under the condition that PWSF is 50%, which is consistent with the reality of the three-year drought return period in research region [
72].
Based on the prediction of future hydrological conditions, the water supply capability of channels and ponds can be calculated and the risk of the CPJM is predictable. Optimal solutions can be obtained to fulfill different intentions, and the risks of CPJM can be analyzed at different frequencies of CWS based on the frequency of PWS.
4.2. Plackett Copula and No.16 Copula for Developing an Irrigation Water Allocation Strategy Based on Typical Hydrological Years
Based on the conditional probability analysis with the two copulas, four years, 10 years, and 20 years are set as the return period of CPJM failure based on the assurance rate of the irrigation water, and the frequencies of PWS are 17.86%, 67.86%, and 28.57%, which correspond to the typical years for the inconsistency between the rainfall frequency and the pond water supply frequency. Then, the calculation provides the frequencies of CWS shown in
Table 8 and
Table 9 with the assistance of Equations (11) and (13).The values range from 2.46%–24.72%. In fact, the CWSF is actually 42.86%–89.29%, corresponding to the frequency of the typical years based on the frequency of statistical data. In this situation, the actual CWSF of all years exceeds the water demand when the PWSF is determined. Thus, the PWS plays an important role in guaranteeing irrigation.
Meanwhile, a large amount of water could be saved by performing a full and reasonable estimation of the water supplied by ponds. For example, in the case of a typical 75% year with a PWSF of 67.86%, the corresponding water demand on the channel is 957,029 m3, in contrast to the actual CWS of 1,132,046 m3. Thus, the water supply can be reduced by 175,035 m3. Water conservation is achieved, to some extent, in the CPJM. Meanwhile, if the frequency of the hydrological year can be predicted, the water management plan of the channel will be determined by applying the appropriate frequency to the PWSF.
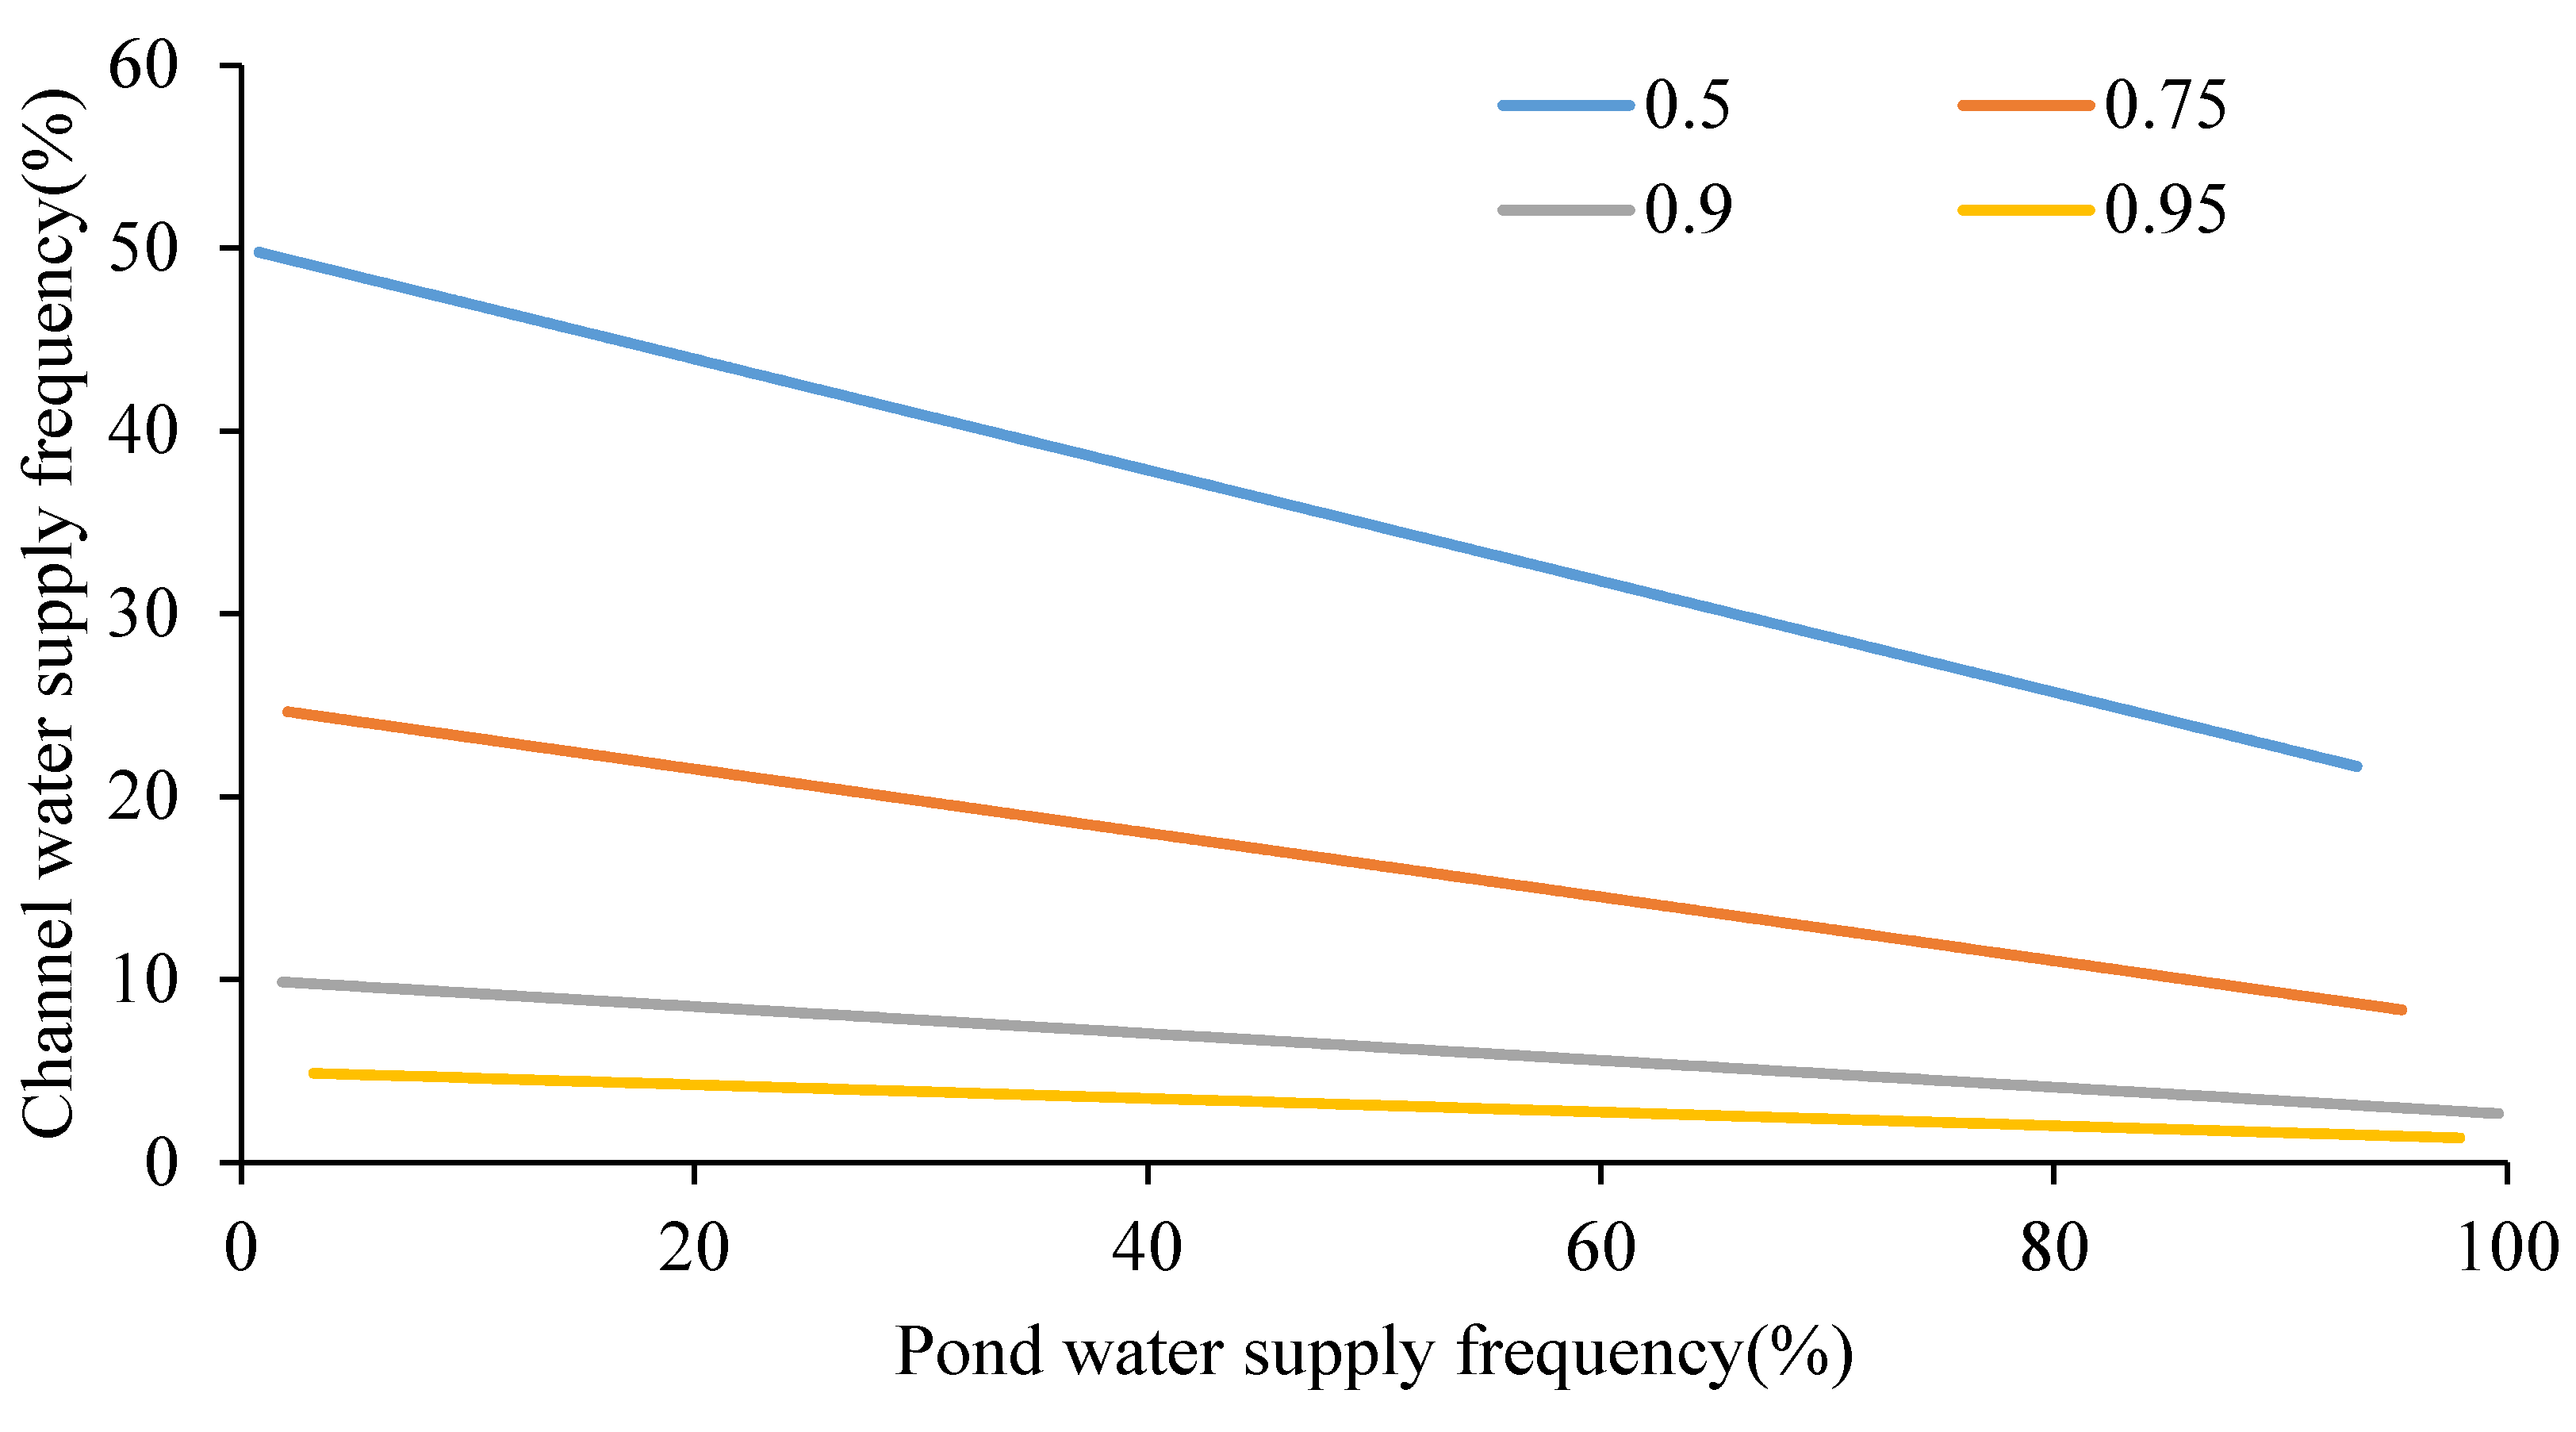
In addition to a quantitative descriptive analysis of the CWS under different PWSF values and typical hydrological years using the conditional probability with the two copulas, it is also possible to design an irrigation water allocation strategy. For a certain failure probability of CPJM, the relation curve charts of CWSF and PWSF can be obtained, as shown in
Figure 4 and
Figure 5. Each line in the figure represents an equal-potential line of CPJM failure. The CWSF can be obtained with estimation of PWSF and different predicted failure probability. The design chart shows that the failure probability increases with decreasing frequencies of CWS and PWS. This indicates that the probability that the CPWF or PWSF will exceed their respective values prescribed in the design as these prescribed values decrease. Under the chosen failure probabilities, the CWSF is no more than 60% under different PWSF conditions. Therefore, optimizing the use of PWS is important for decreasing CWS and allowing that water to be used by other industries. Clearly, ponds play an important role in the irrigation water allocation.
4.3. Discussion of the Two Copulas
The Plackett copula and No.16 copula can both be used to characterize the dependence structure between the CWS and PWS. They are consistent with the different standards for optimizing copulas. However, the results of the different copulas differ greatly based on data characteristics and estimation precision. Therefore, choosing suitable copulas for different research purposes is important in practice.


