Appendix A
Table A1.
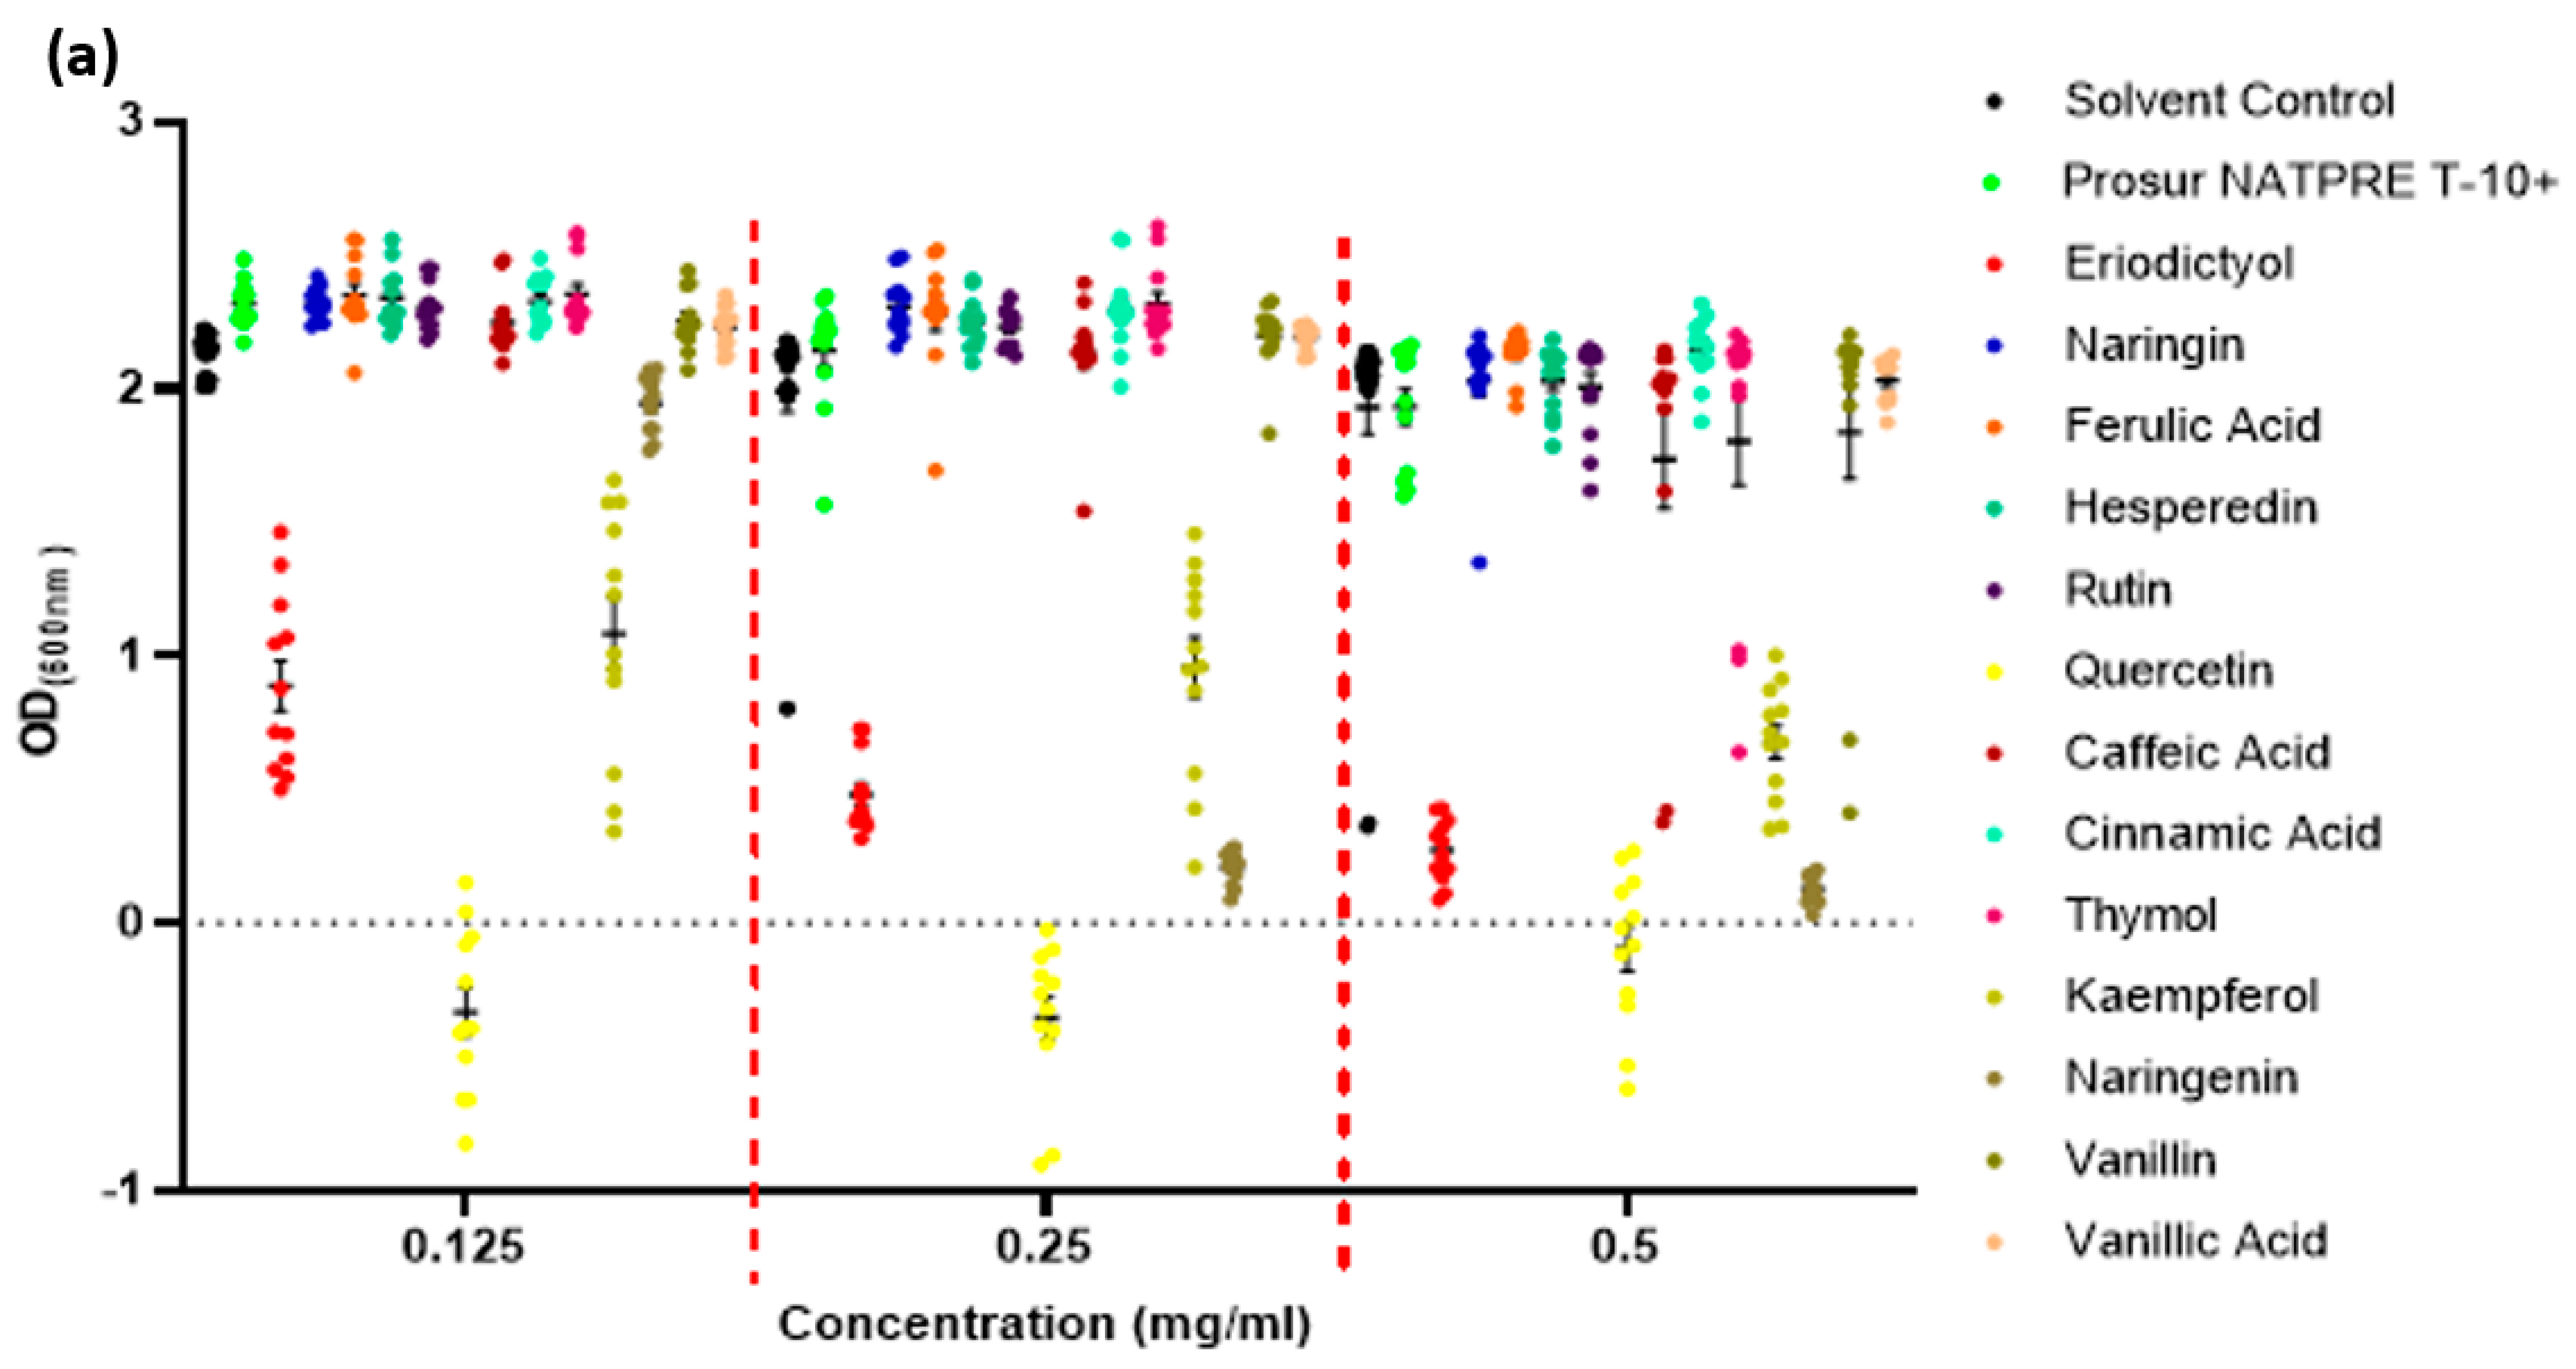
Summary of results of the growth inhibition assays against Gram-negative species.
Table A1.
Summary of results of the growth inhibition assays against Gram-negative species.
| Gram-Negative Pathogen OD(600 nm) after Polyphenol Exposure as a Percentage of Solvent Controls |
|---|
| Phytochemical | Concentration (mg/mL) | S. Typhimurium | P. aeruginosa |
|---|
| OD(600 nm) | p-Value | SEM (±) | OD(600 nm) | p-Value | SEM (±) |
|---|
| Prosur | 0.5 | 103.01 | 0.3594 | 0.03 | 106.07 | 0.3583 | 0.07 |
| 0.25 | 106.26 | 0.0004 | 0.02 | 100.99 | 0.4665 | 0.03 |
| 0.125 | 106.43 | 0.0002 | 0.02 | 101.87 | 0.4057 | 0.05 |
| Eriodictyol | 0.5 | 103.48 | 0.2970 | 0.03 | 109.58 | 0.1476 | 0.05 |
| 0.25 | 103.25 | 0.0571 | 0.02 | 102.22 | 0.1080 | 0.01 |
| 0.125 | 104.92 | 0.0042 | 0.02 | 103.09 | 0.1741 | 0.03 |
| Naringin | 0.5 | 101.28 | 0.7033 | 0.03 | 106.58 | 0.3198 | 0.07 |
| 0.25 | 105.03 | 0.0038 | 0.01 | 104.13 | 0.0037 | 0.02 |
| 0.125 | 107.18 | <0.0001 | 0.02 | 103.91 | 0.0859 | 0.04 |
| Ferulic acid | 0.5 | 84.23 | <0.0001 | 0.05 | 89.97 | 0.1301 | 0.10 |
| 0.25 | 102.70 | 0.1101 | 0.02 | 102.18 | 0.1159 | 0.02 |
| 0.125 | 106.65 | 0.0001 | 0.02 | 104.52 | 0.0475 | 0.04 |
| Hesperidin | 0.5 | 98.03 | 0.5523 | 0.07 | 110.10 | 0.1279 | 0.06 |
| 0.25 | 102.74 | 0.1072 | 0.05 | 103.04 | 0.0307 | 0.02 |
| 0.125 | 104.30 | 0.0117 | 0.05 | 103.18 | 0.1643 | 0.04 |
| Rutin | 0.5 | 97.74 | 0.4925 | 0.02 | 104.79 | 0.4648 | 0.07 |
| 0.25 | 105.17 | 0.0030 | 0.02 | 103.18 | 0.0240 | 0.02 |
| 0.125 | 106.69 | 0.0001 | 0.02 | 103.83 | 0.0917 | 0.03 |
| Quercetin | 0.5 | 21.07 | - | - | 48.83 | - | - |
| 0.25 | 22.87 | - | - | 44.82 | - | - |
| 0.125 | 23.64 | - | - | 45.37 | - | - |
| Caffeic acid | 0.5 | 96.19 | 0.3627 | 0.04 | 94.87 | 0.3005 | 0.04 |
| 0.25 | 105.08 | 0.0107 | 0.04 | 104.81 | 0.0006 | 0.02 |
| 0.125 | 106.07 | 0.0018 | 0.03 | 104.09 | 0.0165 | 0.02 |
| Cinnamic acid | 0.5 | 82.39 | <0.0001 | 0.04 | 79.82 | <0.0001 | 0.06 |
| 0.25 | 103.48 | 0.0767 | 0.04 | 100.18 | 0.8788 | 0.02 |
| 0.125 | 106.03 | 0.0019 | 0.03 | 102.22 | 0.1899 | 0.02 |
| Thymol | 0.5 | 51.18 | <0.0001 | 0.09 | 57.41 | <0.0001 | 0.07 |
| 0.25 | 106.26 | 0.0018 | 0.03 | 103.27 | 0.0159 | 0.02 |
| 0.125 | 108.42 | <0.0001 | 0.03 | 104.57 | 0.0080 | 0.03 |
| Kaempferol | 0.5 | 83.69 | - | - | 86.34 | - | - |
| 0.25 | 86.28 | - | - | 91.15 | - | - |
| 0.125 | 85.42 | - | - | 90.78 | - | - |
| Naringenin | 0.5 | 101.25 | 0.7656 | 0.04 | 95.43 | 0.3555 | 0.05 |
| 0.25 | 103.89 | 0.0490 | 0.04 | 101.50 | 0.2604 | 0.03 |
| 0.125 | 106.25 | 0.0013 | 0.03 | 102.52 | 0.1333 | 0.03 |
| Vanillin | 0.5 | 79.20 | <0.0001 | 0.05 | 72.19 | <0.0001 | 0.08 |
| 0.25 | 100 | 0.9953 | 0.02 | 98.37 | 0.2299 | 0.02 |
| 0.125 | 102.17 | 0.2556 | 0.03 | 102.57 | 0.1279 | 0.03 |
| Vanillic acid | 0.5 | 91.25 | 0.0373 | 0.03 | 81.49 | 0.0003 | 0.09 |
| 0.25 | 99.59 | 0.8344 | 0.02 | 102.27 | 0.0941 | 0.02 |
| | 0.125 | 102.17 | 0.2581 | 0.02 | 104.48 | 0.0088 | 0.03 |
Table A2.
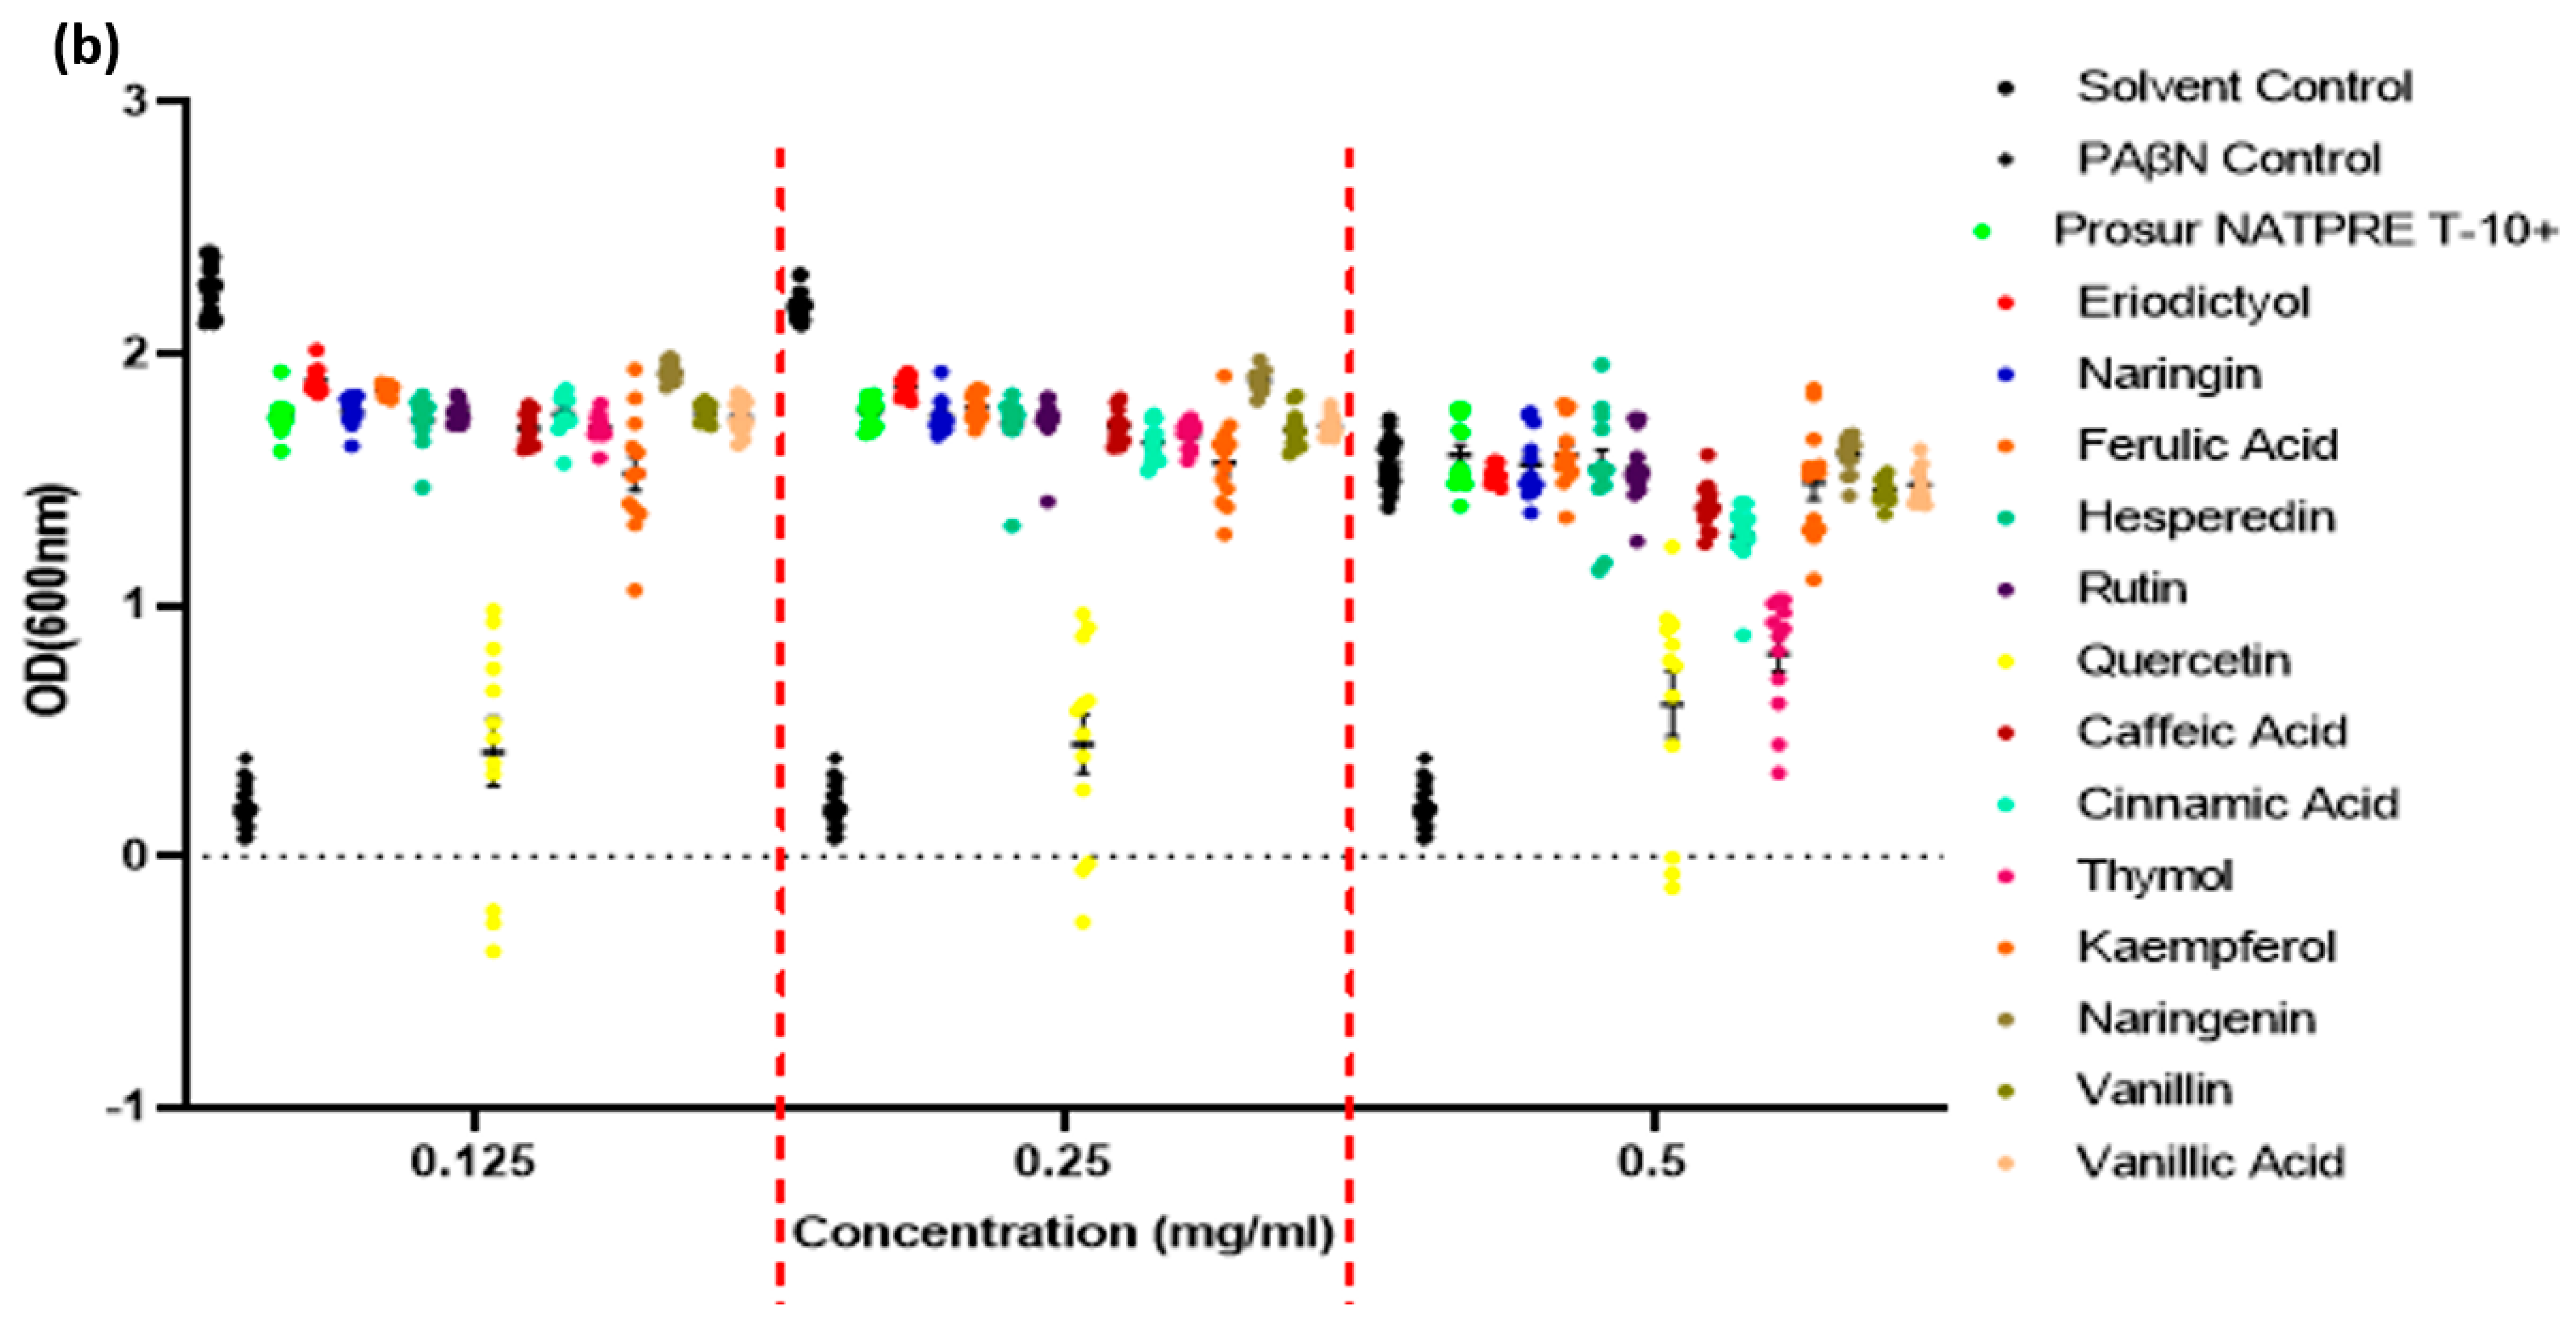
Summary of results of the growth inhibition assays against Gram-positive species.
Table A2.
Summary of results of the growth inhibition assays against Gram-positive species.
| Gram-Positive Pathogen OD(600 nm) after Polyphenol Exposure as a Percentage of Solvent Controls |
|---|
| Phytochemical | Concentration (mg/mL) | S. aureus | L. monocytogenes |
|---|
| OD(600 nm) | p-Value | SEM (±) | OD(600 nm) | p-Value | SEM (±) |
|---|
| Prosur | 0.5 | 93.20 | 0.0317 | 0.07 | 91.08 | 0.2676 | 0.08 |
| 0.25 | 107.79 | 0.0628 | 0.06 | 104.97 | 0.3098 | 0.06 |
| 0.125 | 108.47 | 0.0049 | 0.02 | 106.29 | 0.1934 | 0.07 |
| Eriodictyol | 0.5 | 13.13 | <0.0001 | 0.03 | 87.84 | 0.1321 | 0.12 |
| 0.25 | 24.16 | <0.0001 | 0.04 | 93.38 | 0.1795 | 0.13 |
| 0.125 | 41.59 | <0.0001 | 0.09 | 87.69 | 0.0118 | 0.10 |
| Naringin | 0.5 | 97.97 | 0.5192 | 0.06 | 93.19 | 0.3982 | 0.09 |
| 0.25 | 115.93 | 0.0002 | 0.03 | 103.20 | 0.5112 | 0.06 |
| 0.125 | 108.61 | 0.0043 | 0.02 | 104.81 | 0.3160 | 0.07 |
| Ferulic acid | 0.5 | 102.80 | 0.3778 | 0.02 | 94.76 | 0.5139 | 0.09 |
| 0.25 | 114.62 | 0.0007 | 0.06 | 108.89 | 0.0712 | 0.08 |
| 0.125 | 110.07 | 0.0009 | 0.04 | 107.12 | 0.1405 | 0.07 |
| Hesperidin | 0.5 | 97.88 | 0.4930 | 0.04 | 89.35 | 0.1857 | 0.18 |
| 0.25 | 112.91 | 0.0025 | 0.03 | 97.13 | 0.5583 | 0.08 |
| 0.125 | 109.50 | 0.0017 | 0.03 | 94.05 | 0.2170 | 0.13 |
| Rutin | 0.5 | 96.67 | 0.2857 | 0.05 | 93.73 | 0.4368 | 0.06 |
| 0.25 | 112.11 | 0.0043 | 0.02 | 107.50 | 0.1281 | 0.08 |
| 0.125 | 108.01 | 0.0077 | 0.02613 | 105.23 | 0.2771 | 0.07 |
| Quercetin | 0.5 | −4.57 | - | - | 10.19 | - | - |
| 0.25 | −17.87 | - | - | 28.36 | - | - |
| 0.125 | −15.60 | - | - | 35.90 | - | - |
| Caffeic acid | 0.5 | 97.20 | 0.7960 | 0.1843 | 88.86 | 0.2032 | 0.09 |
| 0.25 | 107.29 | 0.0645 | 0.05955 | 96.17 | 0.4586 | 0.05 |
| 0.125 | 105.24 | 0.0088 | 0.03398 | 97.12 | 0.5536 | 0.06 |
| Cinnamic acid | 0.5 | 120.28 | 0.0641 | 0.03617 | 101.14 | 0.8942 | 0.11 |
| 0.25 | 115.33 | 0.0002 | 0.04502 | 104.13 | 0.4269 | 0.08 |
| 0.125 | 108.90 | <0.0001 | 0.02623 | 104.85 | 0.3181 | 0.08 |
| Thymol | 0.5 | 101.01 | 0.9279 | 0.1631 | 76.65 | 0.0088 | 0.16 |
| 0.25 | 116.53 | <0.0001 | 0.04039 | 102.53 | 0.6218 | 0.06 |
| 0.125 | 110.21 | <0.0001 | 0.03669 | 106.74 | 0.1673 | 0.08 |
| Kaempferol | 0.5 | 37.98 | - | - | 20.30 | - | - |
| 0.25 | 48.16 | - | - | 33.36 | - | - |
| 0.125 | 50.70 | - | - | 27.03 | - | - |
| Naringenin | 0.5 | 7.204 | <0.0001 | 0.01476 | 118.59 | 0.0353 | 0.14 |
| 0.25 | 10.47 | <0.0001 | 0.01797 | 108.13 | 0.1184 | 0.14 |
| 0.125 | 91.06 | <0.0001 | 0.03105 | 103.90 | 0.4215 | 0.11 |
| Vanillin | 0.5 | 102.91 | 0.7894 | 0.1753 | 98.05 | 0.8256 | 0.10 |
| 0.25 | 113.84 | 0.0091 | 0.03674 | 109.27 | 0.0765 | 0.10 |
| 0.125 | 110.20 | 0.0051 | 0.03132 | 107.05 | 0.1485 | 0.10 |
| Vanillic acid | 0.5 | 104.49 | 0.2035 | 0.02422 | 113.57 | 0.1211 | 0.10 |
| 0.25 | 113.84 | 0.0106 | 0.01306 | 112.73 | 0.0158 | 0.10 |
| 0.125 | 110.20 | 0.0242 | 0.02254 | 108.60 | 0.0786 | 0.10 |
Table A3.
Summary of the growth potentiation assays with phytochemicals and 2 μg/mL chloramphenicol against Gram-negative species.
Table A3.
Summary of the growth potentiation assays with phytochemicals and 2 μg/mL chloramphenicol against Gram-negative species.
| Gram-Negative Pathogens OD(600 nm) Potentiative Assay Optical Densities, Percentage of Solvent Controls |
|---|
| Phytochemical | Concentration (mg/mL) | S. Typhimurium | P. aeruginosa |
|---|
| OD(600 nm) | p-Value | SEM (±) | OD(600 nm) | p-Value | SEM (±) |
|---|
| PaβN-positive control | 0.512 | 13.95 | <0.0001 | 0.02 | 18.74 | <0.0001 | 0.01 |
| Prosur | 0.5 | 103.57 | 0.3124 | 0.04 | 98.20 | 0.5309 | 0.02 |
| 0.25 | 80.89 | <0.0001 | 0.02 | 81.58 | <0.0001 | 0.03 |
| 0.125 | 77.62 | <0.0001 | 0.02 | 77.16 | <0.0001 | 0.03 |
| Eriodictyol | 0.5 | 98.64 | 0.6938 | 0.01 | 101.10 | 0.6932 | 0.04 |
| 0.25 | 85.37 | <0.0001 | 0.01 | 85.48 | <0.0001 | 0.03 |
| 0.125 | 83.91 | <0.0001 | 0.01 | 81.64 | <0.0001 | 0.02 |
| Naringin | 0.5 | 101.04 | 0.7756 | 0.04 | 94.27 | 0.0463 | 0.04 |
| 0.25 | 80.06 | <0.0001 | 0.02 | 81.08 | <0.0001 | 0.04 |
| 0.125 | 78.37 | <0.0001 | 0.02 | 77.47 | <0.0001 | 0.03 |
| Ferulic acid | 0.5 | 103.70 | 0.2932 | 0.04 | 99.68 | 0.9135 | 0.03 |
| 0.25 | 81.53 | <0.0001 | 0.02 | 81.17 | <0.0001 | 0.03 |
| 0.125 | 82.09 | <0.0001 | 0.01 | 79.12 | <0.0001 | 0.03 |
| Hesperidin | 0.5 | 100.45 | 0.8964 | 0.07 | 92.08 | 0.0062 | 0.04 |
| 0.25 | 78.65 | <0.0001 | 0.04 | 78.86 | <0.0001 | 0.03 |
| 0.125 | 76.91 | <0.0001 | 0.03 | 77.51 | <0.0001 | 0.04 |
| Rutin | 0.5 | 100.13 | 0.9658 | 0.04 | 96.20 | 0.1855 | 0.02 |
| 0.25 | 79.24 | <0.0001 | 0.03 | 79.17 | <0.0001 | 0.04 |
| 0.125 | 78.24 | <0.0001 | 0.01 | 76.73 | <0.0001 | 0.03 |
| Quercetin | 0.5 | 39.29 | - | - | 40.78 | - | - |
| 0.25 | 20.45 | - | - | 21.57 | - | - |
| 0.125 | 18.44 | - | - | 19.48 | - | - |
| Caffeic acid | 0.5 | 87.87 | 0.0002 | 0.03 | 86.92 | 0.0003 | 0.04 |
| 0.25 | 78.28 | <0.0001 | 0.02 | 81.13 | <0.0001 | 0.03 |
| 0.125 | 75.44 | <0.0001 | 0.02 | 81.86 | <0.0001 | 0.04 |
| Cinnamic acid | 0.5 | 80.42 | <0.0001 | 0.04 | 86.98 | 0.0003 | 0.03 |
| 0.25 | 75.22 | <0.0001 | 0.02 | 82.71 | <0.0001 | 0.01 |
| 0.125 | 77.97 | <0.0001 | 0.02 | 82.69 | <0.0001 | 0.03 |
| Thymol | 0.5 | 50.82 | <0.0001 | 0.07 | 42.20 | <0.0001 | 0.07 |
| 0.25 | 76.50 | <0.0001 | 0.02 | 82.40 | <0.0001 | 0.02 |
| 0.125 | 75.62 | <0.0001 | 0.02 | 82.86 | <0.0001 | 0.03 |
| Kaempferol | 0.5 | 93.75 | - | - | 86.67 | - | - |
| 0.25 | 71.56 | - | - | 80.58 | - | - |
| 0.125 | 67.51 | - | - | 71.38 | - | - |
| Naringenin | 0.5 | 100.76 | 0.8085 | 0.02 | 97.59 | 0.4949 | 0.03 |
| 0.25 | 86.47 | <0.0001 | 0.01 | 85.39 | <0.0001 | 0.04 |
| 0.125 | 85.42 | <0.0001 | 0.01 | 82.08 | <0.0001 | 0.04 |
| Vanillin | 0.5 | 92.04 | 0.0117 | 0.01 | 91.73 | 0.0197 | 0.02 |
| 0.25 | 77.50 | <0.0001 | 0.02 | 79.45 | <0.0001 | 0.03 |
| 0.125 | 78.24 | <0.0001 | 0.01 | 79.34 | <0.0001 | 0.02 |
| Vanillic acid | 0.5 | 93.30 | 0.0329 | 0.02 | 92.97 | 0.0471 | 0.03 |
| 0.25 | 78.33 | <0.0001 | 0.01 | 83.76 | <0.0001 | 0.03 |
| 0.125 | 77.44 | <0.0001 | 0.02 | 81.91 | <0.0001 | 0.03 |
Table A4.
Summary of the growth potentiation assays with phytochemicals and 2 μg/mL chloramphenicol against Gram-negative species.
Table A4.
Summary of the growth potentiation assays with phytochemicals and 2 μg/mL chloramphenicol against Gram-negative species.
| Gram-Positive Pathogens OD(600 nm) Potentiative Assay Optical Densities, Percentage of Solvent Controls |
|---|
| Phytochemical | Concentration (mg/mL) | S. aureus | L. monocytogenes |
|---|
| OD(600 nm) | p-Value | SEM (±) | OD(600 nm) | p-Value | SEM (±) |
|---|
| PaβN-positive control | 0.512 | 5.79 | <0.0001 | 0.01 | −8.33 | <0.0001 | 0.10 |
| Prosur | 0.5 | 17.85 | <0.0001 | 0.03 | 108.54 | 0.1263 | 0.06 |
| 0.25 | 19.50 | <0.0001 | 0.05 | 100.55 | 0.9260 | 0.10 |
| 0.125 | 54.26 | <0.0001 | 0.13 | 96.74 | 0.6431 | 0.14 |
| Eriodictyol | 0.5 | 10.41 | <0.0001 | 0.01 | 90.54 | 0.0915 | 0.07 |
| 0.25 | 9.41 | <0.0001 | 0.01 | 90.48 | 0.1138 | 0.07 |
| 0.125 | 13.81 | <0.0001 | 0.06 | 89.55 | 0.1370 | 0.11 |
| Naringin | 0.5 | 116.92 | 0.1361 | 0.12 | 105.89 | 0.2878 | 0.05 |
| 0.25 | 90.95 | 0.0187 | 0.02 | 102.91 | 0.6277 | 0.11 |
| 0.125 | 82.82 | <0.0001 | 0.02 | 97.69 | 0.7414 | 0.15 |
| Ferulic acid | 0.5 | 95.37 | 0.6795 | 0.11 | 109.95 | 0.0750 | 0.05 |
| 0.25 | 86.93 | 0.0008 | 0.06 | 105.18 | 0.3870 | 0.12 |
| 0.125 | 80.06 | <0.0001 | 0.05 | 101.44 | 0.8388 | 0.14 |
| Hesperidin | 0.5 | 81.25 | 0.0980 | 0.13 | 106.38 | 0.2502 | 0.10 |
| 0.25 | 86.38 | 0.0005 | 0.04 | 96.63 | 0.5751 | 0.10 |
| 0.125 | 79.26 | <0.0001 | 0.05 | 92.99 | 0.3179 | 0.13 |
| Rutin | 0.5 | 96.73 | 0.7700 | 0.18 | 111.89 | 0.0339 | 0.08 |
| 0.25 | 84.22 | <0.0001 | 0.05 | 105.69 | 0.3413 | 0.13 |
| 0.125 | 74.53 | <0.0001 | 0.06 | 100.68 | 0.9231 | 0.16 |
| Quercetin | 0.5 | 9.34 | - | - | 44.61 | - | - |
| 0.25 | −36.27 | - | - | 56.81 | - | - |
| 0.125 | −35.57 | - | - | 59.77 | - | - |
| Caffeic acid | 0.5 | 0.580 | <0.0001 | 0.01 | 101.19 | 0.8888 | 0.09 |
| 0.25 | 2.15 | <0.0001 | 0.02 | 100.97 | 0.8795 | 0.11 |
| 0.125 | 2.45 | <0.0001 | 0.02 | 97.31 | 0.7074 | 0.14 |
| Cinnamic acid | 0.5 | 84.64 | 0.1805 | 0.12 | 101.78 | 0.8364 | 0.13 |
| 0.25 | 90.60 | 0.1190 | 0.05 | 105.18 | 0.4193 | 0.14 |
| 0.125 | 80.43 | 0.0184 | 0.11 | 101.25 | 0.8622 | 0.16 |
| Thymol | 0.5 | 32.05 | <0.0001 | 0.13 | 86.49 | 0.1251 | 0.20 |
| 0.25 | 80.55 | 0.0016 | 0.10 | 100.76 | 0.9069 | 0.10 |
| 0.125 | 73.78 | 0.0018 | 0.11 | 97.77 | 0.7555 | 0.16 |
| Kaempferol | 0.5 | 26.20 | - | - | 32.62 | - | - |
| 0.25 | 20.99 | - | - | 21.45 | - | - |
| 0.125 | 21.12 | - | - | 16.51 | - | - |
| Naringenin | 0.5 | 4.41 | <0.0001 | 0.01 | 108.43 | 0.3349 | 0.10 |
| 0.25 | 22.71 | <0.0001 | 0.13 | 103.16 | 0.6209 | 0.10 |
| 0.125 | 44.14 | <0.0001 | 0.24 | 100.57 | 0.9377 | 0.12 |
| Vanillin | 0.5 | 62.72 | 0.0015 | 0.17 | 106.49 | 0.4586 | 0.10 |
| 0.25 | 81.56 | 0.0027 | 0.09 | 103.79 | 0.5505 | 0.12 |
| 0.125 | 74.20 | 0.0022 | 0.13 | 99.47 | 0.9391 | 0.15 |
| Vanillic acid | 0.5 | 56.74 | 0.0003 | 0.18 | 111.51 | 0.1879 | 0.10 |
| 0.25 | 81.31 | 0.0023 | 0.07 | 101.64 | 0.7967 | 0.12 |
| 0.125 | 70.32 | 0.0005 | 0.14 | 96.89 | 0.6627 | 0.15 |
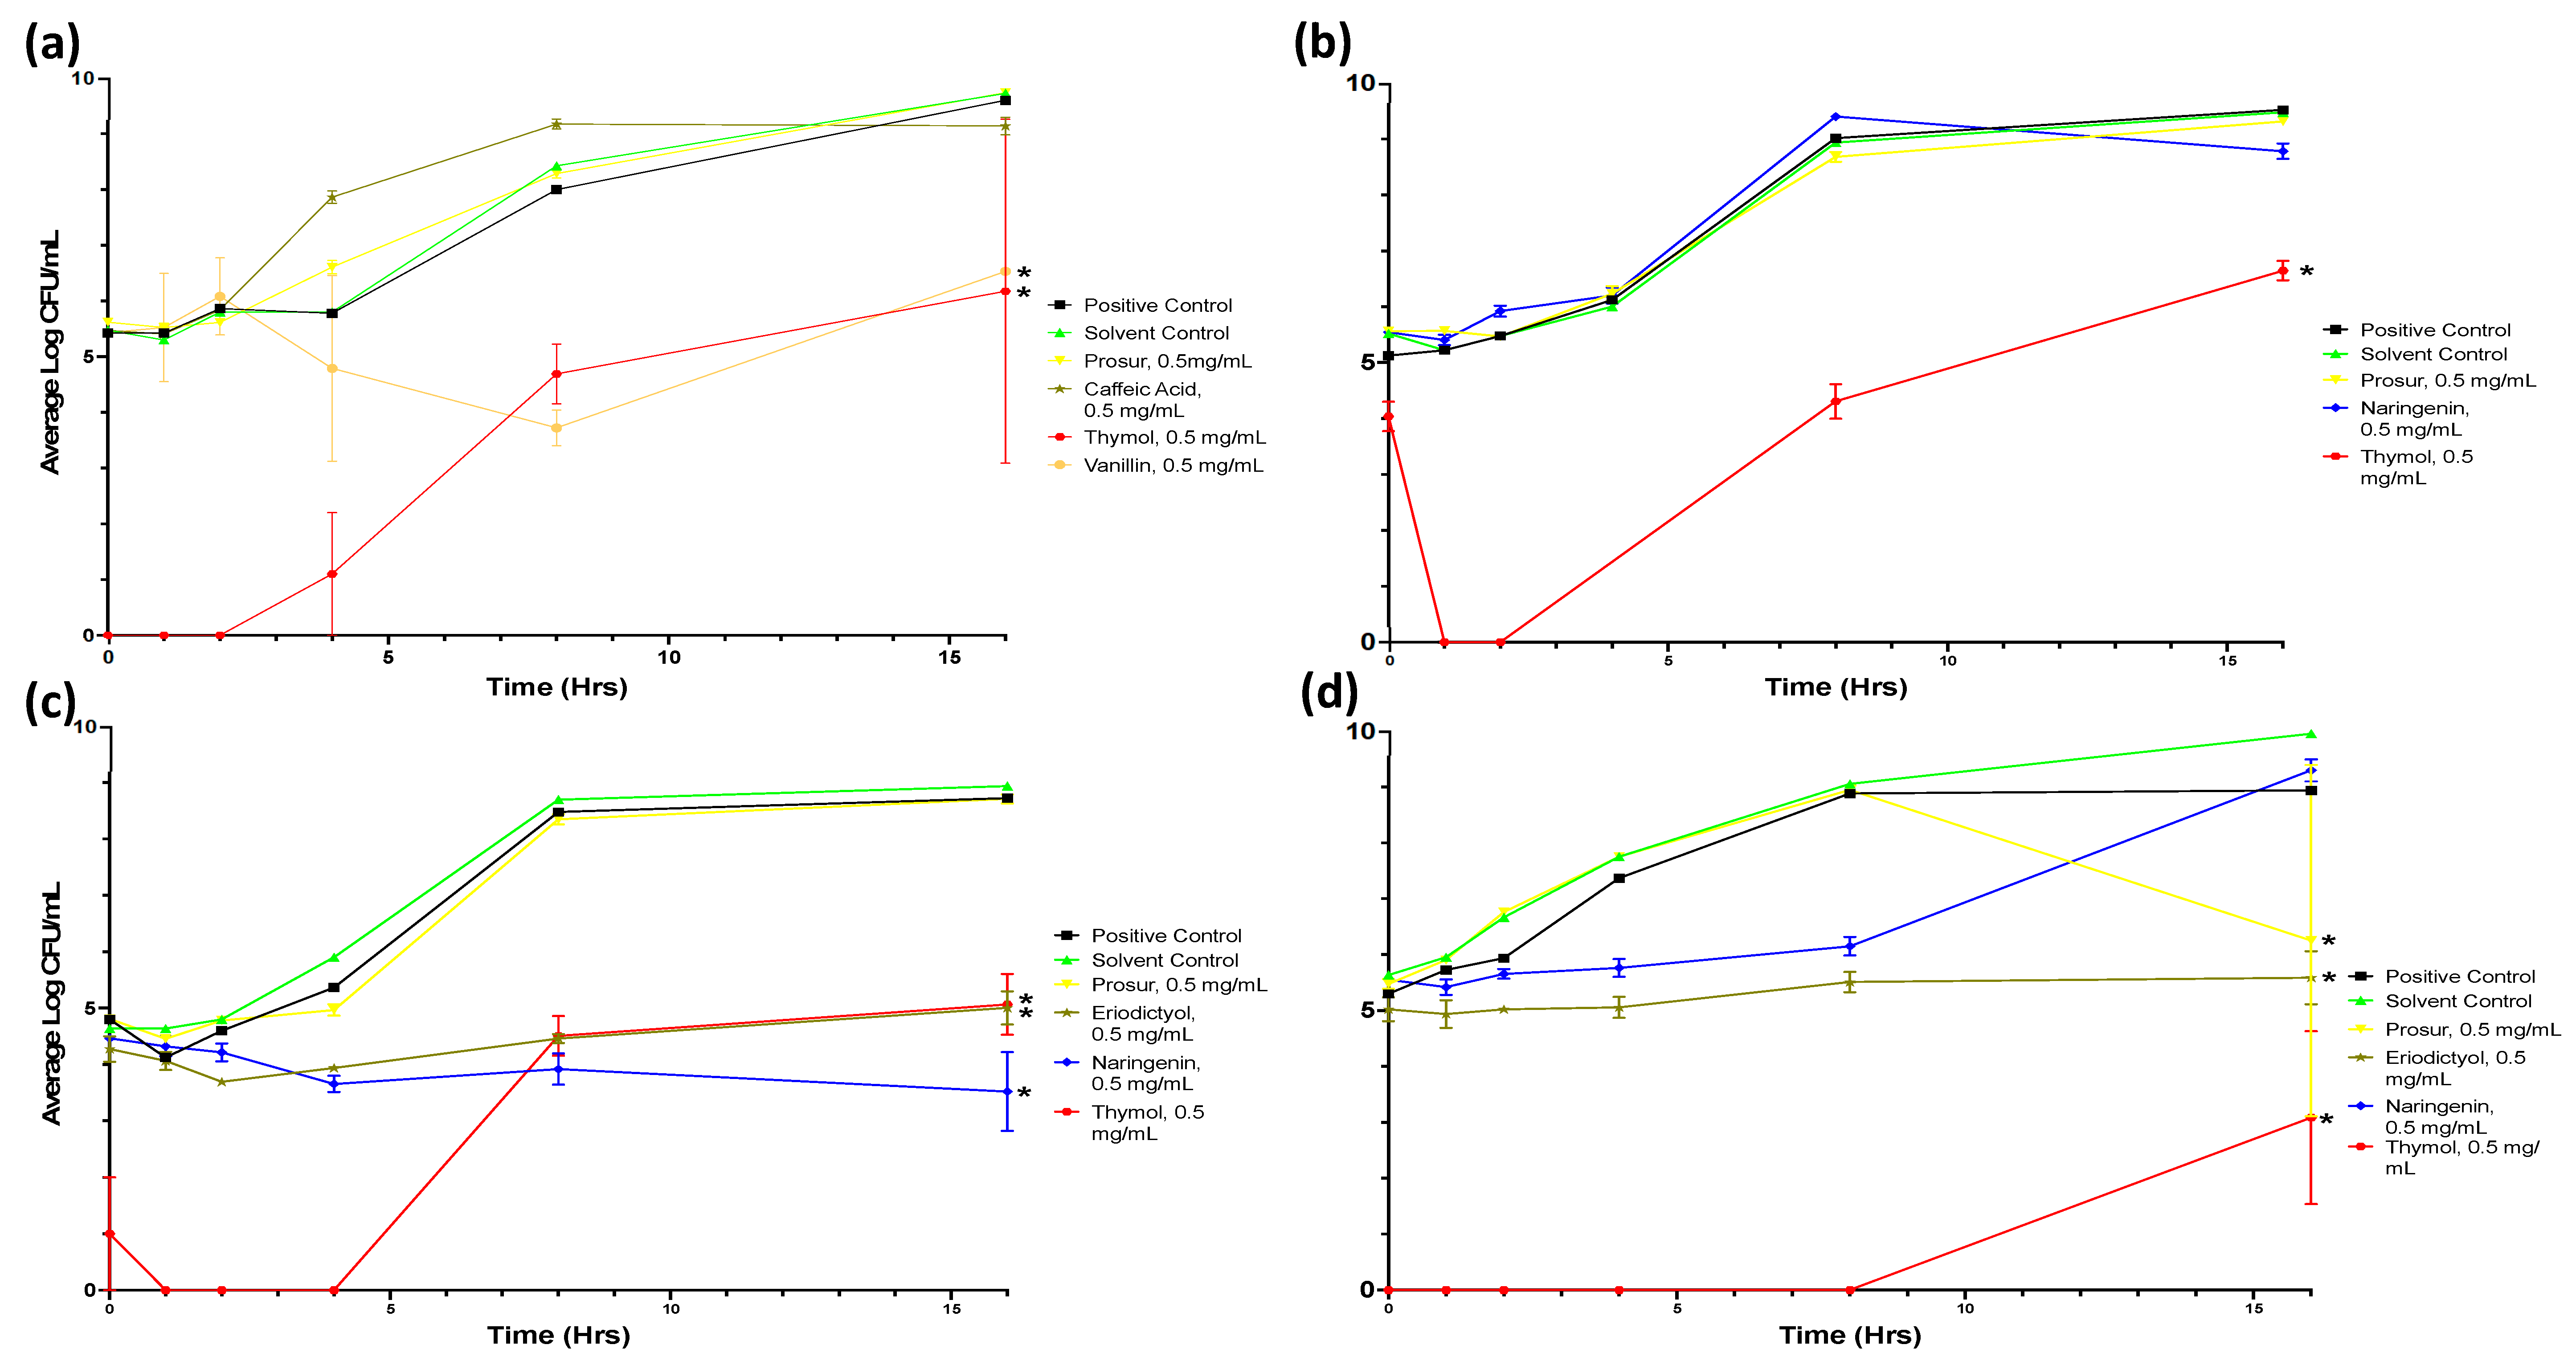
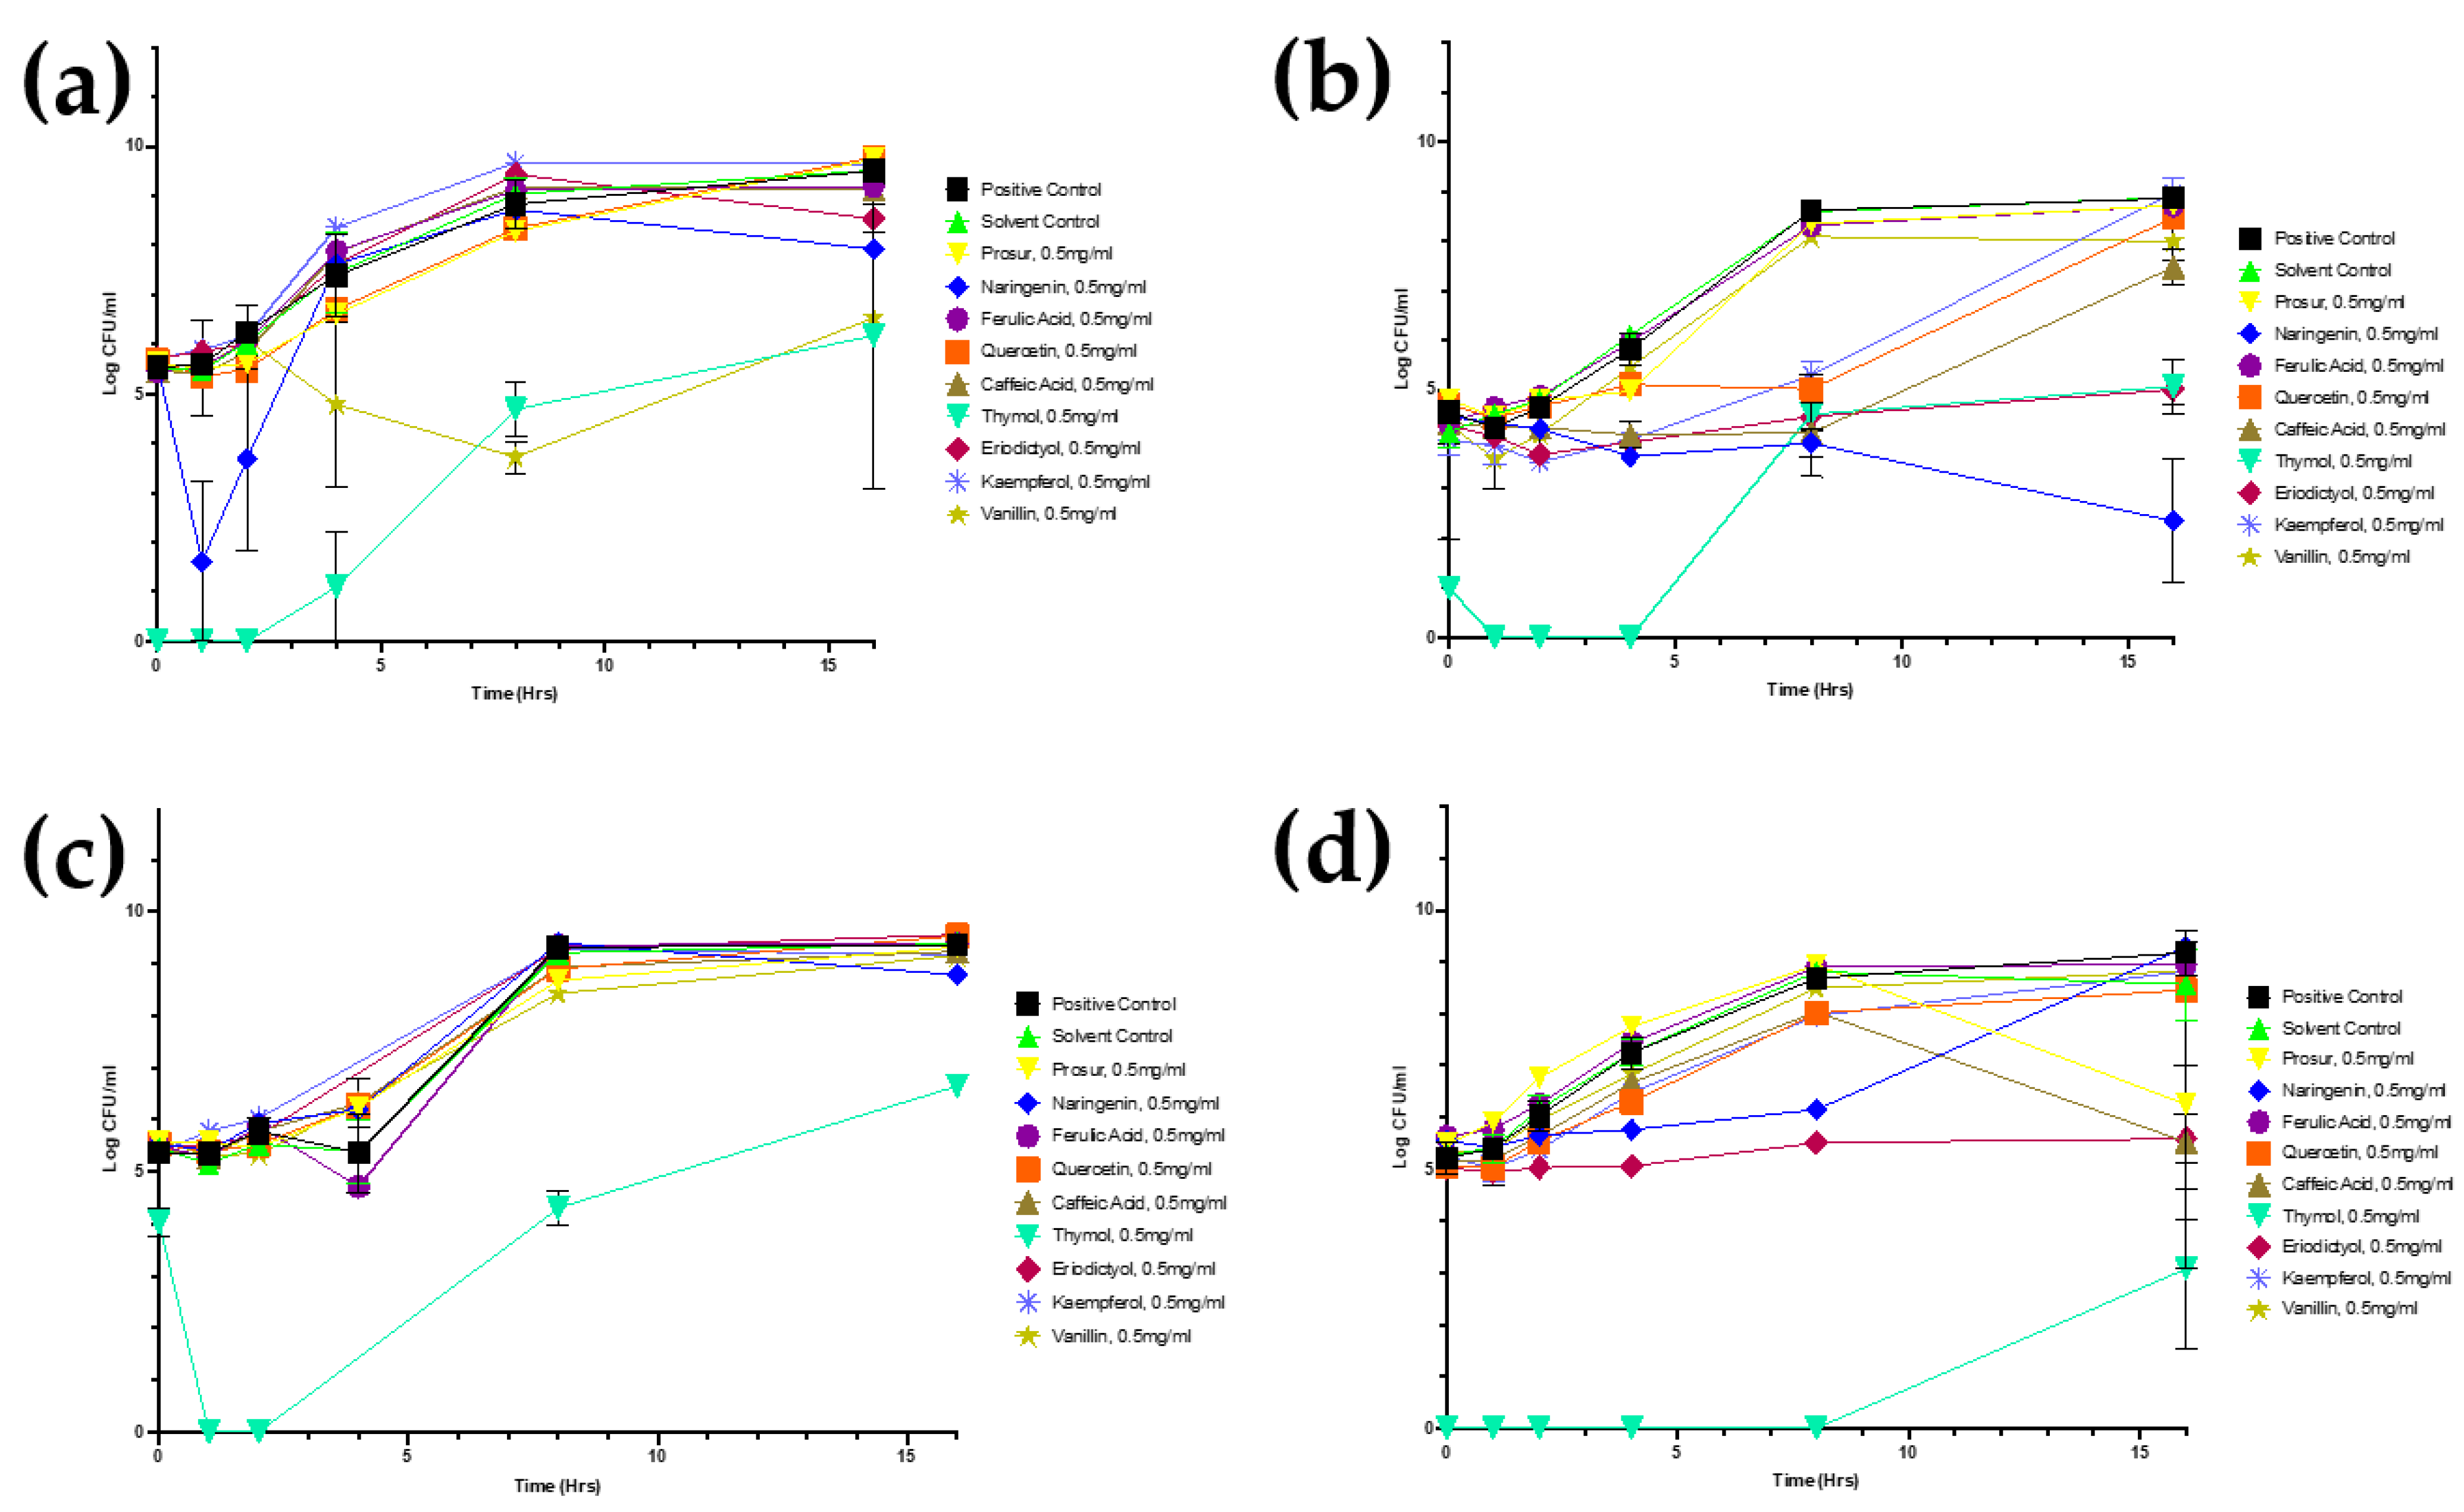
Figure A1.
Growth curves of all tested microorganisms challenged with 0.5 mg/mL of all nine tested phytochemicals. Viable numbers (based on CFU/mL) of the following: (a) S. Typhimurium, (b) S. aureus, (c) P. aeruginosa, and (d) L. monocytogenes following exposure to different phytochemicals. Experiments were repeated with three biological replicates (three technical replicates each) over an incubation period of 16 h. Graphs display the averaged values of three technical replicates for three biological replicates. Error bars indicate SEM (±).
Table A5.
Summary of growth curves challenging the Gram-negative pathogens with various phytochemicals at 0.5 mg/mL concentrations.
Table A5.
Summary of growth curves challenging the Gram-negative pathogens with various phytochemicals at 0.5 mg/mL concentrations.
| Gram-Negative Pathogens Growth Curve Average Growth Velocities (%) |
|---|
Phytochemical
(0.5 mg/mL) | S. Typhimurium | P. aeruginosa |
|---|
| Normalised Growth Velocity (CFU/mL/min) | SEM (±) | p-Value | Normalised Growth Velocity (CFU/mL/min) | SEM (±) | p-Value |
|---|
| Solvent control | 100 | 0.08 | - | 100 | 0.73 | - |
| Prosur | 98.20 | 0.08 | 0.8981 | 102.86 | 0.07 | 0.8000 |
| Eriodictyol | 79.10 | 1.00 | 0.1385 | 114.09 | 0.07 | 0.2135 |
| Ferulic acid | 75.89 | 0.96 | 0.0883 | 89.87 | 0.99 | 0.3705 |
| Quercetin | 89.37 | 0.75 | 0.4486 | 106.83 | 0.04 | 0.5446 |
| Caffeic acid | 96.50 | 0.08 | 0.8026 | 96.08 | 0.70 | 0.7281 |
| Thymol | 29.80 | 0.27 | <0.0001 | 12.41 | 0.32 | <0.0001 |
| Kaempferol | 104.51 | 0.06 | 0.7482 | 112.78 | 0.07 | 0.2584 |
| Naringenin | 42.56 | 1.12 | <0.0001 | 114.99 | 0.07 | 0.1859 |
| Vanillin | 85.28 | 0.72 | 0.2952 | 98.66 | 0.06 | 0.9053 |
Table A6.
Summary of growth curves challenging the Gram-positive pathogens with various phytochemicals at 0.5 mg/mL concentrations.
Table A6.
Summary of growth curves challenging the Gram-positive pathogens with various phytochemicals at 0.5 mg/mL concentrations.
| Gram-Positive Pathogens Growth Curve Average Growth Velocities (%) |
|---|
| Phytochemical (0.5 mg/mL) | S. aureus | L. monocytogenes |
|---|
| Normalised Growth Velocity (CFU/mL/min) | SEM (±) | p-Value | Normalised Growth Velocity (CFU/mL/min) | SEM (±) | p-Value |
|---|
| Solvent control | 100 | 0.08 | - | 100 | 0.08 | - |
| Prosur | 85.48 | 0.63 | 0.1563 | 102.31 | 0.06 | 0.7756 |
| Eriodictyol | 15.32 | 0.29 | <0.0001 | 38.76 | 0.31 | <0.0001 |
| Ferulic acid | 86.26 | 0.64 | 0.1793 | 101.51 | 0.07 | 0.8530 |
| Quercetin | 30.18 | 0.36 | <0.0001 | 59.70 | 0.91 | <0.0001 |
| Caffeic acid | 20.92 | 0.44 | <0.0001 | 78.43 | 0.60 | 0.0086 |
| Thymol | 24.12 | 0.36 | <0.0001 | 0 | 0.00 | <0.0001 |
| Kaempferol | 43.11489362 | 0.1693 | <0.0001 | 86.40903881 | 0.04408 | 0.0940 |
| Naringenin | 1.925106383 | 0.1131 | <0.0001 | 51.95677092 | 0.1677 | <0.0001 |
| Vanillin | 81.95744681 | 0.6132 | 0.0791 | 84.93532012 | 0.6532 | 0.0638 |
Table A7.
Summary of growth curves challenging the Gram-negative pathogens with various phytochemicals at 0.5 mg/mL concentrations.
Table A7.
Summary of growth curves challenging the Gram-negative pathogens with various phytochemicals at 0.5 mg/mL concentrations.
| Gram-Negative Pathogens Growth Curve Average Endpoint States (%) |
|---|
| Phytochemical (0.5 mg/mL) | S. Typhimurium | P. aeruginosa |
|---|
| Normalised Endpoint State (CFU/mL) | SEM (±) | p-Value | Normalised Endpoint State (CFU/mL) | SEM (±) | p-Value |
|---|
| Solvent control | 100 | 1.07 | - | 100 | 0.06 | - |
| Prosur | 114.48 | 0.06 | 0.2964 | 88.45 | 1.04 | 0.2687 |
| Eriodictyol | 86.45 | 1.08 | 0.3283 | 101.77 | 0.08 | 0.8647 |
| Ferulic acid | 107.90 | 0.08 | 0.5678 | 99.85 | 0.08 | 0.9886 |
| Quercetin | 115.10 | 0.04 | 0.2762 | 101.78 | 0.03 | 0.8636 |
| Caffeic acid | 84.63 | 1.36 | 0.2679 | 98.32 | 0.06 | 0.8723 |
| Thymol | 33.22 | 0.76 | <0.0001 | 70.53 | 0.12 | 0.0057 |
| Kaempferol | 113.03 | 0.10 | 0.3469 | 97.92 | 0.11 | 0.8417 |
| Naringenin | 53.76 | 1.44 | 0.0012 | 53.77 | 1.59 | <0.0001 |
| Vanillin | 112.25 | 0.03 | 0.3764 | 87.32 | 1.02 | 0.2249 |
Table A8.
Summary of growth curves challenging the Gram-positive pathogens with various phytochemicals at 0.5 mg/mL concentrations.
Table A8.
Summary of growth curves challenging the Gram-positive pathogens with various phytochemicals at 0.5 mg/mL concentrations.
| Gram-Positive Pathogens Growth Curve Average Endpoint States (%) |
|---|
Phytochemical
(0.5 mg/mL) | S. aureus | L. monocytogenes |
|---|
| Normalised Endpoint State (CFU/mL) | SEM (±) | p-Value | Normalised Endpoint State (CFU/mL) | SEM (±) | p-Value |
|---|
| Solvent control | 100 | 0.05 | - | 100 | 0.12 | - |
| Prosur | 97.78 | 0.09 | 0.7720 | 61.21 | 1.35 | <0.0001 |
| Eriodictyol | 55.89 | 0.18 | <0.0001 | 64.69 | 0.26 | <0.0001 |
| Ferulic acid | 97.96 | 0.06 | 0.7904 | 104.53 | 0.03 | 0.5754 |
| Quercetin | 85.21 | 0.95 | 0.0559 | 98.17 | 0.11 | 0.8206 |
| Caffeic acid | 73.99 | 0.84 | 0.0010 | 64.17 | 0.73 | <0.0001 |
| Thymol | 56.81 | 0.27 | <0.0001 | 29.84 | 0.81 | <0.0001 |
| Kaempferol | 100.77 | 0.16 | 0.9194 | 102.77 | 0.05 | 0.7321 |
| Naringenin | 19.76 | 0.70 | <0.0001 | 55.79 | 0.60 | <0.0001 |
| Vanillin | 90.00 | 0.20 | 0.1934 | 102.92 | 0.03 | 0.7183 |
Table A9.
Summary of growth curves challenging the Gram-positive pathogens with various phytochemicals at 0.05 mg/mL concentrations.
Table A9.
Summary of growth curves challenging the Gram-positive pathogens with various phytochemicals at 0.05 mg/mL concentrations.
| Gram-Positive Pathogens Growth Curve Endpoint States (%) |
|---|
Phytochemical
(0.05 mg/mL) | S. aureus | L. monocytogenes |
|---|
| Normalised Endpoint State (vCFU/mL) | SEM (±) | p-Value | Normalised Endpoint State (vCFU/mL) | SEM (±) | p-Value |
|---|
| Solvent control | 100 | 0.22 | - | 100 | 0.12 | - |
| Prosur | 103.83 | 0.14 | 0.7205 | 105.73 | 0.03 | 0.4484 |
| Eriodictyol | 68.26 | 1.29 | 0.0038 | 99.64 | 0.14 | 0.9623 |
| Ferulic acid | 101.26 | 0.08 | 0.9069 | 104.34 | 0.07 | 0.5657 |
| Quercetin | 106.52 | 0.03 | 0.5427 | 54.06 | 1.17 | <0.0001 |
| Caffeic acid | 107.36 | 0.03 | 0.4916 | 44.85 | 1.15 | <0.0001 |
| Thymol | 25.86 | 1.15 | <0.0001 | 99.63 | 0.06 | 0.9601 |
| Kaempferol | 102.30 | 0.21 | 0.8297 | 106.39 | 0.04 | 0.3983 |
| Naringenin | 22.61 | 0.80 | <0.0001 | 102.74 | 0.03 | 0.7159 |
| Vanillin | 75.59 | 0.86 | 0.0246 | 84.58 | 0.56 | 0.0435 |
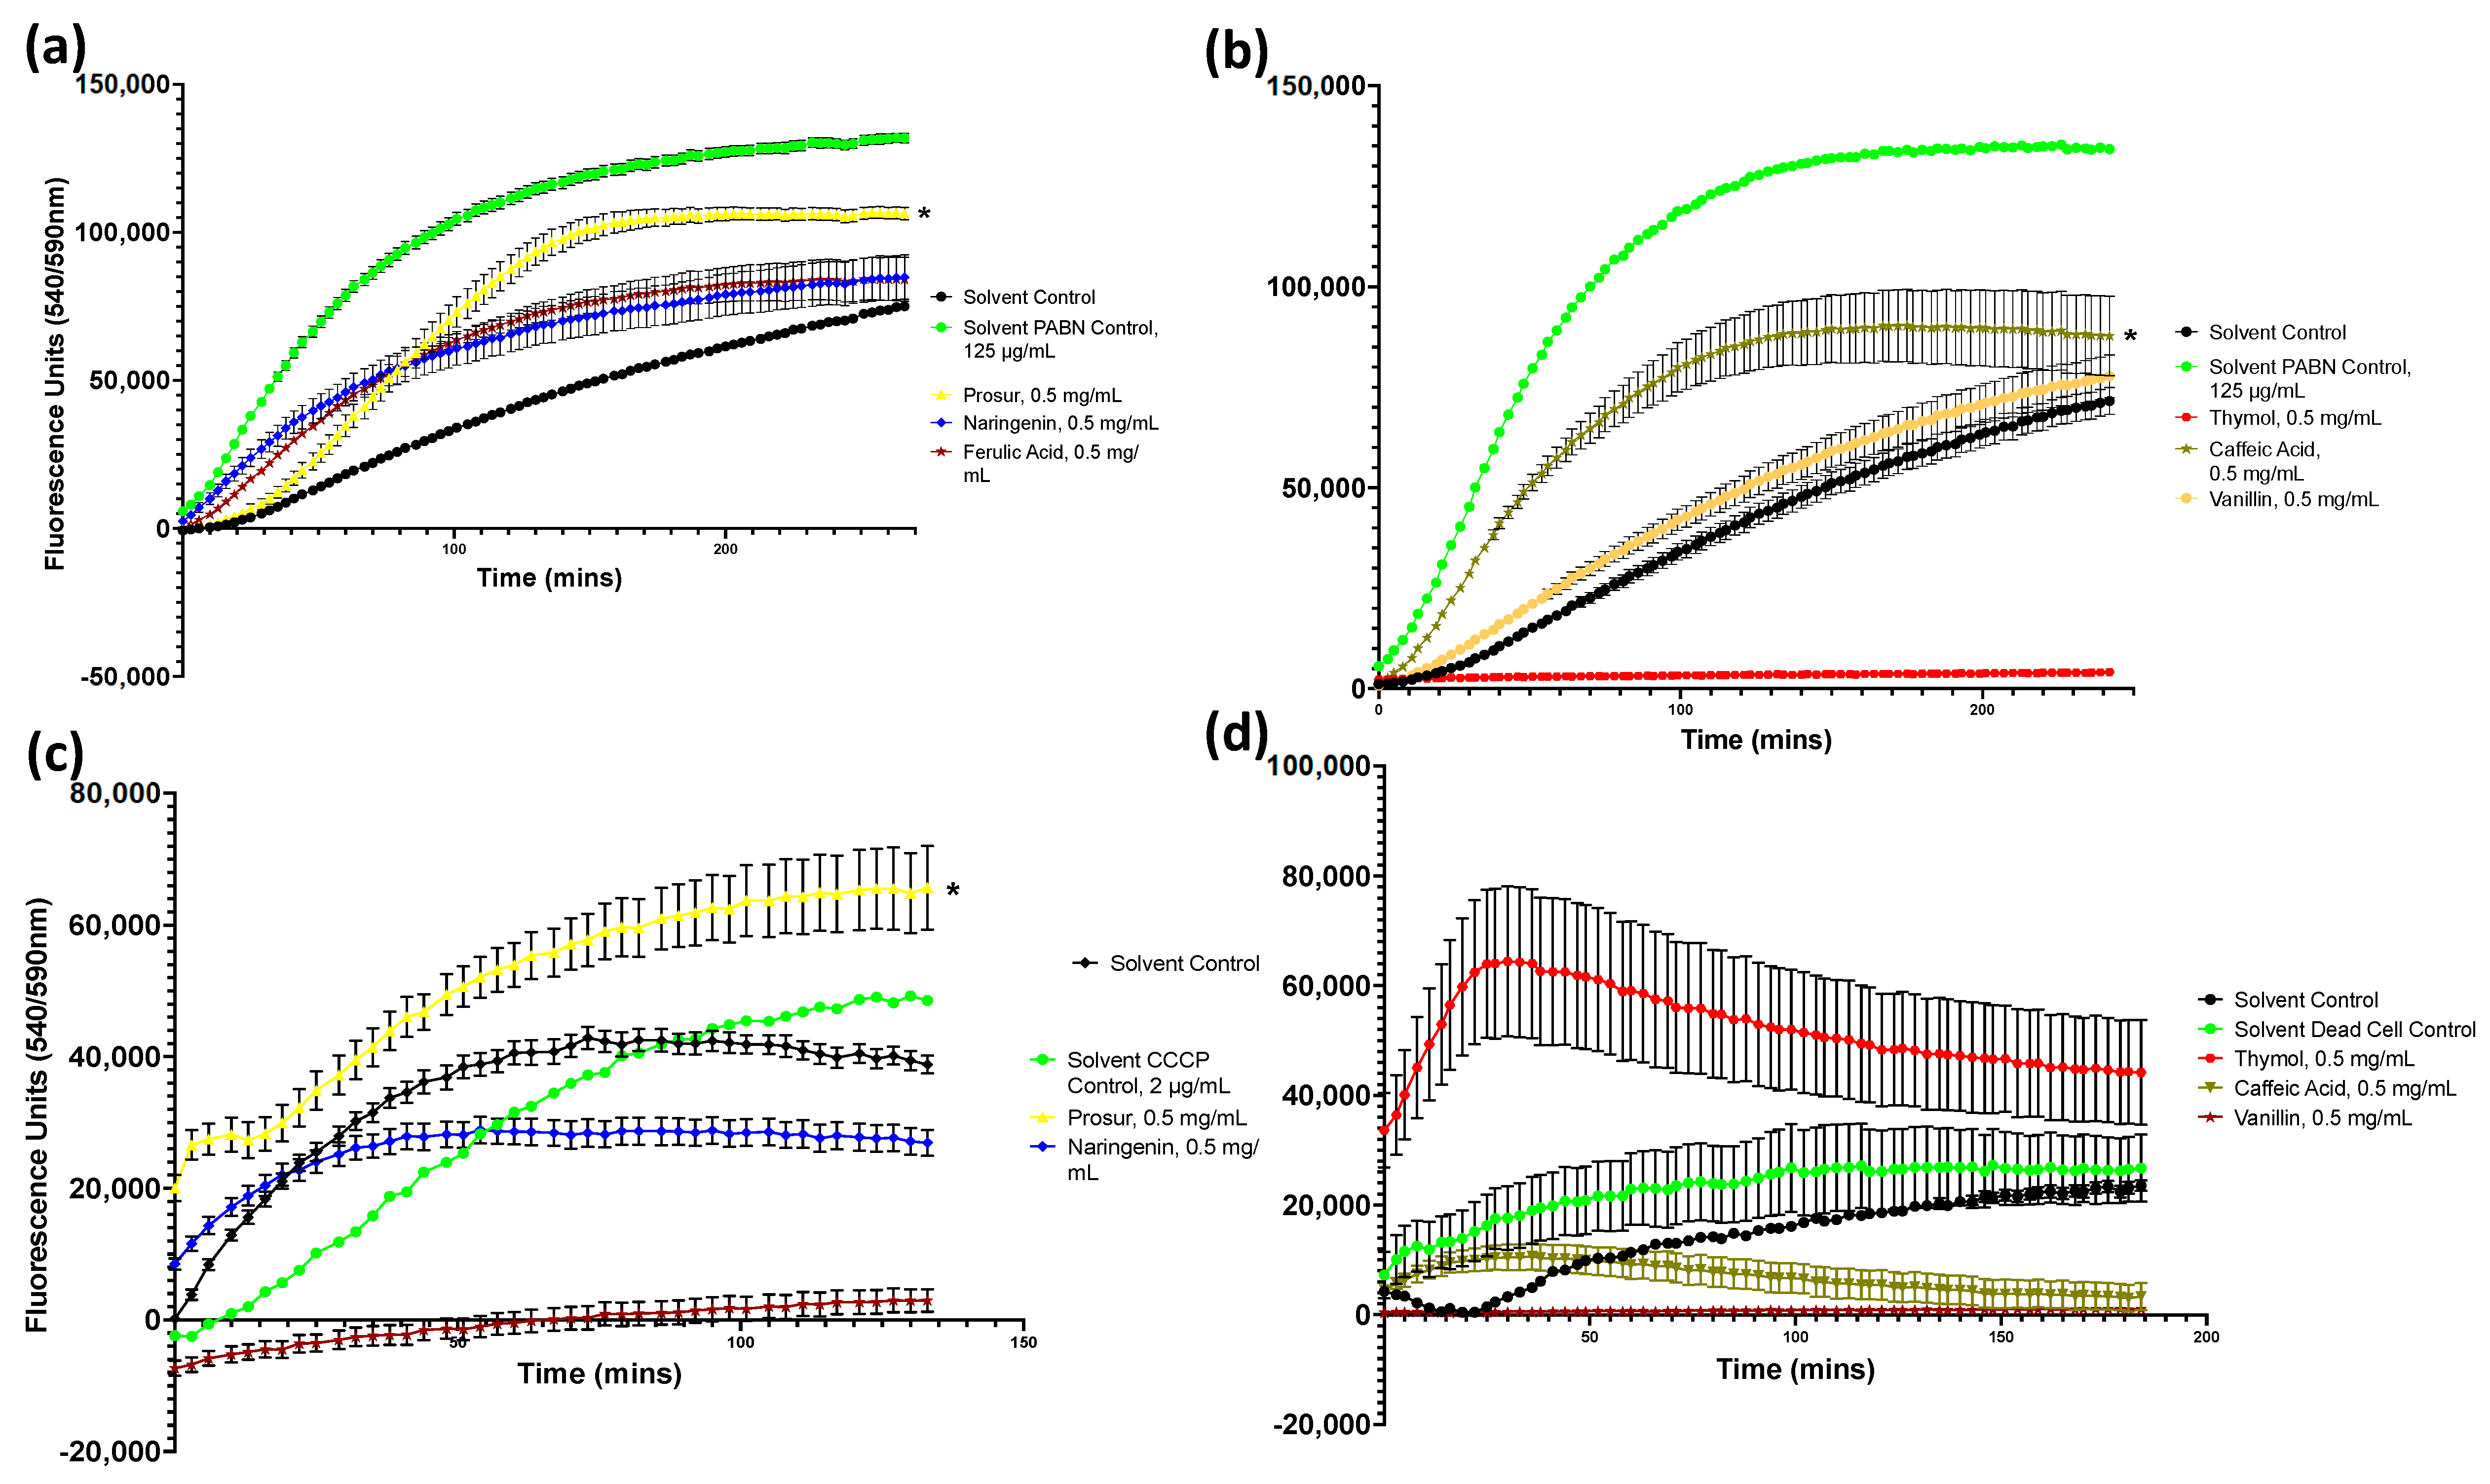
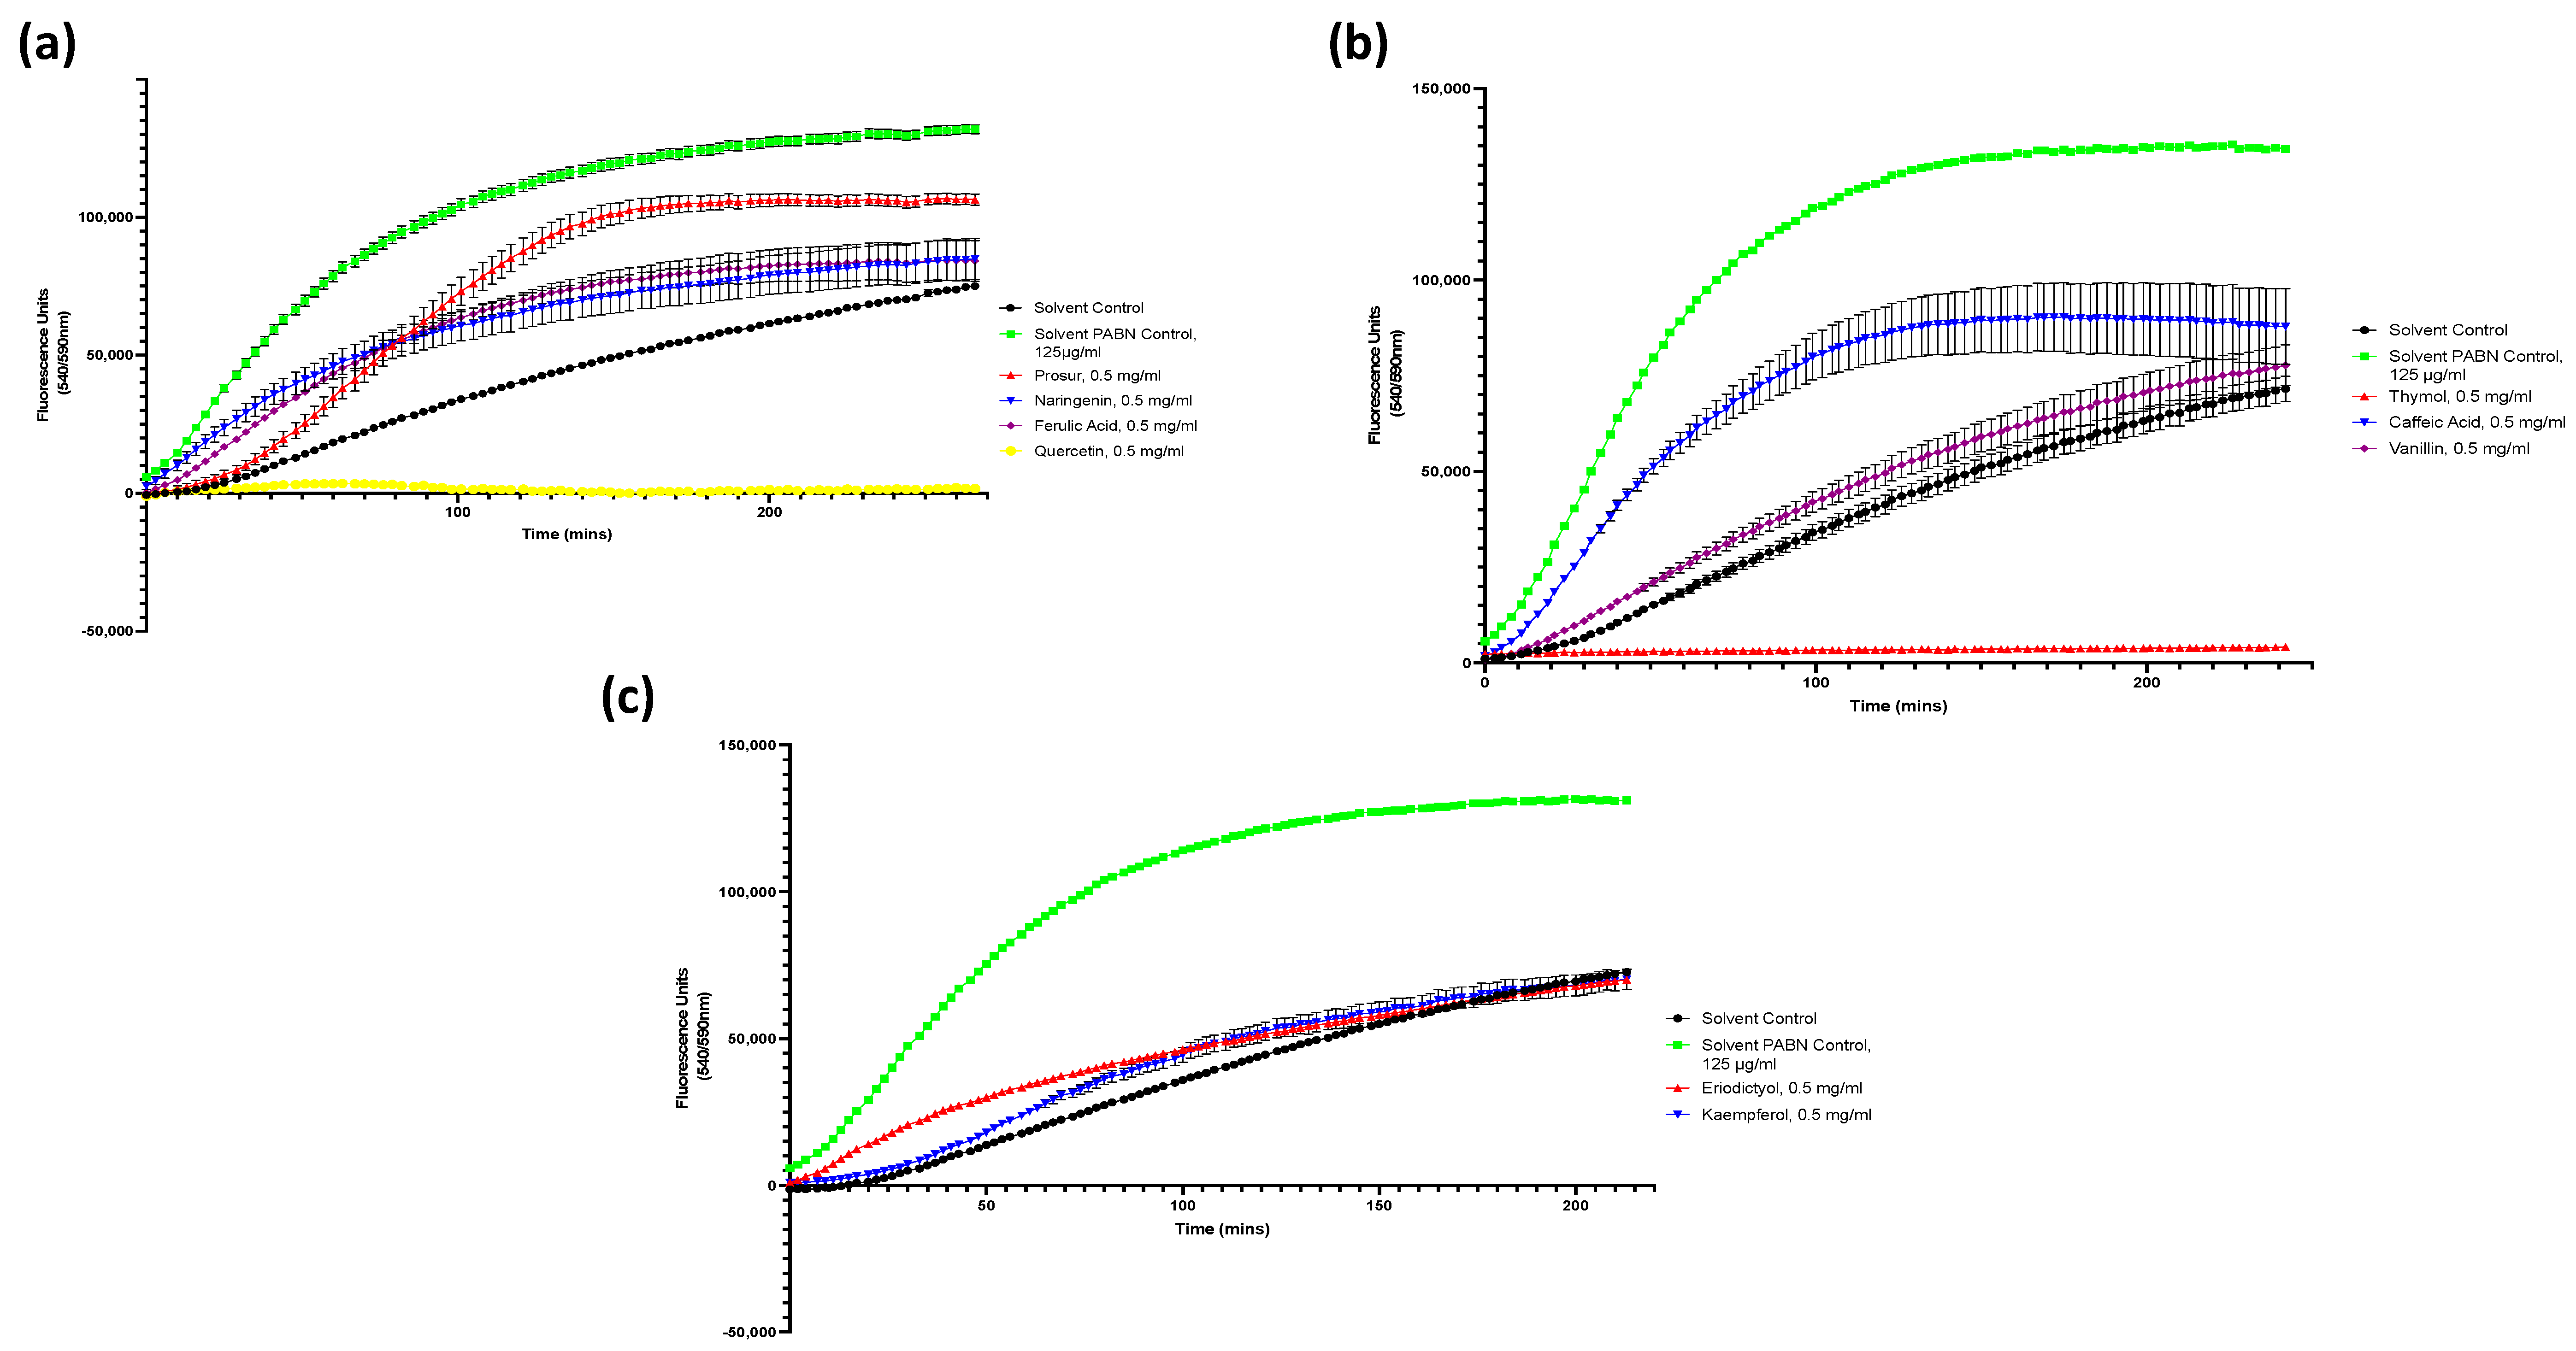
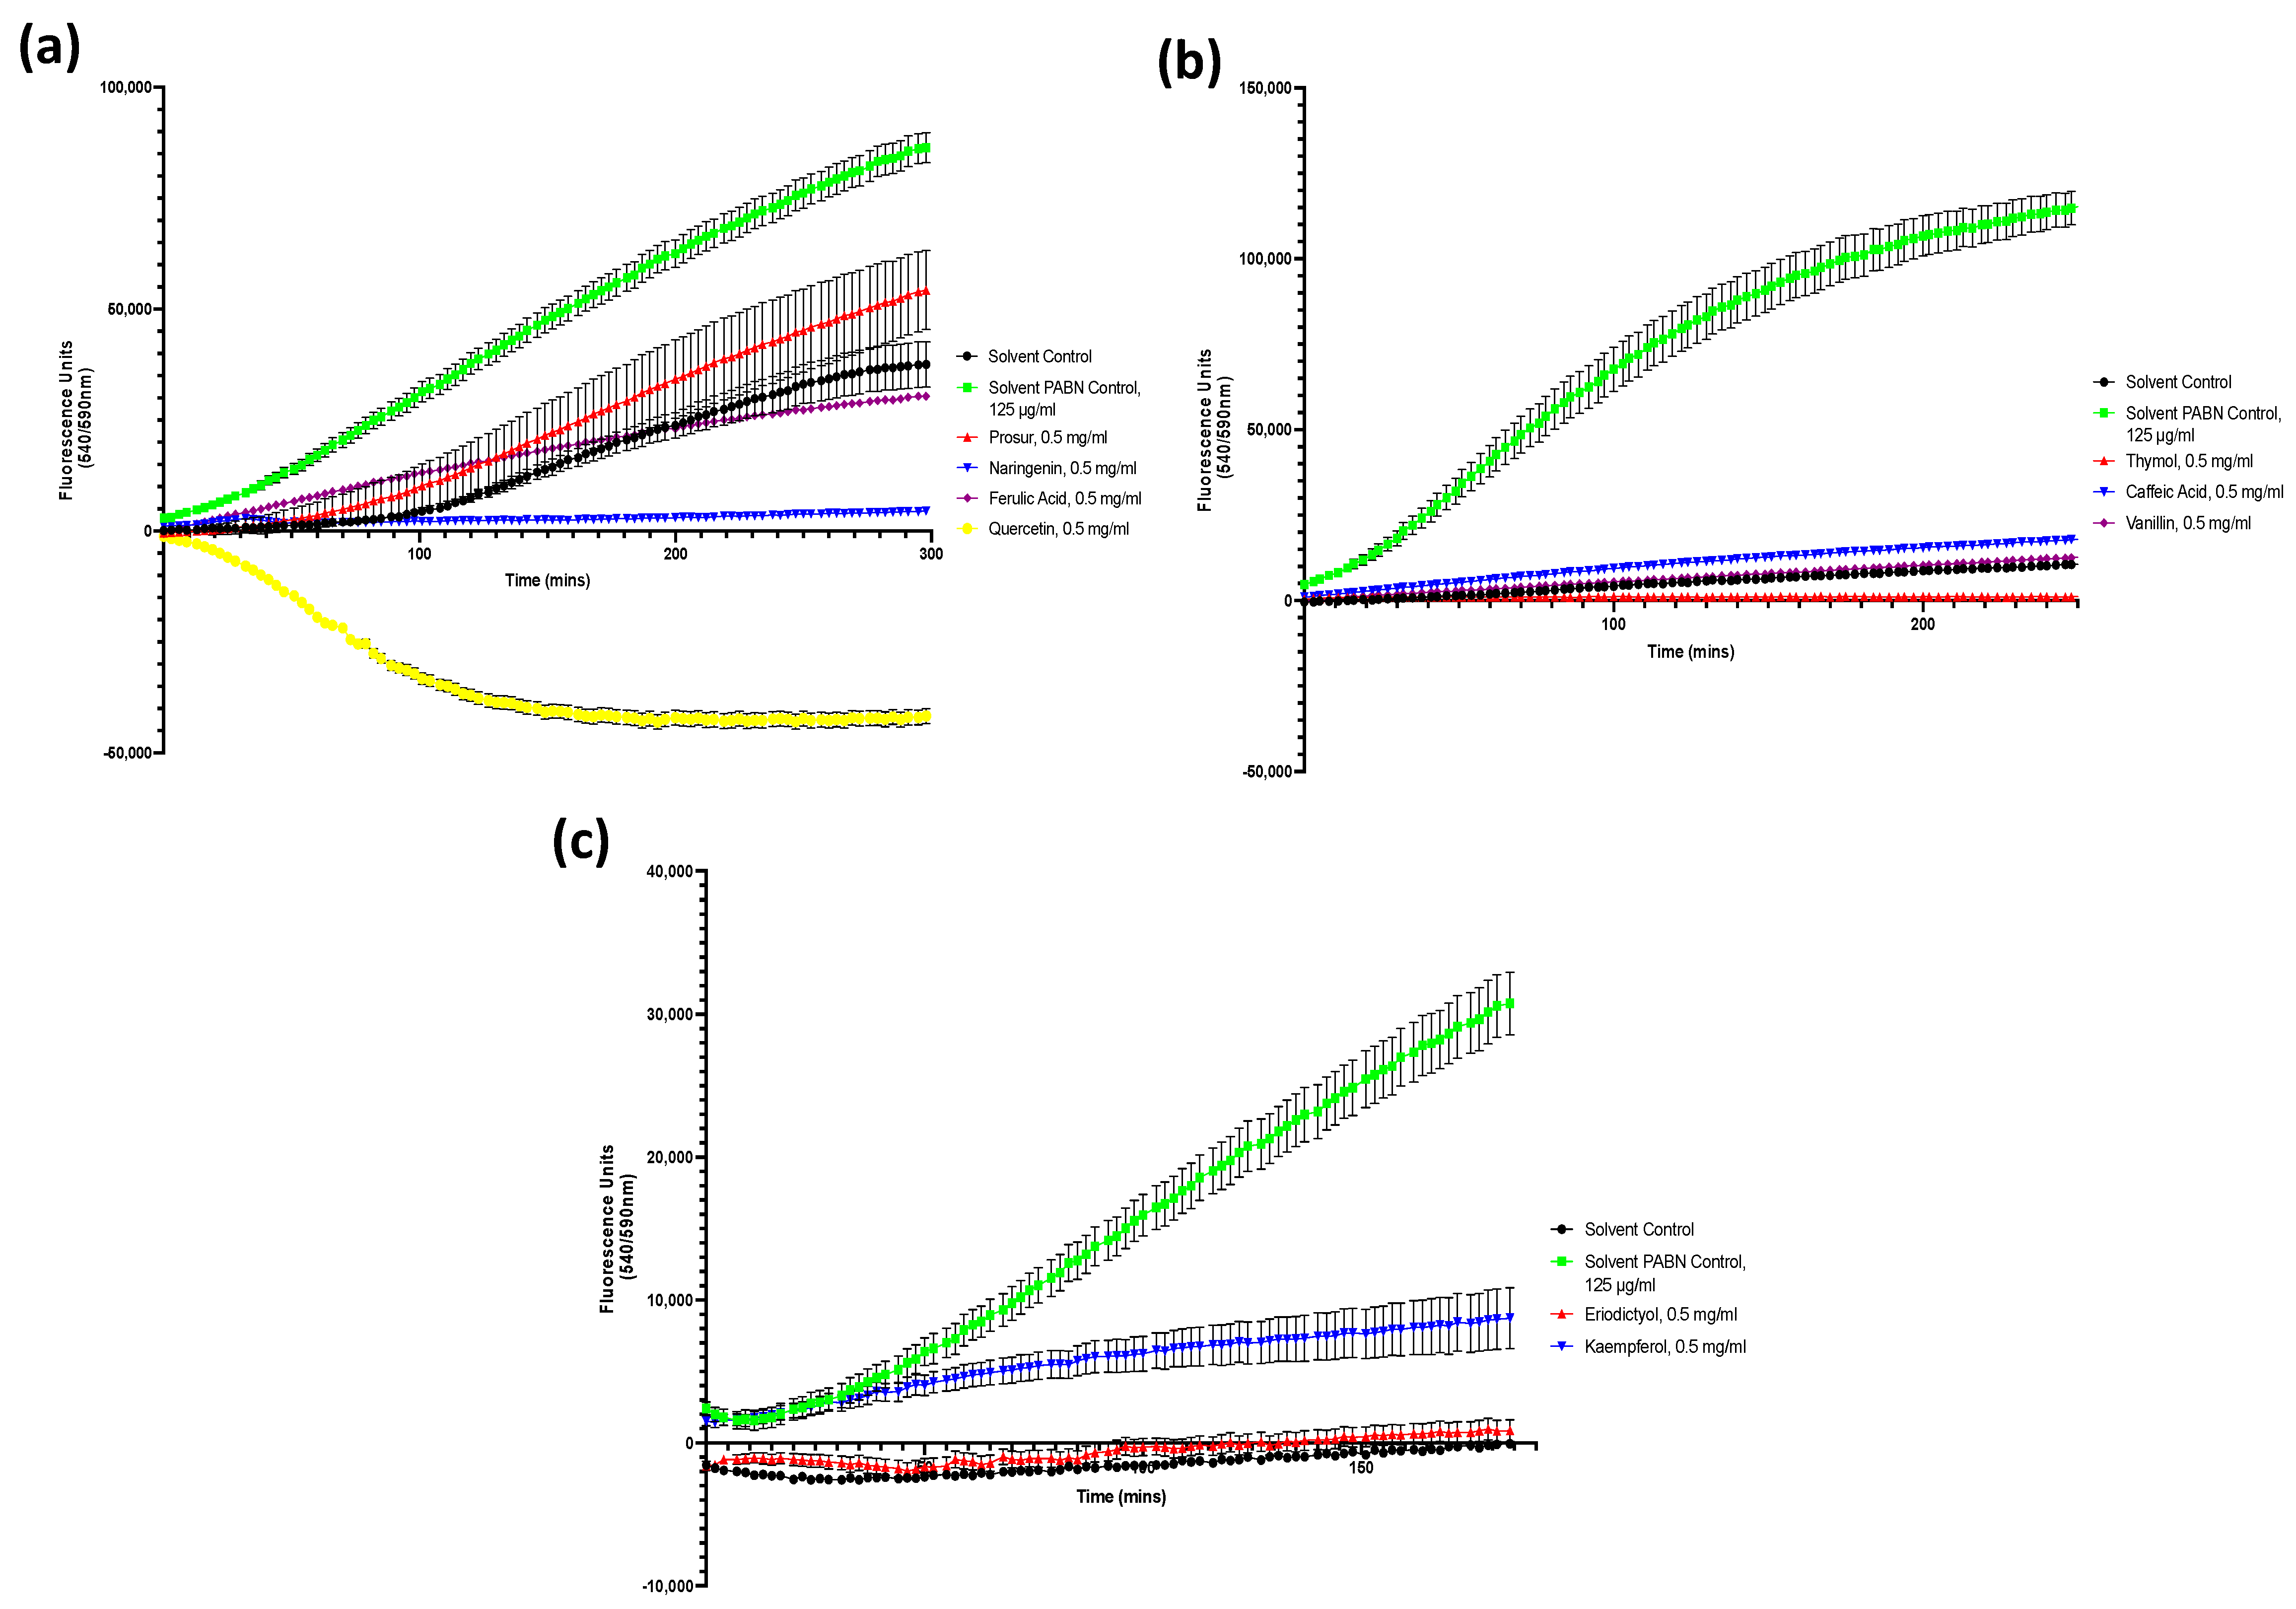
Figure A2.
Drug accumulation curves of S. Typhimurium challenged with 0.5 mg/mL of all nine tested phytochemicals. (a) S. Typhimurium challenged with the Prosur NATPRE T-10+ mix, naringenin, ferulic acid, and quercetin. (b) S. Typhimurium challenged with thymol, caffeic acid, and vanillin. (c) S. Typhimurium challenged with eriodictyol and kaempferol. Points show the blank-adjusted and averaged values of five technical replicates for three biological replicates. Error bars indicate SEM (±).
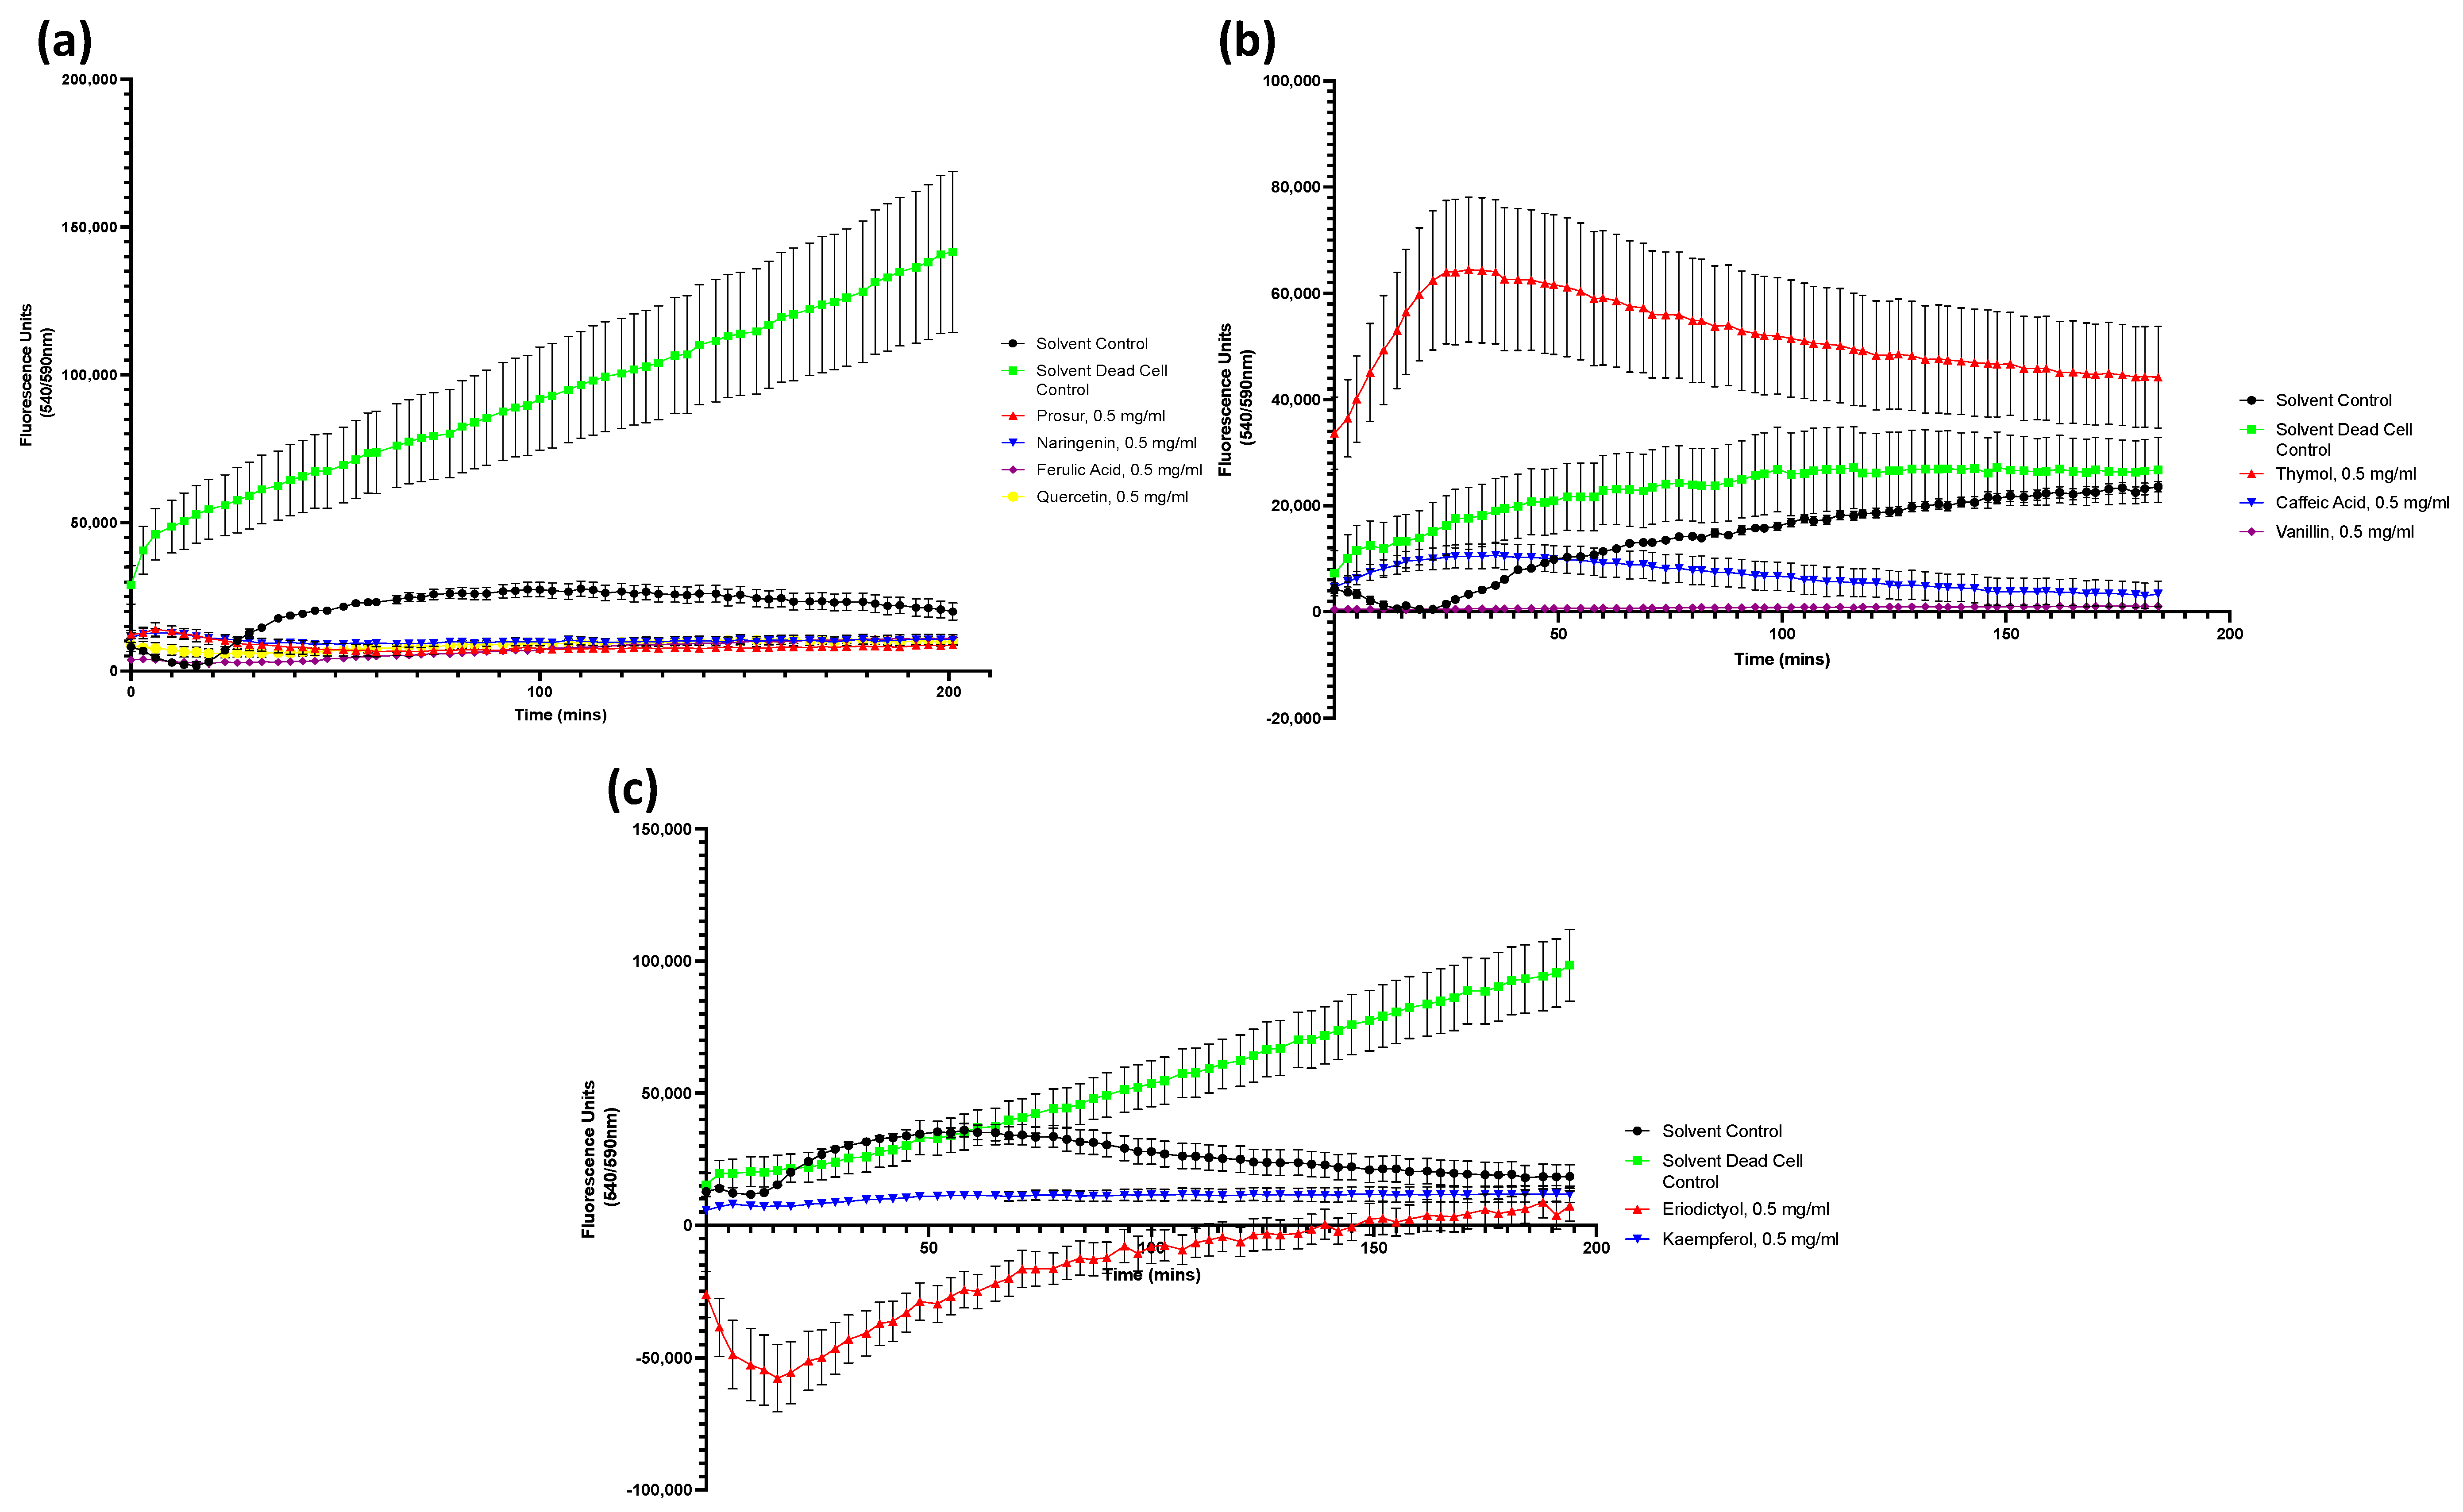
Figure A3.
Drug accumulation curves of S. aureus challenged with 0.5 mg/mL of all nine tested phytochemicals. (a) S. aureus challenged with the Prosur NATPRE T-10+ mix, naringenin, ferulic acid, and quercetin. (b) S. aureus challenged with thymol, caffeic acid, and vanillin. (c) S. aureus challenged with eridictyol and kaempferol. Points show the blank-adjusted and averaged values of five technical replicates for three biological replicates. Error bars indicate SEM (±).
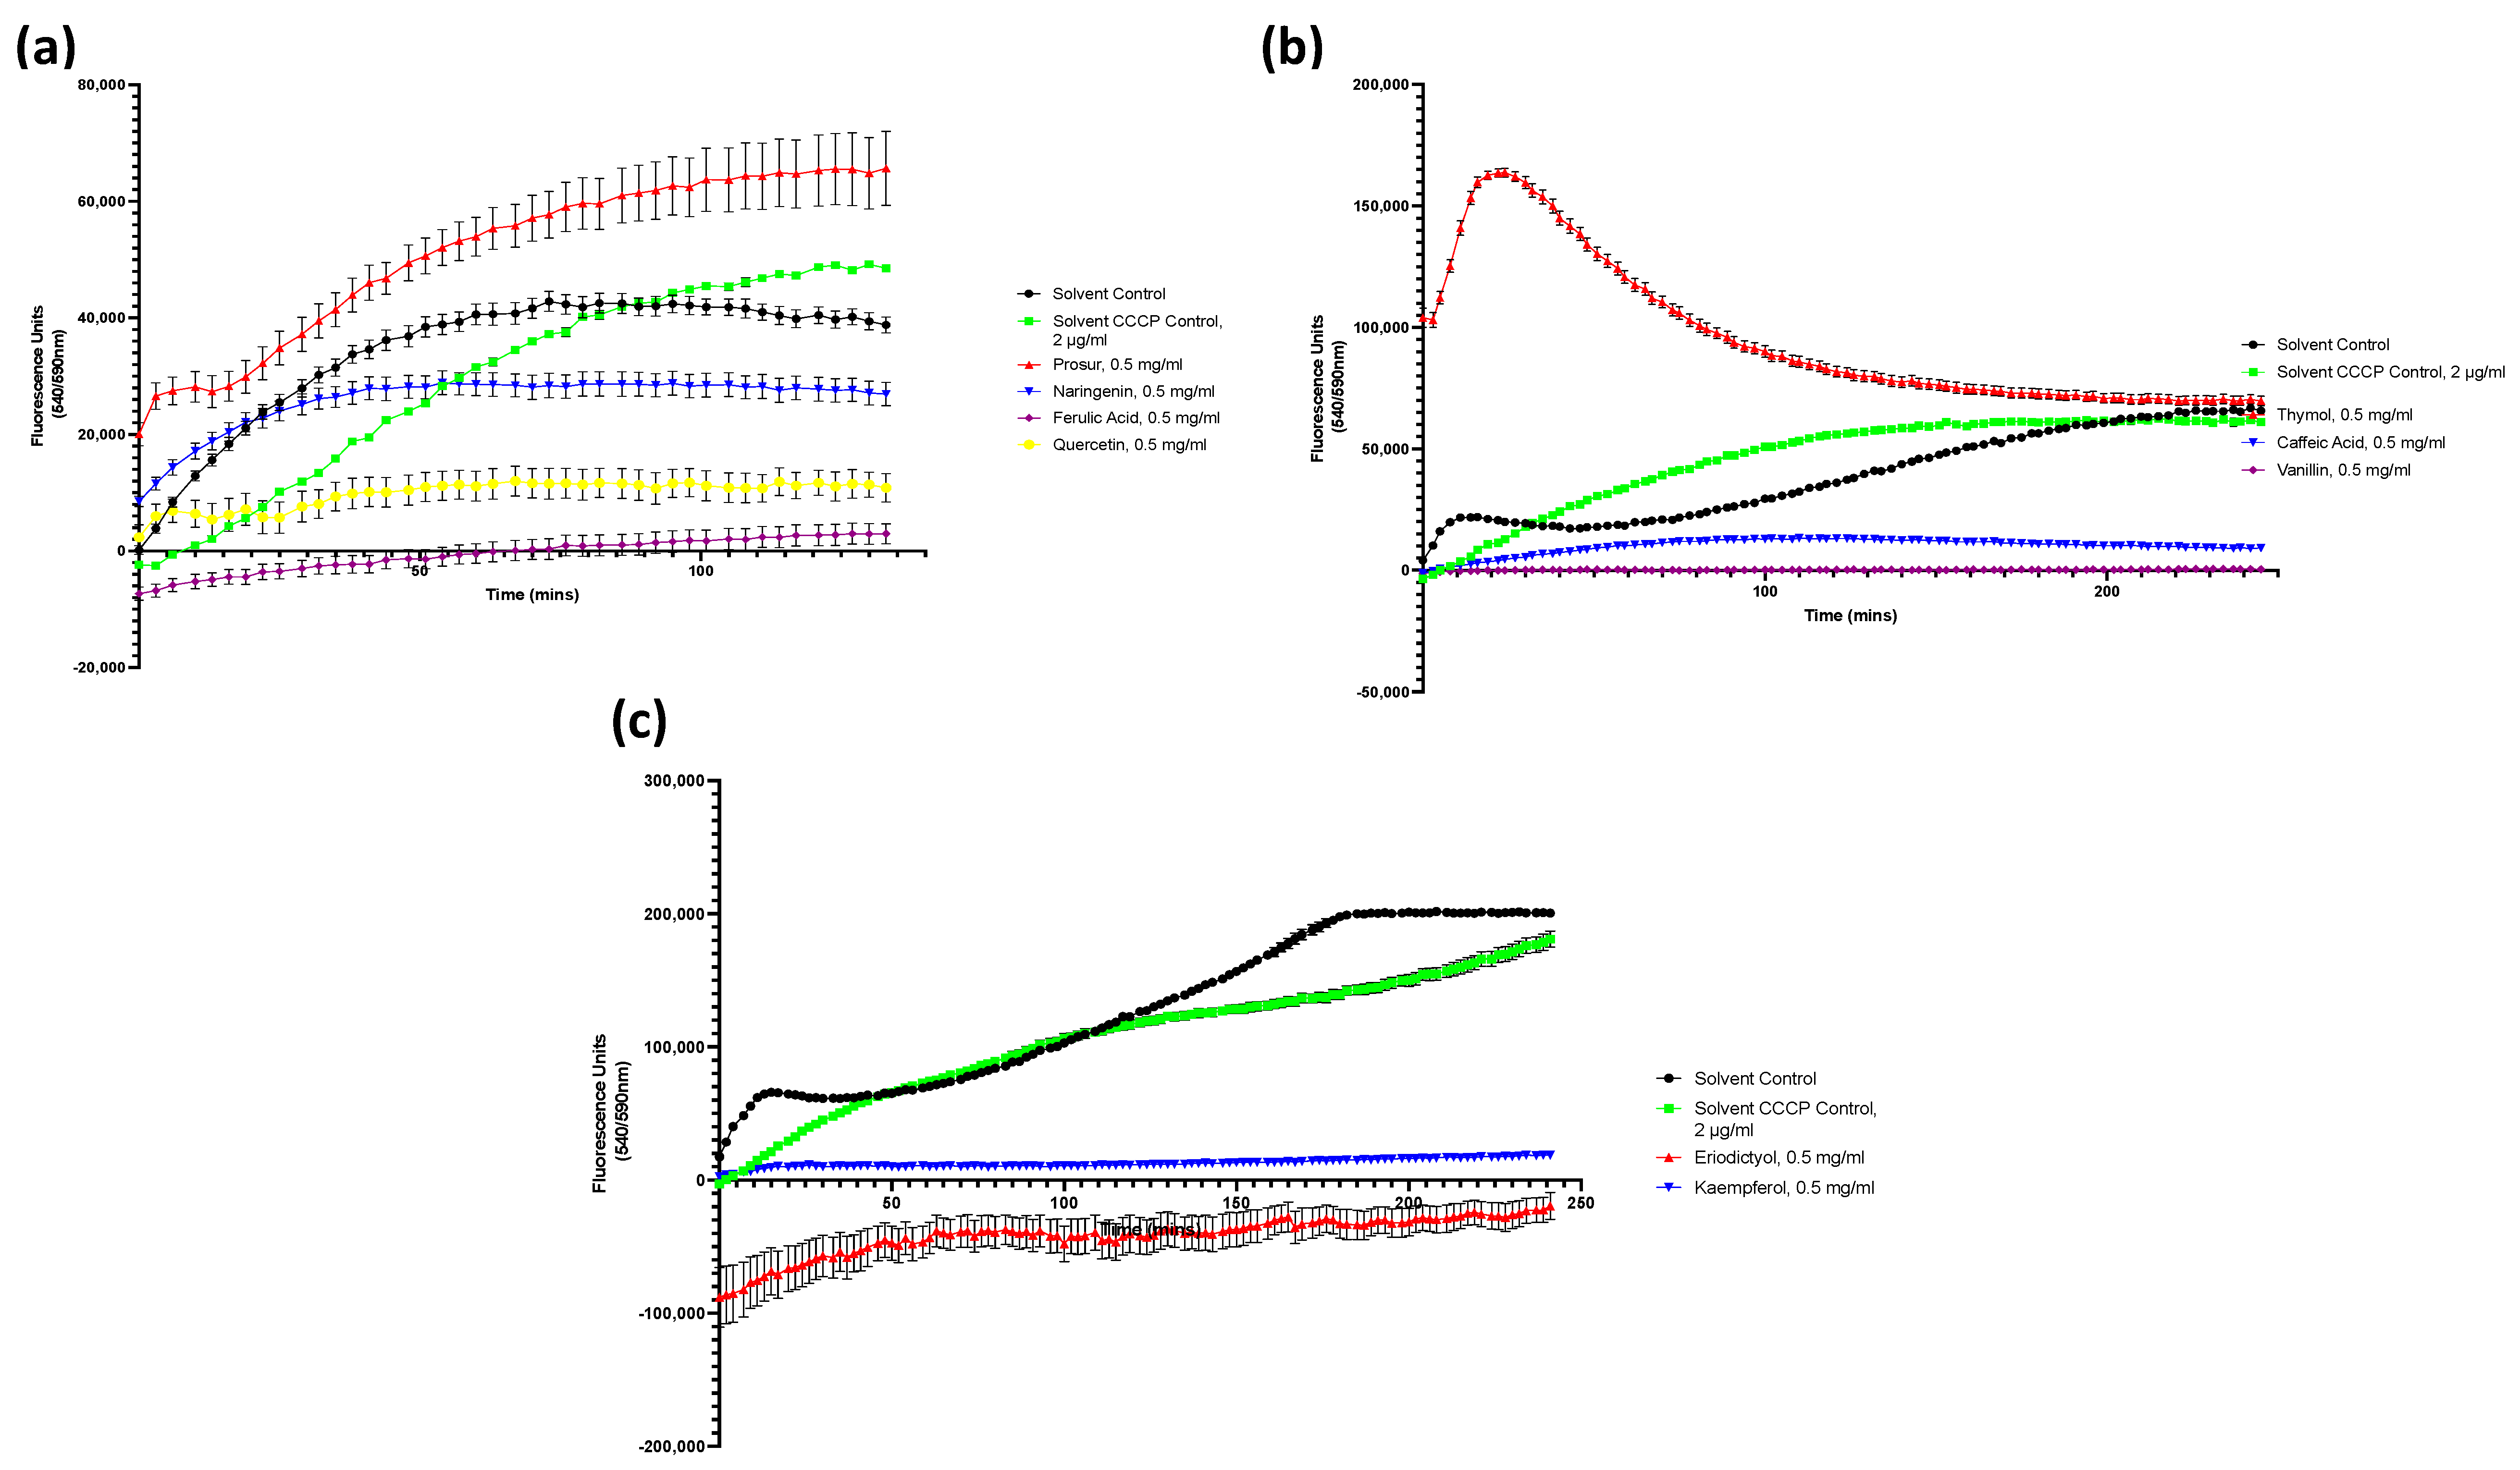
Figure A4.
Drug accumulation curves of P. aeruginosa challenged with 0.5 mg/mL of all nine tested phytochemicals. (a) P. aeruginosa challenged with the Prosur NATPRE T-10+ mix, naringenin, ferulic acid, and quercetin. (b) P. aeruginosa challenged with thymol, caffeic acid, and vanillin. (c) P. aeruginosa challenged with eriodictyol and kaempferol. Points show the blank-adjusted and averaged values of five technical replicates for three biological replicates. Error bars indicate SEM (±).
Figure A5.
Drug accumulation curves of L. monocytogenes challenged with 0.5 mg/mL of all nine tested phytochemicals. (a) L. monocytogenes challenged with the Prosur NATPRE T-10+ mix, naringenin, ferulic acid, and quercetin. (b) L. monocytogenes challenged with thymol, caffeic acid, and vanillin. (c) L. monocytogenes challenged with eriodictyol and kaempferol. Points show the blank-adjusted and averaged values of five technical replicates for three biological replicates. Error bars indicate SEM (±).
Table A10.
Summary of drug accumulation assays challenging the Gram-negative pathogens with various phytochemicals at 0.05 mg/mL concentrations.
Table A10.
Summary of drug accumulation assays challenging the Gram-negative pathogens with various phytochemicals at 0.05 mg/mL concentrations.
| Gram-Negative Pathogens Drug Accumulation Assays Average Fluorescence Accumulation Velocities (%) |
|---|
Phytochemical
(0.5 mg/mL) | S. Typhimurium | P. aeruginosa |
|---|
| Normalised Fluorescence Accumulation Velocity (Fluorescence Units/min) | SEM (±) | p-Value | Normalised Fluorescence Accumulation Velocity (Fluorescence Units/min) | SEM (±) | p-Value |
|---|
| Solvent control | 100 | 12.28 | - | 100 | 14.55 | - |
| Positive control | 197.30 | 5.95 | <0.0001 | 506.62 | 30.74 | <0.0001 |
| Prosur | 169.80 | 15.57 | <0.0001 | 300.56 | 37.47 | <0.0001 |
| Eriodictyol | 108.53 | 4.03 | 0.3430 | 24.96 | 2.73 | 0.0449 |
| Ferulic acid | 129.14 | 26.82 | 0.0014 | 186.53 | 3.56 | 0.0210 |
| Quercetin | 2.23 | N/D | N/D | −282.52 | N/D | N/D |
| Caffeic acid | 140.80 | 47.14 | <0.0001 | 108.54 | 3.41 | 0.8184 |
| Thymol | 2.36 | 0.43 | <0.0001 | 4.18 | 0.21 | 0.0108 |
| Kaempferol | 108.91 | 18.82 | 0.3218 | 57.33 | 10.80 | 0.2521 |
| Naringenin | 117.93 | 30.66 | 0.0473 | 16.63 | 2.84 | 0.0261 |
| Vanillin | 104.80 | 25.57 | 0.5938 | 84.21 | 2.65 | 0.6713 |
Table A11.
Summary of drug accumulation assays challenging the Gram-positive pathogens with various phytochemicals at 0.05 mg/mL concentrations.
Table A11.
Summary of drug accumulation assays challenging the Gram-positive pathogens with various phytochemicals at 0.05 mg/mL concentrations.
| Gram-Positive Pathogens Drug Accumulation Assays Average Fluorescence Accumulation Velocities (%) |
|---|
Phytochemical
(0.5 mg/mL) | S. aureus | L. monocytogenes |
|---|
| Normalised Fluorescence Accumulation Velocity (Fluorescence Units/min) | SEM (±) | p-Value | Normalised Fluorescence Accumulation Velocity (Fluorescence Units/min) | SEM (±) | p-Value |
|---|
| Solvent control | 100 | 97.15 | - | 100 | 12.02 | - |
| Positive control | 95.34 | 61.60 | 0.7157 | 565.91 | 64.85 | <0.0001 |
| Prosur | 52.46 | 36.82 | 0.0003 | −27.54 | 8.23 | 0.0310 |
| Eriodictyol | 62.45 | 80.66 | 0.0038 | 267.68 | 50.83 | 0.0048 |
| Ferulic acid | 12.96 | 5.768 | <0.0001 | 57.69 | 2.36 | 0.4713 |
| Quercetin | 7.20 | 6.64 | N/D | 8.72 | 12.84 | N/D |
| Caffeic acid | 13.10 | 3.10 | <0.0001 | −10.70 | 9.43 | 0.0608 |
| Thymol | −34.90 | 16.69 | <0.0001 | 89.11 | 18.20 | 0.8528 |
| Kaempferol | 14.01 | 10.41 | <0.0001 | 48.06 | 13.63 | 0.3768 |
| Naringenin | 16.69 | 9.03 | <0.0001 | −5.39 | 8.68 | 0.0740 |
| Vanillin | 1.38 | 1.48 | <0.0001 | 5.02 | 0.55 | 0.1071 |
Table A12.
Summary of drug accumulation assays challenging the Gram-negative pathogens with various phytochemicals at 0.05 mg/mL concentrations.
Table A12.
Summary of drug accumulation assays challenging the Gram-negative pathogens with various phytochemicals at 0.05 mg/mL concentrations.
| Gram-Negative Pathogens Drug Accumulation Assays Average Steady State Fluorescence Accumulation (%) |
|---|
| Phytochemical (0.5 mg/mL) | S. Typhimurium | P. aeruginosa |
|---|
| Normalised Steady State Fluorescence Accumulation (Fluorescence Units) | SEM (±) | p-Value | Normalised Steady State Fluorescence Accumulation (Fluorescence Units) | SEM (±) | p-Value |
|---|
| Solvent control | 100 | 887.2 | - | 100 | 5517 | - |
| Positive control | 100 | 789.6 | 0.7690 | 370.21 | 4027 | <0.0001 |
| Prosur | 76.99 | 9701 | 0.0007 | 318.34 | 3969 | <0.0001 |
| Eriodictyol | 79.63 | 1133 | 0.0026 | 36.11 | 1192 | <0.0001 |
| Ferulic acid | 59.64 | 11683 | <0.0001 | 250.17 | 807.5 | <0.0001 |
| Quercetin | 4.06 | N/D | N/D | N/D | N/D | N/D |
| Caffeic acid | 53.70 | 9890 | <0.0001 | 107.66 | 1496 | 0.5869 |
| Thymol | 4.37 | 380.6 | <0.0001 | 4.09 | 189.2 | <0.0001 |
| Kaempferol | 51.63 | 1199 | <0.0001 | 44.49 | 2722 | <0.0001 |
| Naringenin | 88.52 | 2307 | 0.0867 | 74.02 | 1565 | 0.0668 |
| Vanillin | 75.64 | 6260 | 0.0003 | 171.61 | 3806 | <0.0001 |
Table A13.
Summary of drug accumulation assays challenging the Gram-positive pathogens with various phytochemicals at 0.05 mg/mL concentrations.
Table A13.
Summary of drug accumulation assays challenging the Gram-positive pathogens with various phytochemicals at 0.05 mg/mL concentrations.
| Gram-Positive Pathogens Drug Accumulation Assays Average Steady State Fluorescence Accumulation (%) |
|---|
Polyphenol
(0.5 mg/mL) | S. aureus | L. monocytogenes |
|---|
| Normalised Steady State Fluorescence Accumulation (Fluorescence Units) | SEM (±) | p-Value | Normalised Steady State Fluorescence Accumulation (Fluorescence Units) | SEM (±) | p-Value |
|---|
| Solvent control | 100 | 20488 | - | 100 | 2901 | - |
| Positive control | 108.03 | 20032 | 0.5893 | 1024.55 | 23660 | <0.0001 |
| Prosur | 106.33 | 9631 | 0.6704 | 809.83 | 15129 | <0.0001 |
| Eriodictyol | 16.82 | 11308 | <0.0001 | 128.89 | 2630 | 0.7475 |
| Ferulic acid | 13.11 | 1894 | <0.0001 | 71.58 | 769.6 | 0.7515 |
| Quercetin | 5.91 | N/D | N/D | 12.27 | 1095 | N/D |
| Caffeic acid | 7.02 | 986.9 | <0.0001 | −1.51 | 1590 | 0.2588 |
| Thymol | 93.37 | 3219 | 0.6558 | 386.07 | 10075 | 0.0017 |
| Kaempferol | 31.46 | 3307 | <0.0001 | 148.95 | 1307 | 0.5855 |
| Naringenin | 20.46 | 3114 | <0.0001 | 59.46 | 1381 | 0.6515 |
| Vanillin | 0.77 | 155.5 | <0.0001 | 11.02 | 330.2 | 0.3220 |
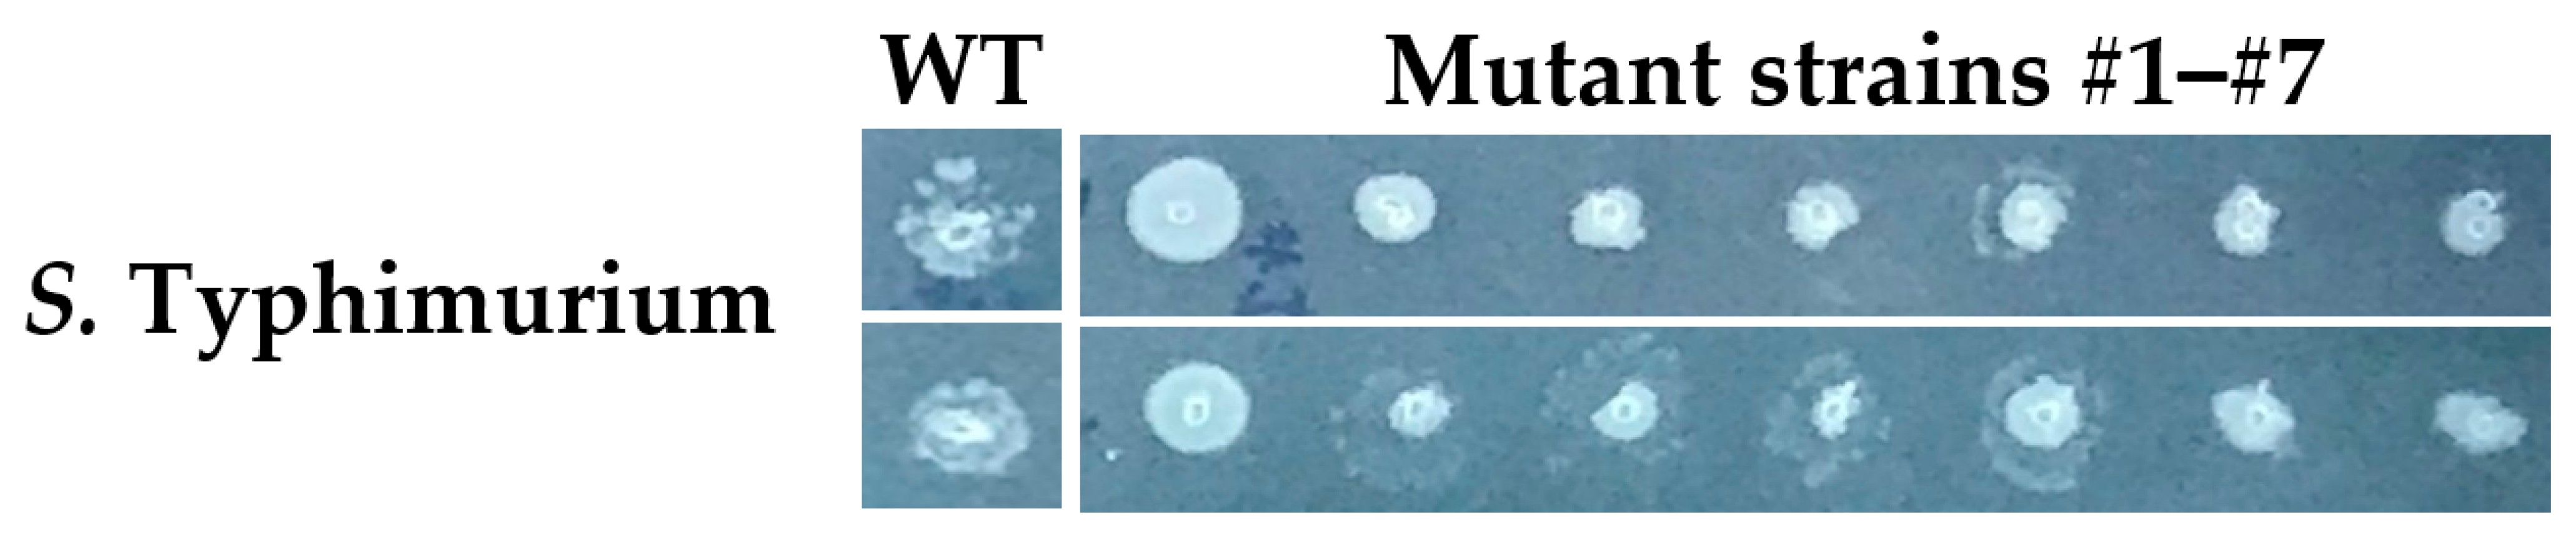
Figure A6.
Colony morphologies of thymol-selected mutant and parental strains of S. Typhimurium. S. Typhimurium parental and thymol-selected mutant colonies grown overnight at 37 °C on LB agar laced with 0.25 mg/mL thymol. Note the larger, healthier colonies of mutant strain #1, in particular. The experiment was performed in biological duplicate.
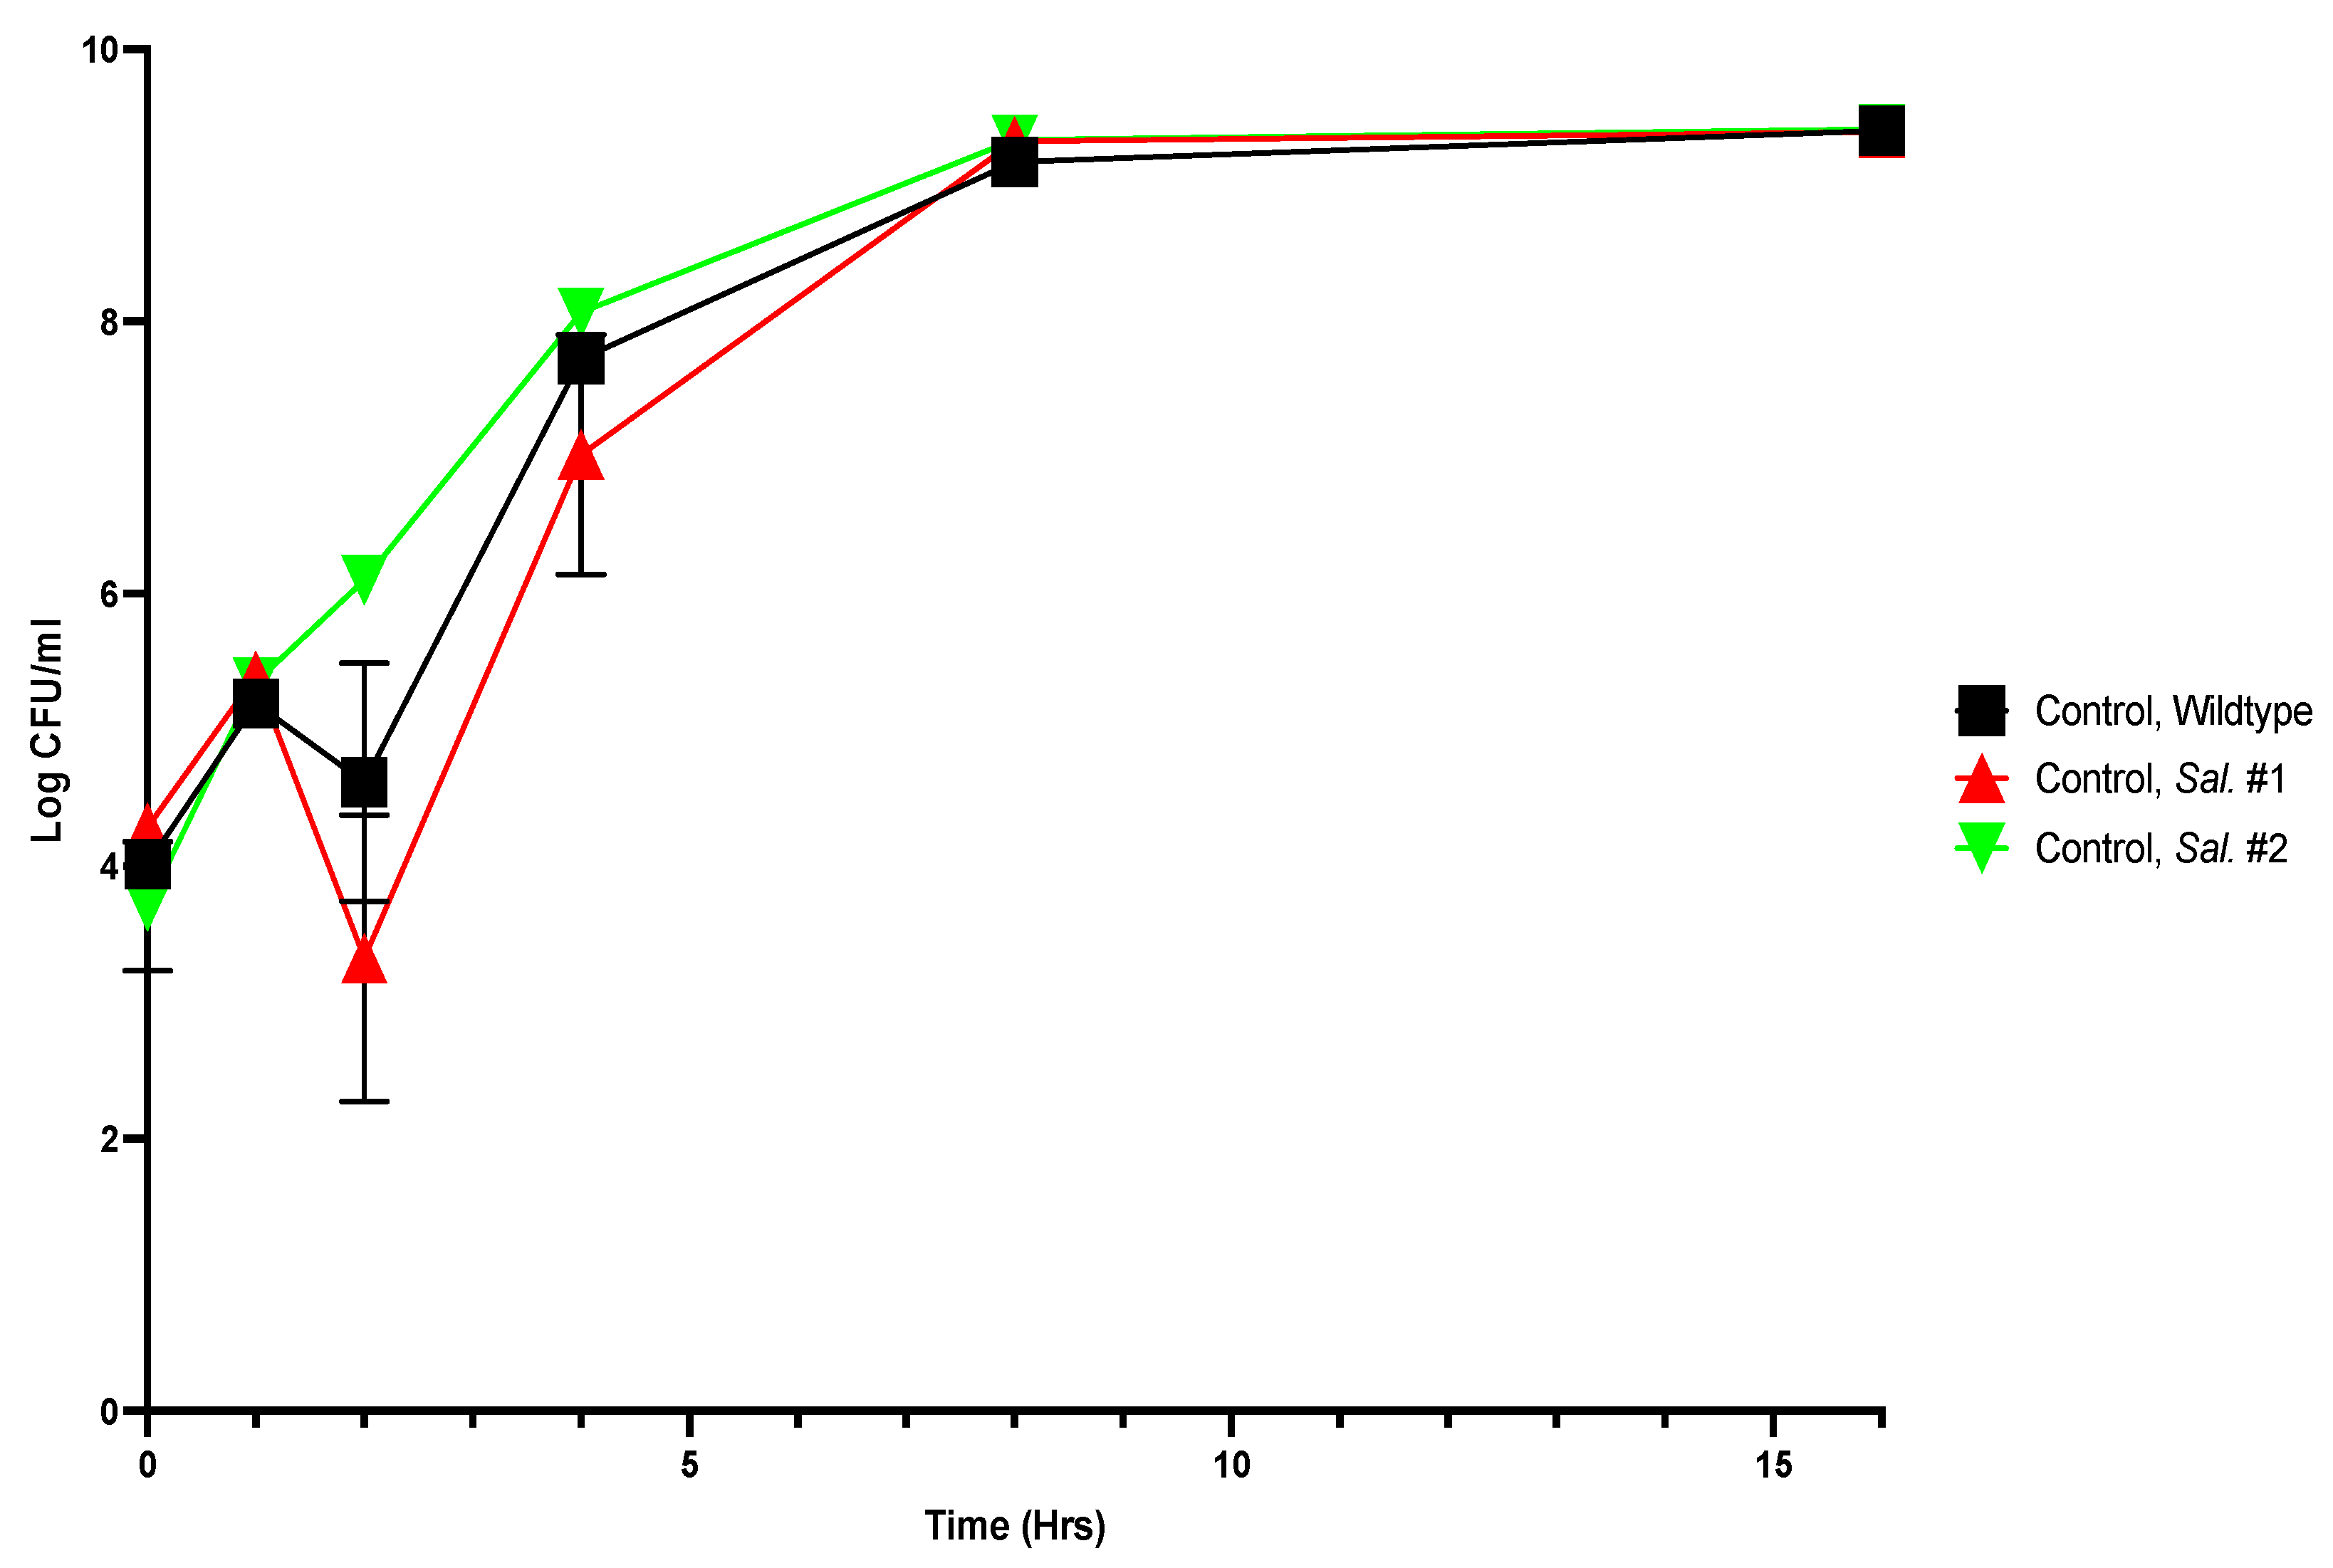
Figure A7.
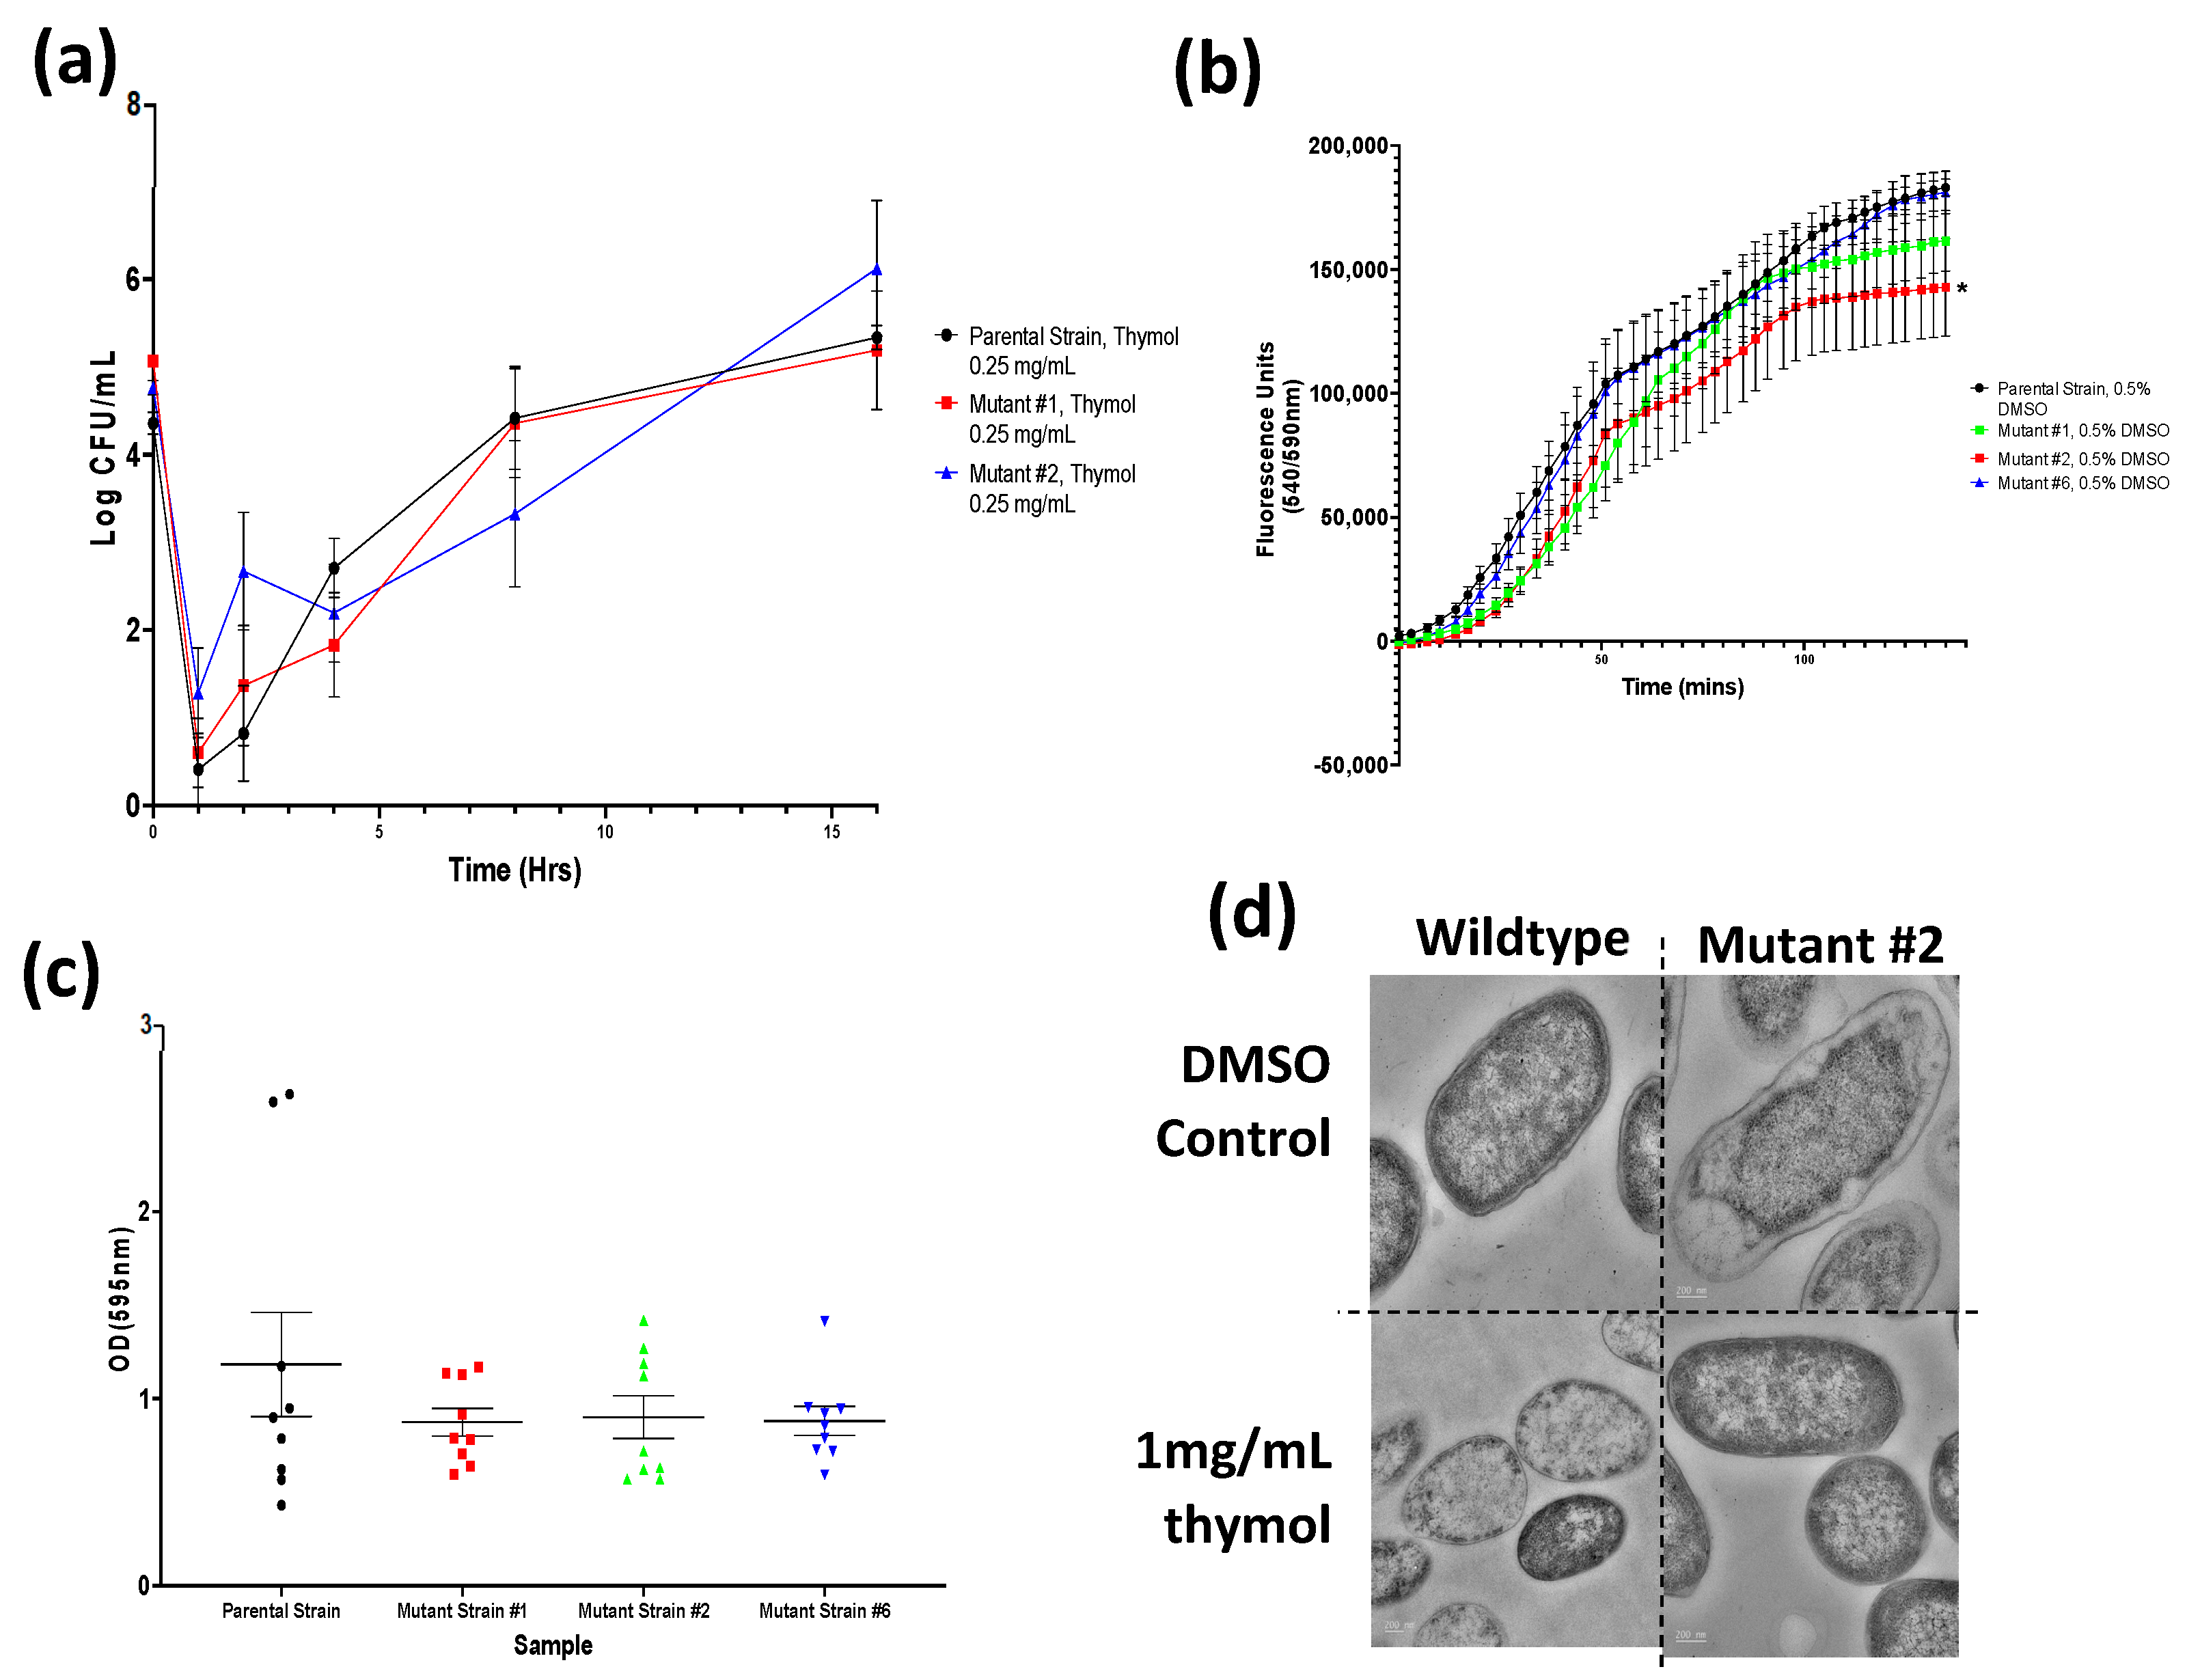
Growth curves of thymol-selected S. Typhimurium mutants, unchallenged by thymol.
Figure A7.
Growth curves of thymol-selected S. Typhimurium mutants, unchallenged by thymol.
Viable numbers (based on CFU/mL) of the S. Typhimurium parental and two thymol-selected mutant strains. Experiments were repeated with three biological replicates (three technical replicates each) over an incubation period of 16 h. Graphs display the averaged values of three technical replicates for three biological replicates. Error bars indicate SEM (±).
Figure A8.
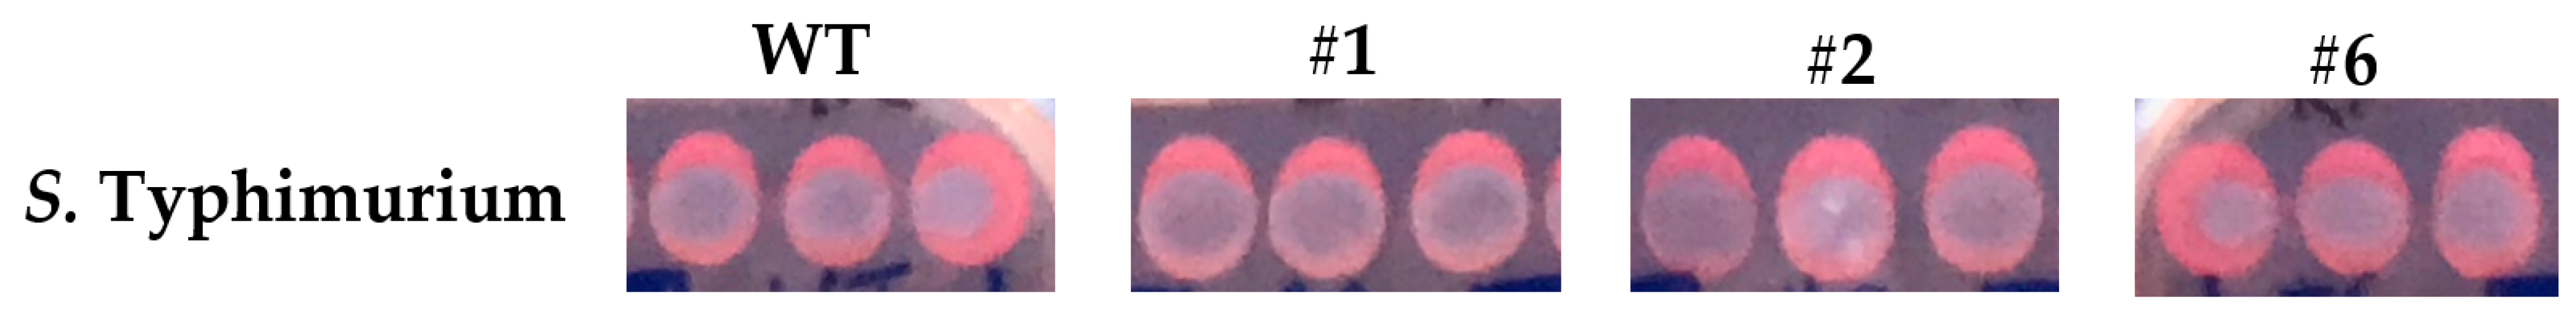
Congo red staining of the S. Typhimurium parental and thymol-selected mutant colonies. S. Typhimurium parental and thymol-selected mutant colonies grown overnight at 37 °C on LB-NaCl agar laced with 40 μg/mL congo red. Note the lesser degree of congo red staining for the S. Typhimurium mutant strains #1 and #2 compared to the parental strain. Compare these also to mutant strain #6, which lacks efflux-associated SNPs. The experiment was performed in biological duplicate.
Figure A8.
Congo red staining of the S. Typhimurium parental and thymol-selected mutant colonies. S. Typhimurium parental and thymol-selected mutant colonies grown overnight at 37 °C on LB-NaCl agar laced with 40 μg/mL congo red. Note the lesser degree of congo red staining for the S. Typhimurium mutant strains #1 and #2 compared to the parental strain. Compare these also to mutant strain #6, which lacks efflux-associated SNPs. The experiment was performed in biological duplicate.

 and
and 


