Percentiles and Reference Values for Accelerometric Gait Assessment in Women Aged 50–80 Years

 ,
, 

Abstract
:
1. Introduction
2. Materials and Methods
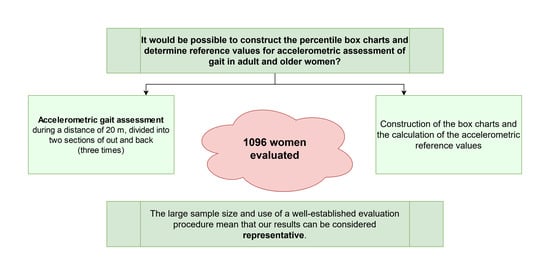
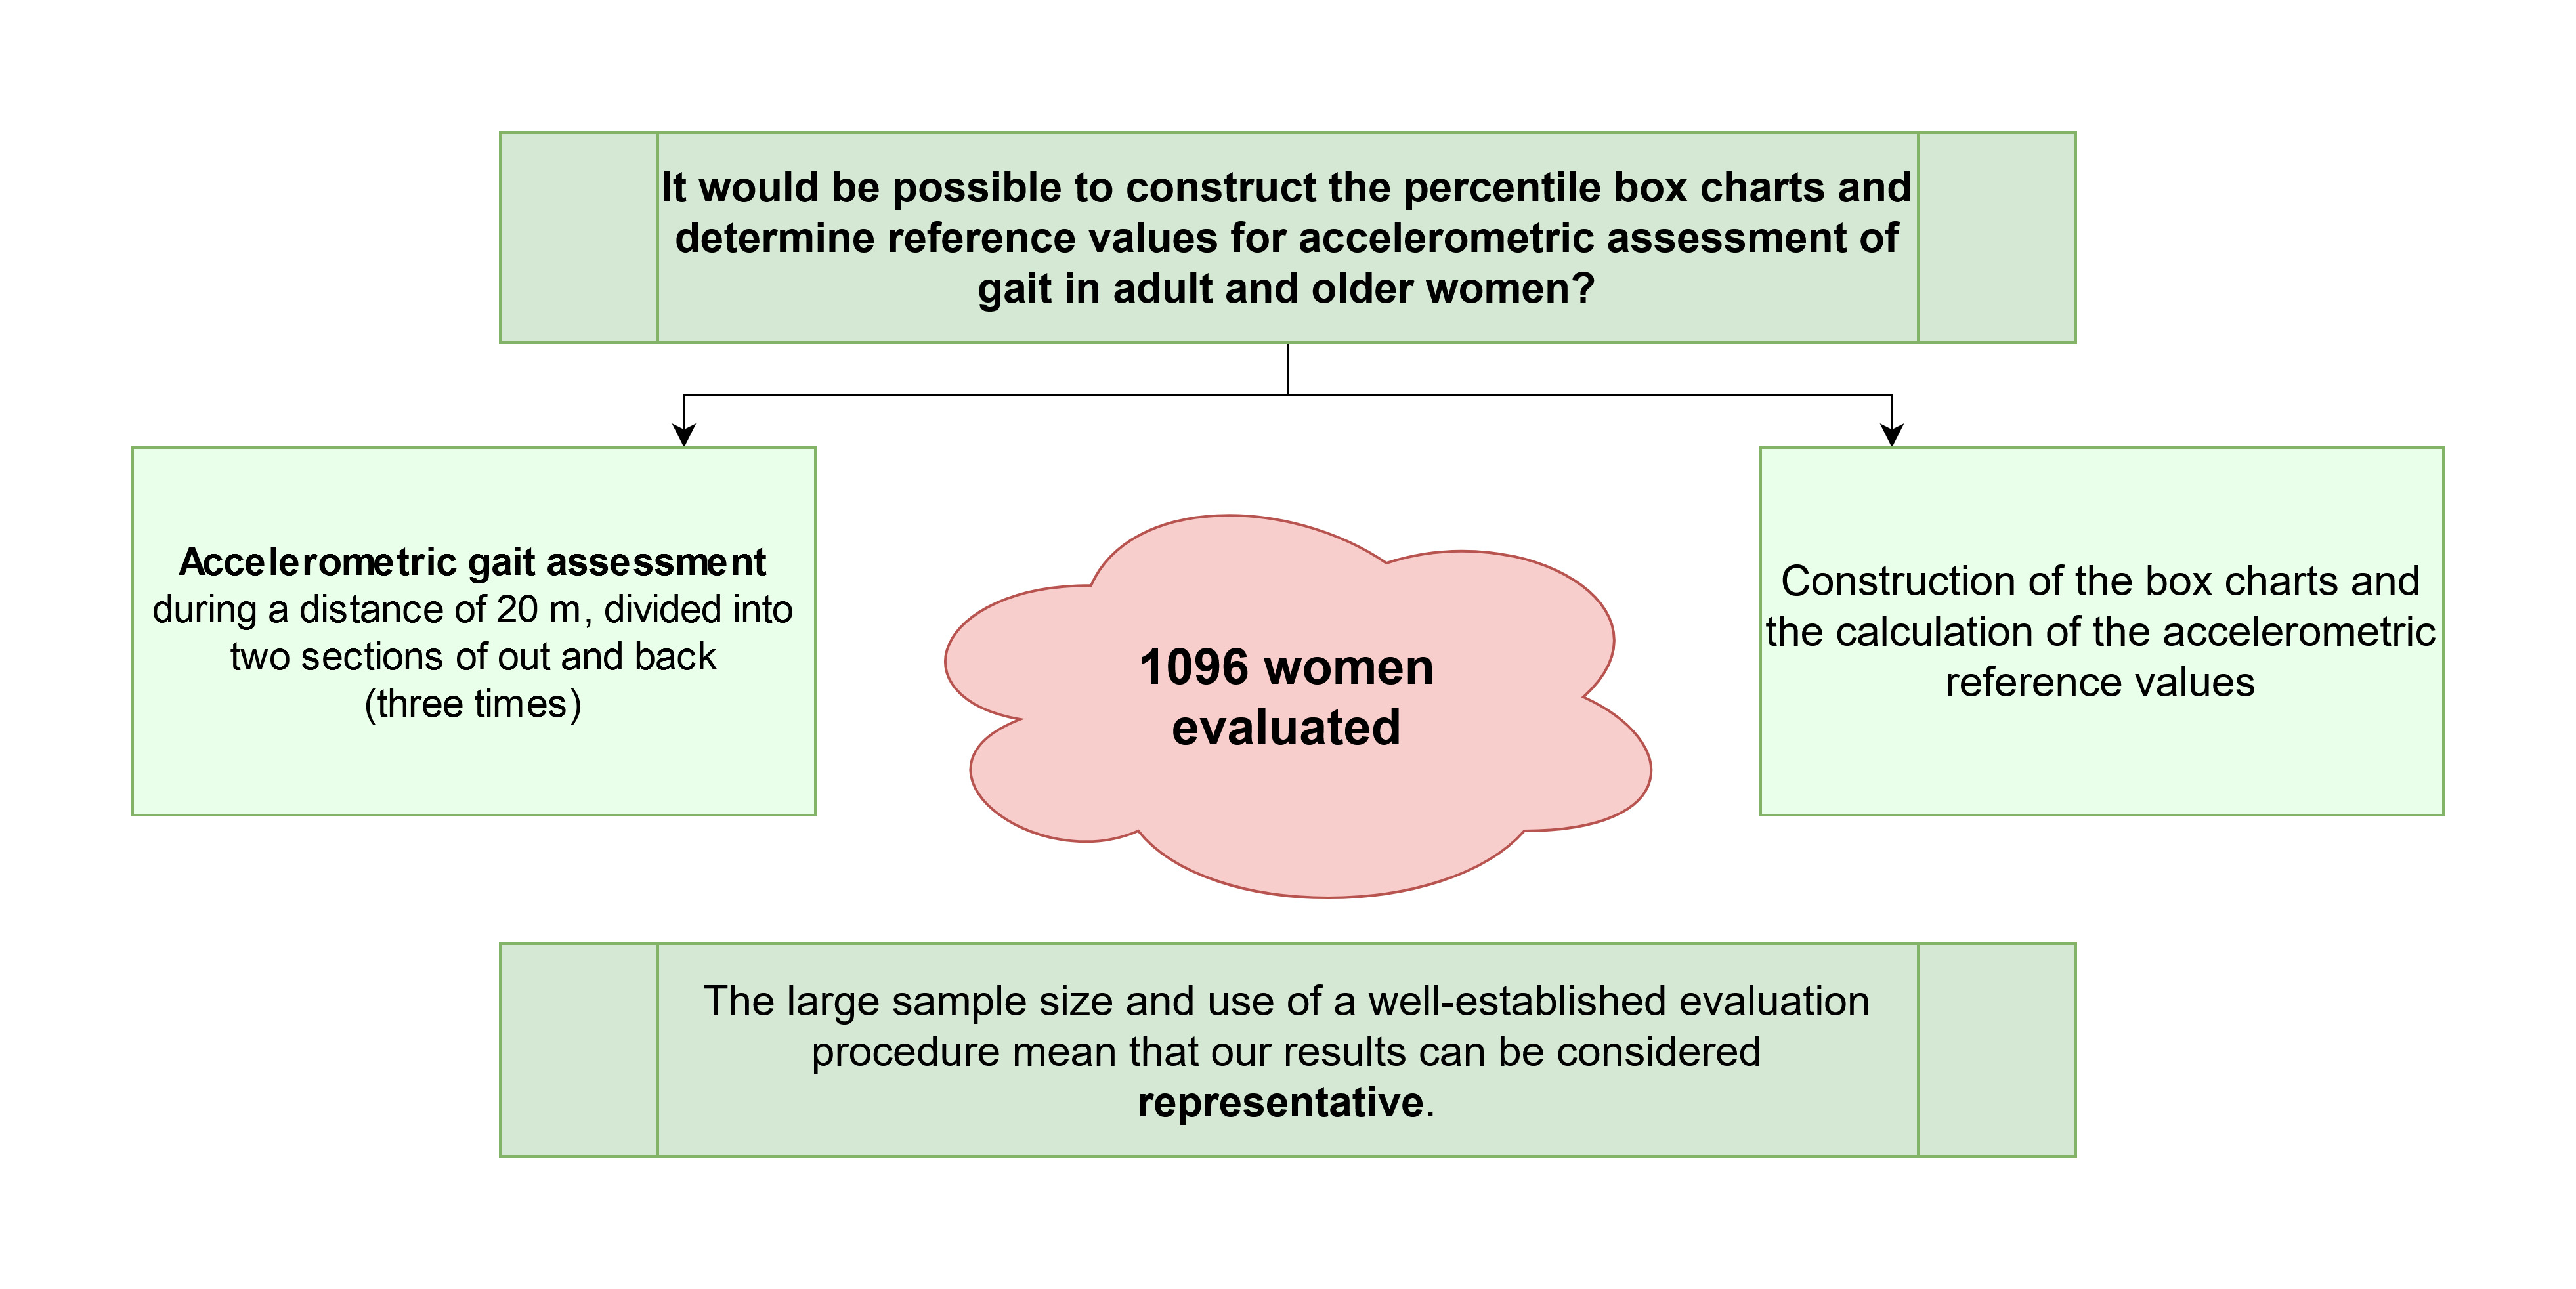
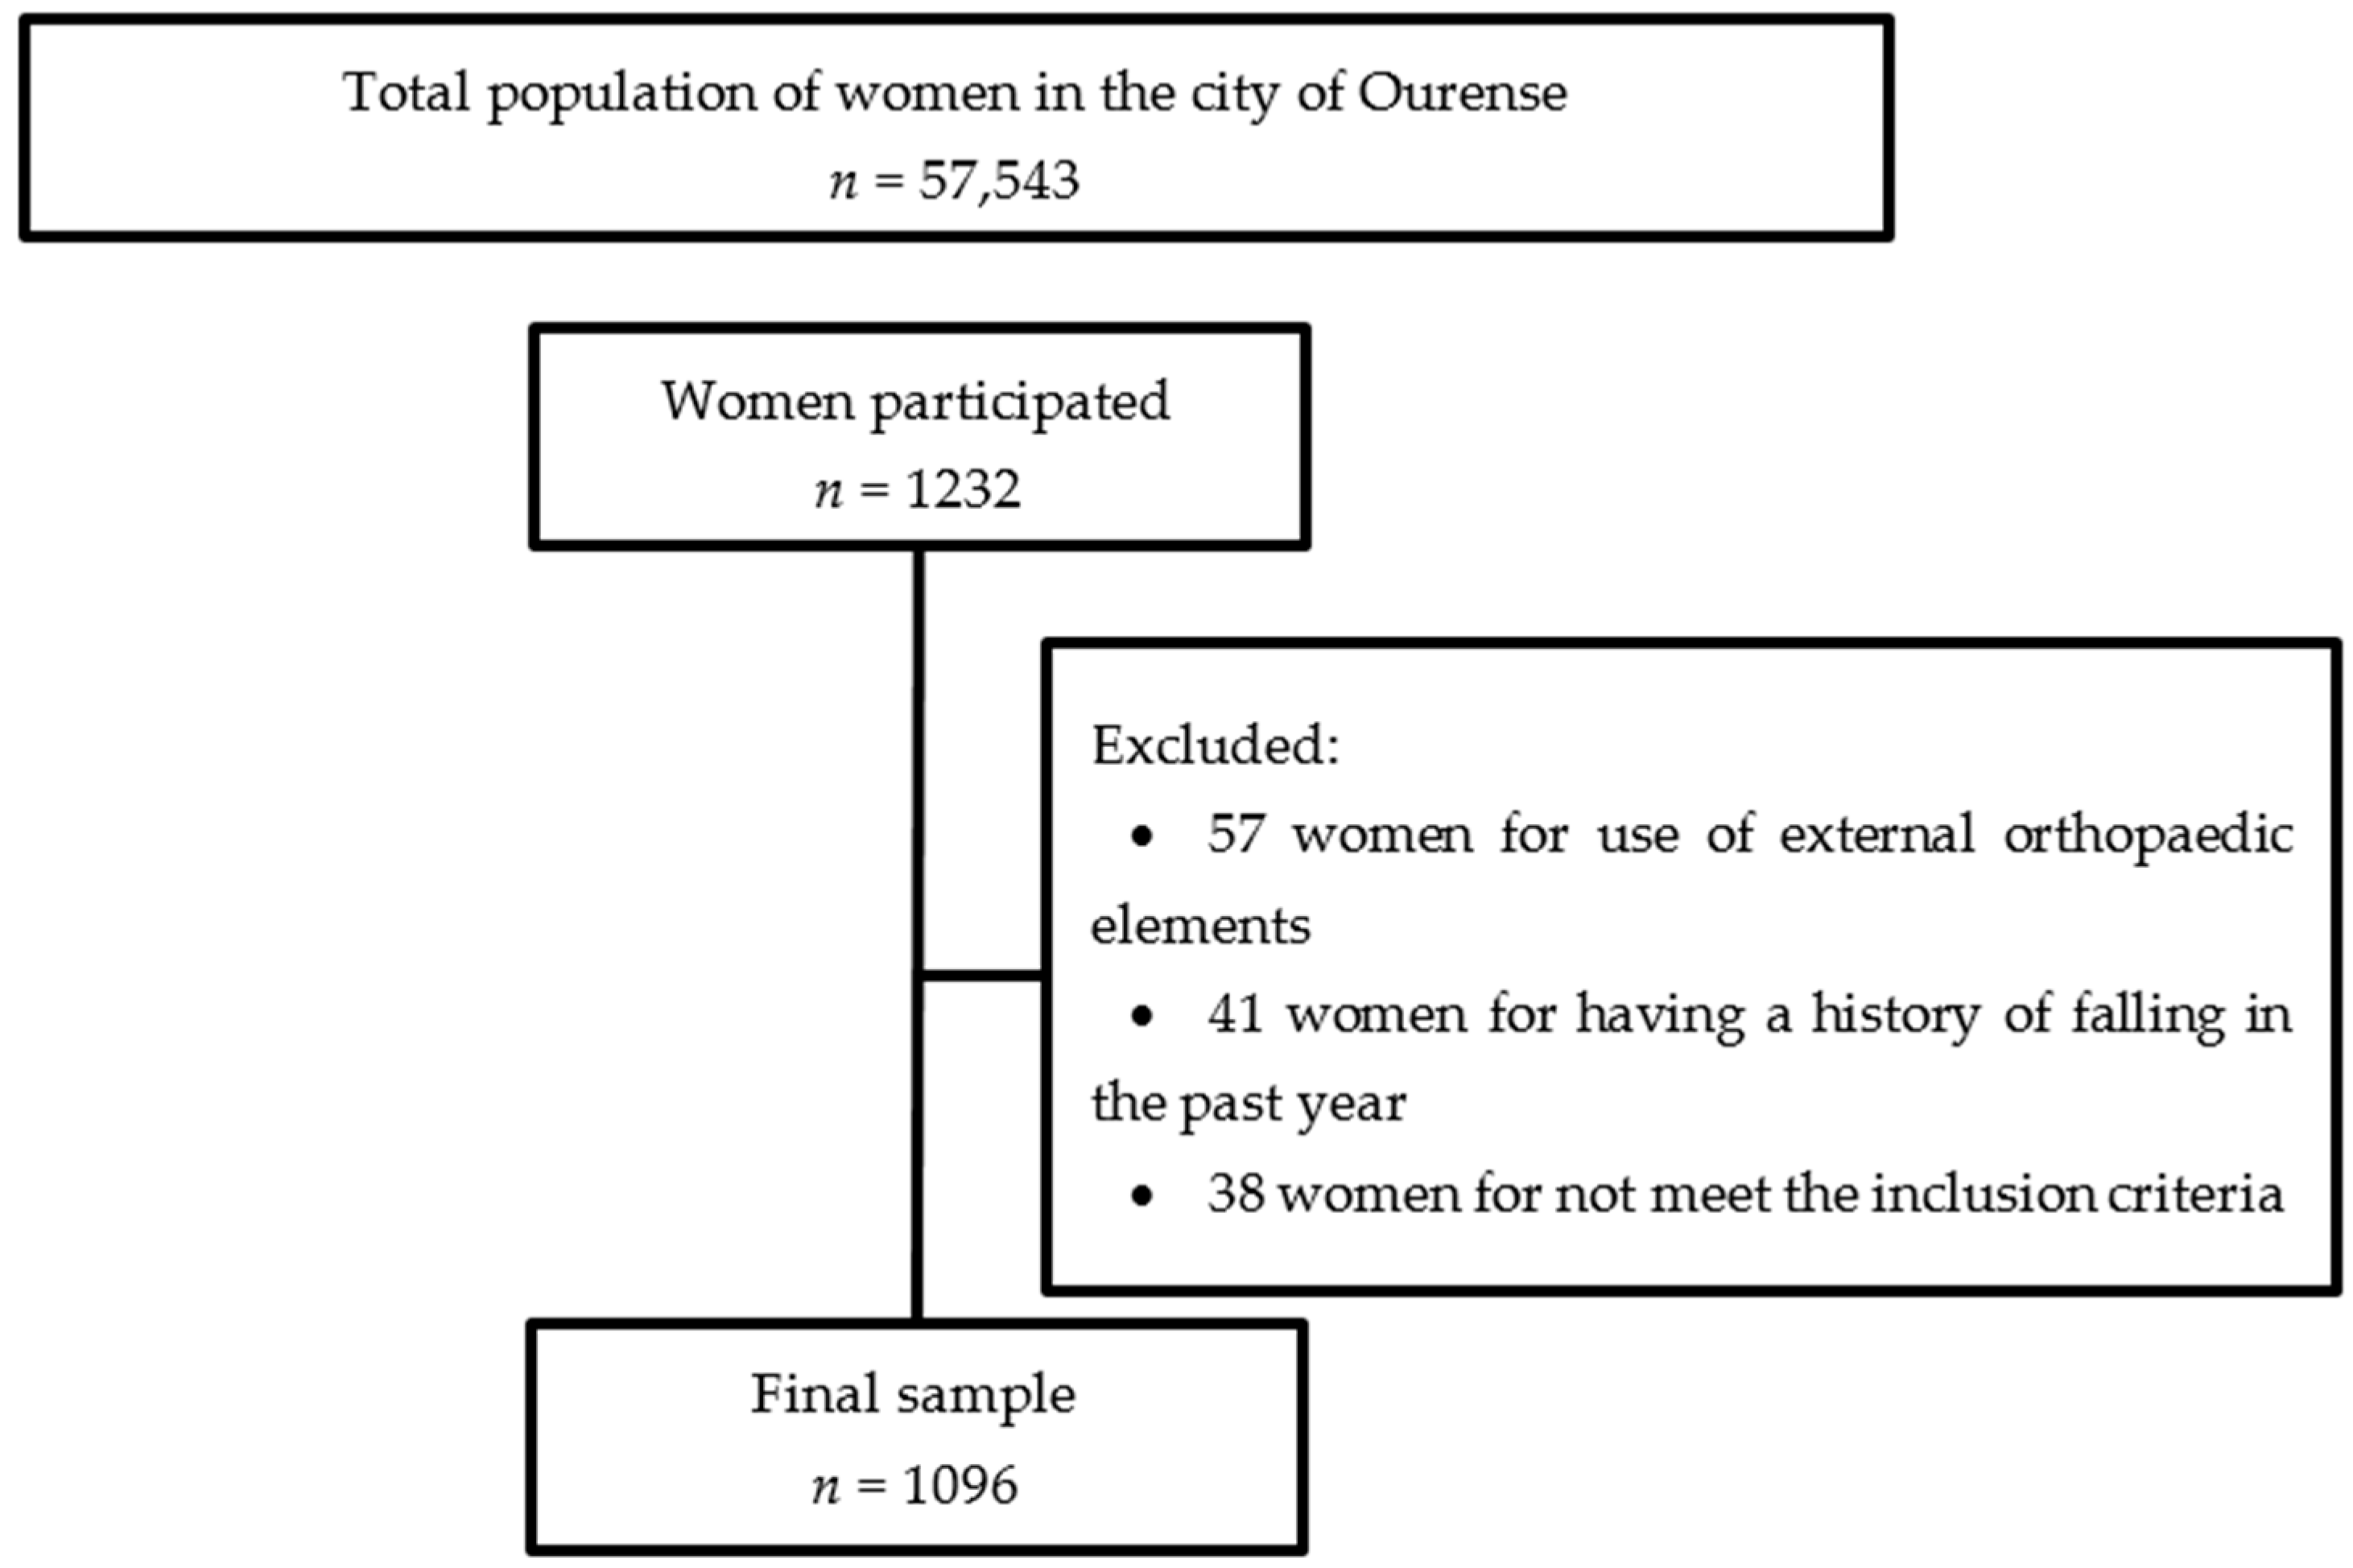
2.1. Sample
2.2. Procedure
2.3. Statistical Analysis
3. Results
4. Discussion
5. Conclusions
Author Contributions
Funding
Conflicts of Interest
References
- Bischoff-Ferrari, H.; Orav, J.; Kanis, J.; Rizzoli, R.; Schlögl, M.; Staehelin, H.; Willet, W.C.; Dawson-Hughes, B. Comparative performance of current definitions of sarcopenia against the prospective incidence of falls among community-dwelling seniors age 65 and older. Osteoporosis Int. 2015, 26, 2793–2802. [Google Scholar] [CrossRef] [PubMed]
- Finlayson, M.L.; Peterson, E.W. Falls, aging, and disability. Phys. Med. Rehabil. Clin. N. Am. 2010, 21, 357–373. [Google Scholar] [CrossRef] [PubMed]
- Maki, B.E.; Sibley, K.M.; Jaglal, S.B.; Bayley, M.; Brooks, D.; Fernie, G.R.; Flint, A.J.; Gage, W.; Liu, B.A.; McIlroy, W.E.; et al. Reducing fall risk by improving balance control: Development, evaluation and knowledge-translation of new approaches. J. Saf. Res. 2011, 42, 473–485. [Google Scholar] [CrossRef] [PubMed]
- Clegg, A.; Young, J.; Iliffe, S.; Rikkert, M.O.; Rockwood, K. Frailty in elderly people. Lancet 2013, 381, 752–762. [Google Scholar] [CrossRef] [Green Version]
- Donath, L.; Faude, O.; Lichtenstein, E.; Nüesch, C.; Mündermann, A. Validity and reliability of a portable gait analysis system for measuring spatiotemporal gait characteristics: Comparison to an instrumented treadmill. J. Neuroeng. Rehabil. 2016, 13, 6. [Google Scholar] [CrossRef] [PubMed] [Green Version]
- McGinley, J.L.; Baker, R.; Wolfe, R.; Morris, M.E. The reliability of three-dimensional kinematic gait measurements: A systematic review. Gait Posture 2009, 29, 360–369. [Google Scholar] [CrossRef]
- Holliday, W.; Fisher, J.; Theo, R.; Swart, J. Static versus dynamic kinematics in cyclists: A comparison of goniometer, inclinometer and 3D motion capture. Eur. J. Sport Sci. 2017, 17, 1129–1142. [Google Scholar] [CrossRef]
- Bruijn, S.M.; Meijer, O.G.; Beek, P.J.; van Dieen, J.H. Assessing the stability of human locomotion: A review of current measures. J. R. Soc. Interface 2013, 10, 20120999. [Google Scholar] [CrossRef]
- Muro, A.; García-Zapiraín, B.; Méndez-Zorrilla, A. Gait analysis methods: An overview of wearable and non-wearable systems, highlighting clinical applications. Sensors 2014, 14, 3362–3394. [Google Scholar] [CrossRef] [PubMed] [Green Version]
- Chen, S.; Lach, J.; Lo, B.; Yang, G. Toward pervasive gait analysis with wearable sensors: A systematic review. IEEE J. Biomed. Health Inform. 2016, 20, 1521–1537. [Google Scholar] [CrossRef]
- Mapelli, A.; Zago, M.; Fusini, L.; Galante, D.; Colombo, A.; Sforza, C. Validation of a protocol for the estimation of three-dimensional body center of mass kinematics in sport. Gait Posture 2014, 39, 460–465. [Google Scholar] [CrossRef]
- Hodges, P.; Gurfinkel, V.; Brumagne, S.; Smith, T.; Cordo, P. Coexistence of stability and mobility in postural control: Evidence from postural compensation for respiration. Exp. Brain Res. 2002, 144, 293–302. [Google Scholar] [CrossRef]
- Chen, T.; Chou, L. Altered center of mass control during sit-to-walk in elderly adults with and without history of falling. Gait Posture 2013, 38, 696–701. [Google Scholar] [CrossRef] [PubMed]
- Kressig, R.W.; Beauchet, O. Guidelines for clinical applications of spatio-temporal gait analysis in older adults. Aging Clin. Exp. Res. 2006, 18, 174–176. [Google Scholar] [CrossRef]
- Winter, D.A. Human balance and posture control during standing and walking. Gait Posture 1995, 3, 193–214. [Google Scholar] [CrossRef]
- Horak, F.B. Postural orientation and equilibrium: What do we need to know about neural control of balance to prevent falls? Age Ageing 2006, 35, ii7–ii11. [Google Scholar] [CrossRef] [Green Version]
- Leirós-Rodríguez, R.; García-Soidán, J.L.; Romo-Pérez, V. Analyzing the use of accelerometers as a method of early diagnosis of alterations in balance in elderly people: A systematic review. Sensors 2019, 19, 3883. [Google Scholar] [CrossRef] [Green Version]
- Leirós-Rodríguez, R.; Romo-Pérez, V.; García-Soidán, J.L.; García-Liñeira, J. Percentiles and reference values for the Accelerometric assessment of static balance in women aged 50–80 years. Sensors 2020, 20, 940. [Google Scholar] [CrossRef] [Green Version]
- Bouten, C.V.; Koekkoek, K.T.; Verduin, M.; Kodde, R.; Janssen, J.D. A triaxial accelerometer and portable data processing unit for the assessment of daily physical activity. IEEE Trans. Biomed. Eng. 1997, 44, 136–147. [Google Scholar] [CrossRef] [Green Version]
- Preece, S.J.; Goulermas, J.Y.; Kenney, L.P.; Howard, D. A comparison of feature extraction methods for the classification of dynamic activities from accelerometer data. IEEE Trans. Biomed. Eng. 2009, 56, 871–879. [Google Scholar] [CrossRef] [PubMed]
- Hartmann, A.; Luzi, S.; Murer, K.; de Bie, R.A.; de Bruin, E.D. Concurrent validity of a trunk tri-axial accelerometer system for gait analysis in older adults. Gait Posture 2009, 29, 444–448. [Google Scholar] [CrossRef]
- Buuren, S.; Fredriks, M. Worm plot: A simple diagnostic device for modelling growth reference curves. Stat. Med. 2001, 20, 1259–1277. [Google Scholar] [CrossRef]
- Rigby, R.A.; Stasinopoulos, D.M. The GAMLSS project: A flexible approach to statistical modelling. In New Trends in Statistical Modelling, Proceedings of the 16th International Workshop on Statistical Modelling; Statistical Modelling Society: Odense, Denmark, 2001; pp. 337–345. [Google Scholar]
- Rispens, S.M.; van Schooten, K.S.; Pijnappels, M.; Daffertshofer, A.; Beek, P.J.; van Dieen, J.H. Do extreme values of daily-life gait characteristics provide more information about fall risk than median values? JMIR Res. Protoc. 2015, 4, e4. [Google Scholar] [CrossRef]
- Moe-Nilssen, R.; Helbostad, J.L. Trunk accelerometry as a measure of balance control during quiet standing. Gait Posture 2002, 16, 60–68. [Google Scholar] [CrossRef]
- Thiede, R.; Toosizadeh, N.; Mills, J.L.; Zaky, M.; Mohler, J.; Najafi, B. Gait and balance assessments as early indicators of frailty in patients with known peripheral artery disease. Clin. Biomech. 2015, 32, 1–7. [Google Scholar] [CrossRef] [Green Version]
- Bautmans, I.; Jansen, B.; van Keymolen, B.; Mets, T. Reliability and clinical correlates of 3D-accelerometry based gait analysis outcomes according to age and fall-risk. Gait Posture 2011, 33, 366–372. [Google Scholar] [CrossRef]
- Tadano, S.; Takeda, R.; Sasaki, K.; Fujisawa, T.; Tohyama, H. Gait characterization for osteoarthritis patients using wearable gait sensors (H-Gait systems). J. Biomech. 2016, 49, 684–690. [Google Scholar] [CrossRef]
- Studenski, S.; Perera, S.; Patel, K.; Rosano, C.; Faulkner, K.; Inzitari, M.; Brach, J.; Chandler, J.; Cawthon, P.; Barrett, E.; et al. Gait speed and survival in older adults. JAMA 2011, 305, 50–58. [Google Scholar] [CrossRef] [Green Version]
- Butterworth, P.A.; Landorf, K.; Gilleard, W.; Urquhart, D.; Menz, H. The association between body composition and foot structure and function: A systematic review. Obes. Rev. 2014, 15, 348–357. [Google Scholar] [CrossRef]
- Senden, R.; Savelberg, H.; Grimm, B.; Heyligers, I.; Meijer, K. Accelerometry-based gait analysis, an additional objective approach to screen subjects at risk for falling. Gait Posture 2012, 36, 296–300. [Google Scholar] [CrossRef] [PubMed]
- Senden, R.; Grimm, B.; Heyligers, I.; Savelberg, H.; Meijer, K. Acceleration-based gait test for healthy subjects: Reliability and reference data. Gait Posture 2009, 30, 192–196. [Google Scholar] [CrossRef]
- Rispens, S.M.; van Schooten, K.S.; Pijnappels, M.; Daffertshofer, A.; Beek, P.J.; van Dieen, J.H. Identification of fall risk predictors in daily life measurements: Gait characteristics’ reliability and association with self-reported fall history. Neurorehabil. Neural. Repair 2015, 29, 54–61. [Google Scholar] [CrossRef]
- Kavanagh, J.J. Lower trunk motion and speed-dependence during walking. J. Neuroeng. Rehabil. 2009, 6. [Google Scholar] [CrossRef] [PubMed] [Green Version]
- Camicioli, R.; Howieson, D.; Lehman, S.; Kaye, J. Talking while walking: The effect of a dual task in aging and Alzheimer’s disease. Neurology 1997, 48, 955–958. [Google Scholar] [CrossRef] [PubMed]
- Grimbergen, Y.A.; Schrag, A.; Mazibrada, G.; Borm, G.F.; Bloem, B.R. Impact of falls and fear of falling on health-related quality of life in patients with Parkinson’s disease. J. Parkinsons Dis. 2013, 3, 409–413. [Google Scholar] [CrossRef] [PubMed]


| Age Group | N | Age (Years) | Weight (kg) | Height (cm) | Body Mass Index (kg/m2) |
|---|---|---|---|---|---|
| All | 1096 | 68.8 ± 10.4 | 65.6 ±10.1 | 153.9 ± 5.4 | 27.6 ± 4.1 |
| G1 (51–55 years) | 187 | 53.4 ± 4.4 | 63 ± 7.6 | 155.6 ± 5 | 26 ± 3.3 |
| G2 (56–60 years) | 172 | 57.4 ± 4.3 | 64 ± 6.5 | 154.6 ± 6 | 26.8 ± 5.3 |
| G3 (61–65 years) | 185 | 64.2 ± 2.7 | 66.4 ± 11.1 | 154 ± 5.5 | 28 ± 4.7 |
| G4 (66–70 years) | 192 | 68.4 ± 3.8 | 63.8 ± 9.6 | 152.9 ± 6.1 | 29 ± 6.3 |
| G5 (71–75 years) | 187 | 74.2 ± 4.6 | 66.5 ± 10.1 | 151.8 ± 5.2 | 28.3 ± 3.2 |
| G6 (76–80 years) | 173 | 77.6 ± 2.2 | 68.1 ± 11.7 | 151.3 ± 4.2 | 29.2 ± 1.8 |
| Variable | G1 (n = 187) | G2 (n = 172) | G3 (n = 185) | G4 (n = 192) | G5 (n = 187) | G6 (n = 173) |
|---|---|---|---|---|---|---|
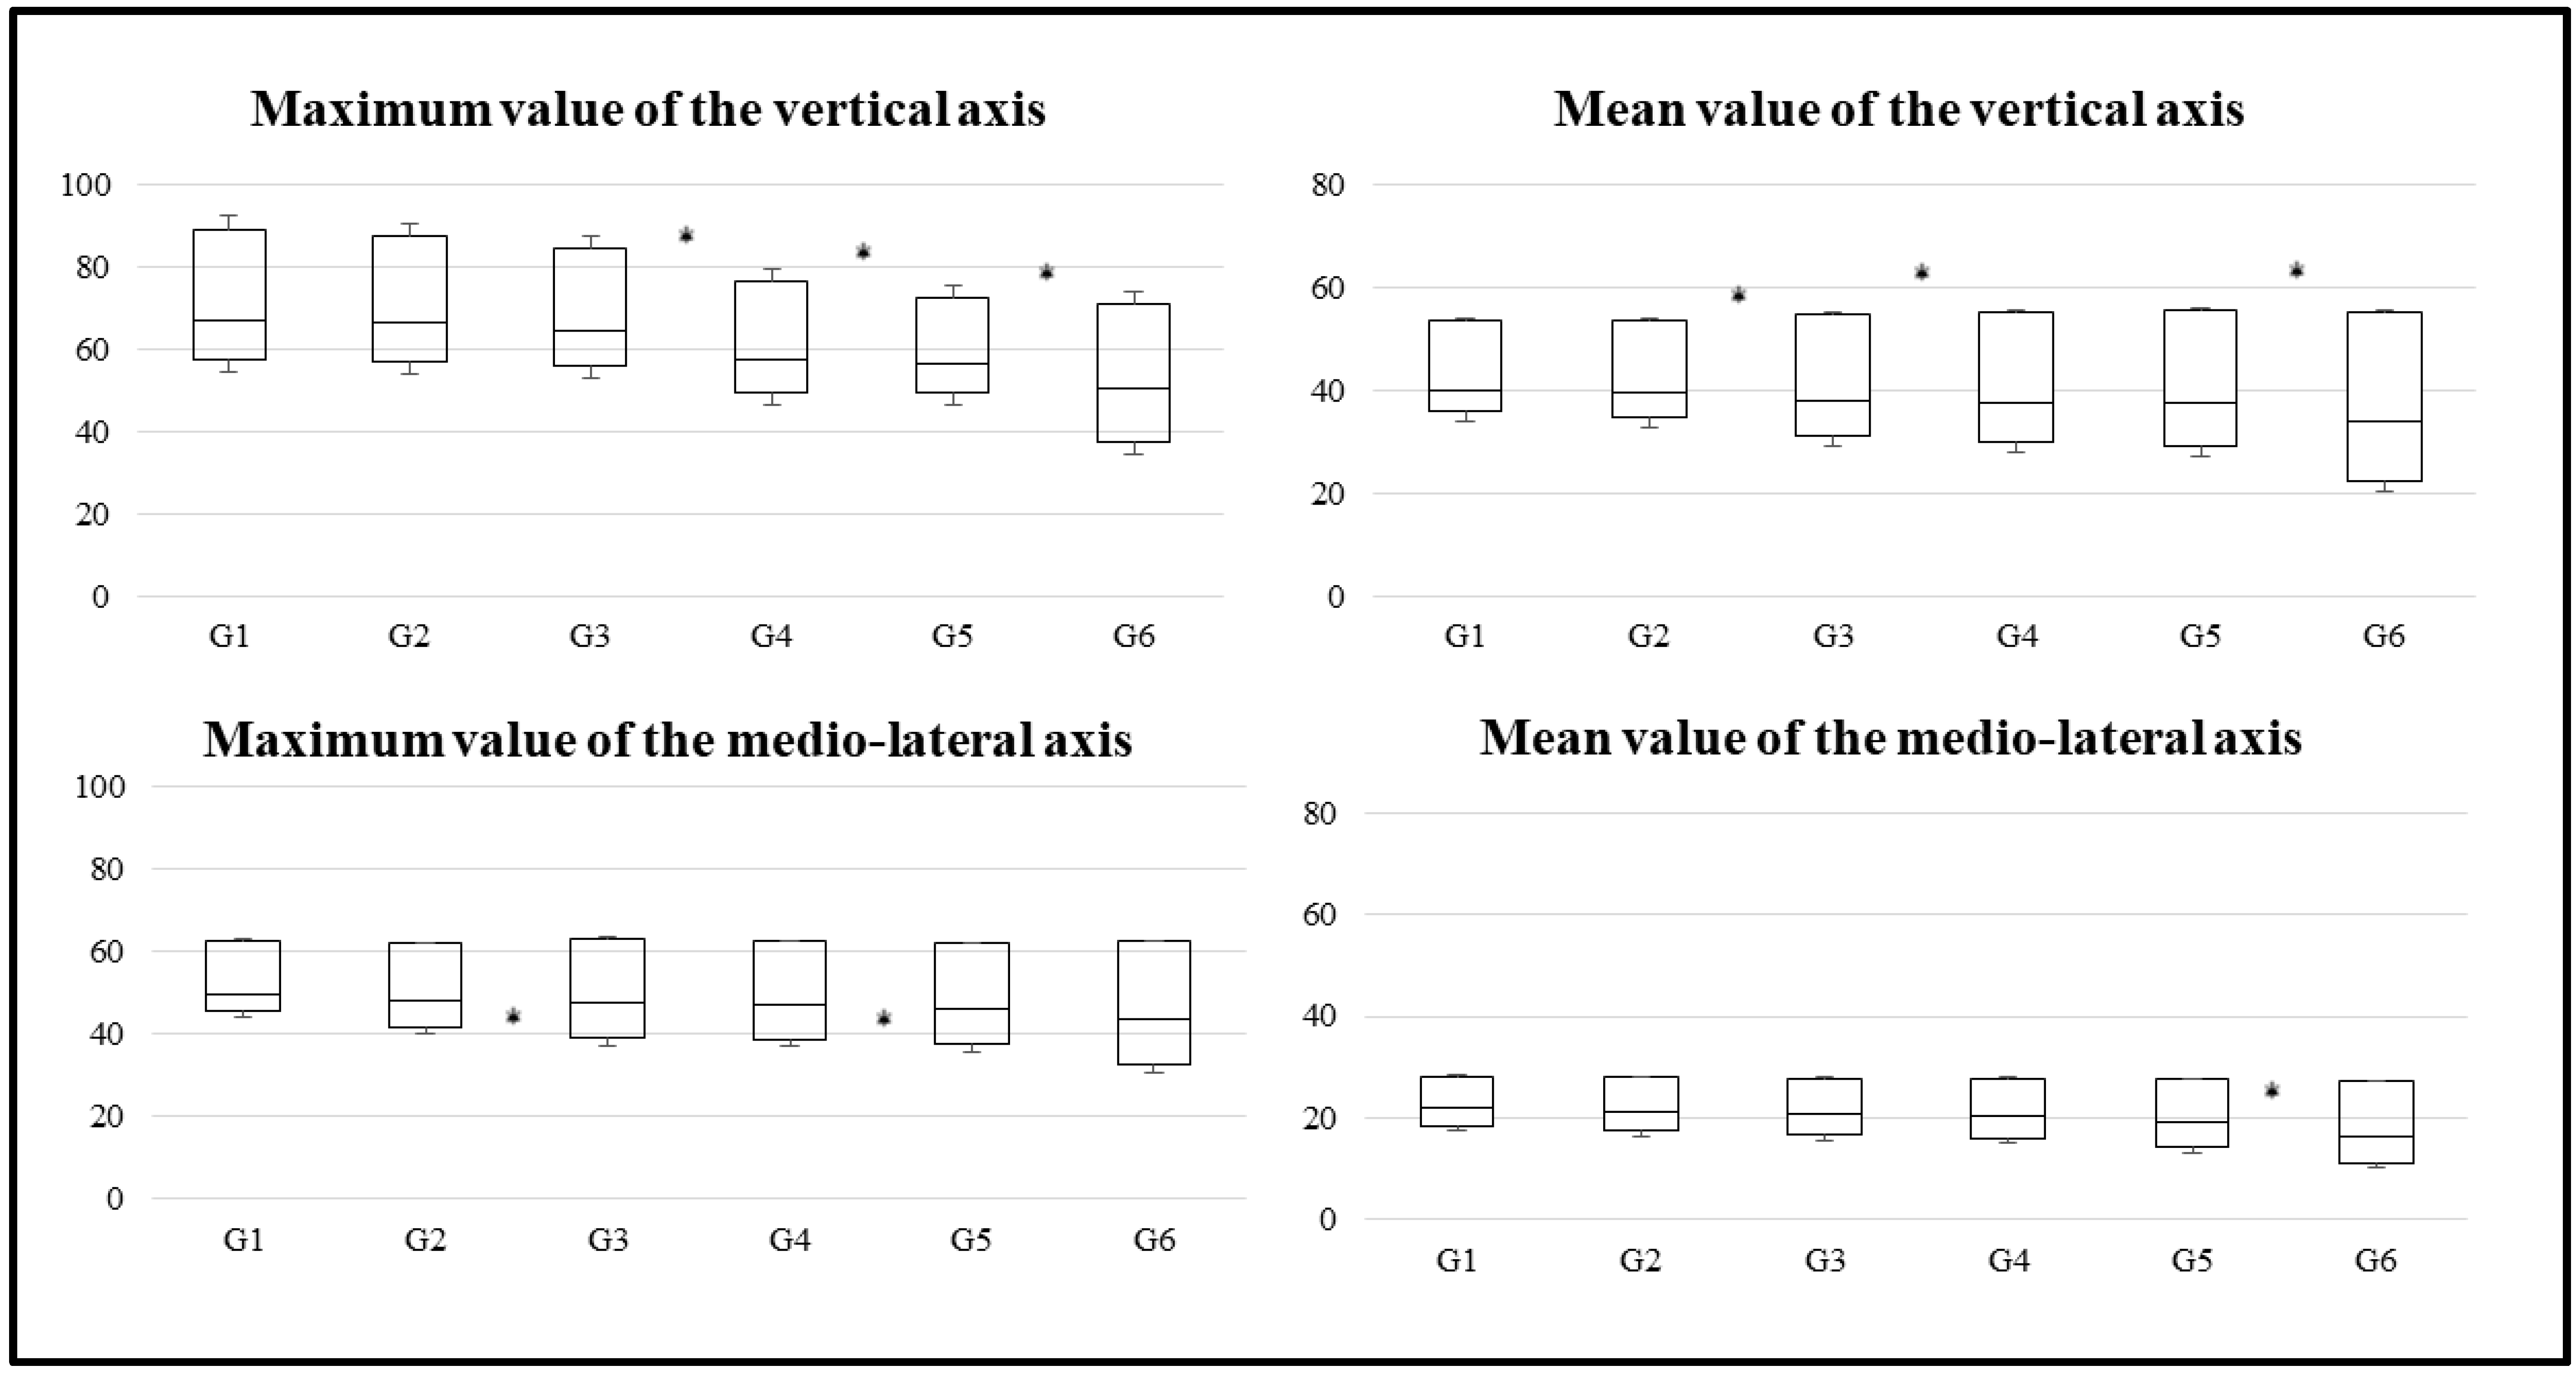
| Maximum value of vertical axis | ||||||
| Mean ± standard deviation | 67.7 ± 17.4 | 67.1 ± 19.8 | 63.7 ± 16.3 | 56.8 ± 13 | 57.3 ± 11.4 | 51.3 ± 14.1 |
| Kurtosis | 3.9 | 3 | 2.9 | 3.6 | 3.4 | 1.7 |
| Percentile 25 | 57.3 | 57 | 56 | 49.7 | 49.3 | 37.7 |
| Percentile 50 (median) | 67 | 66.3 | 64.3 | 57.3 | 56.3 | 50.7 |
| Percentile 75 | 79.3 | 78 | 76 | 68.7 | 65.3 | 57.7 |
| Interquartile range | 22 | 21 | 20 | 19 | 16 | 20 |
| Mean value of vertical axis | ||||||
| Mean ± standard deviation | 44.1 ± 13.7 | 41.9 ± 13.7 | 41.1 ± 12.6 | 35.9 ± 10 | 36 ± 9.6 | 32.7 ± 11.1 |
| Kurtosis | 3.7 | 2.5 | 3.1 | 3.2 | 3.2 | 1.5 |
| Percentile 25 | 36 | 34.9 | 31 | 29.9 | 29 | 22.6 |
| Percentile 50 (median) | 40 | 39.4 | 38 | 37.8 | 37.5 | 34 |
| Percentile 75 | 49.5 | 48.9 | 47.9 | 47.3 | 47.1 | 43.6 |
| Interquartile range | 13.5 | 14 | 16.9 | 17.5 | 18.1 | 21 |
| Maximum value of mediolateral axis | ||||||
| Mean ± standard deviation | 53.9 ± 16.6 | 52.7 ± 12.7 | 46.9 ± 11.3 | 48.9 ± 12.4 | 45.6 ± 12.1 | 41 ± 10 |
| Kurtosis | 2.8 | 4.6 | 3.8 | 3.3 | 4.5 | 2 |
| Percentile 25 | 45.7 | 41.7 | 39 | 38.7 | 37.3 | 32.3 |
| Percentile 50 (median) | 49.7 | 48 | 47.5 | 47.2 | 46 | 43.3 |
| Percentile 75 | 58.7 | 55.7 | 54.8 | 54.1 | 53.3 | 51.3 |
| Interquartile range | 13 | 14 | 15.8 | 15.4 | 16 | 19 |
| Mean value of mediolateral axis | ||||||
| Mean ± standard deviation | 22.8 ± 9 | 21.9 ± 6.3 | 20.7 ± 6 | 21 ± 6.9 | 19.5 ± 7 | 15.6 ± 4.2 |
| Kurtosis | 2 | 3.1 | 4.2 | 2.4 | 2.2 | 2.4 |
| Percentile 25 | 18.5 | 17.6 | 16.6 | 16.1 | 14.3 | 11.2 |
| Percentile 50 (median) | 22 | 21.3 | 20.8 | 20.5 | 19 | 16.4 |
| Percentile 75 | 24.6 | 24.3 | 23.4 | 23.4 | 22.8 | 21.9 |
| Interquartile range | 6.2 | 6.7 | 6.9 | 7.3 | 8.5 | 10.7 |
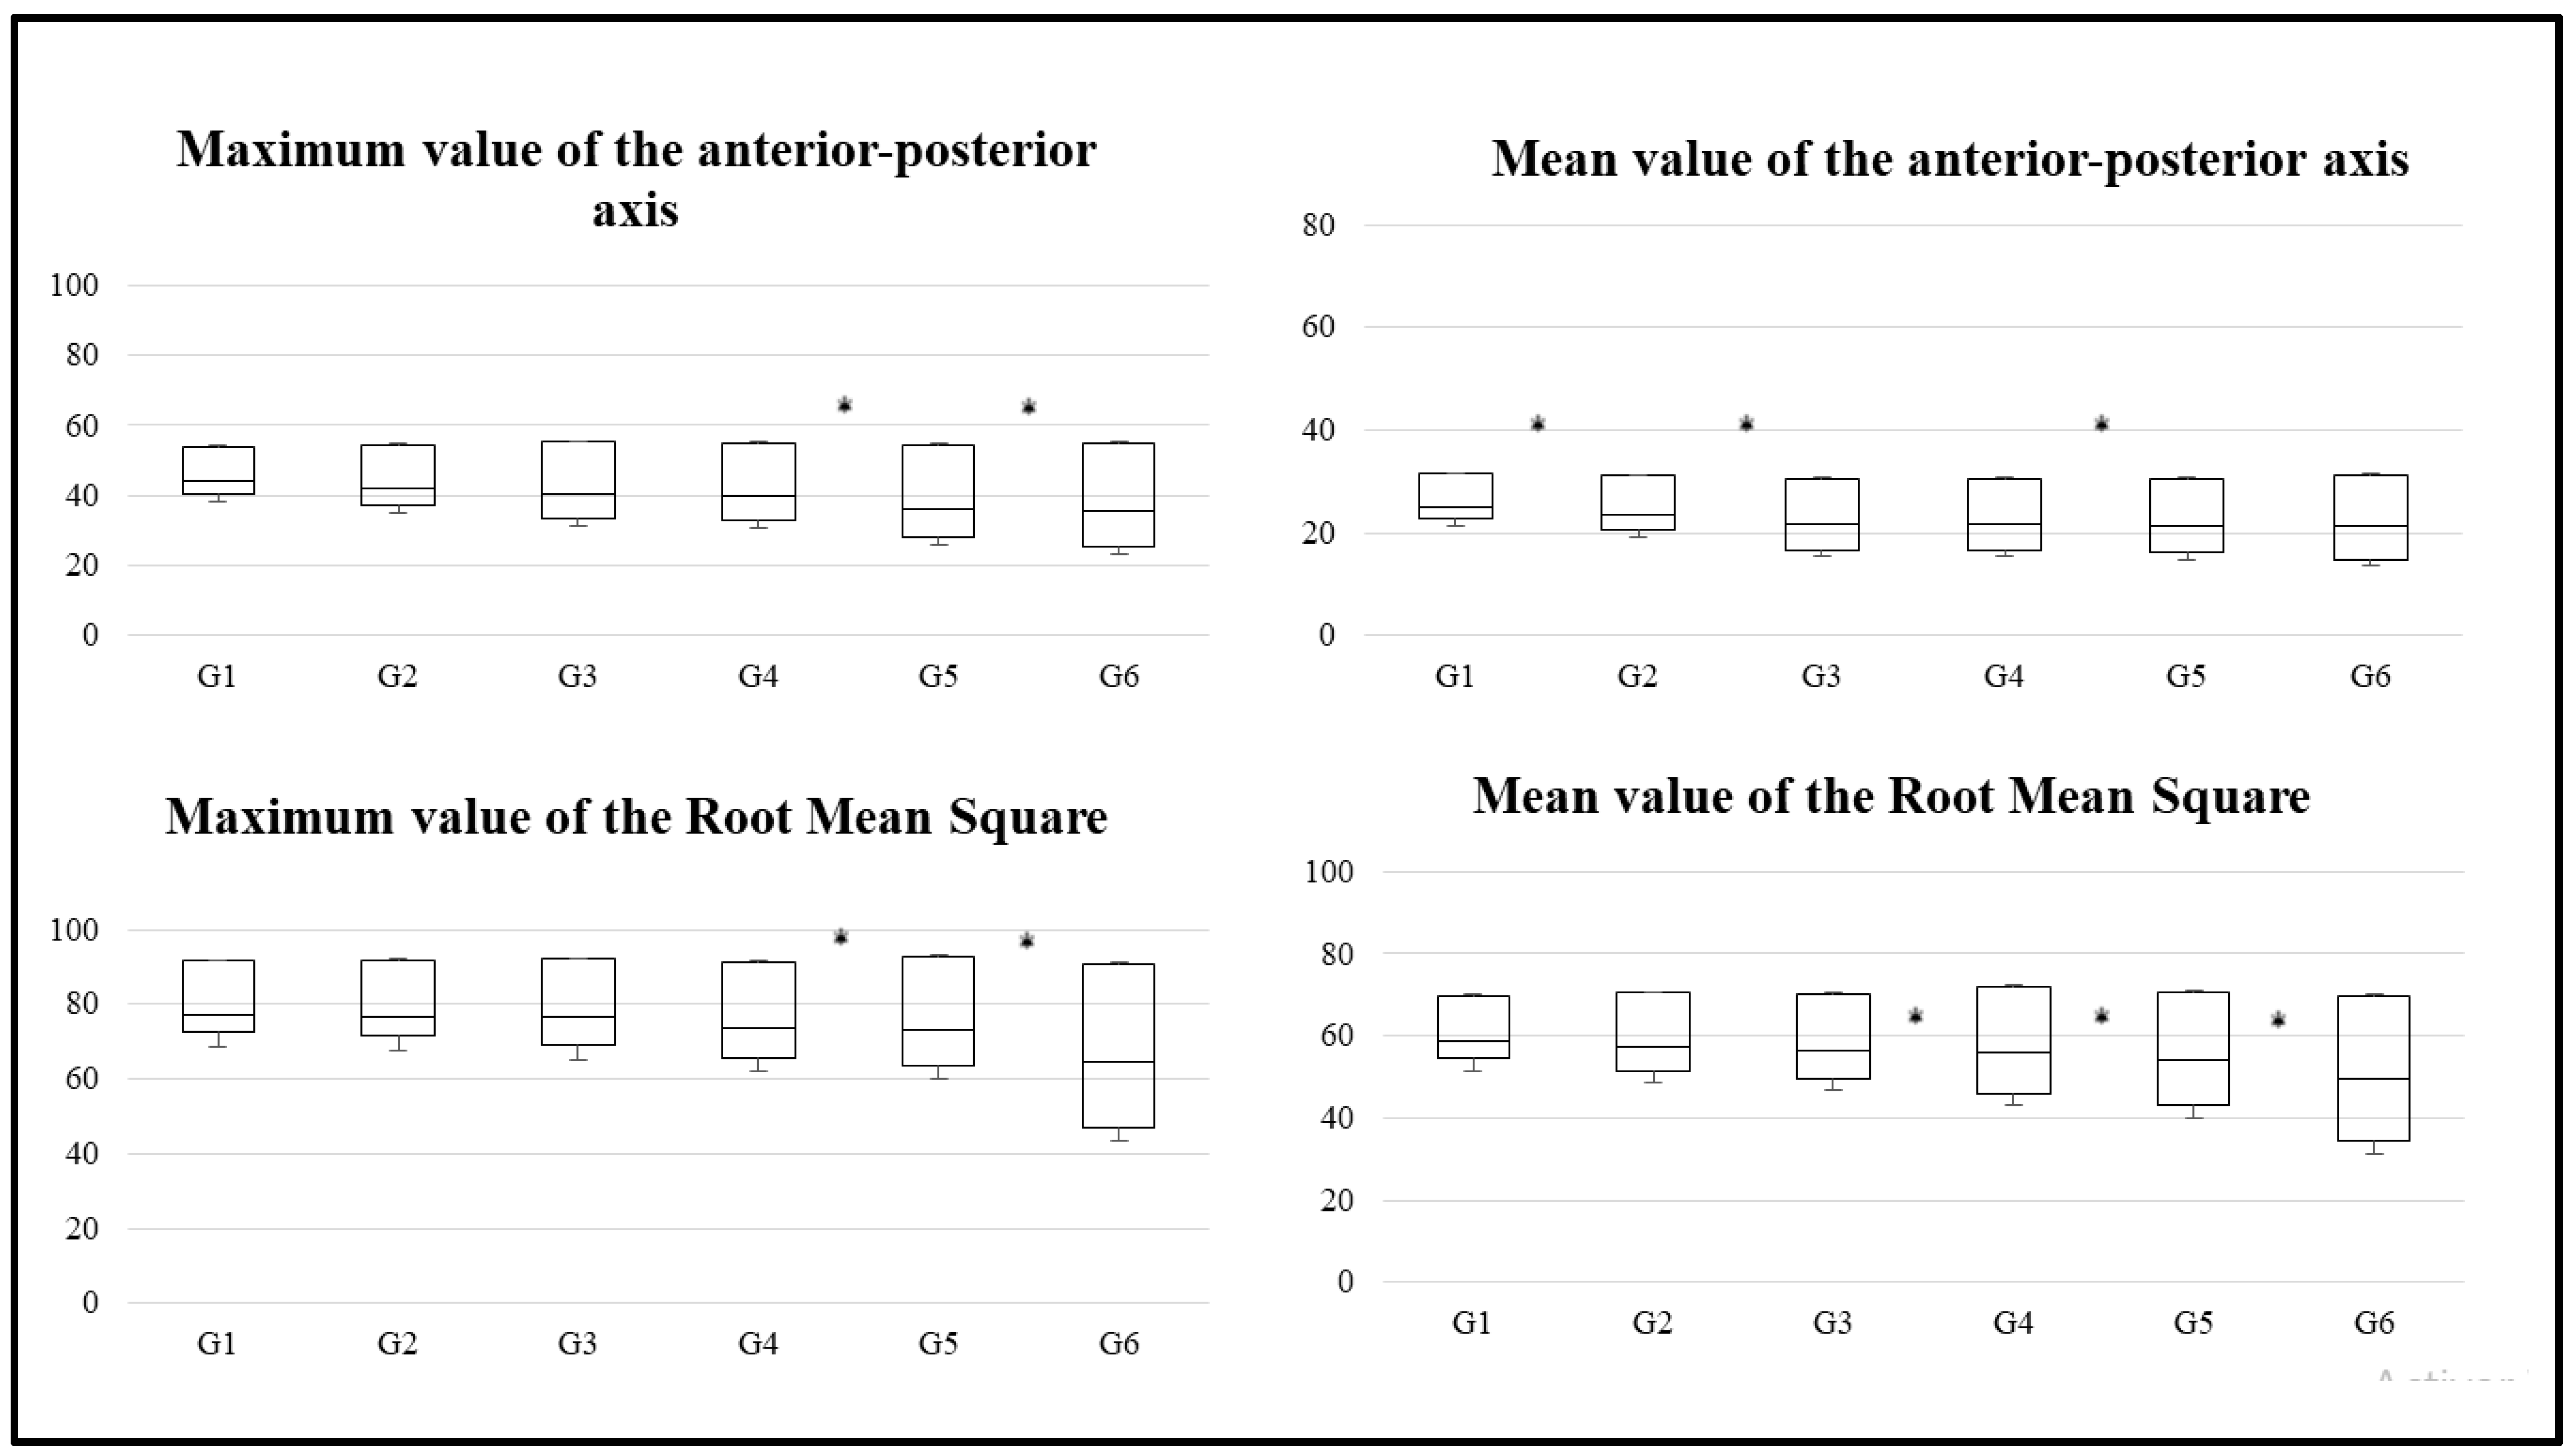
| Variable | G1 (n = 187) | G2 (n = 172) | G3 (n = 185) | G4 (n = 192) | G5 (n = 187) | G6 (n = 173) |
| Maximum value of anterior-posterior axis | ||||||
| Mean ± standard deviation | 48.6 ± 14 | 40.2 ± 10.9 | 42.8 ± 9.5 | 39.4 ± 12 | 40.9 ± 11 | 33.1 ± 8.6 |
| Kurtosis | 2.4 | 3.4 | 3.4 | 2.3 | 5.4 | 1.8 |
| Percentile 25 | 40.3 | 37.3 | 33.7 | 33 | 28 | 25.3 |
| Percentile 50 (median) | 44 | 42 | 40.4 | 40 | 36 | 35.7 |
| Percentile 75 | 50.3 | 49.9 | 48.6 | 48.1 | 46.5 | 44.8 |
| Interquartile range | 10 | 12.6 | 14.9 | 15.1 | 18.5 | 19.5 |
| Mean value of anterior-posterior axis | ||||||
| Mean ± standard deviation | 30.5 ± 9.8 | 23.5 ± 8 | 24.8 ± 7.8 | 22.6 ± 7.2 | 22.1 ± 6.9 | 19.3 ± 6 |
| Kurtosis | 1.8 | 3.5 | 3.5 | 1.8 | 1.4 | 2.3 |
| Percentile 25 | 22.6 | 20.5 | 16.7 | 16.6 | 16.1 | 14.9 |
| Percentile 50 (median) | 25.1 | 23.5 | 21.6 | 21.6 | 21.3 | 21.2 |
| Percentile 75 | 28.9 | 28.1 | 25.6 | 25.6 | 25.5 | 25.1 |
| Interquartile range | 6.3 | 7.6 | 9 | 9 | 9.4 | 10.2 |
| Maximum value of root mean square of accelerations | ||||||
| Mean ± standard deviation | 85.7 ± 18.2 | 81.3 ± 19.8 | 78.9 ± 13.5 | 72.4 ± 13.5 | 71.9 ± 9.9 | 61 ± 13.8 |
| Kurtosis | 2.4 | 3.8 | 3.4 | 2.2 | 2.6 | 1.4 |
| Percentile 25 | 72.7 | 71.7 | 69 | 65.8 | 63.7 | 47.1 |
| Percentile 50 (median) | 77.4 | 76.9 | 76.5 | 73.6 | 73.2 | 64.7 |
| Percentile 75 | 86.9 | 86.6 | 84.6 | 83.6 | 83.4 | 73.3 |
| Interquartile range | 14.3 | 15 | 15.6 | 17.8 | 19.6 | 26.2 |
| Mean value of root mean square of accelerations | ||||||
| Mean ± standard deviation | 62.6 ± 15 | 56.9 ± 14 | 56.5 ± 11.6 | 51.5 ± 10.1 | 50.7 ± 8.8 | 44.3 ± 11.1 |
| Kurtosis | 2.5 | 3.2 | 2.6 | 2.3 | 2.5 | 1.4 |
| Percentile 25 | 54.4 | 51.5 | 49.5 | 46 | 42.9 | 34.4 |
| Percentile 50 (median) | 58.5 | 57.4 | 56.6 | 56.2 | 54 | 49.5 |
| Percentile 75 | 65.7 | 64.5 | 63.1 | 61.7 | 59.7 | 54.5 |
| Interquartile range | 11.3 | 13 | 13.6 | 15.7 | 16.7 | 20.1 |
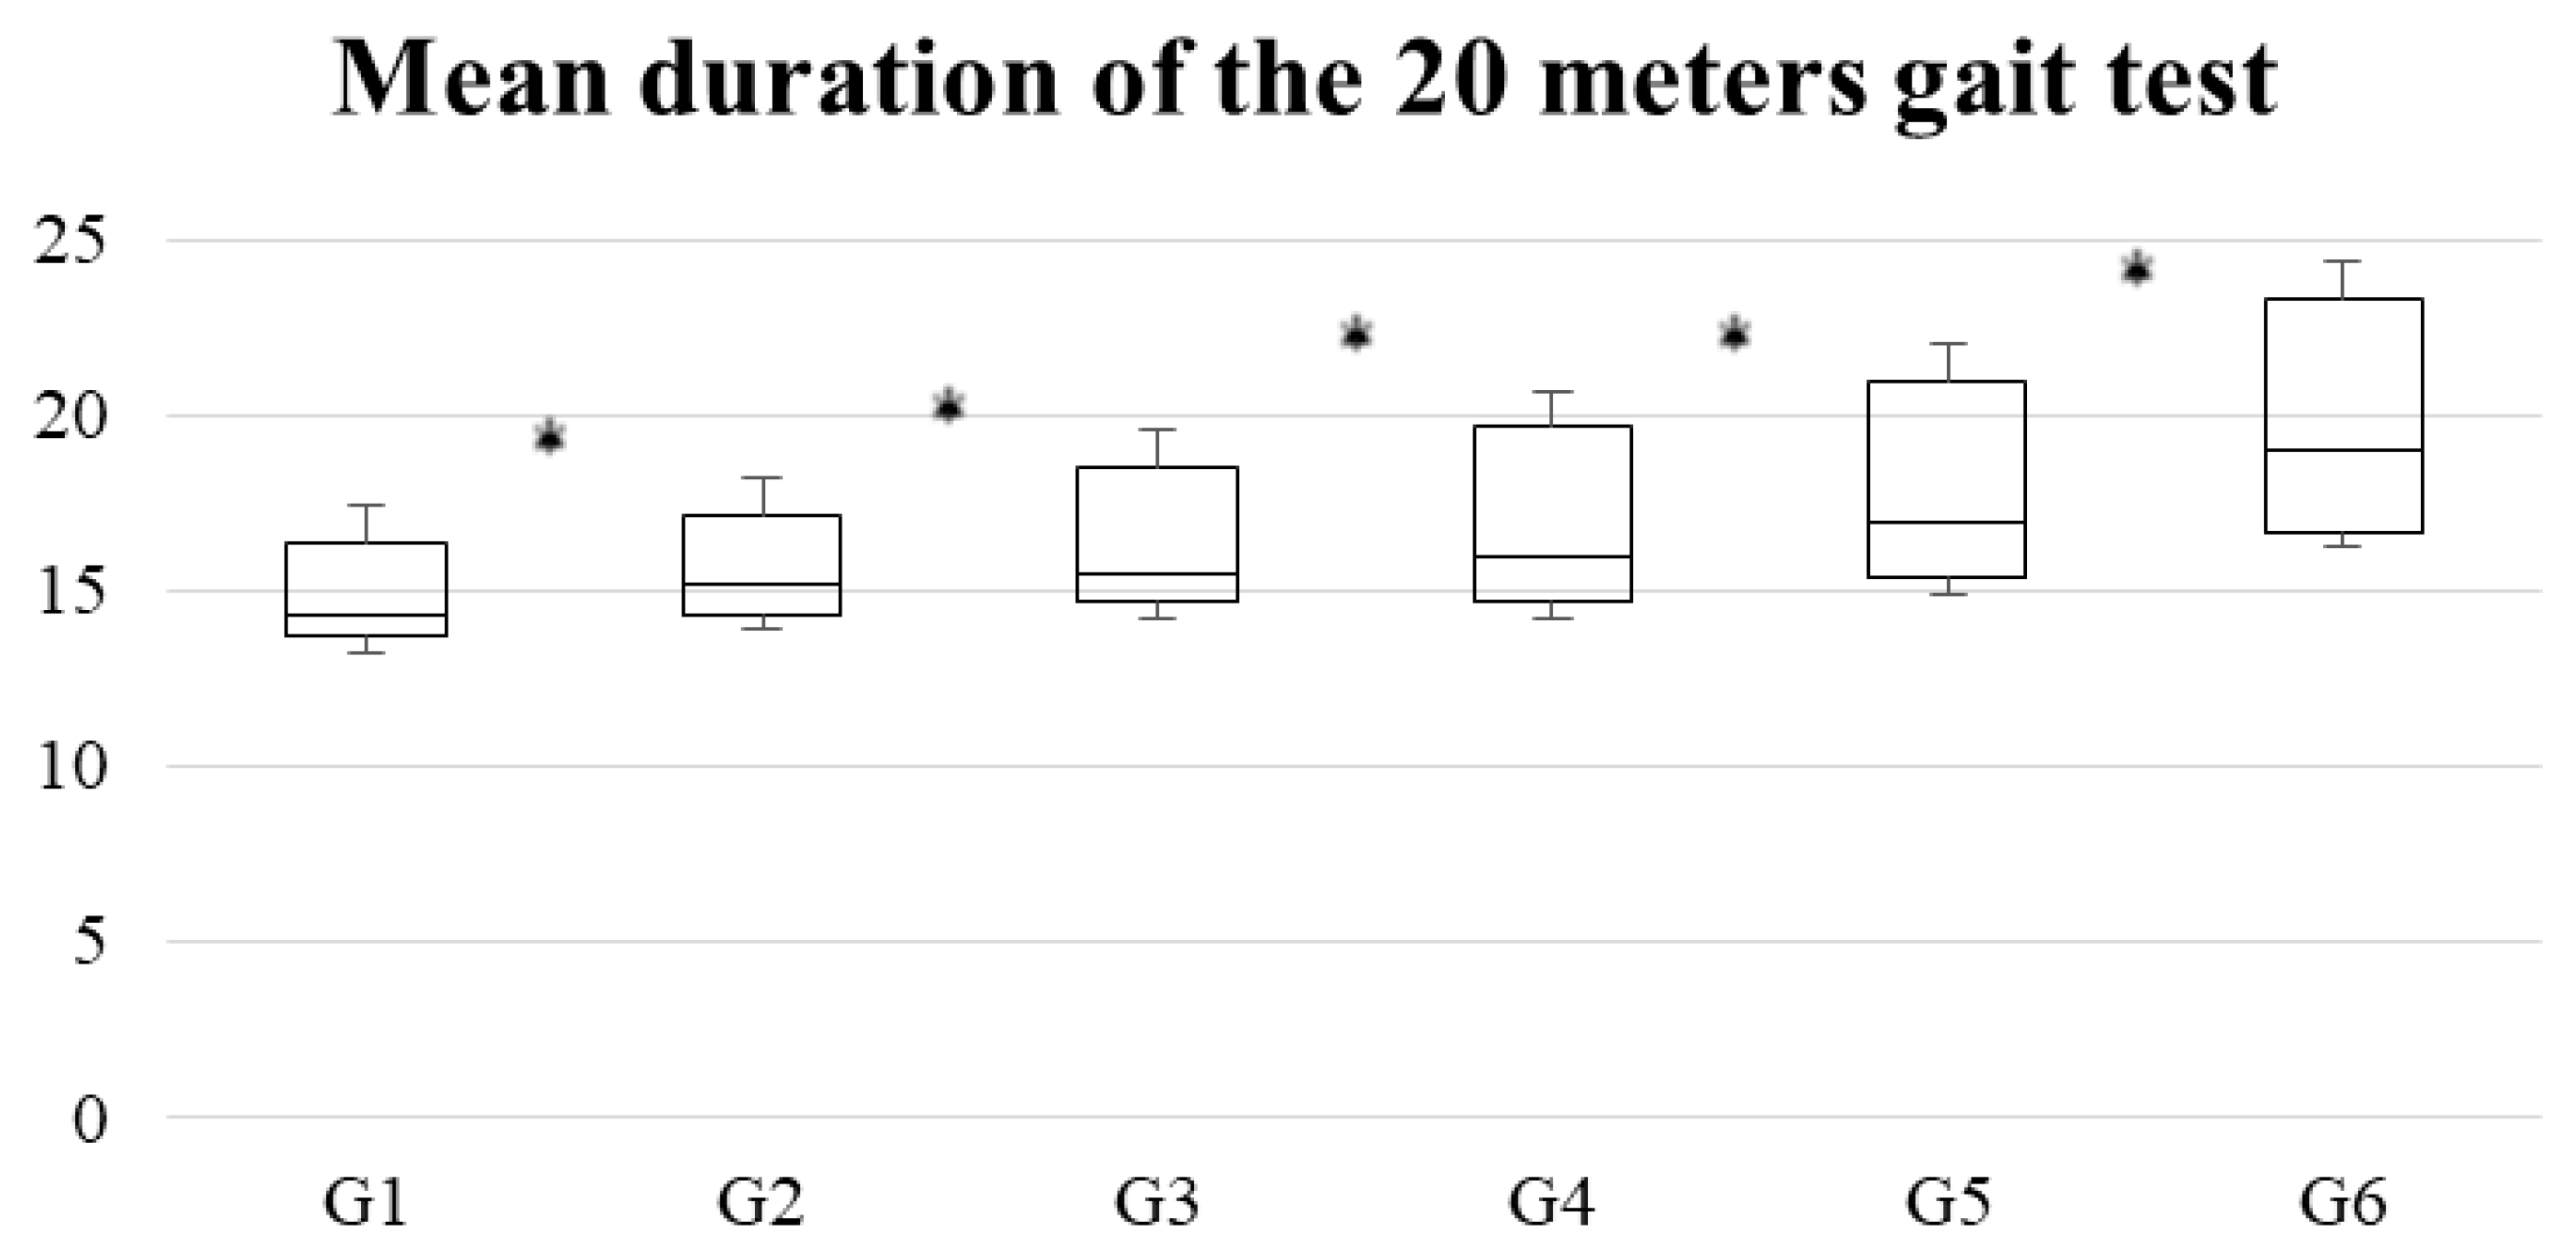
| Variable | G1 (n = 187) | G2 (n = 172) | G3 (n = 185) | G4 (n = 192) | G5 (n = 187) | G6 (n = 173) |
|---|---|---|---|---|---|---|
| Mean ± standard deviation | 15.9 ± 2.3 | 15.5 ± 2 | 15.9 ± 1.9 | 17.1 ± 2.9 | 16.6 ± 2.1 | 18.8 ± 3.2 |
| Kurtosis | 2 | 2.4 | 3.2 | 4.4 | 3.5 | 2.3 |
| Percentile 25 | 13.7 | 14.3 | 14.7 | 14.7 | 15.3 | 16.7 |
| Percentile 50 (median) | 14.3 | 15.2 | 15.5 | 16 | 17 | 19 |
| Percentile 75 | 15.7 | 16.3 | 17.7 | 18.3 | 19.3 | 21 |
| Interquartile range | 2 | 2 | 3 | 3.7 | 4 | 4.3 |
Publisher’s Note: MDPI stays neutral with regard to jurisdictional claims in published maps and institutional affiliations. |
© 2020 by the authors. Licensee MDPI, Basel, Switzerland. This article is an open access article distributed under the terms and conditions of the Creative Commons Attribution (CC BY) license (http://creativecommons.org/licenses/by/4.0/).
Share and Cite
Leirós-Rodríguez, R.; García-Liñeira, J.; Soto-Rodríguez, A.; García-Soidán, J.L. Percentiles and Reference Values for Accelerometric Gait Assessment in Women Aged 50–80 Years. Brain Sci. 2020, 10, 832. https://doi.org/10.3390/brainsci10110832
Leirós-Rodríguez R, García-Liñeira J, Soto-Rodríguez A, García-Soidán JL. Percentiles and Reference Values for Accelerometric Gait Assessment in Women Aged 50–80 Years. Brain Sciences. 2020; 10(11):832. https://doi.org/10.3390/brainsci10110832
Chicago/Turabian StyleLeirós-Rodríguez, Raquel, Jesús García-Liñeira, Anxela Soto-Rodríguez, and Jose L. García-Soidán. 2020. "Percentiles and Reference Values for Accelerometric Gait Assessment in Women Aged 50–80 Years" Brain Sciences 10, no. 11: 832. https://doi.org/10.3390/brainsci10110832
APA StyleLeirós-Rodríguez, R., García-Liñeira, J., Soto-Rodríguez, A., & García-Soidán, J. L. (2020). Percentiles and Reference Values for Accelerometric Gait Assessment in Women Aged 50–80 Years. Brain Sciences, 10(11), 832. https://doi.org/10.3390/brainsci10110832