1. Introduction
The brain, which is the center of all cognitive and sensory stimuli, also controls the vital functions in the body. This central unit has an excellent information processing function. In performing these functions, it produces complicated and complex biopotential signals [
1]. These signals can be recorded using different methods. These records, called electroencephalogram (EEG), contain a lot of information related to the work of the brain and other organs of the body [
1,
2,
3]. This information also allows us to obtain information about both cognitive and sensory stimulation [
1]. EEG signals are used in this study because of their low cost and they contain lots of information. In addition, the abnormal activity of these signals is used for disease detection and contains important information for monitoring the disease. One of these diseases, which can be detected by EEG signals, is epilepsy [
4]. It is estimated that this disease affects millions of people around the world [
5]. Epilepsy is a disease that manifests itself in the form of seizures. Epilepsy seizure is an abnormal electrical activity that occurs temporarily in nerve cells [
3]. From a clinical point of view, neurologists can examine the wave morphology of EEG signals in the detection of this disease and have an idea about the presence or level of the disease. However, the detection of this disease from EEG is based on the examination of long-term records, which is costly in time. Therefore, many studies have been proposed in the literature that may be helpful for specialized clinicians to detect automatic epilepsy from EEG. There are several important databases used in the proposed methods and they are publicly available. The database of the Department of Epileptology in the University of Bonn is at the top of these data sets [
6]. Therefore, the Bonn data set was used in this study. There are many studies in the literature using the Bonn data set for epilepsy detection. These studies can generally be grouped under two classes. Which are:
- (a)
Studies Based on Conventional Methods
- (b)
Studies Based on Deep Learning Methods
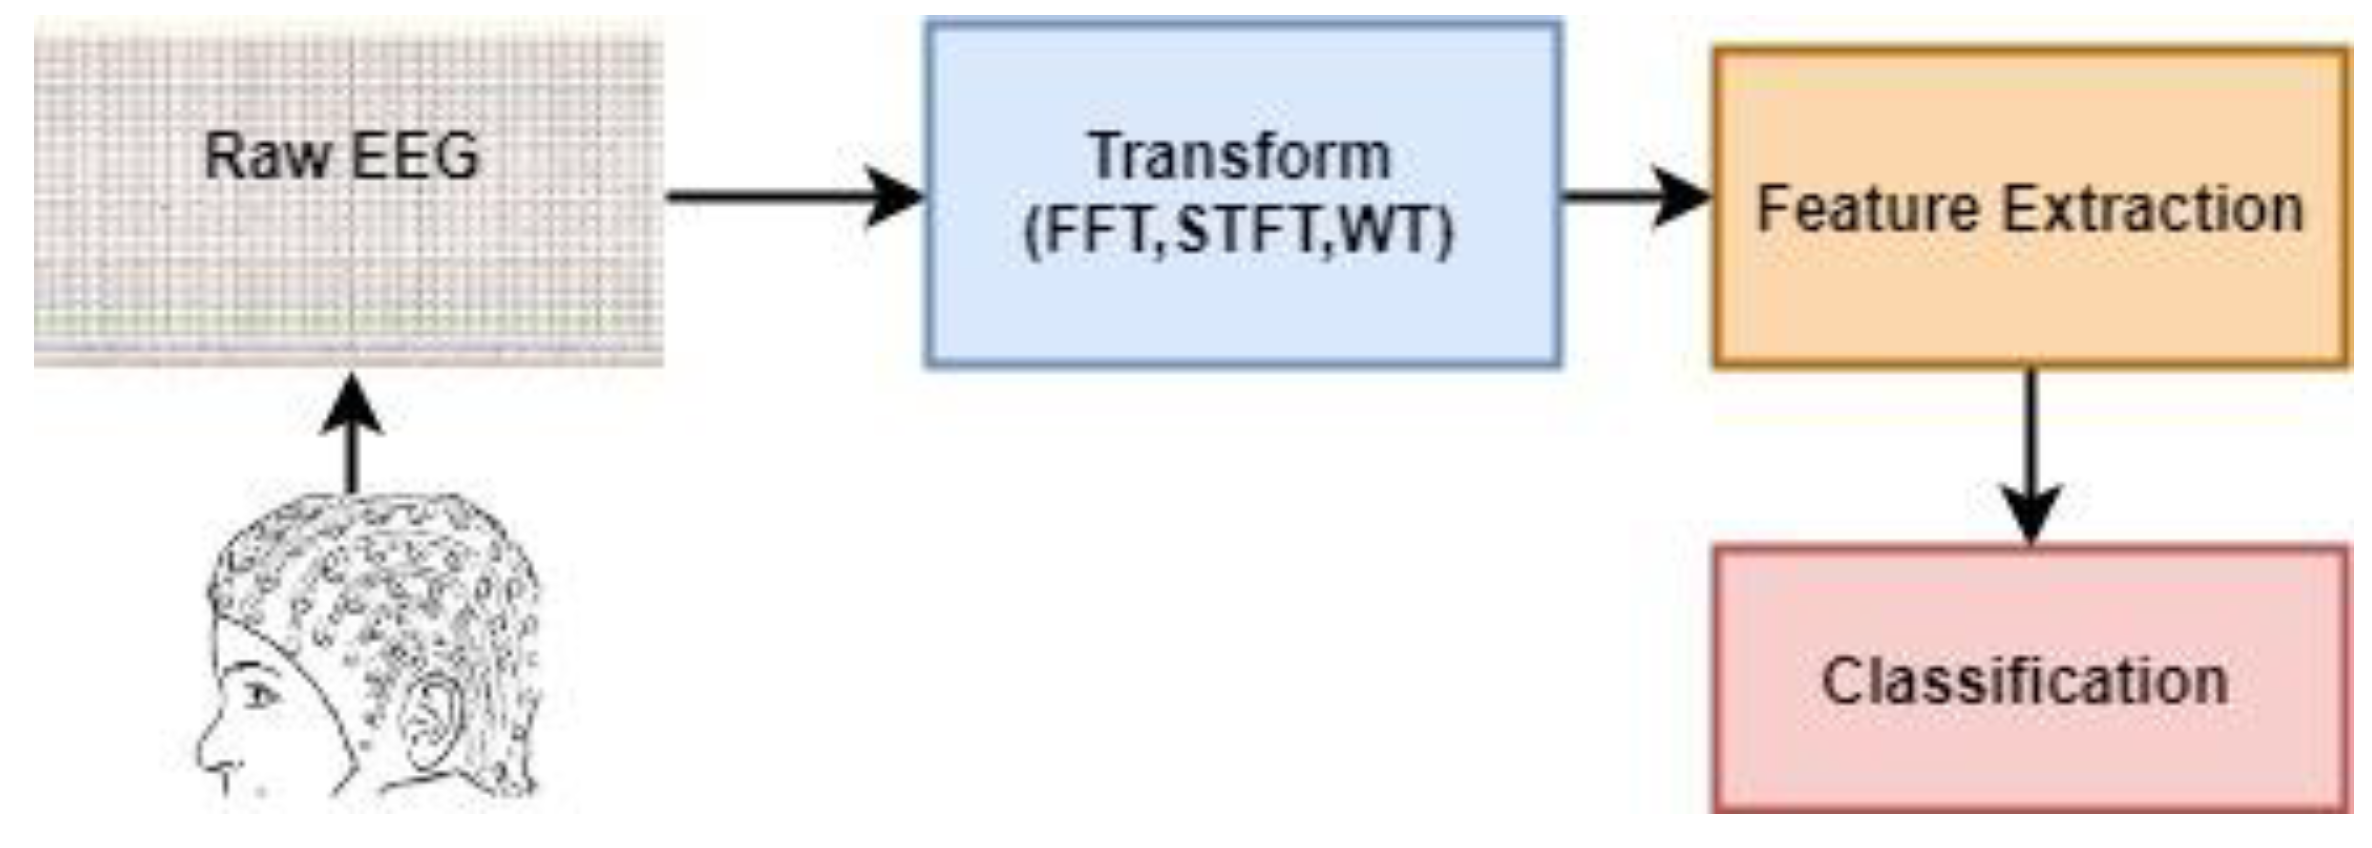
(a) Studies Based on Conventional Methods: The EEG signals are by their nature unpredictable. When these signals are recorded, the information obtained first is time-amplitude information. However, EEG signals show potentials at different frequencies. For this reason, EEG signals are used to determine activity, while transformation methods that protect the structure of the signal and at the same time detect dominant (different) frequencies are prominent. In general, the main purpose of these methods is to move the EEG signal from the time-amplitude domain to the frequency-time domain. Examples of these transformation methods are Fast Fourier Transform (FFT), Short Time Fourier Transform (STFT), and Wavelet Transform (WT). Because of the length of the data to be used in the classification process after these transformations, feature methods are required to represent the characteristics and differences of the data set. In this scope, statistical parameters (mean, maximum, minimum Par), Hjorth parameters, spectral estimation methods can be shown among the frequently used methods for obtaining the content [
7]. These features are then classified using a classifier. As the most widely used classifiers in this type of studies, K Nearest Neighbor (k-NN) Algorithm, Multilayer Artificial Neural Networks (MANN), Decision Trees Method, Support Vector Machine (SVM) can be shown [
7]. In general, the path followed in the studies based on conventional methods is shown in
Figure 1.
When we look at the literature study based on the Bonn database and conventional methods: Subasi (2007) used mixture of experts (ME) modular neural network architecture for controlled learning. In his study, he proposed a bi-cycle expectation-maximization (EM) algorithm to determine the epileptic seizure. Using discrete wavelet transform, the study decomposed the EEG signal into sub-bands. These sub-band frequencies are then input into the ME network as normal and epileptic. The study achieved a success of 94.5% [
8].
Chandaka et al. (2009) have described a named pattern recognition technique that defines the SVM sequence with cross-correlation support. Certain techniques are used for the binary classification of EEG signals. A 95.96% classification success was obtained in their studies [
9].
Li et al. (2013) suggested a new method based on empirical mode decomposition (EMD) and SVM. In their studies, first, the EEG signal was separated into the Intrinsic Mode Functions (IMFs) using the EMD method, and then the coefficient of variation and fluctuation index were obtained from these IMFs. These obtained features were evaluated in SVM classifier. In their study, they separated normal and epilepsy EEG separation by 98.00% sensitivity and 99.40% specificity [
10].
Kaya, Y. et al. (2014), in their studies, obtained uniform and non-uniform features from epileptic EEG signals by using the 1D-LBP (One Dimensional Local Binary Pattern) method. In their classification with BayesNet, they found the accuracy of classification in the range of 93.00–99.50% and in the range of 92.80–99.50% with the non-uniform 1D-LBP in the features they obtained using the whole 1D-LBP method [
11].
Xiang et al. (2015) suggested the method based on Fuzzy Entropy for the detection of epileptic seizures. The method first calculates the Fuzzy Entropy value of EEG signals from different epileptic states. They proposed the grid optimization method to train the obtained classification features using the SVM. They found normal and seizure EEG signaling accuracy of 100% in their study [
12].
Kumar et al. (2015) divided the segments into the EEG signals before and during the seizure by applying a Gabor filter. The results obtained by applying the 1D-LBP method to the obtained segments have obtained a classification accuracy of 98.33% using the near neighbor algorithm [
13].
Bhattacharyya et al. (2017), in their studies, analyzed the EEG signal by calculating multi-scale entropies. Quality scale (Q) based multi-scale entropy measurement is proposed to calculate the entropy of the EEG signal in different frequency bands. Q-based entropy (QEn) was calculated by separating the signal with the adjustable Q wavelength. In the study, k-NN entropy was calculated cumulatively from the sub-bands. The acquired features are assigned to the SVM. They found normal and seizure EEG signal and 100% classification accuracy [
14].
Jia et al. (2017) used the complete ensemble empirical mode decomposition with adaptive noise (CEEMDAN) technique in their studies. They obtained various statistical features from their growth curve. These features are classified by random forest classifier. Ten-fold cross validation procedures were performed. They found the normal and seizure EEG signal to be 98.00% classification accuracy [
15].
Zahra et al. (2017) used the multivariate empirical mode decomposition (MEMD) method to perform time-frequency (T-F) analysis in their studies. In the acquisition phase, Intrinsic Mode Functions (IMF) with lower frequency and noise were removed. Instantaneous frequency and amplitude information were obtained by applying Hilbert Transform to remaining IMFs. These obtained features were classified using artificial neural networks. They classified five different EEG datasets used in their studies with an accuracy of 87.20% [
16].
Sharmila, A. et al. (2018), used discrete wavelet transform for the detection of epilepsy from the EEG signal in their studies. They obtained Shannon entropy and Approximate entropy (ApEn) values of sub-bands formed as a result of decomposition. They classified these values into SVM classifier. They found normal and seizure EEG signal to 100% classification accuracy [
17].
Lu et al. (2018) used Kraskov Entropy based on the Hilbert Huang Transform (HHT) to obtain features. In the study, after decomposing the EEG signals into the internal mode functions, they calculated the Kraskov entropy applied on each internal mode function and the adjustable-Q (Tunable-Q) wavelet transform. They used the Least Squares Version of Support Vector Machine (LS-SVM) to classify these features. In their study, for different EEG classes, the classification success was found to be in the range of 81.96%–98.75% [
18].
Ibrahim, S., Djemal, R., and Alsuwailem, A. (2018) proposed a different feature acquisition and classification technique to assist in the diagnosis of both epilepsy and autism spectrum disorder (ASD). First, the EEG signal is sub-banded using a discrete-wavelet transform (DWT). Standard deviation, band strength, Shannon entropy, and the largest Lyapunov base were obtained from these bands. Cross-correlation was also performed to measure the synchronization between the channels of the signal, which was not separated into the sub-bands. In their study, they found normal and seizure EEG signal using the different classifiers and the highest 100% classification accuracy [
19].
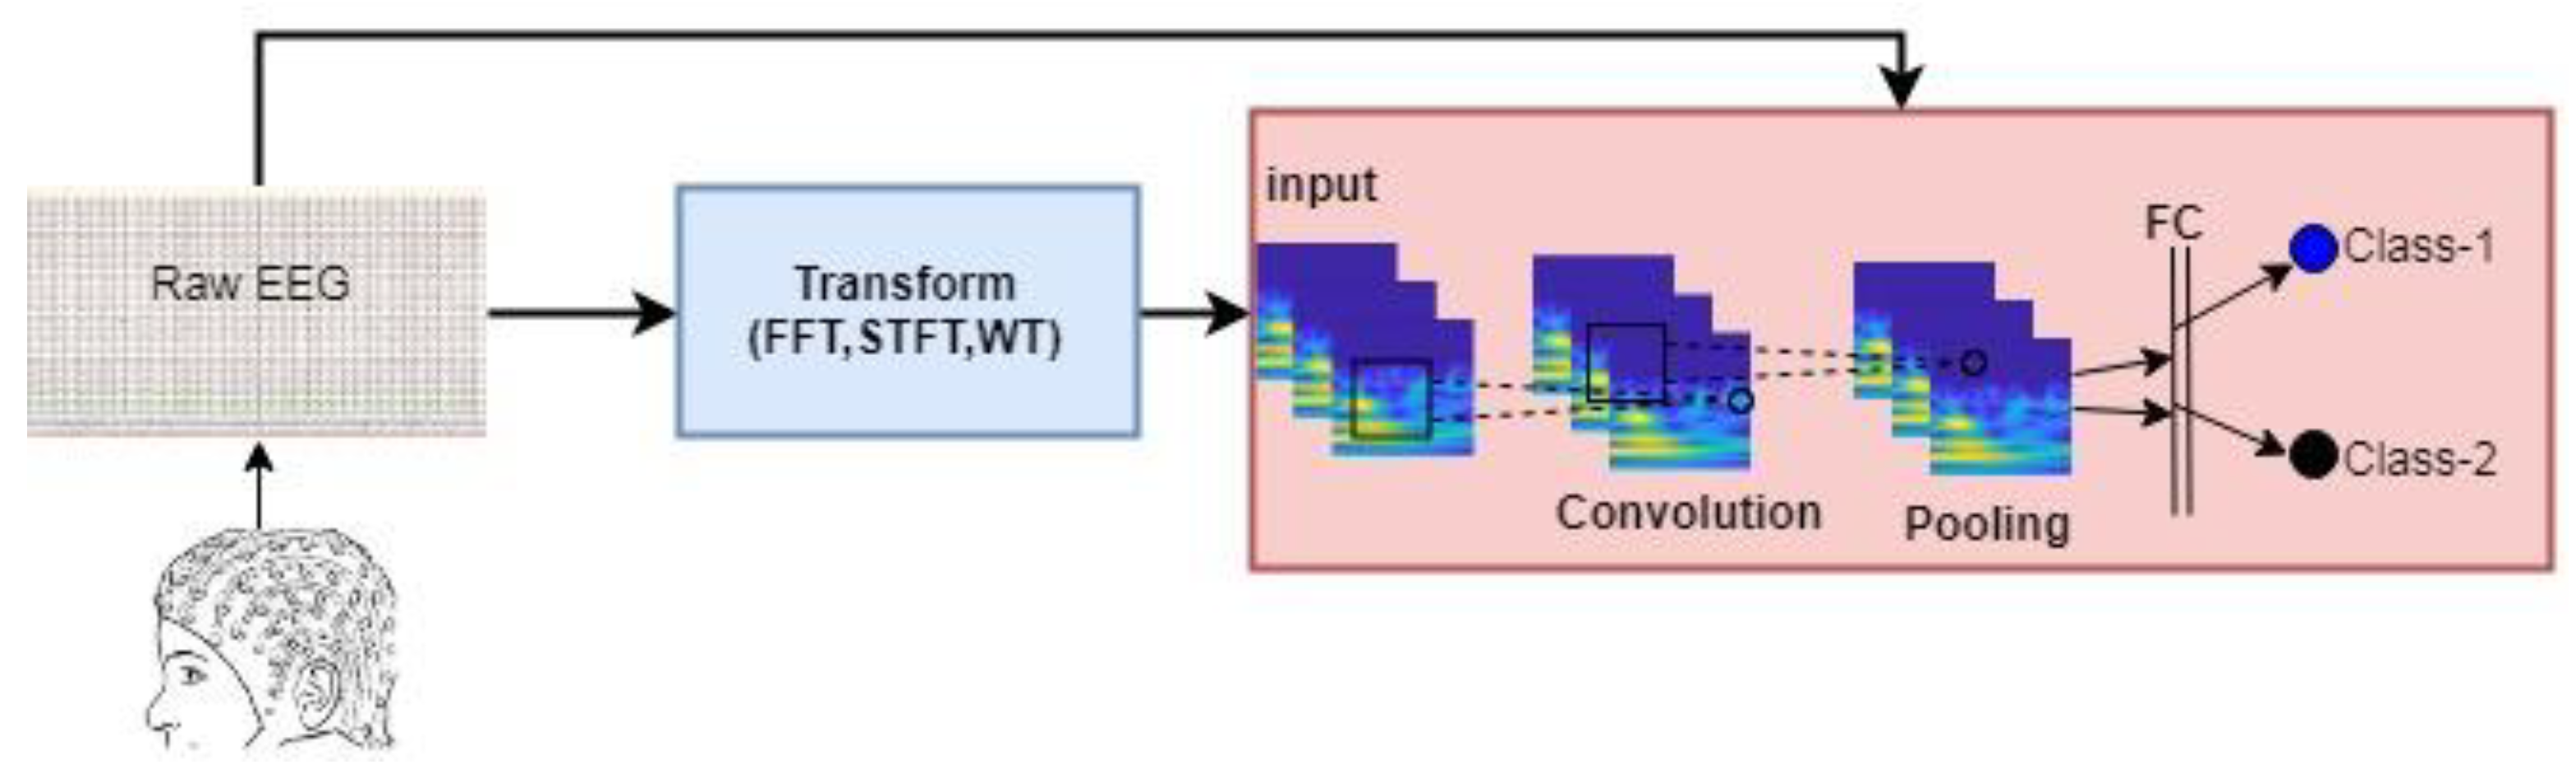
(b) Studies Based on Deep Learning Methods: Currently, the methods in which few parts of the data are included in the classification are replaced by deep learning methods that quickly process very large data. Because the data in the conventional methods is represented by features, there is a great loss of data. However, thanks to deep learning networks, the EEG signal can be processed as raw. Deep learning mimics the human brain’s ability to observe, analyze, learn, and make decisions to solve particularly complex problems. Deep Learning has the ability to produce learning models and relationships beyond the adjacent affinities in the data. Therefore, the most important advantage of deep learning is the ability to perform the feature phase itself. In other words, deep learning networks process the data it receives and process the differences it finds on these feature maps. The path followed in the studies based on deep learning methods is given in
Figure 2.
In the literature, the basic studies based on deep learning using the Bonn database are summarized below.
Ullah et al. (2018) divided the data set into four sub-segments of 1024. These sub-bands were then reduced to 50% overlapped and reduced to sub-bands using 512 window lengths. They classified the EEG data set thus obtained using the ensemble of Pyramidal One-Dimensional Convolutional Neural Network (P-1D-CNN) models. The seizure detection accuracy was 99.1% in their studies [
20].
Hussein et al. (2018) first transformed EEG data were into a series of non-overlapping segments to reveal the correlation between consecutive data samples. Then, they used the Long Short Term Memory (LSTM) network and the Softmax classifier for classification to learn the high-level features of normal and seizure EEG models. Seizure detection accuracy was found in the range of 90.0–100% [
21].
Yuan et al. (2018) transformed EEG records into EEG scalogram sequences using wavelet transform. Three different EEG features were obtained by using Global Principal Component Analysis (GPCA), Stacked Denoising Autoencoders (SDAE), and EEG segments, as global, channel-based and temporal features. Finally, by combining all of the features, the EEG was assigned to the SVM classifier for seizure detection. They found normal and seizure EEG signal, 100% classification accuracy [
22].
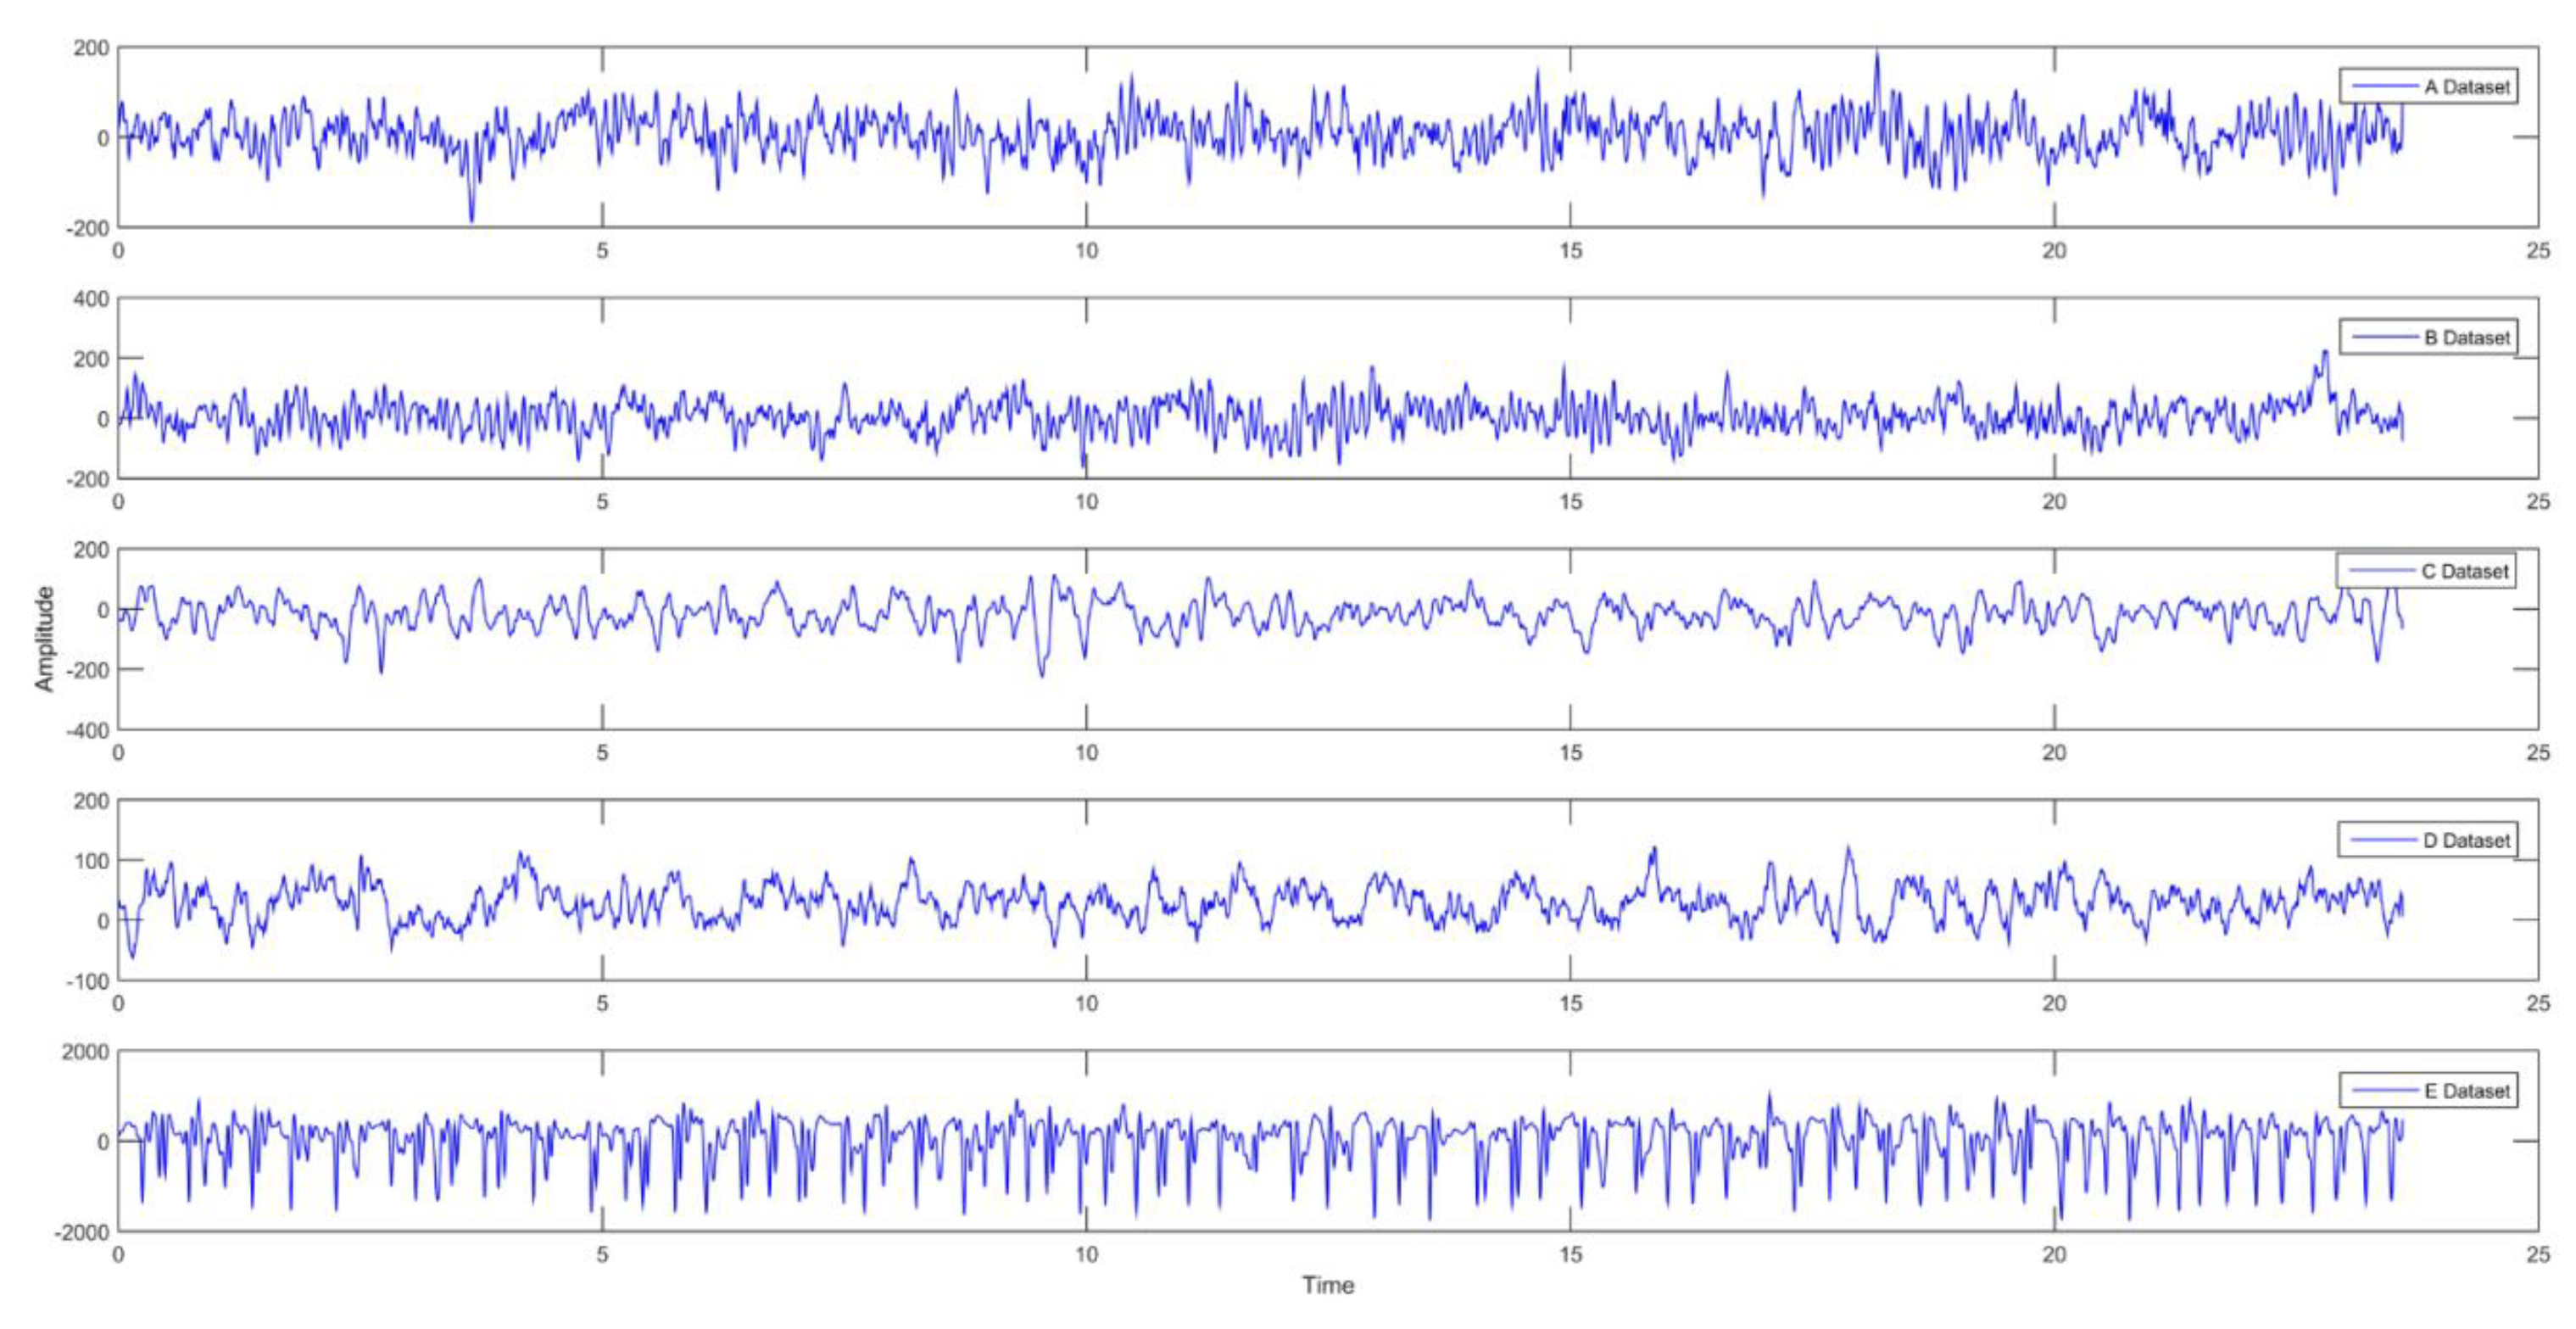
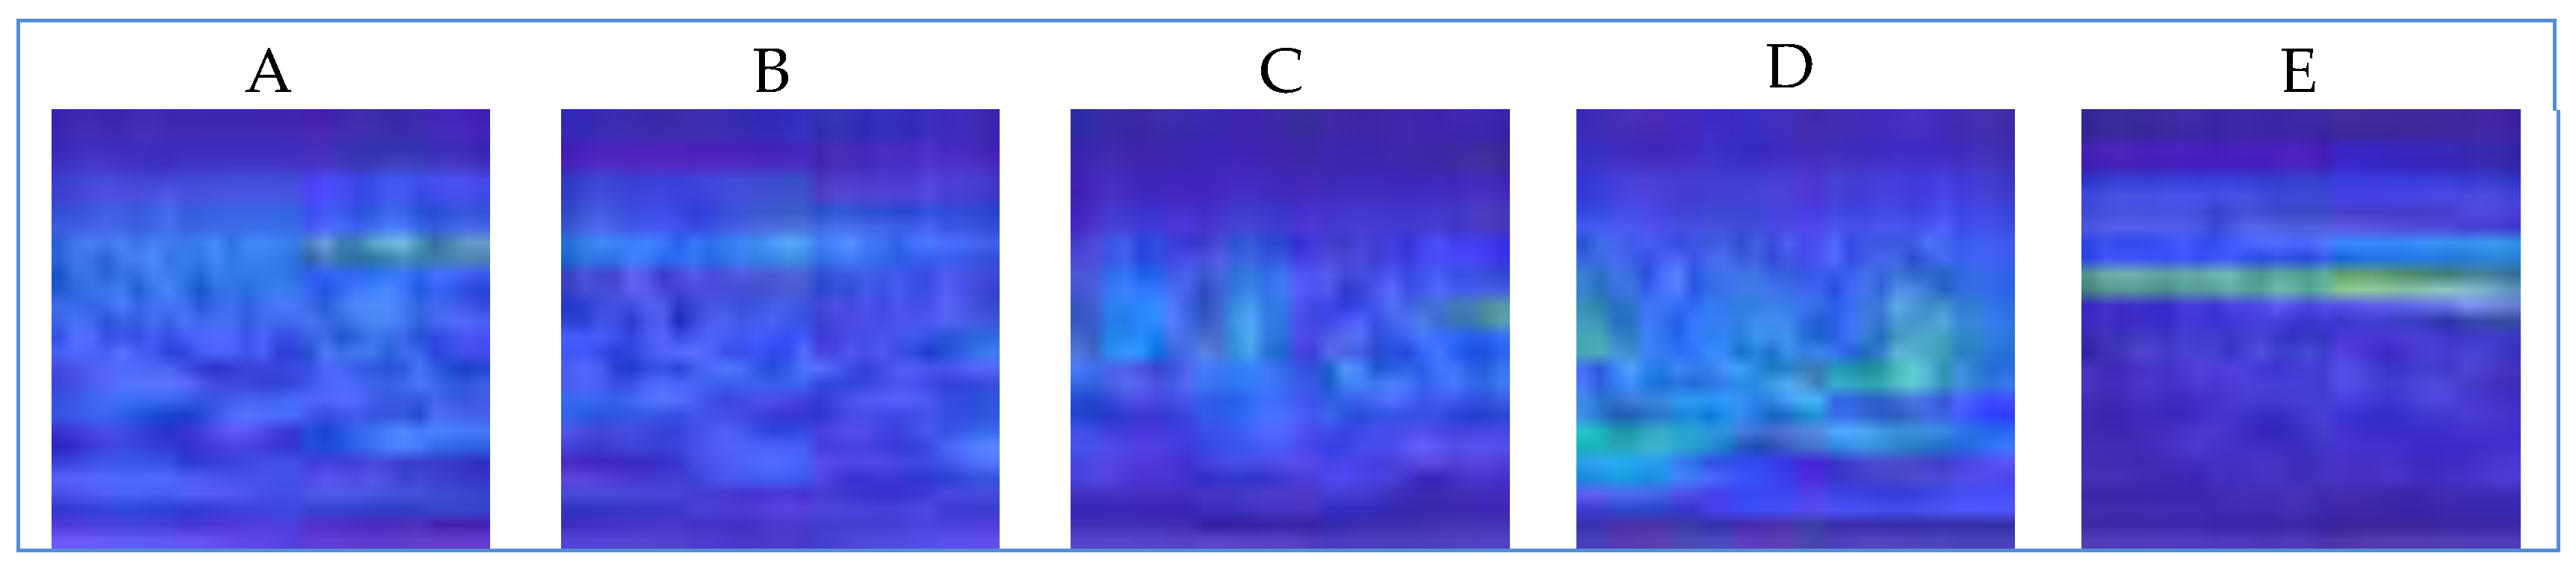
Acharya et al. (2018) used EEG recordings (A, B, C, D, and E). In order to determine the normal, pre-seizure, and seizure classes, EEG recordings were applied to a 13-layer Convolutional Neural Network (CNN) algorithm. Each EEG data set consists of 100 × 4097 data points. 90% of the data set was used for training and 10% for testing. Thirty percent of the data used for the training was used as validation data during the training phase. The proposed technique provided 88.67% accuracy, 90.00% specificity, and 95.00% sensitivity success [
23].
Considering the literature studies using conventional methods; it is known that many methods are used to obtain features from the data sets of these studies. In cases where a good performance cannot be obtained with the obtained features, it is tried to increase the performance by using different size reduction methods. This approach is very costly in terms of time and causes data loss.
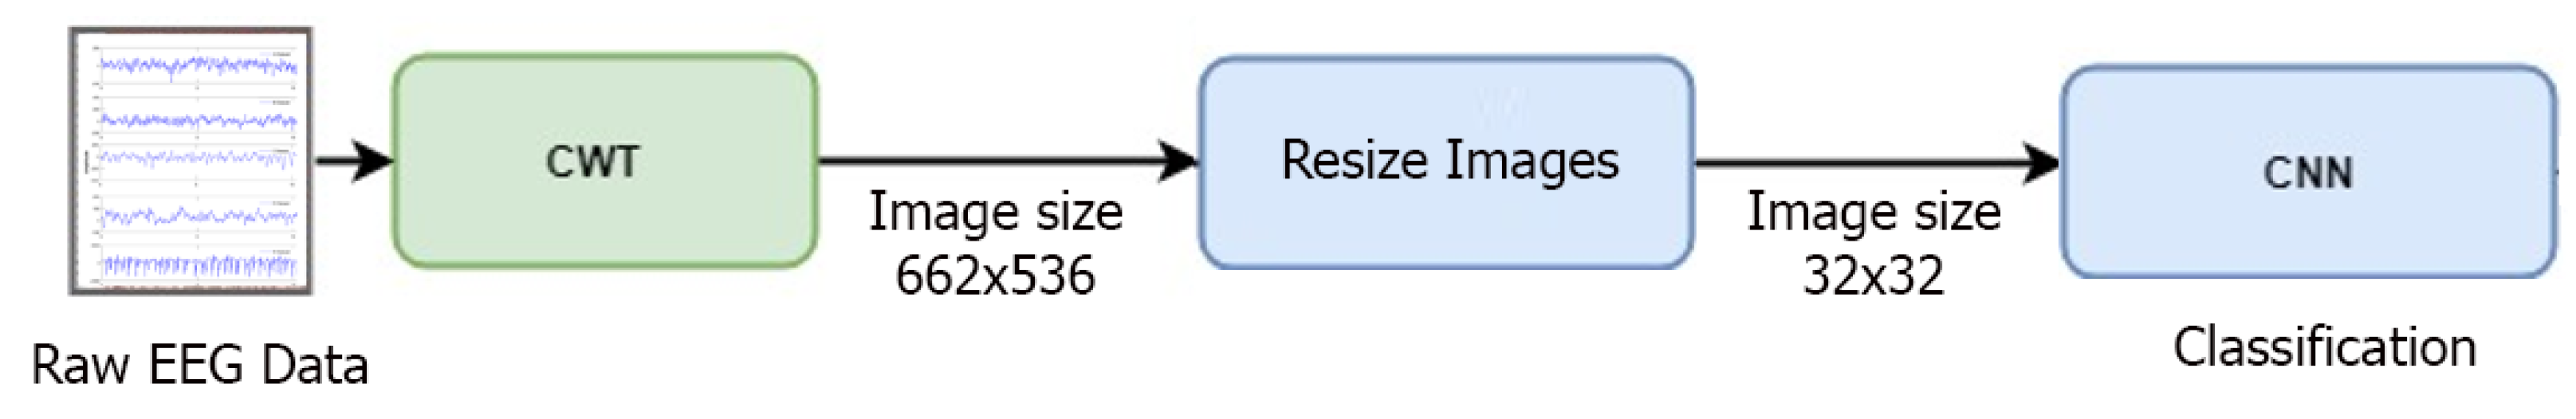
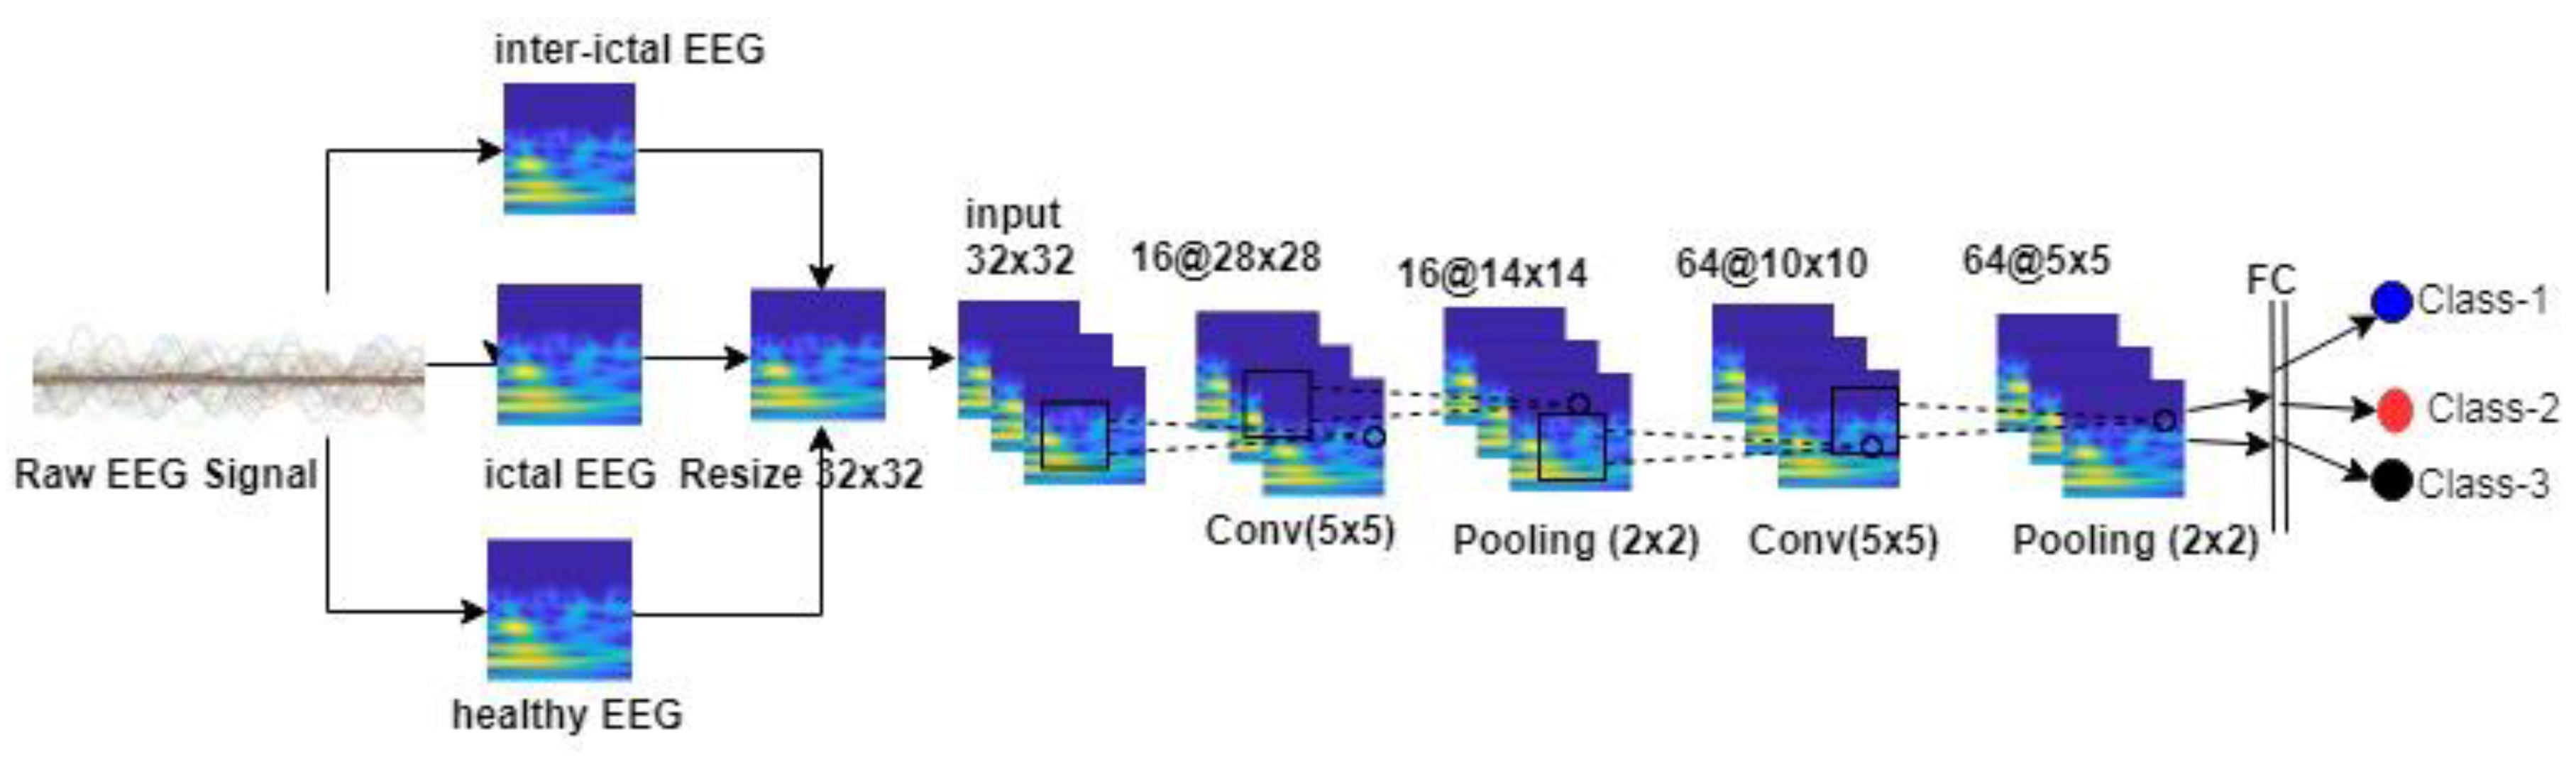
In some of the deep learning-based approaches, direct training of feature vectors is provided. In this case, since the feature vector does not contain the characteristic of the data set, it can be seen that the desired success performance cannot be achieved. In some deep learning studies, raw EEG data were used directly for classification, but no good success performance was obtained. This deficiency seen in the literature motivated us to do this study. The stages of the method we proposed in this study are as follows: a) Frequency-time scalograms are obtained from raw EEG signals due to the success of deep learning networks in image processing area; b) Data sets are classified in CNN with different combinations. In this study, there are five different data sets (A, B, C, D, and E) and each data set is EEG records containing different activities. The images obtained from these records are evaluated on the CNN: Binary (e.g., A-B), triple (e.g., A-B-E), quad (e.g., A-C-D-E), and quintet (e.g., A-B-C-D-E) classification successes were obtained. All combinations of EEG classes with different activity were then classified. The aim of this approach is to show that each dataset with its own characteristic can be classified by the proposed method. On the other hand, unlike the studies in the literature, it is recommended to determine effective epilepsy detection method by evaluating the frequency-time scalograms images from the raw EEG signals without using any feature and size reduction method in the convolutional neural network that can learn their own. In addition, the success of the proposed method was evaluated by comparing the performance achievements with the other studies in the literature. Research findings have shown that the proposed approach is very effective in separating EEG signals.
3. Results
In the study, frequency-time images obtained from EEG signals were evaluated in CNN structure. All combinations of EEG signals, each containing different activity, were compared. Classes compared in the study:
For binary data sets: A-B, A-C, A-D, A-E, B-C, B-D, B-E, C-D, C-E, and D-E
For triple data sets: A-B-C, A-B-D, A-B-E, A-C-D, A-C-E, B-C-D, B-C-E, B-D-E, D-C-E, and A-D-E
For quadruple data sets: A-C-D-E and B-C-D-E
For five data sets: A-B-C-D-E
In this section, the success performances of each class are given in tables.
Table 5 shows the performance measurements obtained in the double class classification of EEG records in the study.
In
Table 5, different accuracy rates were found in the classification of data sets A and B with data sets D and E. However, A and B data sets showed the same characteristics with D-E data sets in binary classifications. In the study, it is seen that C and D data sets show the same characteristics in the classification with E data set. On the other hand, it is seen that C and D data sets can be separated at 80.00% accuracy. From this point of view, it was observed that the measurement region of the EEG signals before the seizure varied. In the case of reference, A or B datasets, the highest performance was obtained with the D data set, and in the E data set of the reference, the highest performance was obtained in the A and B data sets. Similarly, it was seen that C and D data sets showed the same characteristics in the classification with E data set. Based on this, it can be said that the brain region is not important in comparing the pre-seizure signal with the seizure moment signal. On the other hand, it can be said that the brain region is important in comparing pre-seizure signals (C or D) with healthy signal (A or B). In addition, in the separation of the healthy A and B datasets, it can be seen that the proposed method can significantly catch up with the difference in the closed eye state (95.50%). On the other hand; In comparison with the epileptic signal, the signal processed in the healthy and open eye was seen to be more successful than the closed eye signal (Example A-E, B-E). In addition, it was observed that the healthy and closed eye signal was compared to the pre-seizure epileptic signal and it was more successful than the healthy and open eye signal (Example A-C, B-C).
In the study, triple class classification performance is given in
Table 6.
In triple classification performance: A-B-C 95.00%, A-B-D 96.67%, A-B-E 95.67%, A-C-E 97.00%, A-C-D 88.00%, A-D-E 99.00%, B-C-D 91.33%, B-C-E 98.67%, B-D-E 98.00%, and D-C-E 89.00%, were separated by the average accuracy (overall). In the classification of health signals with pre-seizure signals, it is observed that the closed eye signal (B data set) is better than the open eye signal. Another important issue in the study is that the performance of the signal with the seizure signal (E data set) of the healthy signals is lower than the signals before the seizure. The lowest classification performance in the triple classification was obtained from A-C-D data sets with 88.00%, while the highest achievement performance was obtained from A-D-E data set with 99.00%.
Table 7 shows the quaternary class classification performance.
In quaternary class performance, A-C-D-E and B-C-D-E were classified with an average of 90.50% and 91.50% accuracy (overall), respectively. In this classification, it is seen that A and B data sets show almost the same characteristics in classification with other classes. In the same way, the data sets A, B, and E in (A-C-D-E) and (B-C-D-E) were separated at the same sensitivity ratios.
The classification performance in which all classes are included is given in
Table 8.
In the five-class classification, the A-B-C-D-E was found to have an average of 93.60% accuracy. In
Table 8, 99.36% accuracy was obtained from the highest E data set.
4. Discussion
Very successful results are obtained with deep learning architecture which can be applied to many areas today. Therefore, deep learning has become a central position in machine learning and pattern recognition. In the world of science, it is predicted that deep learning networks, which are adding new methods every day, will achieve the desired success in many areas in the future. In addition, robust inference through deep learning is predicted to improve the reliability of clinical decision support systems. By using deep learning networks, more successful results can be obtained in separating multiple classes.
In this study, a method that can be used as a clinical decision tool in the detection of Epilepsy in EEG signals is proposed. The performances obtained by the proposed method compared to other methods used in the literature are given in
Table 9.
As can be seen in
Table 9, it was concluded that the proposed method could provide an important classification accuracy compared to other studies. Currently, deep learning networks have achieved great success in image processing. Therefore, in our study, frequency-time images of five different EEG signals with different activities using CWT were evaluated in CNN. The results are compared with many studies in the literature.
In the literature studies, features were obtained by using different methods (
Table 9). In some studies, it is aimed to increase the success by using size reduction methods. In addition, in most studies only certain classes could be compared. There are two reasons for this. The first is the detection of seizures and pre-seizures (pre-ictal) from EEG signals. The second is that the characteristics of each EEG data are different. Because, in order to achieve a good success performance in different classes, different features must be used. This is not a practical solution for the classification stages of EEG signals. In our study, unlike the studies conducted;
No feature has been obtained from the EEG dataset. At the same time, no size reduction method was used.
Frequency-time scalograms of raw EEG data were evaluated directly in the CNN structure.
The comparison of all classes was performed to evaluate the success of the proposed method. It has been found that the proposed method can successfully distinguish each data set with its own characteristic.
It has been observed that the method used in the study provides a much better success than the methods used in the literature, especially when the data set diversity increases.
It has been observed that the method we offer has very good results in distinguishing EEG signals. Therefore, if EEG signals are to be evaluated in CNN, we recommend to convert them to images by using various conversion methods, but also to not use methods such as gaining or decreasing the signal.


