
Do Neutrophil–Lymphocyte Ratio and Platelet–Lymphocyte Ratio Need to Be Stratified for Age and Comorbidities in COVID-19 Disease? A Subgroup Analysis of Two Distinct Cohorts over Disease Course
 ,
,
Abstract
:1. Introduction
2. Materials and Methods
Statistical Analysis
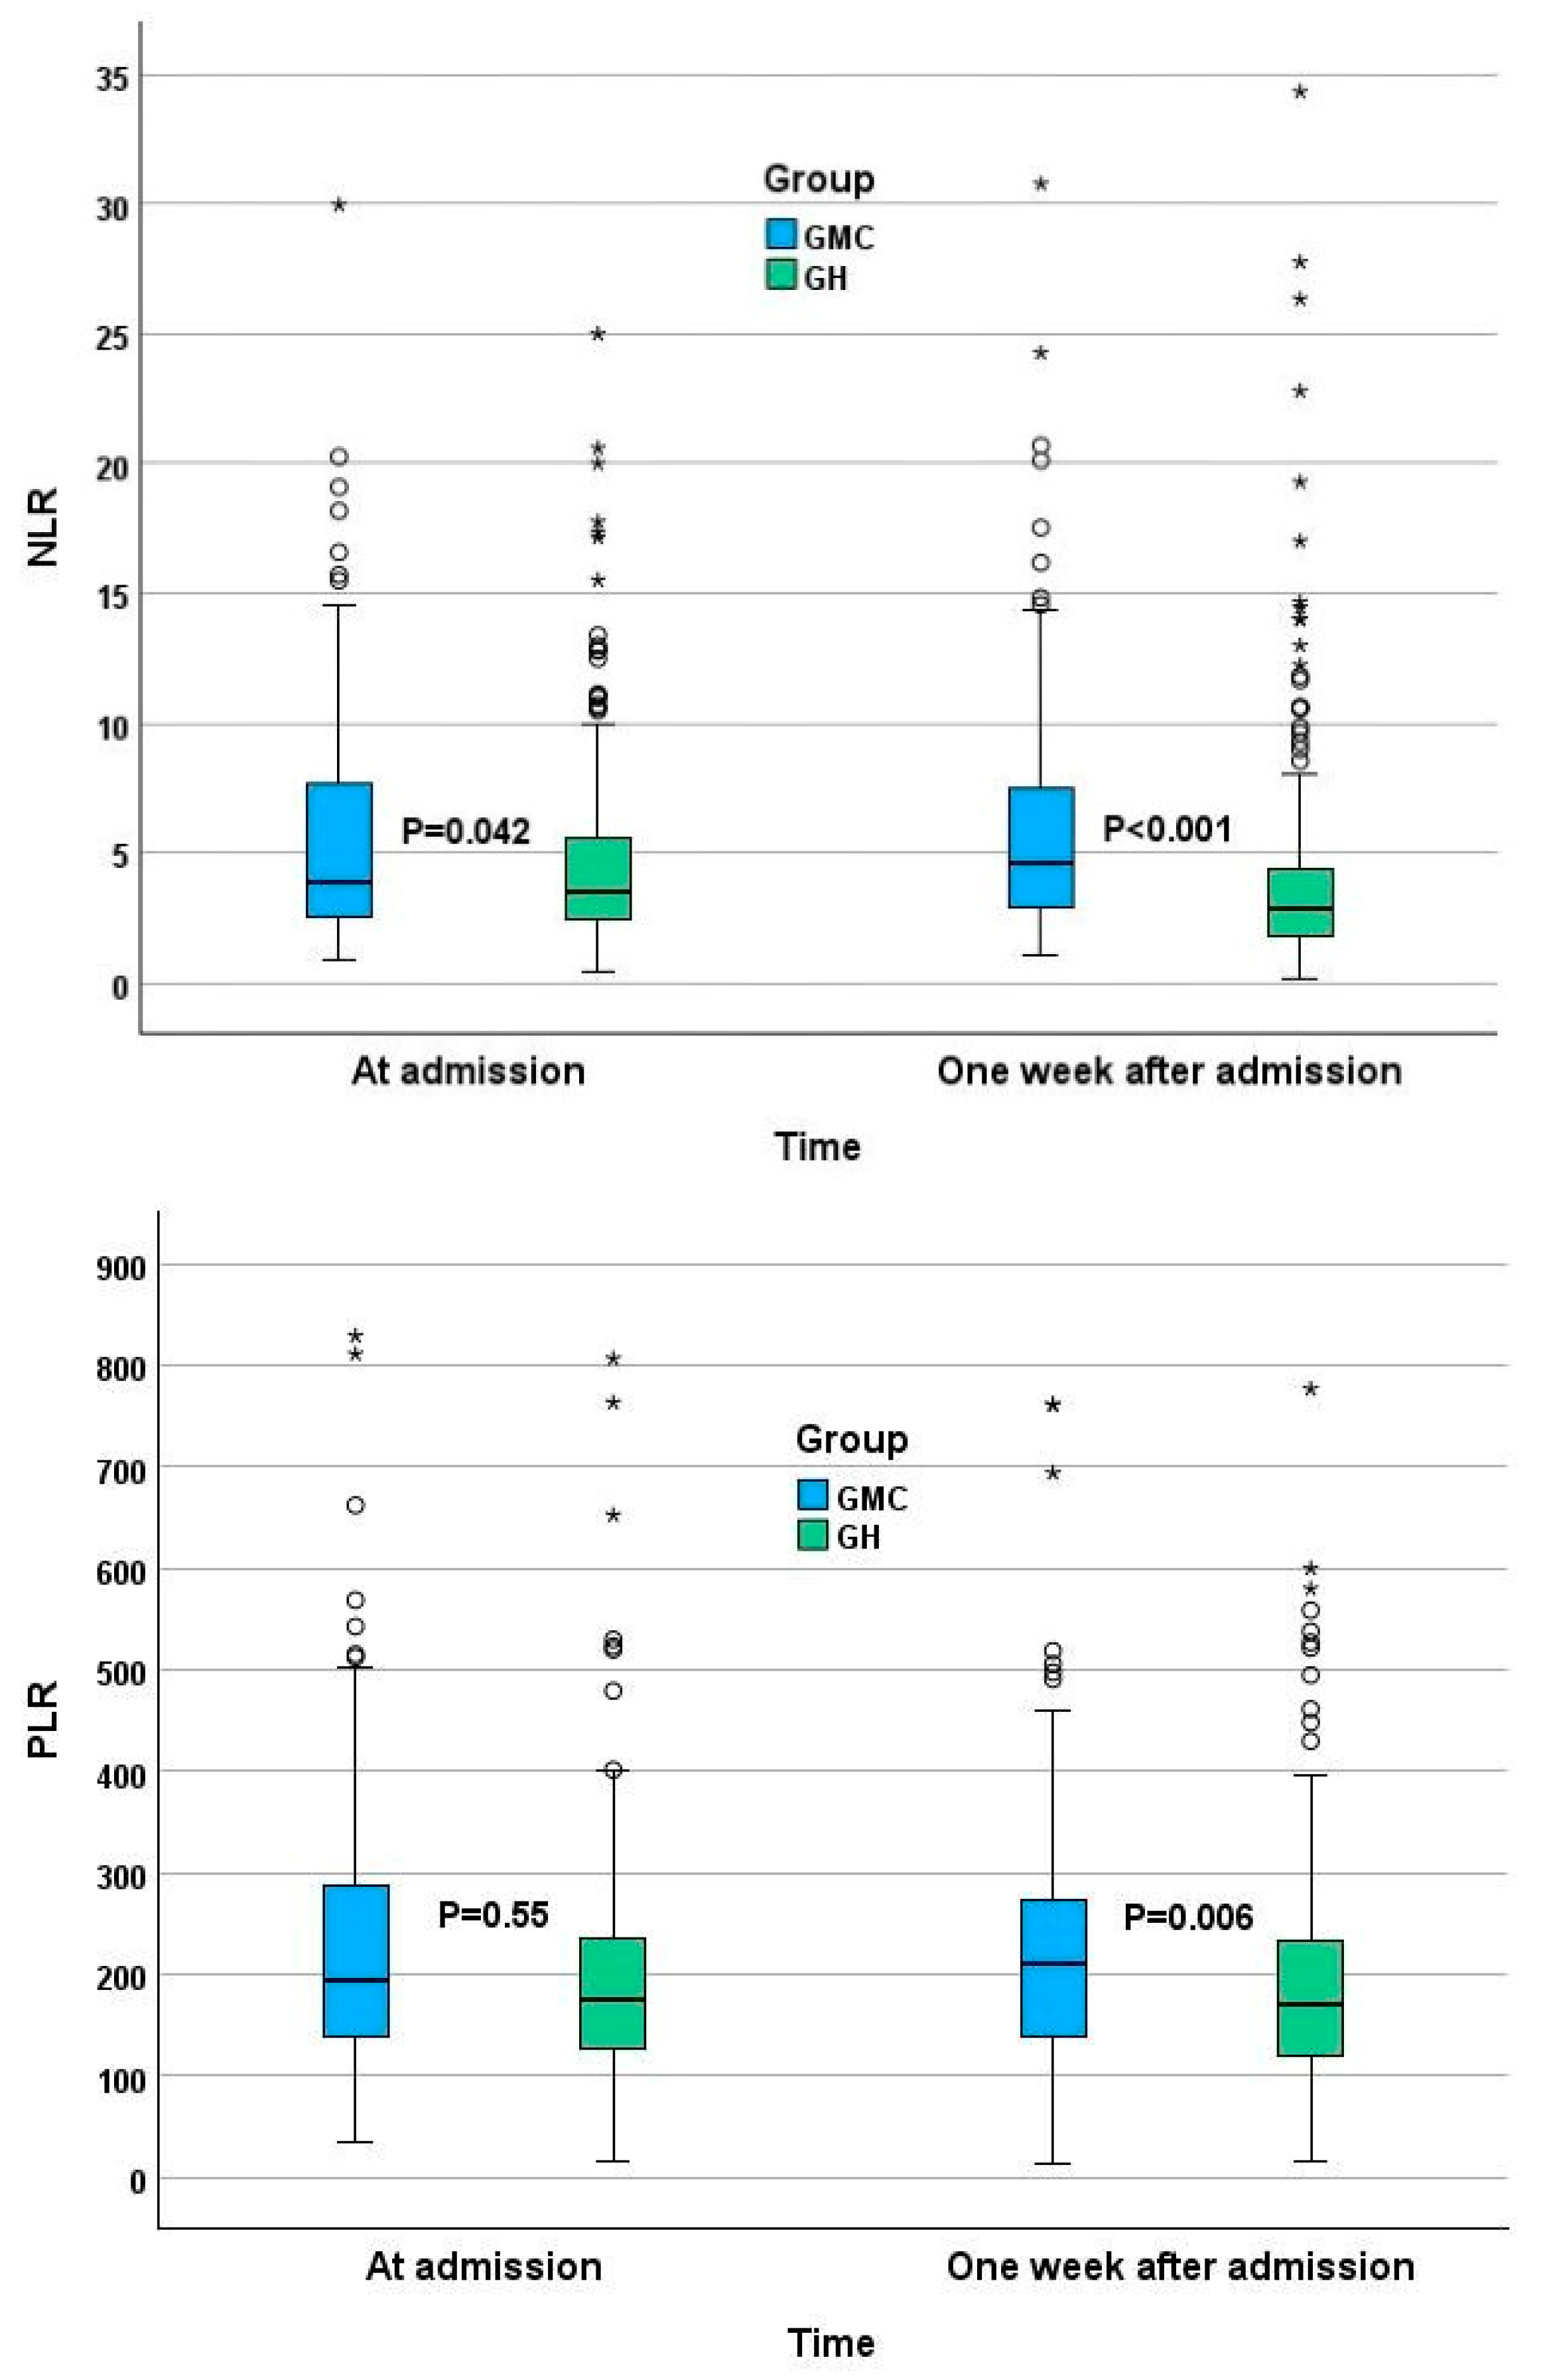
3. Results
4. Discussion
5. Conclusions
Author Contributions
Funding
Institutional Review Board Statement
Informed Consent Statement
Data Availability Statement
Conflicts of Interest
References
- COVID—Coronavirus Statistics—Worldometer. Available online: https://www.worldometers.info/coronavirus/ (accessed on 2 April 2023).
- COVID-19 Response: Living with COVID-19—GOV.UK. Available online: https://www.gov.uk/government/publications/covid-19-response-living-with-covid-19/covid-19-response-living-with-covid-19 (accessed on 3 March 2023).
- Ayalon, L.; Brammli-Greenberg, S.; Lauter, S.; Tsadok-Rosenbluth, S. COVID-19 and the Long-Term Care system in Israel. In LTCcovid International Living Report on COVID-19 and Long-Term Care; Comas-Herrera, A., Marczak, J., Byrd, W., Lorenz-Dant, K., Pharoah, D., Eds.; LTCcovid, Care Policy and Evaluation Centre, London School of Economics and Political Science: London, UK; Available online: https://ltccovid.org/country/=israel/ (accessed on 19 November 2022).
- Levy, Y.; Turjeman, A.; Cooper, L.; Kagansky, N.; Nagulevich, T.; Snir, T.; Hershkovitz, A.; Weiss, A.; Beloosesky, Y.; Weissman, Y.L. Frail Older Adults with Presymptomatic SARS-CoV-2 Infection: Clinical Course and Prognosis. Gerontology 2022, 68, 1393–1401. [Google Scholar] [CrossRef] [PubMed]
- Tsadok-Rosenbluth, S.; Hovav, B.; Horowitz, G.; Brammli-Greenberg, S. Centralized Management of the COVID-19 Pandemic in Long-Term Care Facilities in Israel. J. Long Term Care 2021, 92–99. [Google Scholar] [CrossRef]
- Margraf, A.; Lowell, C.A.; Zarbock, A. Neutrophils in acute inflammation: Current concepts and translational implications. Blood 2022, 139, 2130–2144. [Google Scholar] [CrossRef] [PubMed]
- Rokkam, V.R.; Killeen, R.B.; Kotagiri, R. Secondary Thrombocytosis. In StatPearls; StatPearls Publishing: St. Petersburg, FL, USA, 2023. [Google Scholar]
- Riff, R.; Cohen, Y.; Eini-Rider, H.; Naamani, O.; Mazar, J.; Haviv, Y.S.; Chaimovitz, C.; Douvdevani, A. Systemic inflammatory response syndrome–related lymphopenia is associated with adenosine A1 receptor dysfunction. J. Leukoc. Biol. 2017, 102, 95–103. [Google Scholar] [CrossRef] [PubMed]
- Li, J.; Zhang, K.; Zhang, Y.; Gu, Z.; Huang, C. Neutrophils in COVID-19: Recent insights and advances. Virol. J. 2023, 20, 169. [Google Scholar] [CrossRef]
- Asik, Z. The Role of the NLR and PLR in Urinary Tract Infection. Clin. Lab. 2021, 67, 2292–2297. [Google Scholar] [CrossRef] [PubMed]
- Liang, P.; Yu, F. Value of CRP, PCT, and NLR in Prediction of Severity and Prognosis of Patients with Bloodstream Infections and Sepsis. Front. Surg. 2022, 9, 857218. [Google Scholar] [CrossRef]
- Huang, Z.; Fu, Z.; Huang, W.; Huang, K. Prognostic value of neutrophil-to-lymphocyte ratio in sepsis: A meta-analysis. Am. J. Emerg. Med. 2020, 38, 641–647. [Google Scholar] [CrossRef]
- Mikami, T.D.; Funayama, A.D.; Niimi, K.D.; Haga, K.D.; Kawaharada, M.D.; Nakamura, A.D.; Katagiri, W.D.; Kobayashi, T.D. Prognostic value of preoperative systemic inflammatory response as a prognostic indicator in patients with early-stage oral squamous cell carcinoma. Medicine 2022, 101, e30855. [Google Scholar] [CrossRef]
- Feng, J.-F.; Huang, Y.; Chen, Q.-X. Preoperative platelet lymphocyte ratio (PLR) is superior to neutrophil lymphocyte ratio (NLR) as a predictive factor in patients with esophageal squamous cell carcinoma. World J. Surg. Oncol. 2014, 12, 58. [Google Scholar] [CrossRef]
- Hirahara, T.; Arigami, T.; Yanagita, S.; Matsushita, D.; Uchikado, Y.; Kita, Y.; Mori, S.; Sasaki, K.; Omoto, I.; Kurahara, H.; et al. Combined neutrophil-lymphocyte ratio and platelet-lymphocyte ratio predicts chemotherapy response and prognosis in patients with advanced gastric cancer. BMC Cancer 2019, 19, 672. [Google Scholar] [CrossRef] [PubMed]
- Liu, J.; Ao, W.; Zhou, J.; Luo, P.; Wang, Q.; Xiang, D. The correlation between PLR-NLR and prognosis in acute myocardial infarction. Am. J. Transl. Res. 2021, 13, 4892–4899. [Google Scholar] [PubMed]
- Liao, Y.; Liu, C.; He, W.; Wang, D. Study on the Value of Blood Biomarkers NLR and PLR in the Clinical Diagnosis of Influenza a Virus Infection in Children. Clin. Lab. 2021, 67, 2540–2547. [Google Scholar] [CrossRef] [PubMed]
- Kosidło, J.W.; Wolszczak-Biedrzycka, B.; Matowicka-Karna, J.; Dymicka-Piekarska, V.; Dorf, J. Clinical Significance and Diagnostic Utility of NLR, LMR, PLR and SII in the Course of COVID-19: A Literature Review. J. Inflamm. Res. 2023, 16, 539–562. [Google Scholar] [CrossRef] [PubMed]
- El Hussini, M.S.; El Hussieny, M.S.; Heiba, A.; Elsayed, E.S.M.; Hassan, N.E.; El-Masry, S.A. Correlation Between Neutrophil-Lymphocyte Ratio, Platelets-Lymphocyte Ratio, and High-Resolution CT in Patients with COVID-19. EMJ Radiol. 2023. [Google Scholar] [CrossRef]
- Yang, A.-P.; Liu, J.-P.; Tao, W.-Q.; Li, H.-M. The diagnostic and predictive role of NLR, d-NLR and PLR in COVID-19 patients. Int. Immunopharmacol. 2020, 84, 106504. [Google Scholar] [CrossRef]
- Levy, Y.; Derazne, E.; Shilovsky, A.; Kagansky, D.; Derkath, A.; Chepelev, V.; Mazurez, E.; Stambler, I.; Kagansky, N. Neutrophil to lymphocyte ratio and platelet to lymphocyte ratio, are they markers of COVID-19 severity or old age and frailty? A comparison of two distinct cohorts. Front. Med. 2023, 10, 1222692. [Google Scholar] [CrossRef]
- Parthasarathi, A.; Padukudru, S.; Arunachal, S.; Basavaraj, C.K.; Krishna, M.T.; Ganguly, K.; Upadhyay, S.; Anand, M.P. The Role of Neutrophil-to-Lymphocyte Ratio in Risk Stratification and Prognostication of COVID-19: A Systematic Review and Meta-Analysis. Vaccines 2022, 10, 1233. [Google Scholar] [CrossRef]
- Wang, J.; Zhang, F.; Jiang, F.; Hu, L.; Chen, J.; Wang, Y. Distribution and reference interval establishment of neutral-to-lymphocyte ratio (NLR), lymphocyte-to-monocyte ratio (LMR), and platelet-to-lymphocyte ratio (PLR) in Chinese healthy adults. J. Clin. Lab. Anal. 2021, 35, e23935. [Google Scholar] [CrossRef]
- Chen, L.; Yu, J.; He, W.; Chen, L.; Yuan, G.; Dong, F.; Chen, W.; Cao, Y.; Yang, J.; Cai, L.; et al. Risk factors for death in 1859 subjects with COVID-19. Leukemia 2020, 34, 2173–2183. [Google Scholar] [CrossRef]
- Chinnadurai, R.; Ogedengbe, O.; Agarwal, P.; Money-Coomes, S.; Abdurrahman, A.Z.; Mohammed, S.; Kalra, P.A.; Rothwell, N.; Pradhan, S. Older age and frailty are the chief predictors of mortality in COVID-19 patients admitted to an acute medical unit in a secondary care setting- a cohort study. BMC Geriatr. 2020, 20, 409. [Google Scholar] [CrossRef]
- Hewitt, J.; Carter, B.; Vilches-Moraga, A.; Quinn, T.J.; Braude, P.; Verduri, A.; Pearce, L.; Stechman, M.; Short, R.; Price, A.; et al. The effect of frailty on survival in patients with COVID-19 (COPE): A multicentre, European, observational cohort study. Lancet Public Health 2020, 5, e444–e451. [Google Scholar] [CrossRef] [PubMed]
- Giri, S.; Bal, S.; Godby, K.N.; Richman, J.; Olszewski, A.J.; Williams, G.R.; Costa, L.J.; Bhatia, S. Role of Neutrophil Lymphocyte Ratio [NLR] As a Biomarker of Frailty and Predictor of Survival Among Older Adults with Multiple Myeloma (MM). Blood 2020, 136 (Suppl. S1), 6. [Google Scholar] [CrossRef]
- Xu, W.; Liang, Y.; Lin, Z. Association Between Neutrophil–Lymphocyte Ratio and Frailty: The Chinese Longitudinal Healthy Longevity Survey. Front. Med. 2022, 8, 783077. [Google Scholar] [CrossRef] [PubMed]
- Nishijima, T.F.; Deal, A.M.; Williams, G.R.; Guerard, E.J.; Nyrop, K.A.; Muss, H.B. Frailty and inflammatory markers in older adults with cancer. Aging 2017, 9, 650–664. [Google Scholar] [CrossRef] [PubMed]
- Guan, L.; Liu, Q.; Yao, Y.; Wang, L.; Peng, Y.; Chen, S.; Zhou, L.; Zheng, X. Do neutrophil to lymphocyte ratio and platelet to lymphocyte ratio associate with frailty in elderly inpatient with comorbidity? Exp. Gerontol. 2022, 169, 111955. [Google Scholar] [CrossRef]
- McGovern, J.; Al-Azzawi, Y.; Kemp, O.; Moffitt, P.; Richards, C.; Dolan, R.D.; Laird, B.J.; McMillan, D.C.; Maguire, D. The relationship between frailty, nutritional status, co-morbidity, CT-body composition and systemic inflammation in patients with COVID-19. J. Transl. Med. 2022, 20, 98. [Google Scholar] [CrossRef]
- He, B.; Ma, Y.; Wang, C.; Jiang, M.; Geng, C.; Chang, X.; Ma, B.; Han, L. Prevalence and Risk Factors for Frailty Among Community-Dwelling Older People in China: A Systematic Review and Meta-Analysis. J. Nutr. Health Aging 2019, 23, 442–450. [Google Scholar] [CrossRef]
- Diez-Ruiz, A.; Bueno-Errandonea, A.; Nuñez-Barrio, J.; Sanchez-Martín, I.; Vrotsou, K.; Vergara, I. Factors associated with frailty in primary care: A prospective cohort study. BMC Geriatr. 2016, 16, 91. [Google Scholar] [CrossRef]


| GMC | GH | ||||
|---|---|---|---|---|---|
| N | Median (25th–75th) | N | Median (25th–75th) | p | |
| Age | 100 | 84.5 (78.0–91.0) | 287 | 52.0 (42.0–58.0) | <0.001 |
| BMI * | 37 | 24.1 (21.7–26.6) | 271 | 27.8 (24.7–31.6) | <0.001 |
| N | % | N | % | p | |
| Sex | 0.002 | ||||
| Male | 36 | 36.0 | 156 | 54.4 | |
| Female | 64 | 64.0 | 131 | 45.6 | |
| Residence | <0.001 | ||||
| Home | 51 | 51.5 | 267 | 93.0 | |
| Nursing Home | 48 | 48.5 | 20 | 7.0 | |
| Total number of diseases | <0.001 | ||||
| 0 | 0 | 0.0 | 98 | 34.1 | |
| 1 | 1 | 1.0 | 49 | 17.1 | |
| 2 | 2 | 2.0 | 58 | 20.2 | |
| 3 | 8 | 8.0 | 33 | 11.5 | |
| 4 | 9 | 9.0 | 25 | 8.7 | |
| ≥5 | 80 | 80.0 | 24 | 8.4 | |
| Heart failure | 25 | 25.0 | 10 | 3.5 | <0.001 |
| Chronic kidney disease | 23 | 23.0 | 11 | 3.8 | <0.001 |
| Dementia | 30 | 30.0 | 19 | 6.6 | <0.001 |
| Depression | 17 | 17.0 | 9 | 3.1 | <0.001 |
| Asthma–COPD | 9 | 9.0 | 24 | 8.4 | 0.837 |
| CVA | 21 | 21.0 | 2 | 0.7 | <0.001 |
| Diabetes mellitus | 44 | 44.0 | 69 | 24.0 | <0.001 |
| Anemia | 29 | 29.0 | 10 | 3.5 | <0.001 |
| Hypertension | 82 | 82.0 | 76 | 26.5 | <0.001 |
| Pressure Ulcers | 11 | 11.0 | 2 | 0.7 | <0.001 |
| Coronary Disease | 28 | 28.0 | 23 | 8.0 | <0.001 |
| PVD | 5 | 5.0 | 1 | 0.3 | 0.005 |
| Hyperlipidemia | 47 | 47.0 | 68 | 23.7 | <0.001 |
| Chronic Liver Disease | 6 | 6.0 | 7 | 2.4 | 0.107 |
| Hypothyroidism | 22 | 22.0 | 14 | 4.9 | <0.001 |
| Total number of medications | <0.001 | ||||
| 0 | 0 | 0.0 | 130 | 45.3 | |
| 1–3 | 5 | 5.0 | 73 | 25.4 | |
| 4–6 | 28 | 28.0 | 49 | 17.1 | |
| 6–9 | 67 | 67.0 | 35 | 12.2 | |
| Ace-Arb-inh | 42 | 42.0 | 53 | 18.5 | <0.001 |
| B-blockers | 52 | 52.0 | 39 | 13.6 | <0.001 |
| Insulin | 18 | 18.0 | 27 | 9.4 | 0.029 |
| Ca-blockers | 36 | 36.0 | 27 | 9.4 | <0.001 |
| Vitamin D | 33 | 33.0 | 11 | 3.8 | <0.001 |
| Antiplatelets | 31 | 31.0 | 42 | 14.6 | 0.001 |
| Levothyroxine | 19 | 19.0 | 12 | 4.2 | <0.001 |
| Anticoagulants | 43 | 43.0 | 15 | 5.2 | <0.001 |
| Antipsychotics | 35 | 35.0 | 21 | 7.3 | <0.001 |
| Antidepressants | 31 | 31.0 | 33 | 11.5 | <0.001 |
| Corticosteroids | 8 | 8.0 | 11 | 3.8 | 0.109 |
| GMC | GH | ||||
|---|---|---|---|---|---|
| N | % | N | % | p | |
| Anosmia | 0 | 0.0 | 13 | 4.5 | 0.025 |
| Diarrhea | 1 | 1.0 | 31 | 10.8 | 0.001 |
| Fatigue | 4 | 4.0 | 153 | 53.3 | <0.001 |
| Headache | 0 | 0.0 | 45 | 15.7 | <0.001 |
| Fever | 16 | 16.0 | 197 | 68.6 | <0.001 |
| Cough | 11 | 11.0 | 146 | 50.9 | <0.001 |
| Anxiety | 1 | 1.0 | 4 | 1.4 | 1.000 |
| Delirium | 2 | 2.0 | 1 | 0.3 | 0.165 |
| Dyspnea | 26 | 26.0 | 132 | 46.0 | 0.001 |
| Abdominal pain | 2 | 2.0 | 32 | 11.1 | 0.004 |
| Change of appetite | 2 | 2.0 | 48 | 16.7 | <0.001 |
| No symptoms | 62 | 62.0 | 6 | 2.1 | <0.001 |
| GMC Symptoms * | +/+ | +/− | −/+ | −/− | McNemar P |
|---|---|---|---|---|---|
| Anosmia | 0 | 0 | 0 | 100 | NA |
| Diarrhea | 0 | 1 | 2 | 97 | 1 |
| Fatigue | 1 | 3 | 1 | 95 | 0.625 |
| Headache | 0 | 0 | 0 | 100 | NA |
| Fever | 4 | 12 | 4 | 80 | 0.077 |
| Cough | 7 | 4 | 4 | 85 | 1 |
| Anxiety | 1 | 0 | 0 | 99 | 1 |
| Delirium | 1 | 1 | 0 | 98 | 1 |
| Dyspnea | 17 | 9 | 6 | 68 | 0.607 |
| Abdominal pain | 1 | 1 | 2 | 96 | 1 |
| Change of appetite | 2 | 0 | 0 | 98 | 1 |
| Any symptoms | 27 | 11 | 9 | 53 | 0.824 |
| GH Symptoms * | +/+ | +/− | −/+ | −/− | McNemar P |
| Anosmia | 0 | 13 | 1 | 273 | 0.002 |
| Diarrhea | 1 | 30 | 2 | 254 | <0.001 |
| Fatigue | 12 | 141 | 7 | 127 | <0.001 |
| Headache | 1 | 44 | 3 | 239 | <0.001 |
| Fever | 6 | 191 | 0 | 90 | <0.001 |
| Cough | 24 | 122 | 1 | 140 | <0.001 |
| Anxiety | 0 | 4 | 1 | 282 | 0.375 |
| Delirium | 0 | 1 | 0 | 286 | NA |
| Dyspnea | 15 | 117 | 6 | 149 | <0.001 |
| Abdominal pain | 1 | 31 | 1 | 254 | <0.001 |
| Change of appetite | 1 | 47 | 2 | 237 | <0.001 |
| Any symptoms | 89 | 192 | 1 | 5 | <0.001 |
| First Test | Changes from First to Second Test | ||||||||
|---|---|---|---|---|---|---|---|---|---|
| GMC | GH | M−W P | GMC | GH | M−W P | ||||
| N | Median (25th−75th) | N | Median (25th−75th) | Median (25th−75th) | Median (25th−75th) | ||||
| NLR | 100 | 3.86 (2.52–7.67) | 286 | 3.52 (2.44–5.56) | 0.042 | 0.20 (−1.70 to 2.09) | −0.08 (−1.85 to 0.02) | 0.006 | |
| PLR | 95 | 195 (139–302) | 285 | 175 (128–237) | 0.039 | −3.29 (−61.77 to 52.61) | 0 (−41.36 to 31.43) | 0.736 | |
| Hemoglobin | g/dL | 100 | 11.5 (10.3–13.4) | 286 | 13.4 (12.5–14.5) | <0.001 | −0.5 (−1.5 to 0.2) | 0 (−0.8 to 0.2) | 0.006 |
| WBC | 103/µL | 100 | 7.8(5.9–10.6) | 286 | 5.7 (4.20–7.40) | <0.001 | 0.8 (−2.1 to 2.5) | 0 (−0.6 to 1.4) | 0.730 |
| Monocytes% | % | 100 | 8.2 (5.9–10.1) | 284 | 8.2 (6.2–10.5) | 0.281 | −0.4 (−2.2 to 1.3) | 0 (−1.0 to 2.1) | 0.006 |
| Neutrophil TN | 103/µL | 100 | 5.7 (4.0–8.5) | 286 | 3.9 (2.7–5.3) | <0.001 | 0.5 (−1.4 to 2.4) | 0 (−0.8 to 0.7) | 0.147 |
| lymphocyte TN | 103/µL | 100 | 1.3 (0.9–1.7) | 287 | 1.0 (0.8–1.5) | 0.001 | 0.0 (−0.4 to 0.4) | 0.1 (0.0 to 0.6) | <0.001 |
| Platelets | 103/µL | 95 | 255 (187–334) | 285 | 184 (143–237) | <0.001 | 6 (−47 to 65) | 16 (0 to 120) | 0.001 |
| RDW | % | 100 | 14.5 (13.6–16.0) | 285 | 13.7 (13.1–14.5) | <0.001 | 0.2 (−0.3 to 0.7) | 0 (−0.1 to 0.2) | 0.070 |
| Creatinine | mg/dL | 99 | 1.0 (0.7–1.3) | 281 | 0.8 (0.6–09) | <0.001 | 0 (−0.15 to 0.14) | −0.05 (−0.1 to 0) | 0.003 |
| CRP | mg/L | 72 | 32 (17− 56) | 275 | 53 (21–112) | 0.005 | 0 (−16 to 35) | −3.62 (−61 to 0) | <0.001 |
| GMC | GH | ||||
|---|---|---|---|---|---|
| N | % | N | % | p | |
| NLR ≥ 2.15 | 83 | 83.0 | 229 | 79.8 | 0.558 |
| PLR ≥ 110 | 85 | 85.0 | 240 | 83.6 | 0.874 |
Disclaimer/Publisher’s Note: The statements, opinions and data contained in all publications are solely those of the individual author(s) and contributor(s) and not of MDPI and/or the editor(s). MDPI and/or the editor(s) disclaim responsibility for any injury to people or property resulting from any ideas, methods, instructions or products referred to in the content. |
© 2024 by the authors. Licensee MDPI, Basel, Switzerland. This article is an open access article distributed under the terms and conditions of the Creative Commons Attribution (CC BY) license (https://creativecommons.org/licenses/by/4.0/).
Share and Cite
Kagansky, N.; Levy, Y.; Awar, A.; Derazne, E.; Shilovsky, A.; Kagansky, D.; Chepelev, V.; Mazurez, E.; Stambler, I.; Levtzion-Korach, O. Do Neutrophil–Lymphocyte Ratio and Platelet–Lymphocyte Ratio Need to Be Stratified for Age and Comorbidities in COVID-19 Disease? A Subgroup Analysis of Two Distinct Cohorts over Disease Course. J. Clin. Med. 2024, 13, 605. https://doi.org/10.3390/jcm13020605
Kagansky N, Levy Y, Awar A, Derazne E, Shilovsky A, Kagansky D, Chepelev V, Mazurez E, Stambler I, Levtzion-Korach O. Do Neutrophil–Lymphocyte Ratio and Platelet–Lymphocyte Ratio Need to Be Stratified for Age and Comorbidities in COVID-19 Disease? A Subgroup Analysis of Two Distinct Cohorts over Disease Course. Journal of Clinical Medicine. 2024; 13(2):605. https://doi.org/10.3390/jcm13020605
Chicago/Turabian StyleKagansky, Nadya, Yochai Levy, Anas Awar, Estela Derazne, Alexander Shilovsky, Dana Kagansky, Victor Chepelev, Evelina Mazurez, Ilia Stambler, and Osnat Levtzion-Korach. 2024. "Do Neutrophil–Lymphocyte Ratio and Platelet–Lymphocyte Ratio Need to Be Stratified for Age and Comorbidities in COVID-19 Disease? A Subgroup Analysis of Two Distinct Cohorts over Disease Course" Journal of Clinical Medicine 13, no. 2: 605. https://doi.org/10.3390/jcm13020605
APA StyleKagansky, N., Levy, Y., Awar, A., Derazne, E., Shilovsky, A., Kagansky, D., Chepelev, V., Mazurez, E., Stambler, I., & Levtzion-Korach, O. (2024). Do Neutrophil–Lymphocyte Ratio and Platelet–Lymphocyte Ratio Need to Be Stratified for Age and Comorbidities in COVID-19 Disease? A Subgroup Analysis of Two Distinct Cohorts over Disease Course. Journal of Clinical Medicine, 13(2), 605. https://doi.org/10.3390/jcm13020605