1. Introduction
Citrus fruits are an agricultural product of high demand in international markets since they correspond to raw materials, for the production of juices, canned products, and dry products. Valencia orange (
Citrus sinensis) is the most cultivated sweet orange variety in subtropical regions, with a production of 85% of the global market, approximately. Brazil, United States of America, Mexico, India, and China are the main producing countries [
1]. In the case of Colombia, 8.6 million hectares of land are dedicated to agricultural production, and almost 1.16% corresponds to citrus crops, which are located in the central region integrated by Tolima, Eje Cafetero, Santander, Huila, and Antioquia [
2]. The cultivation of this fruit has become of vital importance for the economic development of these regions in Colombia.
Citrus fruits vary its physico–chemical properties, geometric characteristics, flavor, and coloration, during the post-harvesting stage. These changes can imply affectations in the quality requirements, as a commercial product. Other characteristics like the fruit shape are considered to be a crucial feature of the postharvest process, since several conditions depend on this parameter; i.e., cooling [
3], convective drying [
4], short- and long-term storage [
5], and selective harvesting by mechanical vibrations [
6,
7,
8].
There are different techniques to reproduce the shape of real fruits using computer-aided modeling or image-processing, which are the most common computational tool applied for several purposes that require fruits as 3D objects [
9,
10,
11]. In the case of the geometric characterization through parametric analytical models, most fruits present geometric complexities that are very difficult to reproduce [
12,
13]. Especially in oranges, notwithstanding the absence of an accurate geometric model, if these are well-applied, these could replace computer scanning techniques that require sophisticated equipment [
14,
15]. However, to overcome this limitation, mathematical approximations based on spheres, ellipses, cylinders, and combinations are used as the basis for the geometrical description of fruits [
12,
16,
17,
18,
19]. In some cases, these models can be applied; nevertheless, these are not very useful to characterize mechanical properties, due to the physical dependencies with the geometry [
8,
12,
13].
Several fruit models (computer-aided design) were developed for the determination of mechanical properties, using computational tools and experiments. For example, Dintwa et al. [
20] proposed the construction of a half fruit for determining the viscosity through finite element analysis (FEA) and experimental fruit collisions. First, the authors obtained a sketch drawn of the fruit image processing program, to analyze the dynamic process of the collision of apple fruit, in which the results showed the importance of the geometry. Tinoco et al. [
7] modeled the topology of coffee fruits employing image processing and Bézier’s curves. The authors determined Young’s modulus for different ripening stages, to assess the vibration modes by FEA. The authors indicated that geometric characteristics should be taken into account to estimate mechanical properties like elasticity, viscosity, damping, firmness indices, etc. Other studies showed that it is possible to make simplifications that do not affect the results significantly. For instance, Gharaghani et al. [
19] simplified the geometry of an orange fruit to classify the ripening stage with finite element simulations. Natural frequencies showed that the resonance values were much higher in unripe oranges than the ripe ones. These results could be used as an automatic natural frequency monitoring system, as the authors suggested in their study. In other approaches, Rusinkiewicz [
21] and Torppa et al. [
22] practiced different approaches to model agricultural products that mainly include simplified geometric models. Gielis [
23] developed a super-form formula to characterize a variety of natural shapes (plants) in a single geometric frame, with six parameters. Li et al. [
13] developed a mathematical model to describe the geometry of tomatoes. The study mentions that it is a practical tool for characterizing the shapes of tomato and size variations related to the mass.
As reported by the cited studies, it demonstrates that the computational modeling of fruits and vegetables is a window to characterize physical properties and develop agricultural technology through several simulation tools. The objective of this study was to represent and discuss the development of a CAD (computer-aided design)-based geometric model of Valencia orange (Citrus sinensis L.), considering four ripening stages. The methodology is based on approximating through Bézier curve profiles obtained from an imaging technique to be modeled in CAD software. The parametric model correlates the topology of the orange (grown in Colombia), with its orthogonal dimensions, for the reconstruction of a 3D model.
2. Geometric Model Based on Bézier Curves
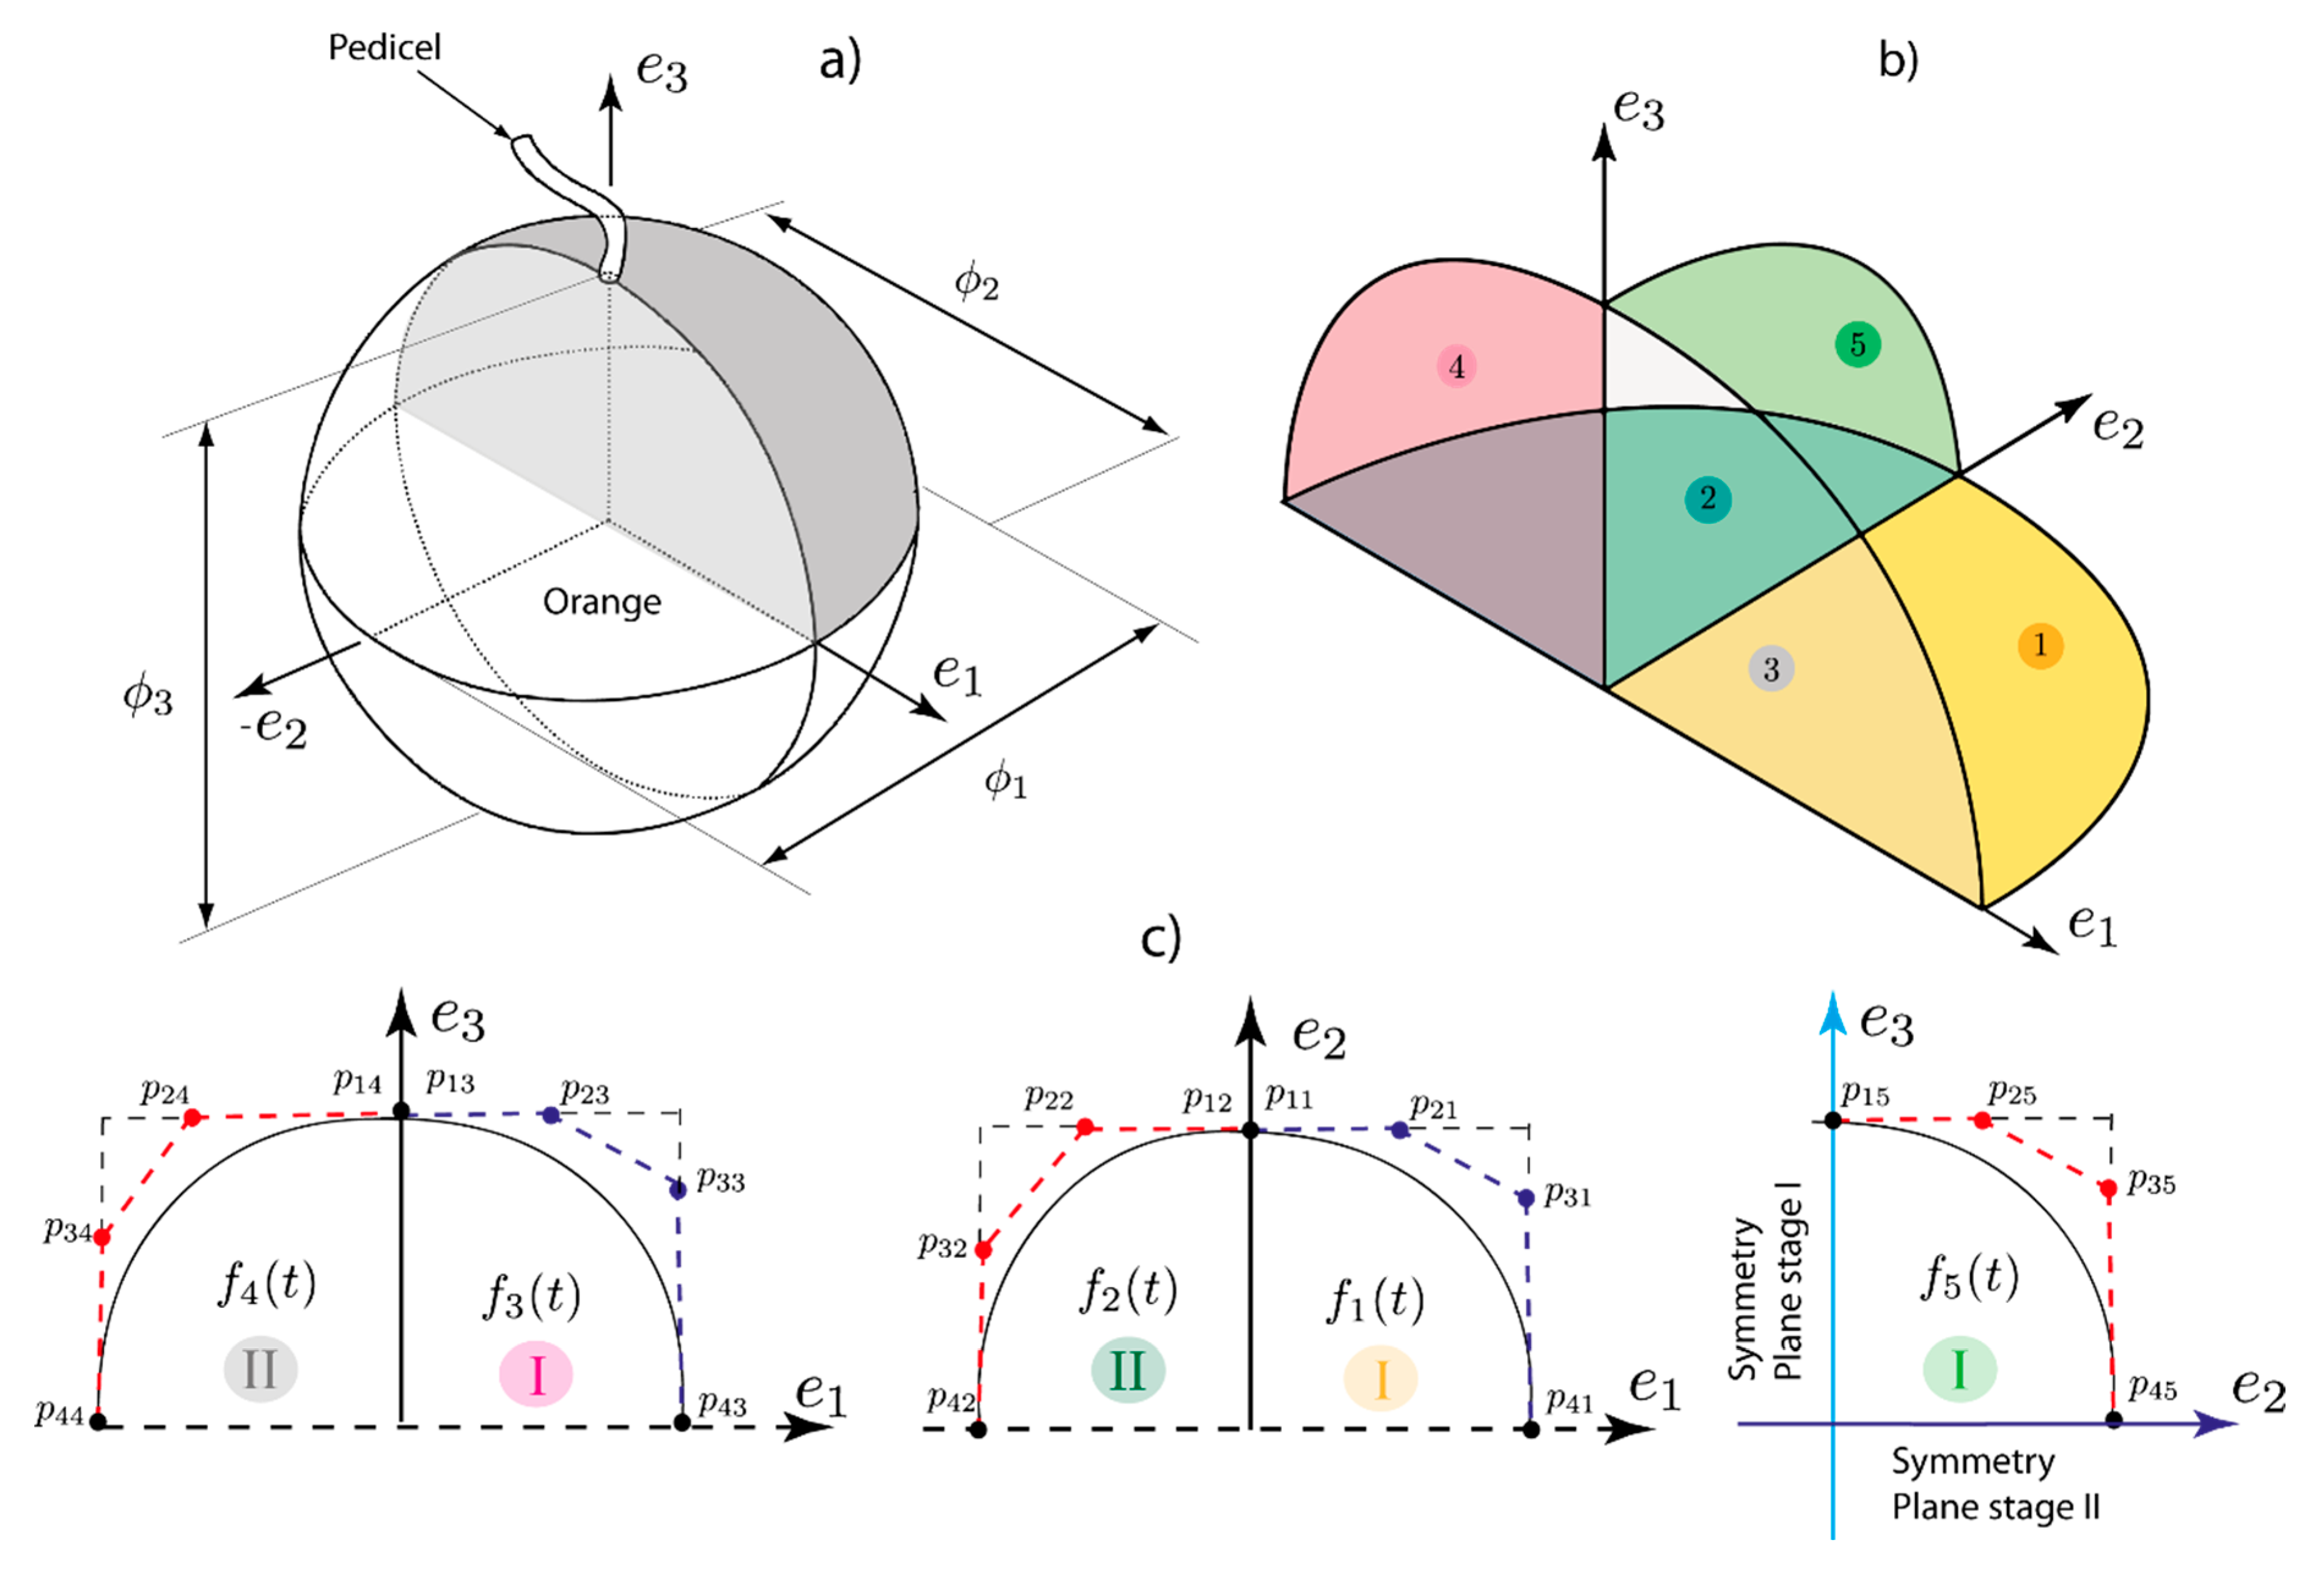
To represent the geometry of the orange, let us assume its structure in a specific orientation, as is shown in
Figure 1a. In the simplified geometry of the fruit–peduncle system, unitary vectors denoted by the directions
,
, and
define the fruit topologically. Where
(highest dimension) and
are the equatorial diameters, such that
, and
is the polar dimension of the fruit. The directions
coincide with a coordinate system
,
, and
, which is orthogonal by definition.
It was assumed that one-fourth of the fruit was limited by five sets of functions
established at the planes
, as observed in
Figure 1b,c. Each set of functions
represent Bézier cubic curves that were constructed with the points of control
,
,
, and
, established in each plane
. Knowing that a Bézier cubic curve [
24] is represented commonly as
, a set of functions could be organized in such a way that the curves that describe the form of each fourth were delimited within the following set
where
and
. Each fourth of the fruit was assumed to be symmetric, with respect to the symmetry planes (two planes) that define the final shape.
The explanation of the symmetry planes is discussed in the posterior sections. For Equation (1), vectors
and
are a set from the formulation of Bézier curves by
where
and
are the coordinates of the control points. For Equations (1) and (2), the matrix
is defined as follows:
To design the orange geometry,
each orange fourth
should be well-defined. However, it is not necessary to build all fourth, i.e., one by one, since the oranges present two symmetry planes, as described in
Figure 1c and
Figure 2. Both symmetry planes are co-linear with the highest equatorial dimension
(oriented in
). These planes were set from an experimental exploratory analysis, performed with the dimension assessment and the application of CAD tools. To explain the geometrical construction process in detail, first, we developed the fruit in three stages; the first one (green shell) was related to the construction of the first four, obtained with the implementation of five Bézier curves. Then in the second one (dark green shell), the fourth was reflected on the symmetry plane
. In this way, half an orange “shell” was constructed. In the final stage (purple shell), half orange was replicated on another plane
, and with these procedures, an underlying topology of the fruit was designed, as detailed in
Figure 2.
We define two procedures to draw an orange as a 3D CAD-based model; one is founded in a basic topology (stage I), and the other is conformed on a geometry with a more elaborated topological base (stage I, complex topology), as illustrated in
Figure 2. These supplementary procedures improve the approximation of the geometry since six new curves (secondary profiles) were added to the first stage. These curves approximate the curvature at planes located to different heights in the polar direction.
3. Geometric Relations and the Ripening Classification of Valencia Orange
Simply viewed, the geometry of any rounded fruit might seem to be an irregular shape. However, the first impression could be misleading when mathematics represent complex geometries, as demonstrated by different studies [
23,
25,
26]. To show and convey these ideas, Tinoco and Peña [
8] established a relation between orthogonal diameters of coffee fruits (
Coffea arabica L. var.
Colombia), which demonstrated that rounded fruits grow systematically keeping its shape constant, through its diameters. An equation was expressed in general terms as a size factor, as follows:
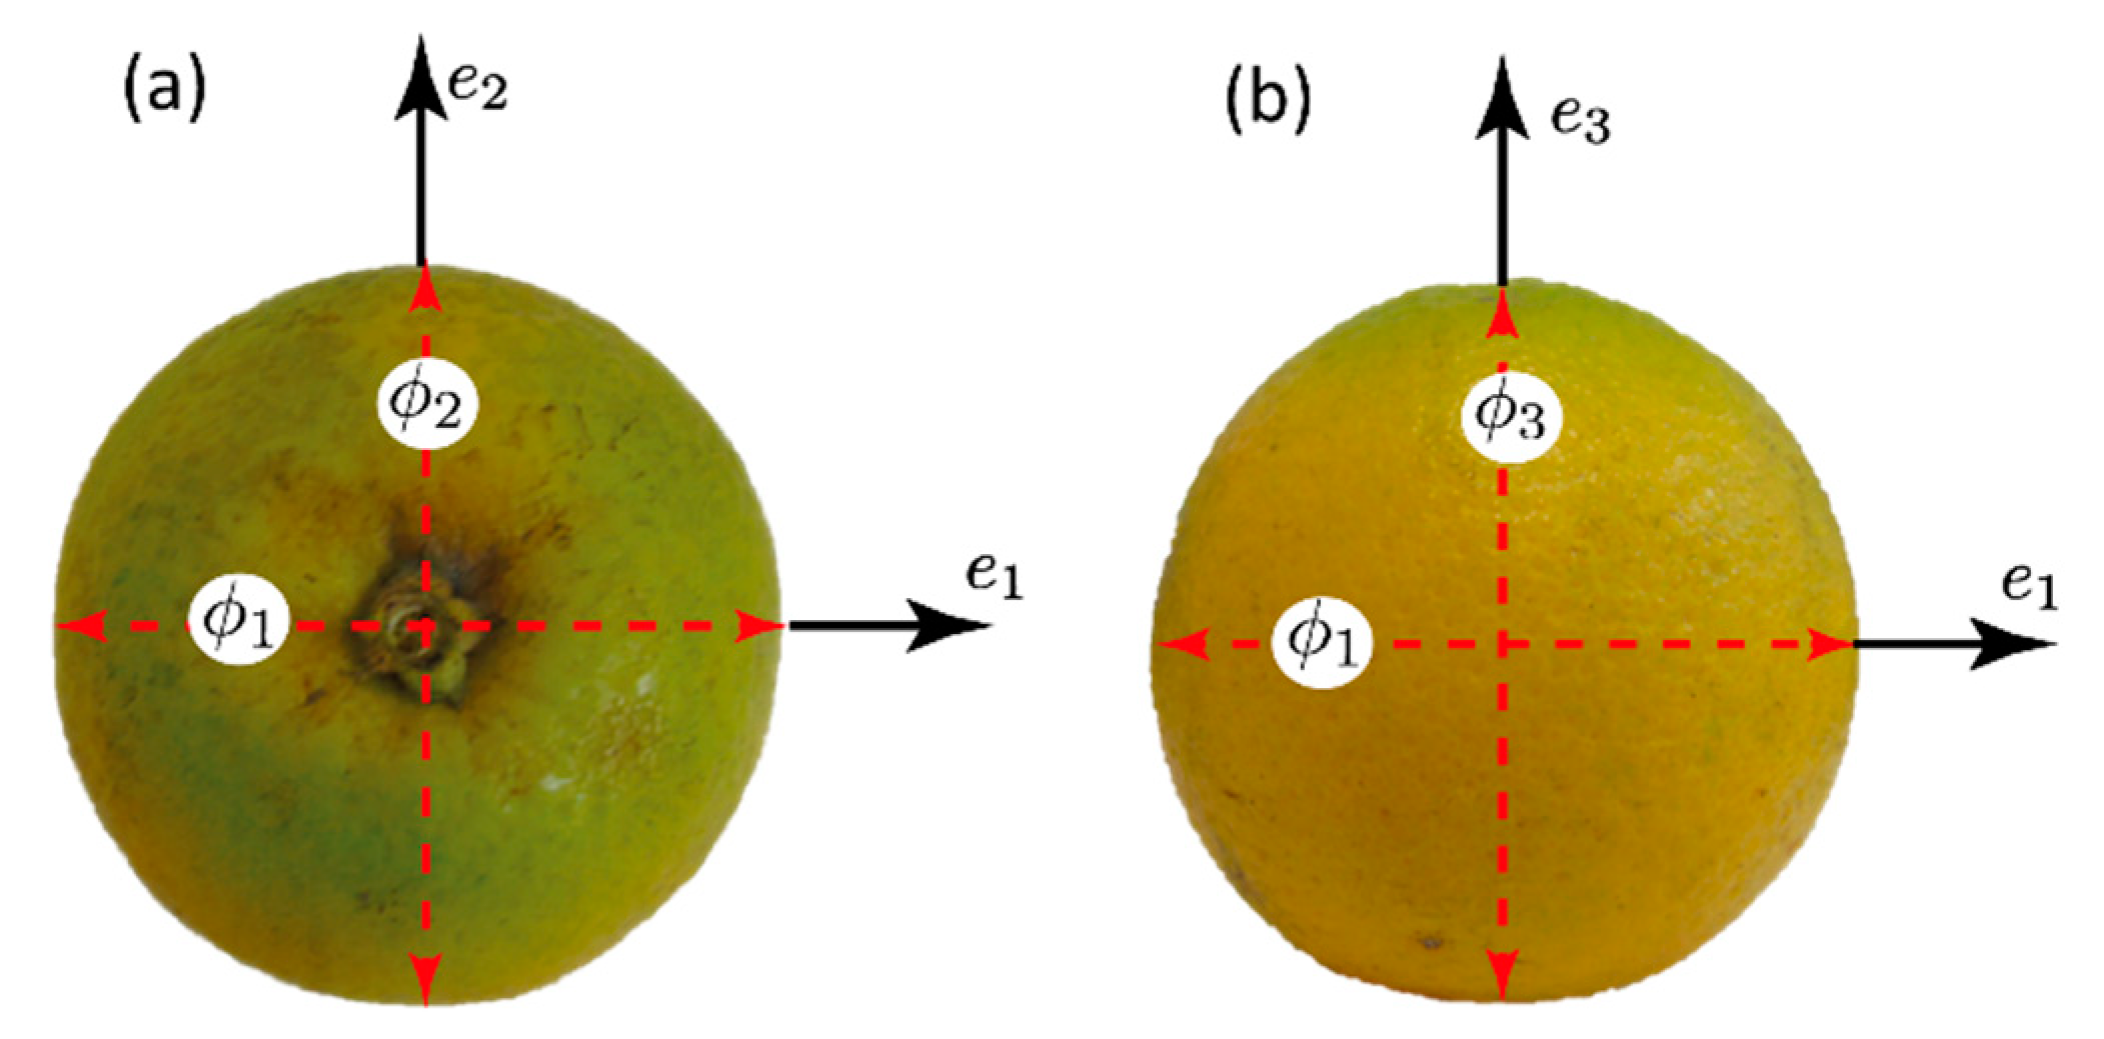
where
is a constant for any ripening stage. In the case of the orange;
,
, and
correspond to the dimensions illustrated in
Figure 3. In general terms, Equation (5) represents the contributions in diameters through a growth ratio. Tinoco and Peña [
8] showed that the relation is constant, independent of the ripening stage of the coffee fruit.
In a practical application, Equation (5) is used to predict the geometric dimensions using
as an input parameter, which permits the parametrization of the geometry of the orange. From experimental data, the ratio between the equatorial dimensions (
,
and
) kept harmonic relations that evidence a constant process of growing; this is demonstrated in the results posteriorly. Therefore, as a complement of Equation (5); the following expression is proposed, as follows:
Using Equations (5) and (6), it is possible to predict the diameters
and
, in the following way
Equation (7) shows that there is dependence among the orthogonal diameters, since and could be estimated using . To verify this hypothesis, Valencia oranges (Citrus sinensis) cultivated at the Caldas state (Colombia) were taken as analysis units, and standard rules were established to classify those in ripening categories.
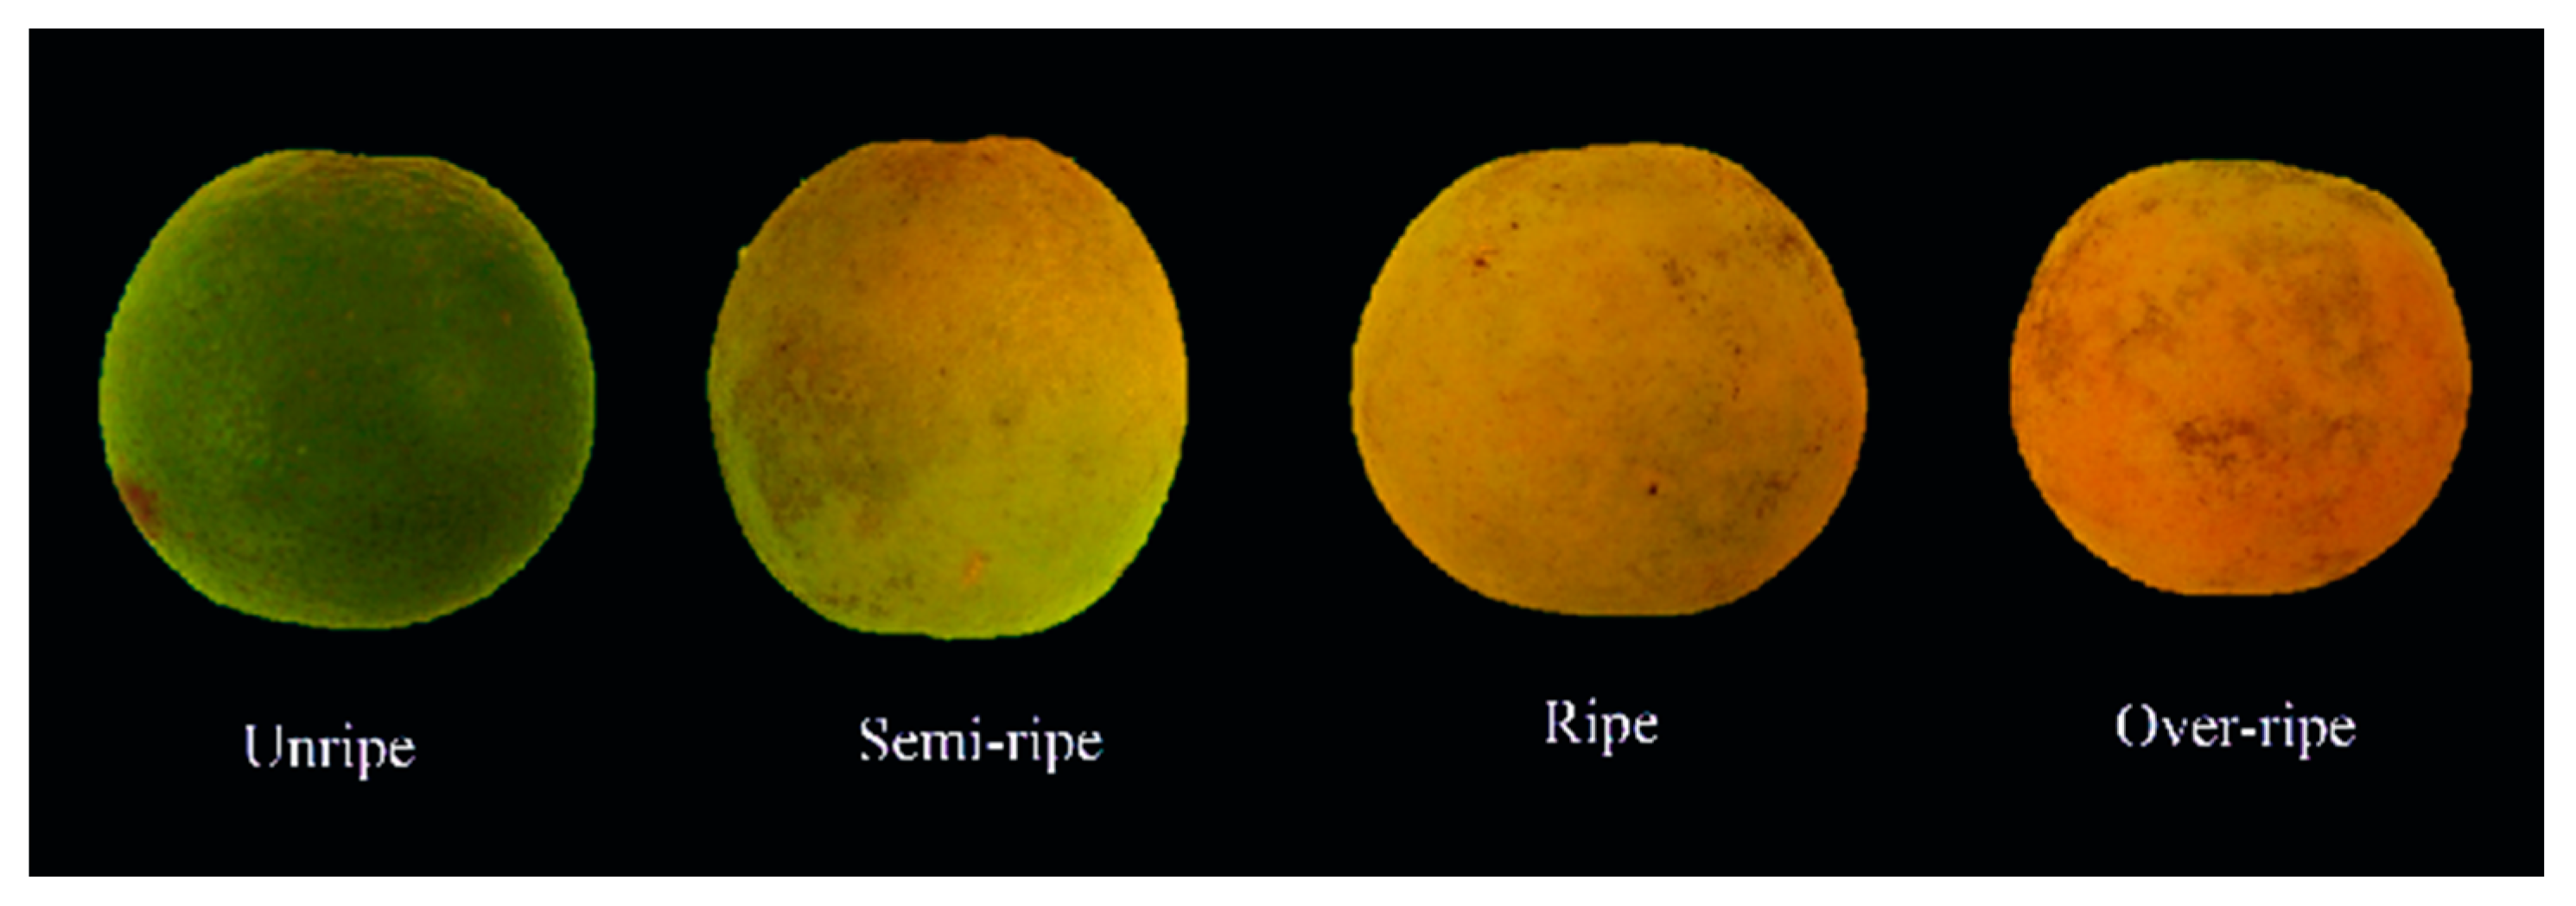
Figure 4 shows the chosen ripening states that were based on the NTC 4086 (Colombian technical standard), which established the colors that a Valencia orange (grown to more than 900 meters above sea level) could have in the several ripening stages. For this research, the classification was categorized as an unripe, semi-mature, ripe, and over-ripe fruit. A detailed description of the color definition is described in
Table 1, which mentions the characteristics of each category represented in
Figure 4. As a complementary procedure to the color classification, the Brix degrees were determined to complement the classification process, as listed in
Table 1. Brix degrees were measured with a traditional handheld refractometer (Hanna instruments), calibrated with distilled water, to a constant temperature of 27 °C [
27]. This additional parameter was taken into account for the selection of the analysis samples (orange fruits), which meant that two conditions were satisfied in each categorization (color and Brix degrees) to assign a ripening state and to proceed in the measuring dimensions. The Brix values correspond to the amount reported by other studies done with oranges [
28,
29,
30]. Two selection factors were considered because the color is a dependent parameter of the solar exposition. Therefore, this influence was minimized by the accomplishment of the two features.
4. Methodology for Constructing a CAD-Based Geometric Model of a Valencia Orange
Several CAD-based 3D modeling techniques have been developed for different applications, among which we can mention building reconstruction [
31], CAD/CAM [
32], robotics [
33], etc. The most popular methods are those based on images since it is possible to design a 3D model from different directions and profiles of the image, including the restrictions that impose the geometry complexity. In our approach, we propose a method based on three images that are intersected to define the main profiles of an orange fruit. The first step is to orient the orange in its main directions (explained in
Section 2), after identifying its ripening stage. The second procedure consists in the creation of a scaled image into the CAD software using photographs of the fruit over a millimeter sheet. SOLIDWORKS was used as CAD software in our case.
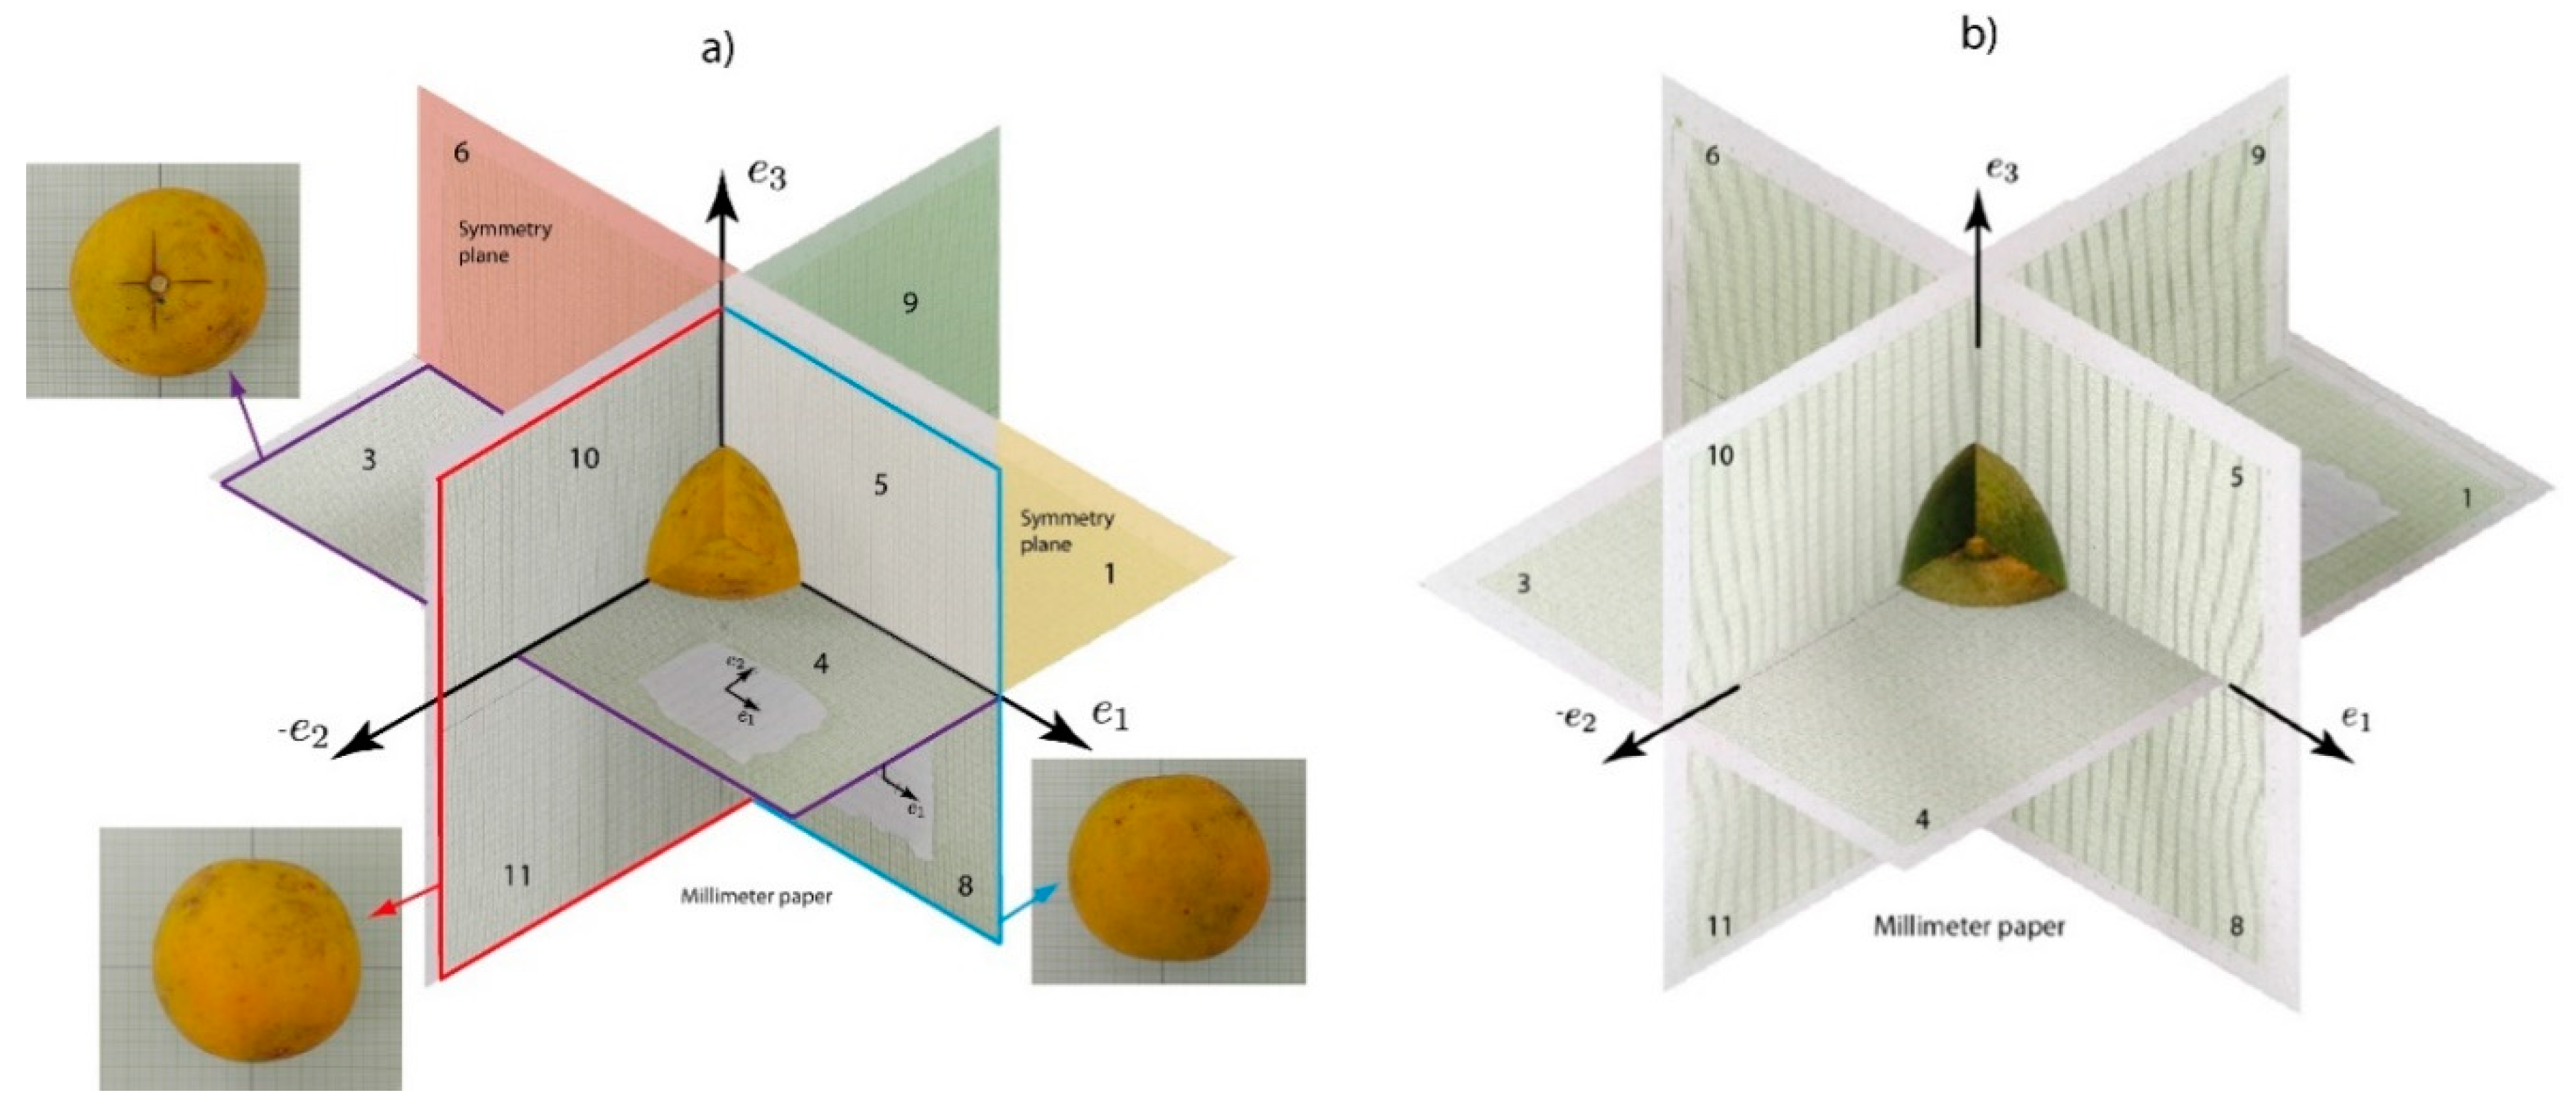
In the third step, an aligning process is carried out with the images, to join the common points among these.
Figure 5 illustrates two examples; in
Figure 5a is shown a ripe fruit in which the projected images are aligned; the symmetry planes and the enumeration of each fourth are labeled on the photos. Additionally, the unripe fruit is represented in
Figure 5b. The above was performed to obtain the exact silhouette of the fruit topology that permit a 3D reconstruction applying computational design operations focused on solids.
As explained in
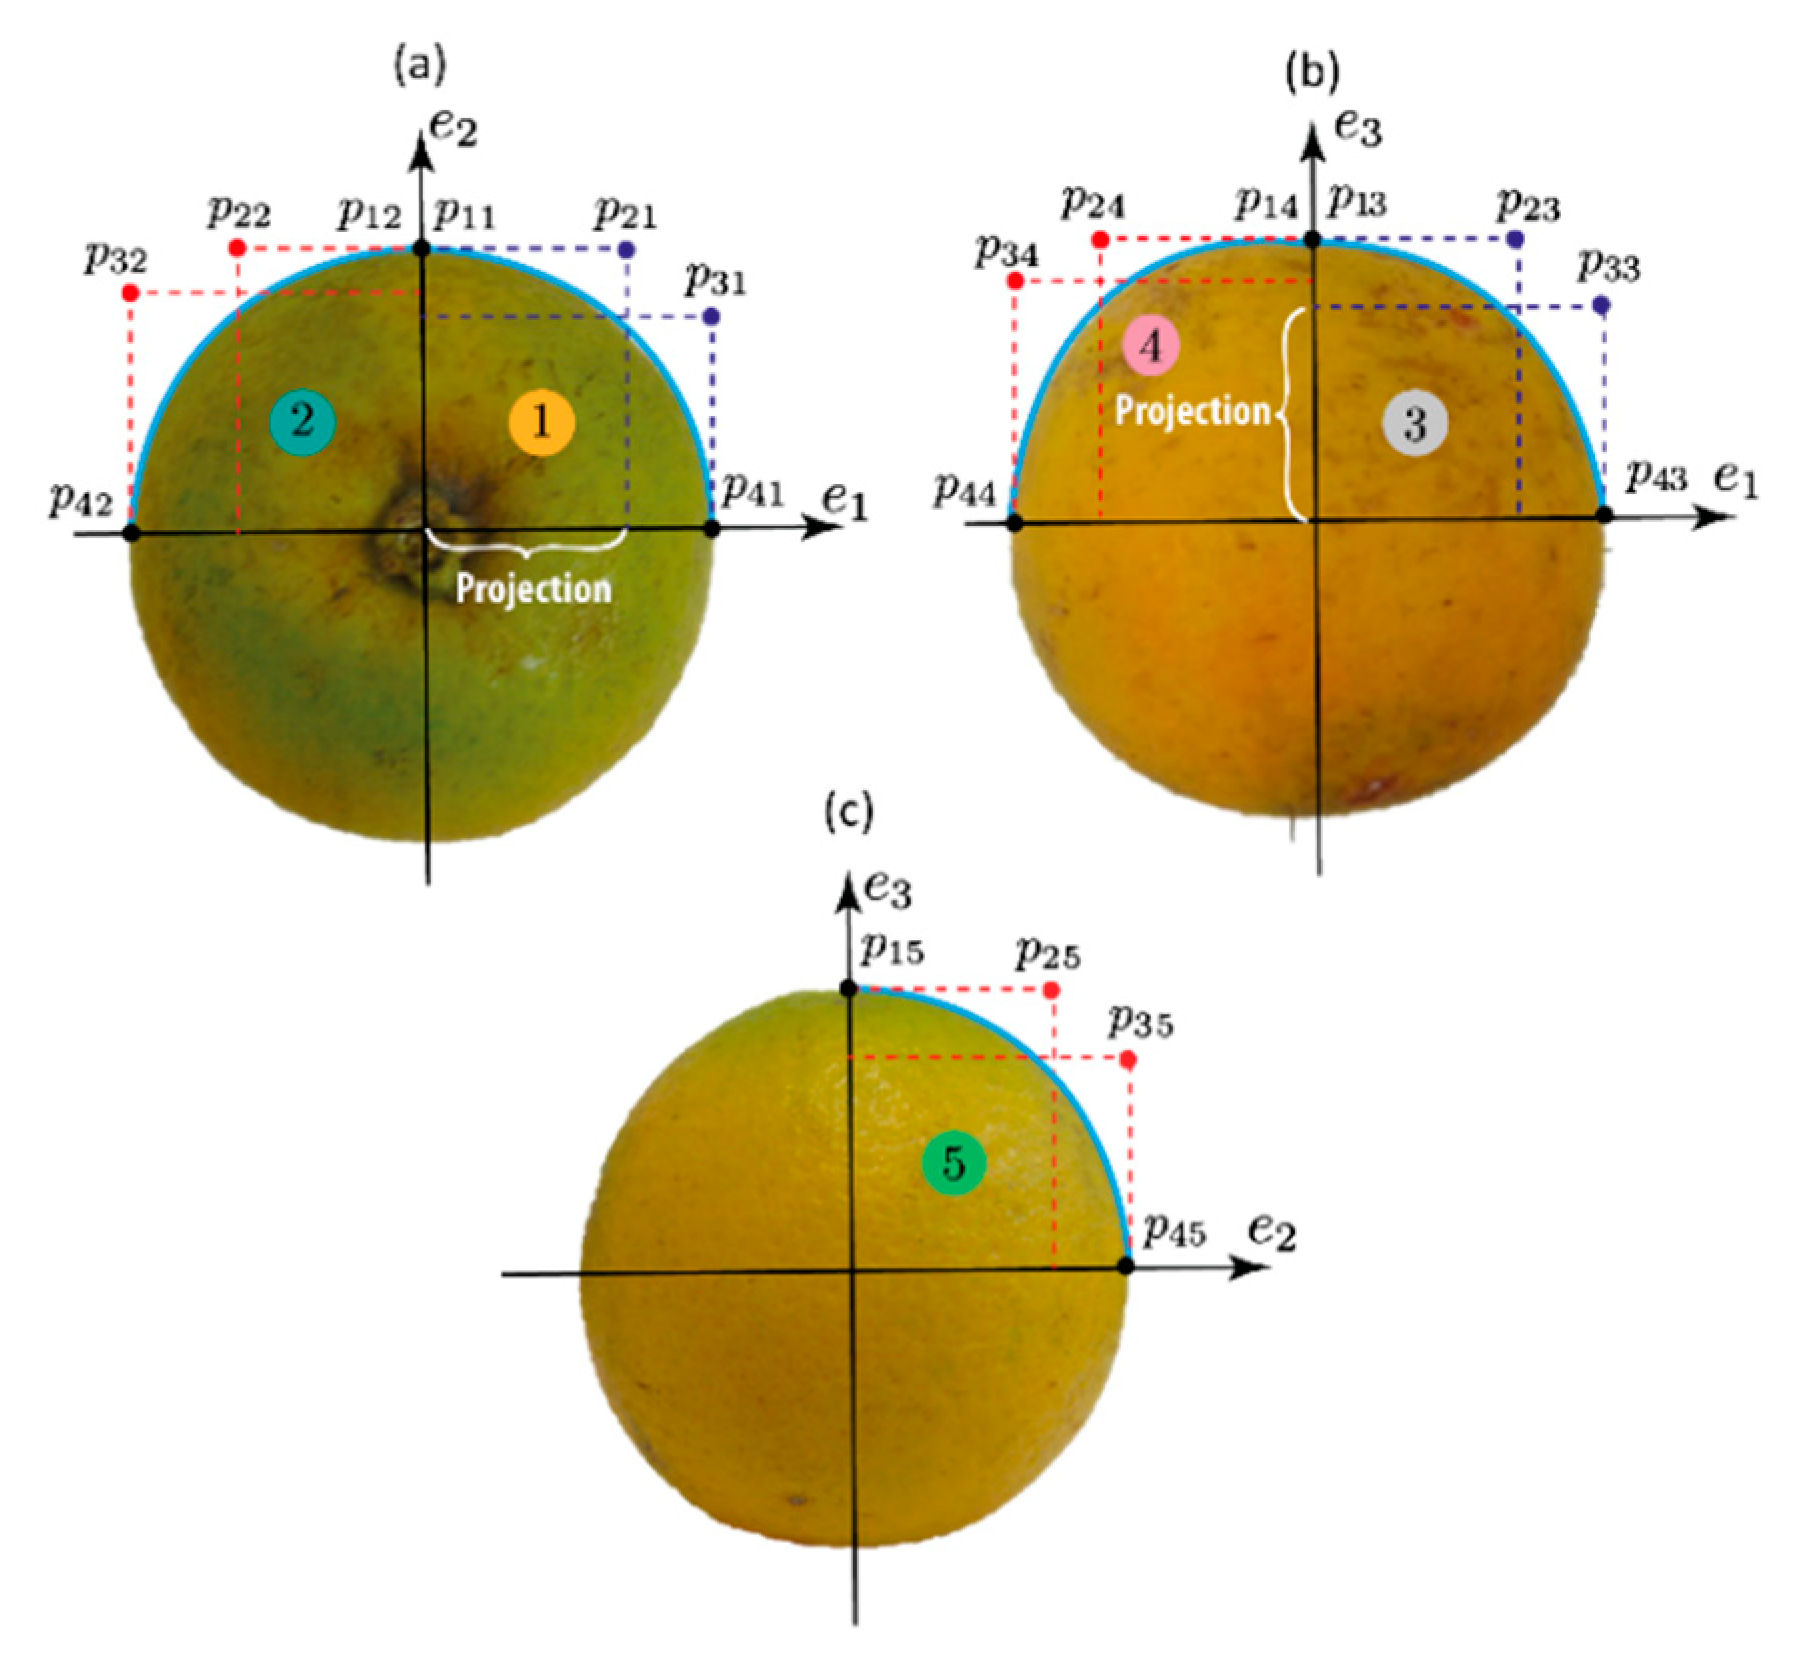
Section 2 in a generalized procedure, five Bézier profiles are necessary to reproduce the whole orange in a 3D model, using the symmetry planes of the fruit. As a practical example,
Figure 6 is considered; five profiles that describe one-fourth of each principal plane are shown. Each curve was established with four control points
where
correspond with the points, and
relate each profile. The control points
and
were known, since these were located in the half of each principal orthogonal diameter. The other two points (
and
) were adjusted according to the shape. These correspond to each projection over the orthogonal principal axes, as illustrated in
Figure 6a,b. It was noted that the coordinates represent each point
, for instance, in
Figure 6a,
coordinates were
For the point
, the coordinates were established by
In total, six unknown coordinates should be determined. This process minimized a significant number of parameters if the symmetry planes would not have been identified. The main advantage of this methodology is that the orange can be constructed systematically since the operations could be programmed. Nonetheless, this methodology presented some limitations, i.e. the information determined by the photos requires that the images should be selected carefully to guarantee good results. Finally, we want to remark that after all parameters were determined, a CAD tool (SOLIDWORKS in our case) was used to model the orange as a 3D model.
5. Results and Discussion
In this section, we discussed the results obtained with the proposed procedures in
Section 2,
Section 3 and
Section 4. Therefore, experiments with oranges were conducted, which were provided by the Asociación de Citricultores de Caldas [
34], an entity that associates different farms dedicated to citric production.
To apply the methodology explained in
Section 3 and
Section 4; two sets of data were collected with the following characteristics—four groups with 15 oranges in each ripening stage (sixty oranges in total) were randomly selected and classified in each group. In the first group, orthogonal dimensions were measured to compute the
and
values, with Equations (5) and (6), which are listed in
Table 2.
It was observed that the mean value
was 1.98, with standard deviations very low, around 0.0425. As mentioned above, Equation (5) was a constant representation of a size factor that fruits hold steady in the growing. Reference [
8] calculated this value for coffee fruits obtaining
, which demonstrated that this parameter is a geometric feature of the rounded fruits. It meant that the geometric relations of its orthogonal diameters showed a scaled version of the fruit conserving the shape of any ripening stage. Additionally, it was noted that
was 0.97. It meant that geometric relations of its orthogonal diameters present additional intrinsic characteristics of the fruits that can be represented in the factors
and
. The values demonstrate that the orange conserves its shape (scaled version) in any ripening stage. The results evidence that from a topological point of view, the coffee fruit preserves the form as an orange, which means that it will be possible to get the shape of a coffee fruit from an orange, if and only if some geometrical transformations would be done. A detailed illustration of the above idea was discussed in the work done by Ling et al. [
35].
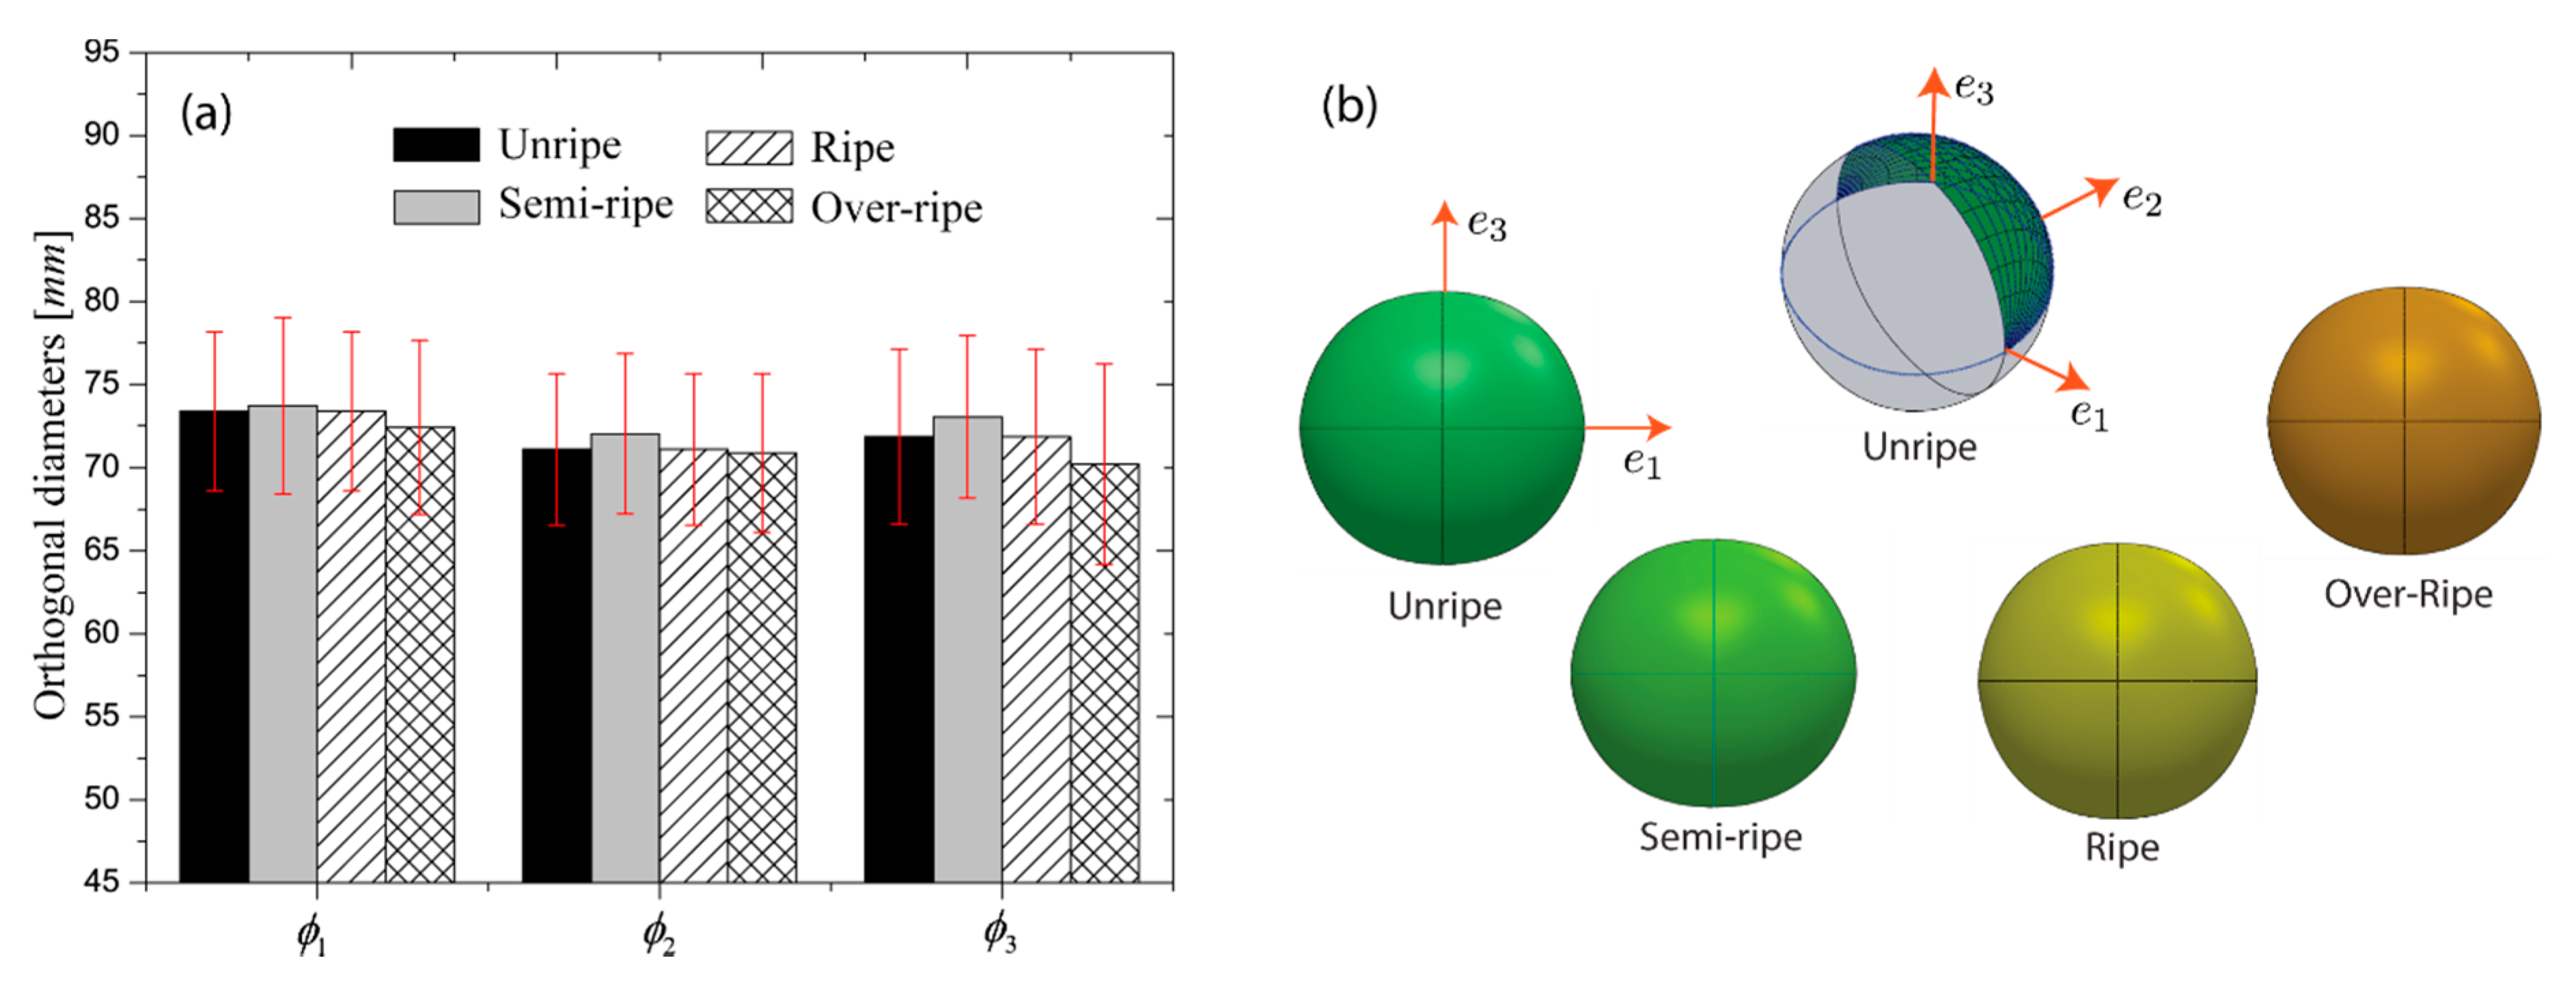
From the experimental tests, the results of the measured dimensions of the orange are presented in
Figure 7a in a bar graph; these correspond with the dataset listed in
Table 3 (second group set of 15 oranges by each ripening). In
Figure 7a, it is denoted that the orthogonal dimensions vary slightly among these, but its standard deviations conserve the amplitude, which shows homogeneity in the measured dimensional variable. Additionally, in
Table 3, the predicted values using
as input parameters and Equation (7) as a predictor, are shown. Reasonably, the determined values for
and
were predicted with errors lower than 1% (for
) and 2% (for
).
The result probes that Equations (7) could be used to perform predictions of the dimensions between the ripening stages. For example, when
the predictions were
and
with this information, a 3D model was generated from the construction of the Bézier profiles. Complementary to
Table 3, it is important to mention that each Bézier profile required 4 points to be established. Two of these values (
and
at the plane
) correspond with the orthogonal dimensions (
) and the other two (
and
at the plane
) represent the projections on
, and
, these are shown in
Table 4. According to the values reported, it was observed that one set of
values represented all ripening stages.
More details are observed in
Table 3; it can be seen that comparing the dimensions among ripening stages, these decrease from the unripe. This represents a variation from the unripe until ripe of 3.3% on
, and 3.2% on
. It meant that the orange reduced its size during the ripening process. All geometrical and physical aspects are not discussed in the paper since the main focus was to reproduce the geometry of the orange with accuracy in a CAD tool.
Figure 7b shows the models designed and reconstructed in SOLIDWORKS (scaled models), using the profiles created with Bézier curves from the intersection of the orthogonal images as a base, as detailed in
Section 2 and
Section 4. Four fruits are illustrated, since these correspond with each established ripening stage, respectively. The CAD models represent a Valencia orange (
Citrus sinensis) in its geometry; an unripe orange is represented in the central part of the image. This is depicted with a high density of profiles that were created to improve the 3D shape. This was also done for the other models. This additional process guaranteed a better accuracy in the surface reconstruction of the first quarter of an orange, which defined the first step of the 3D modeling, as explained in
Section 2.
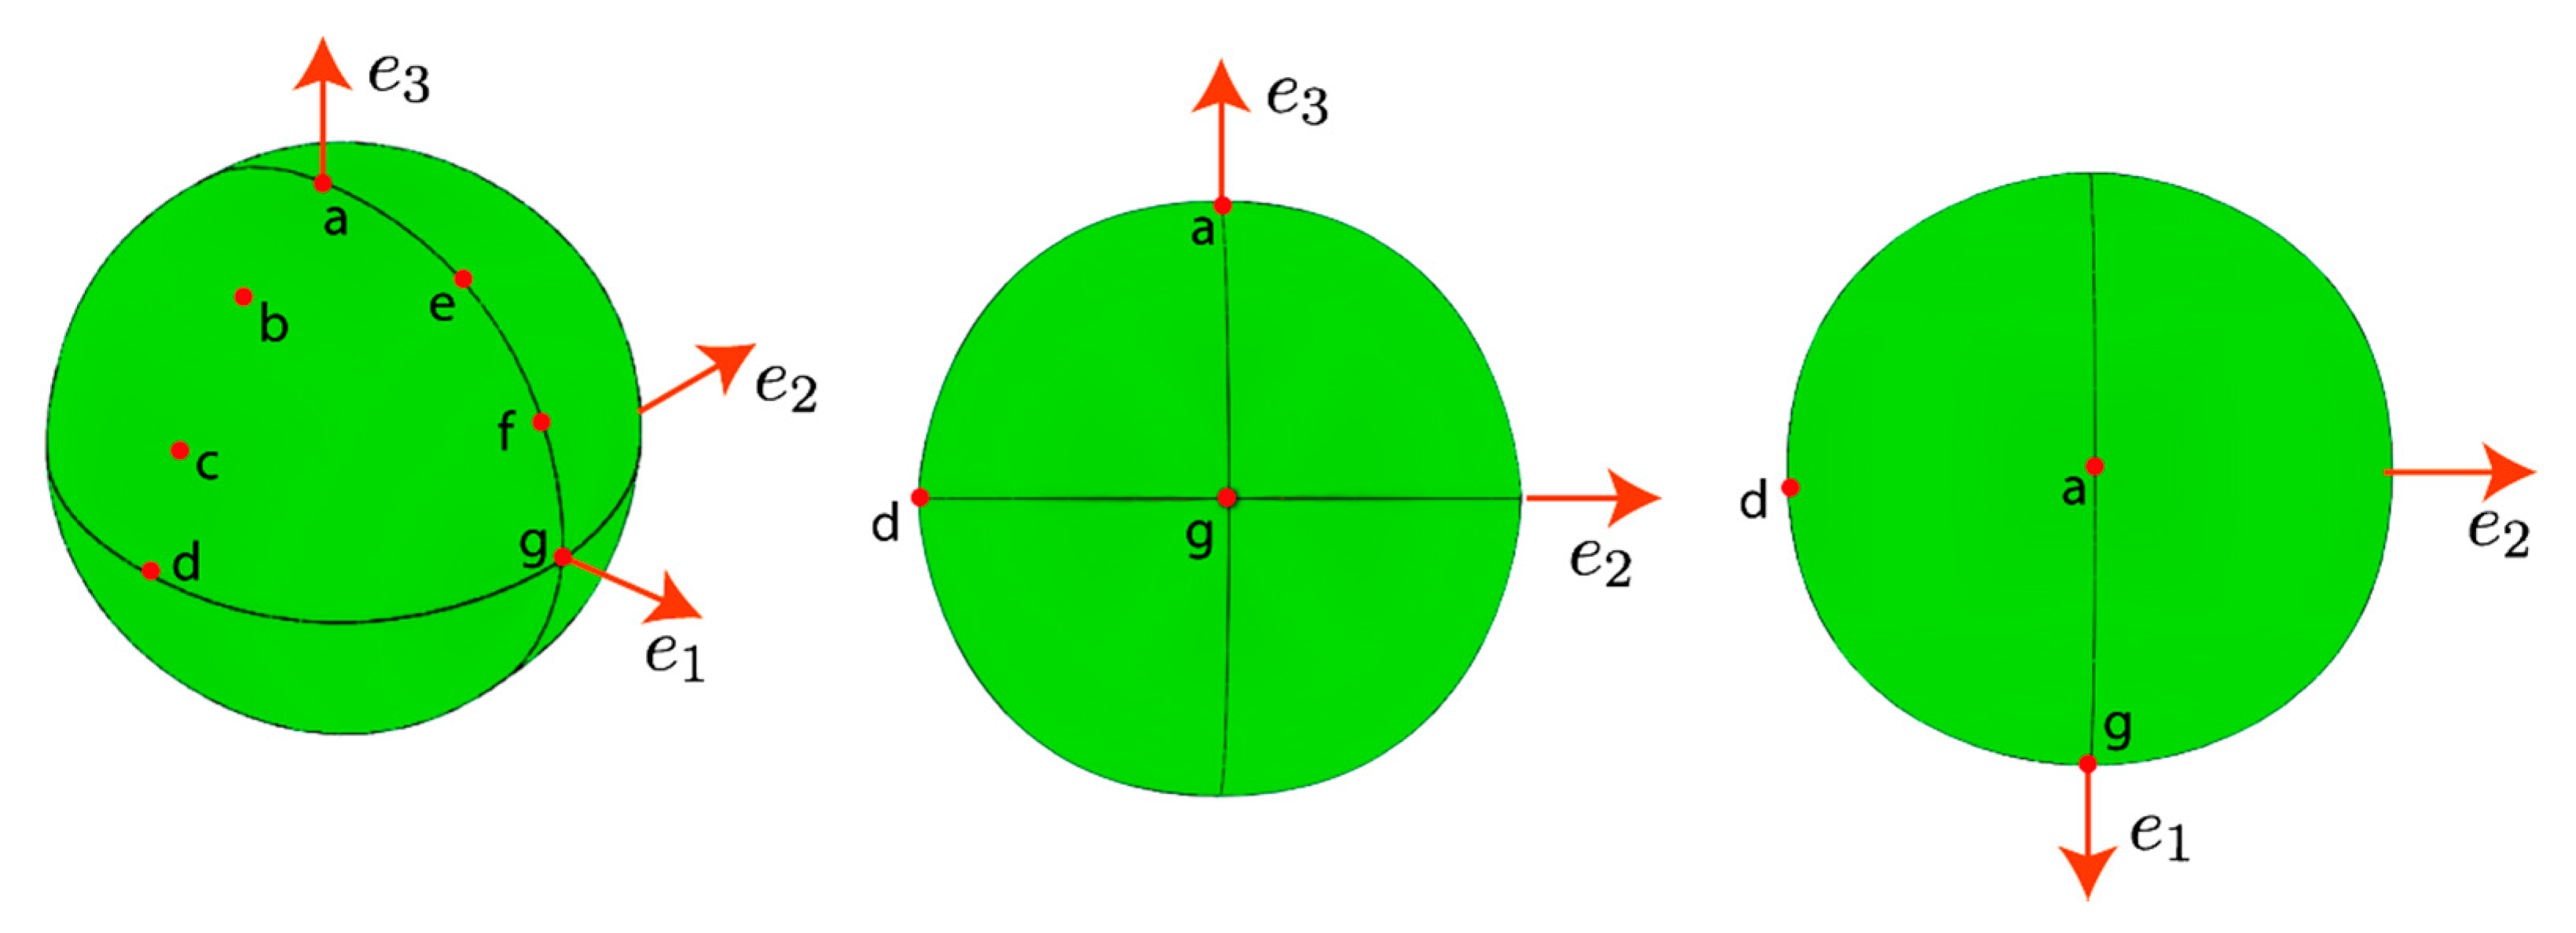
In order to identify some differences in the reconstructed geometries, different points were marked to evaluate the radius of curvatures, as depicted in
Figure 8. The points provide information on the local shape of the profiles selected at the planes
and
. Theses were marked as red points and denoted by letters from “a” until “g”. To follow an order, the marked points “a” and “d” coincided with the direction
and
, and the point “g” matched with direction
as well.
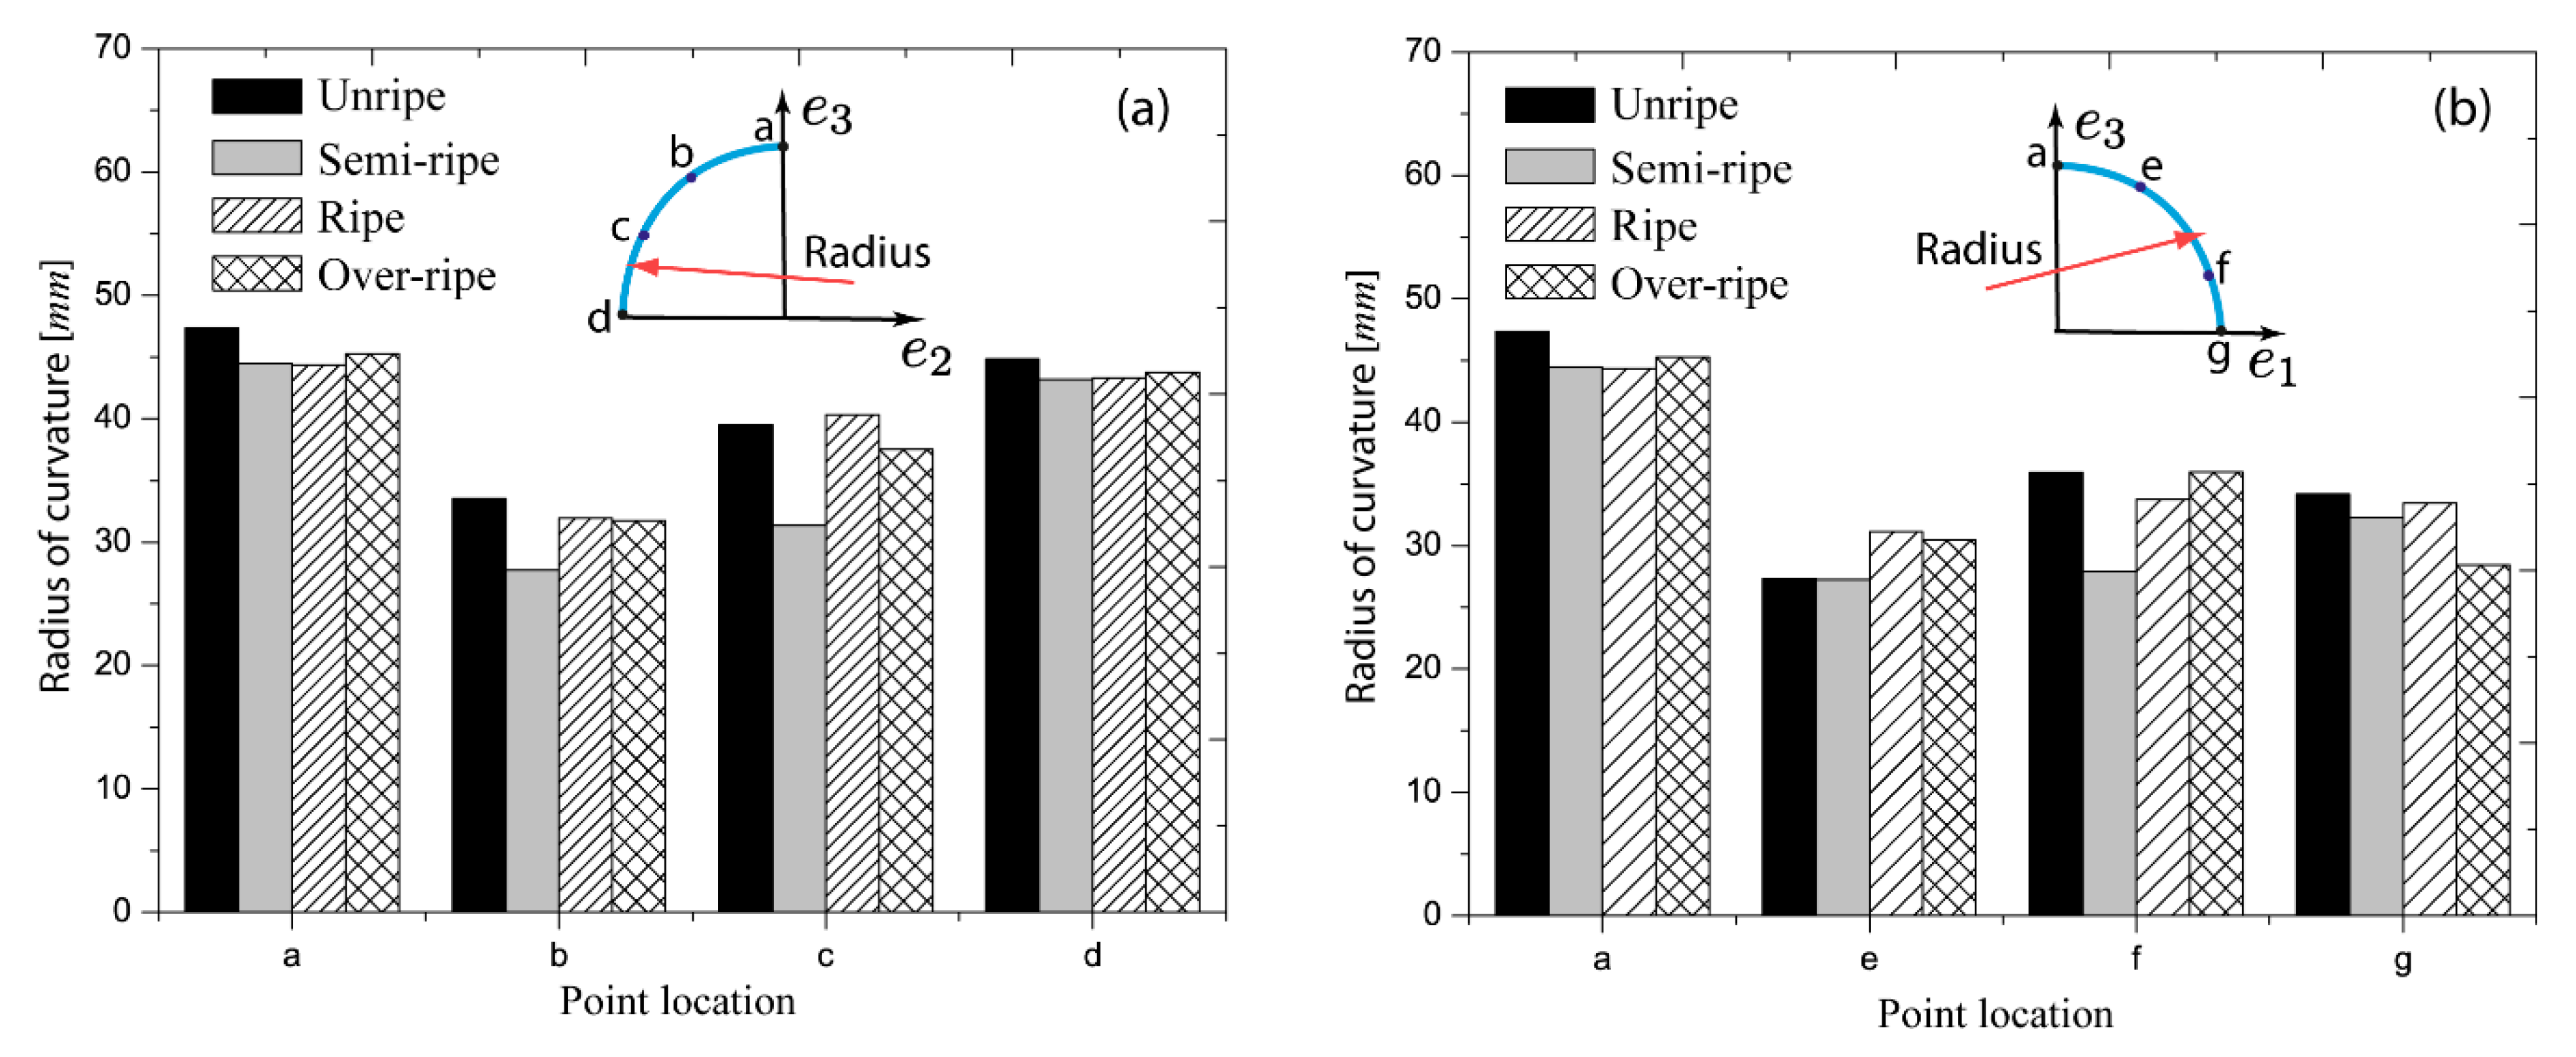
Figure 9 shows the computed values in all demarked points; in
Figure 9a, it can be seen that the unripe fruit presents the highest radius of curvature in the profile
. The radius of curvature decreases in the middle part of the shape; it indicates that the curvatures are more elevated in those locations. The lowest values are registered for the semi-ripe stage. In general terms, small differences can be observed according to the shape, i.e., we see that in the main direction, the orange is less bulged (curvature = 1/radius of curvature) than in the middle part.
Figure 9b indicates that the curvatures are distributed along with the profile in an increasing form. Some differences are highlighted in each ripening stage. The point “g” shows that during the ripening, the orange shrink, which corresponds to the orthogonal dimensions. Point “e” denotes that in the ripening process, the orange inflates the surface concerning the unripe stage. All of the mentioned characteristics demonstrate that the proposed methodology captured the details of the measured oranges. As a final discussion, the comparison between a ripe and unripe orange could be easily identified from the curvatures since unripe fruits had lower curvatures than ripe ones.


