
Agricultural Potential of the EU Countries: How Far Are They from the USA?


Abstract
:1. Introduction
- What is the gap in the agricultural potential between individual EU countries and the USA?
- Which EU countries are able to face the competitive pressure exerted by US agricultural producers being more efficient and benefiting from economies of scale and which ones lose this ability?
2. Materials and Methods
2.1. Data
- The structure of global inputs (to eliminate the impact of the effect of scale on the classification it was decided to use the structure of inputs of production factors rather than their volume):
- The share of land in total inputs (%; input of land calculated as the hypothetical cost of use of land based on its LIBOR interest rates, for the EU countries assuming the euro (EUR) LIBOR, while for the USA the US Dollar LIBOR average interest rates for January 2017);
- the share of labor in total inputs (%; the input of labor calculated as the product of the number of person employed multiplied by the average wage in a given country and the number of work hours per year, assuming the latter at 2120 h);
- the share of intermediate consumption (current assets) in total inputs (%); and
- the share of depreciation (fixed assets) in total inputs (%).
- Ratios between production factors:
- Utilized agricultural area (UAA) per 1 person employed in agriculture (ha);
- value of capital inputs per 1 person employed in agriculture (thousands of euro);
- value of capital inputs per 1 ha UAA (thousands of euro); and
- the ratio of current assets to fixed assets (euro/euro).
- Efficiency of utilization of production factors:
- Land productivity (euro/1 ha UAA);
- labor productivity (euro/1 person employed); and
- productivity of current assets (euro/euro).
2.2. Methods
2.2.1. Agglomerative Procedure
- Selection of characteristics describing the production potential of the agri-food sector in the population of investigated countries;
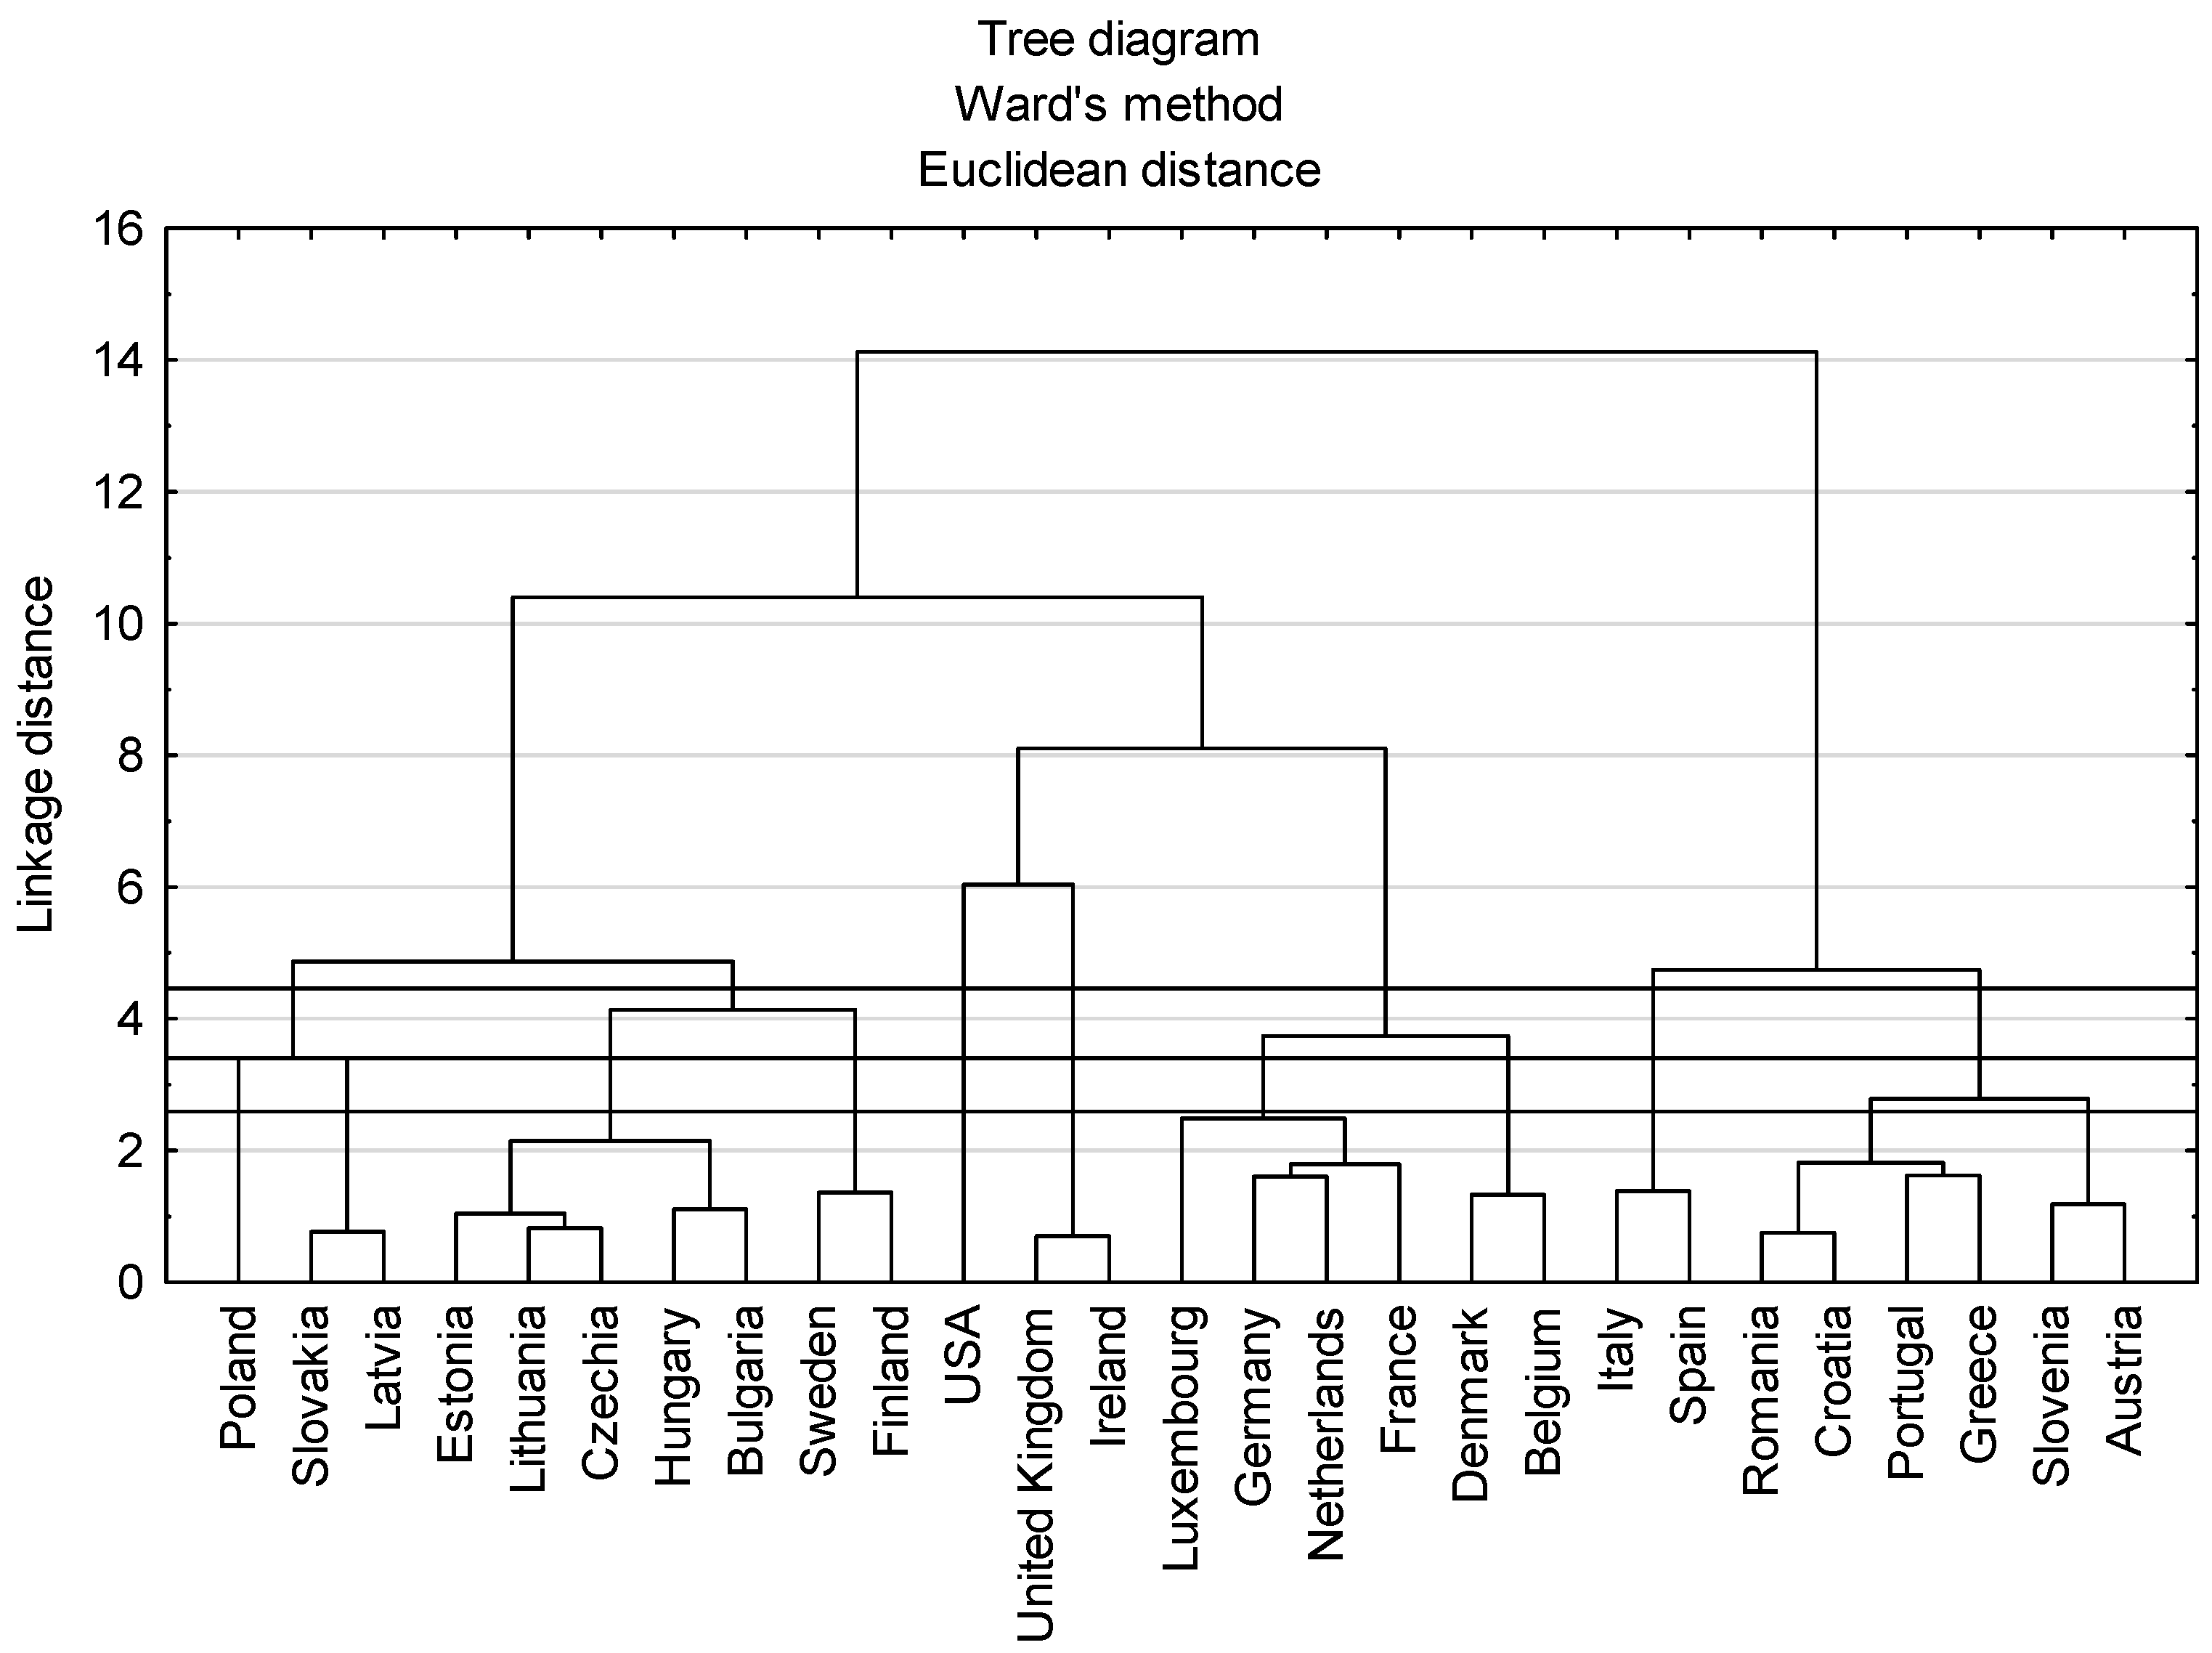
- Classification of analyzed countries using Ward’s method;
- Determination of the optimal division of the population of analyzed countries into respective classes;
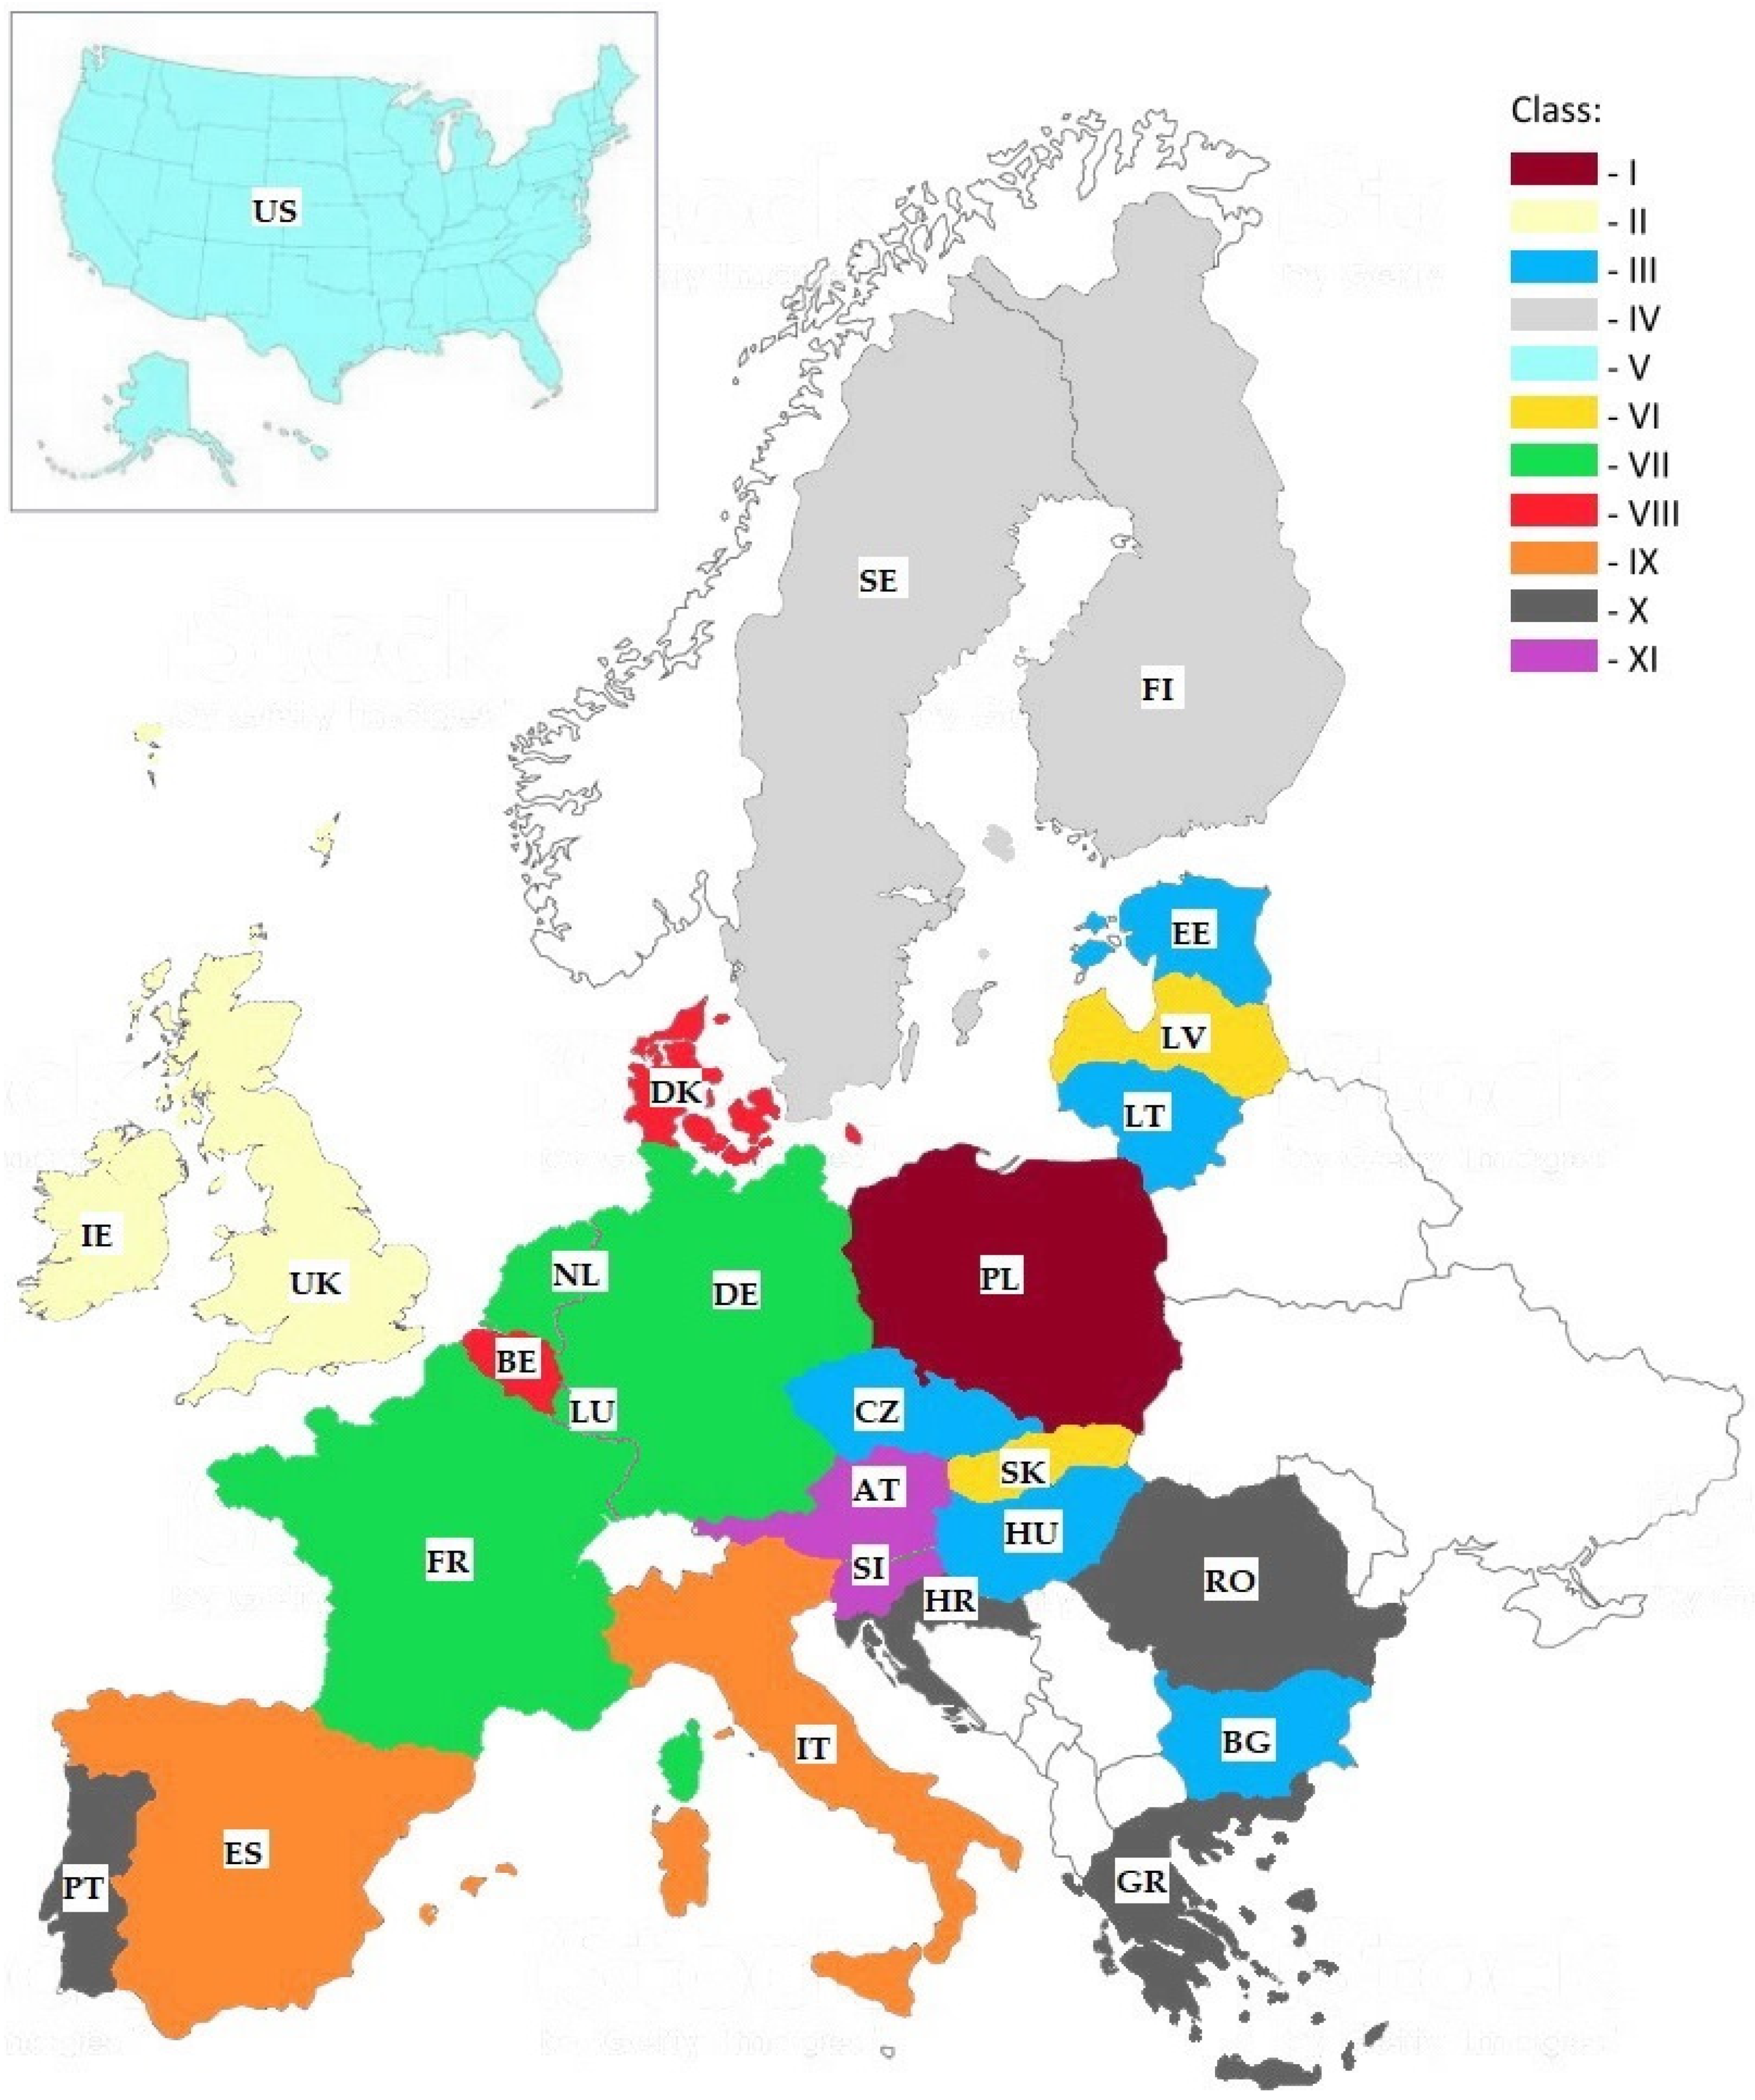
- Identification of characteristic features in the classes and on this basis—identification of types of countries; and
- Description of types.
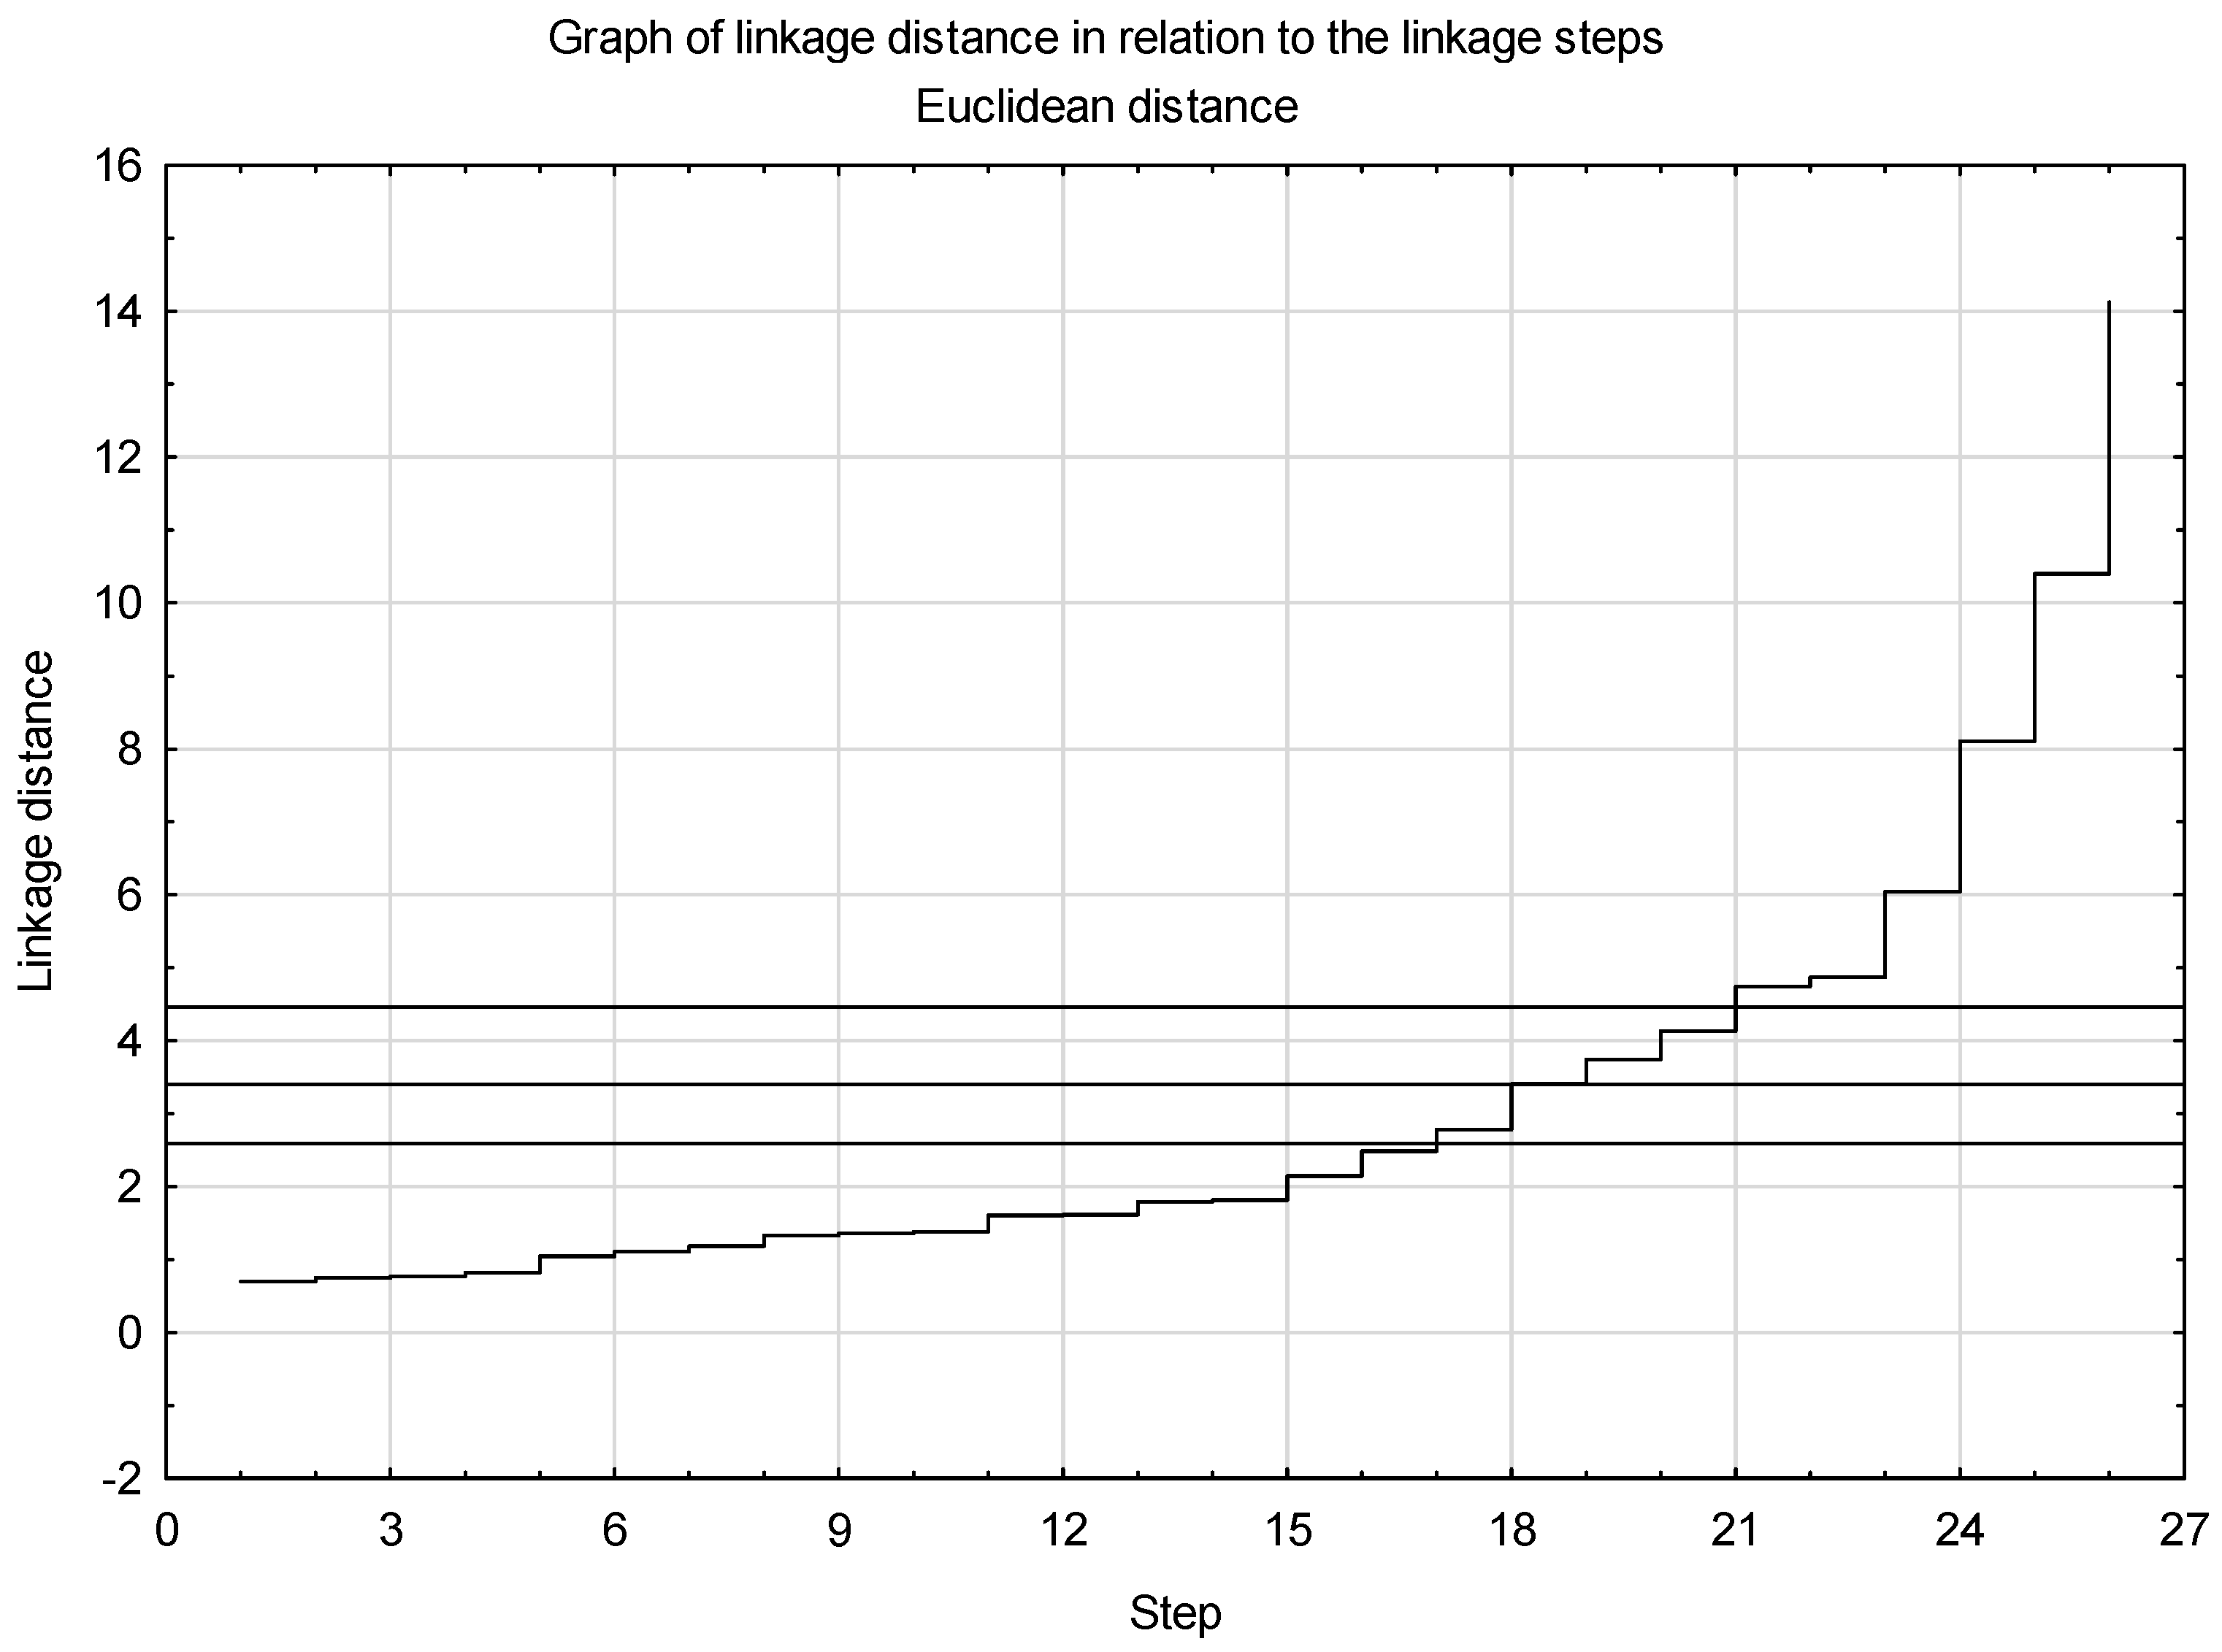
2.2.2. Tree-Diagram Division
- Indicating the measure maximum:
- Calculating the measure of T. Grabiński:
2.2.3. Identification of Characteristic Features
- : A very high intensity of the k-th feature is observed in the c-th class, the feature is highly characteristic;
- : A high intensity of the k-th feature is observed in the c-th class, the feature is medium characteristic;
- : An average intensity of the k-th feature is found in the c-th class, this is not distinguished and it is not characteristic;
- : A low intensity of the k-th feature is found in the c-th class, the feature is medium characteristic; and
- : A very low intensity of the k-th feature is found in the c-th class, the feature is highly characteristic.
3. Results and Discussion
3.1. Resources and Inputs of Production Factors in Agriculture—Their Ratios and Productivity
3.2. Identification of Types of Countries in Terms of the Production Potential in Agriculture
4. Conclusions
Author Contributions
Funding
Conflicts of Interest
References
- Porter, M.E. The Competitive Advantage of Nations; The Free Press: New York, NY, USA, 1990. [Google Scholar]
- Van Duren, E.; Martin, L.; Westgren, R. Assessing the Competitiveness of Canada’s Agrifood Industry. Can. J. Agric. Econ. 1991, 39, 727–738. [Google Scholar] [CrossRef]
- Van Duren, E.; Martin, L.; Westgren, R. A Framework for Assessing National Competitiveness and the Role of Private Strategy and Public Policy. In Competitiveness in International Food Markets; Bredahl, M.E., Abbott, P.C., Reed, M.R., Eds.; Westview Press: Boulder, CO, USA, 1994; pp. 37–59. [Google Scholar]
- Reiljan, J.; Hinrikus, M.; Ivanov, A. Key Issues in Defining and Analysing the Competitiveness of a Country; University of Tartu Economics and Business Administration Working Paper No. 1; Tartu University Press: Tartu, Estonia, 2000; Available online: https://papers.ssrn.com/sol3/papers.cfm?abstract_id=418540 (accessed on 7 February 2021).
- Kunasz, M. Zasoby przedsiębiorstwa w teorii ekonomii (Enterprise Resources from the Perspective of Economic Theory). Gospod. Nar. 2006, 10, 33–48. [Google Scholar] [CrossRef]
- Guth, M.; Smędzik-Ambroży, K. Economic resources versus the efficiency of different types of agricultural production in regions of the European Union. Econ. Res. Ekon. Istraživanja 2020, 33, 1036–1051. [Google Scholar] [CrossRef] [Green Version]
- Schumpeter, J.A. The Theory of Economic Development: An. Inquiry into Profits, Capital, Credit, Interest and the Business Cycle. Harvard Economic Studies, 46; Harvard University Press: Cambridge, MA, USA, 1936. [Google Scholar]
- Schumpeter, J.A. Business Cycles: A Theoretical, Historical and Statistical Analysis of the Capitalist Process; McGraw-Hill Book Company: New York, NY, USA, 1939; Volume 1. [Google Scholar]
- Tinbergen, J. Zur Theorie der langfristigen Wirtschaftsentwicklung (On the Theory of Long-Term Economic Development). Weltwirtschaftliches Arch. 1942, 55, 511–549. [Google Scholar]
- Solow, R.M. Technical Change and the Aggregate Production Function. Rev. Econ. Stat. 1957, 39, 312–320. [Google Scholar] [CrossRef] [Green Version]
- Fagerberg, J. A technology gap approach to why growth rates differ. Res. Policy 1987, 16, 87–99. [Google Scholar] [CrossRef]
- Fagerberg, J. International competitiveness. Econ. J. 1988, 98, 355–374. [Google Scholar] [CrossRef]
- Dunning, J.H. The Global Economy, Domestic Governance, Strategies and Transnational Corporations: Interactions and Policy Implications. Transnatl. Corp. 1992, 1, 7–45. [Google Scholar]
- Hämäläinen, T.J. National Competitiveness and Economic Growth. The Changing Determinants of Economic Performance in the World Economy; Edward Elgar Publishing Ltd.: Cheltenham, UK, 2003. [Google Scholar]
- Cho, D.-S.; Moon, H.-C. From Adam Smith to Michael Porter: Evolution of Competitiveness Theory; World Scientific: Singapore, 2000. [Google Scholar]
- Cho, D.-S.; Moon, H.-C. National competitiveness: Implications for Different Groups and Strategies. Int. J. Glob. Bus. Compet. 2005, 1, 1–11. [Google Scholar]
- Schultz, T.W. Transforming Traditional Agriculture; Yale University Press: New Haven, CO, USA, 1964. [Google Scholar]
- Brinkman, G.L. The Competitive Position of Canadian Agriculture. Can. J. Agric. Econ. 1987, 35, 263–288. [Google Scholar] [CrossRef]
- Abbott, P.C.; Bredahl, M.E. Competitiveness: Definitions, Useful Concepts and Issues. In Competitiveness in International Food Markets; Bredahl, M.E., Abbott, P.C., Reed, M.R., Eds.; Westview Press: Boulder, CO, USA, 1994; pp. 11–35. [Google Scholar]
- Ahearn, M.; Yee, J.; Ball, E.; Nehring, R.; Somwaru, A.; Evans, R. Agricultural Productivity in the U.S.; Agriculture Information Bulletin No. 740; Resource Economics Division, Economic Research Service, U.S. Department of Agriculture: Washington, DC, USA, January 1998.
- Latruffe, L. Competitiveness, Productivity and Efficiency in the Agricultural and Agri-Food Sectors; OECD Food, Agriculture and Fisheries Papers, No. 30; OECD Publishing: Paris, France, 2010. [Google Scholar] [CrossRef]
- Baer-Nawrocka, A.; Markiewicz, N. Relacje między czynnikami produkcji a efektywność wytwarzania w rolnictwie Unii Europejskiej (Production potential and agricultural effectiveness in European Union countries). J. Agribus. Rural Dev. 2013, 3, 5–16. [Google Scholar]
- Shumway, R.; Fraumeni, B.; Fulginiti, L.E.; Samuels, J.; Stefanou, S. Measurement of U.S. Agricultural Productivity: A 2014 Review of Current Statistics and Proposals for Change; Faculty Publications: Agricultural Economics 136; University of Nebraska-Lincoln: Lincoln, NE, USA, 2015; Available online: http://digitalcommons.unl.edu/ageconfacpub/136?utm_source=digitalcommons.unl.edu%2Fageconfacpub%2F136&utm_medium=PDF&utm_campaign=PDFCoverPages (accessed on 7 February 2021).
- Wang, S.L.; Heisey, P.; Schimmelpfennig, D.; Ball, A. Agricultural Productivity Growth in the United States: Measurement, Trends, and Drivers; Economic Research Report 189; Economic Research Service, U.S. Department of Agriculture: Washington, DC, USA, July 2015.
- Rzeszutko, A.; Kita, K. Competitiveness of Polish agriculture compared to the agriculture of the selected EU countries under the CAP. Rural Areas Dev. 2018, 15, 57–70. [Google Scholar]
- Czyżewski, A.; Smędzik-Ambroży, K. Specialization and diversification of agricultural production in the light of sustainable development. J. Int. Stud. 2015, 8, 63–73. [Google Scholar] [CrossRef] [PubMed]
- Czyżewski, B.; Smędzik-Ambroży, K. The regional structure of the CAP subsidies and the factor productivity in agriculture in the EU 28. Agric. Econ. Czech. 2017, 63, 149–163. [Google Scholar] [CrossRef] [Green Version]
- Duesterhaus, R. The SWCS view: Sustainability’s promise. J. Soil Water Conserv. 1990, 45, 4. [Google Scholar]
- Prus, P. Sustainable farming production and its impact on the natural environment—Case study based on a selected group of farmers. In Proceedings of the 8th International Scientific Conference Rural Development 2017: Bioeconomy Challenges, Aleksandras Stulginskis University, Kaunas, Lithuania, 23–24 November 2017; pp. 1280–1285. [Google Scholar] [CrossRef] [Green Version]
- Pawlak, K.; Poczta, W. Agricultural Resources and their Productivity: A Transatlantic Perspective. Eur. Res. Stud. J. 2020, 23, 18–49. [Google Scholar] [CrossRef]
- Marques, A.C.; Fuinhas, J.A.; Pais, D.F. Economic growth, sustainable development and food consumption: Evidence across different income groups of countries. J. Clean. Prod. 2018, 196, 245–258. [Google Scholar] [CrossRef]
- Carlisle, L.; de Montenegro Wit, M.; DeLonge, M.S.; Calo, A.; Getz, C.; Ory, J.; Munden-Dixon, K.; Galt, R.; Melone, B.; Knox, R.; et al. Securing the future of US agriculture: The case for investing in new entry sustainable farmers. Elem. Sci. Anthr. 2019, 7, 17. [Google Scholar] [CrossRef] [Green Version]
- Pawlak, K.; Kołodziejczak, M. The Role of Agriculture in Ensuring Food Security in Developing Countries: Considerations in the Context of the Problem of Sustainable Food Production. Sustainability 2020, 12, 5488. [Google Scholar] [CrossRef]
- Eurostat. Income and Living Conditions. Available online: https://ec.europa.eu/eurostat/web/main/data/database (accessed on 7 February 2021).
- Semega, J.; Kollar, M.; Shrider, E.A.; Creamer, J.F. Income and Poverty in the United States: 2019; U.S. Census Bureau, Current Population Reports P60-270; U.S. Government Publishing Office: Washington, DC, USA, 2020.
- Nowak, A.; Różańska-Boczula, M. Differentiation in the production potential and efficiency of farms in the member states of the European Union. Agric. Econ. Czech. 2019, 65, 395–403. [Google Scholar] [CrossRef]
- Tłuczak, A. Diversity of the selected elements of agricultural potential in the European Union countries. Agric. Econ. Czech. 2020, 66, 260–268. [Google Scholar] [CrossRef]
- Smędzik-Ambroży, K.; Sapa, A. Efficiency and technical progress in agricultural productivity in the European Union. Res. Pap. Wrocław Univ. Econ. 2019, 63, 115–126. [Google Scholar] [CrossRef]
- Baráth, L.; Fertö, I. Productivity and Convergence in European Agriculture. J. Agric. Econ. 2017, 68, 228–248. [Google Scholar] [CrossRef] [Green Version]
- Kijek, A.; Kijek, T.; Nowak, A.; Skrzypek, A. Productivity and its convergence in agriculture in new and old European Union member states. Agric. Econ. Czech. 2019, 65, 1–9. [Google Scholar] [CrossRef]
- Smędzik-Ambroży, K.; Rutkowska, M.; Hakan, K. Productivity of the Polish agricultural sector compared to European Union member states in 2004-2017 based on FADN farms. Ann. Paaae 2019, 21, 422–431. [Google Scholar] [CrossRef]
- Hamulczuk, M. Total factor productivity convergence in the EU agriculture. In International Conference on Competitiveness of Agro-Food and Environmental Economy Proceedings; The Bucharest University of Economic Studies: Bucharest, Romania, 2015; Volume 4, pp. 34–43. [Google Scholar]
- Alston, J.M.; Andersen, M.A.; Pardey, P.G. The Rise and Fall of U.S. Farm. Productivity Growth, 1910–2007; Staff Paper P15-02; University of Minnesota, College of Food, Agricultural and Natural Resource Sciences, Department of Applied Economics: St. Paul, MN, USA, January 2015. [Google Scholar]
- Griliches, Z. Research Expenditures, Education, and the Aggregate Agricultural Production Function. Am. Econ. Rev. 1964, 54, 961–974. [Google Scholar]
- Fuglie, K.O.; Heisey, P.W. Economic Returns to Public Agricultural Research; Economic Brief 10; United States Department of Agriculture, Economic Research Service: Washington, DC, USA, September 2007. [Google Scholar]
- Alston, J.M. The Benefits from Agricultural Research and Development, Innovation, and Productivity Growth; Food, Agriculture and Fisheries Working Papers, No. 31; OECD Publishing: Paris, France, 2010. [Google Scholar] [CrossRef]
- Jin, Y.; Huffman, W.E. Measuring public agricultural research and extension and estimating their impacts on agricultural productivity: New insights from U.S. evidence. Agric. Econ. 2016, 47, 15–31. [Google Scholar] [CrossRef] [Green Version]
- Fuglie, K.; Clancy, M.; Heisey, P.; MacDonald, J. Research, Productivity, and Output Growth in U.S. Agriculture. J. Agric. Appl. Econ. 2017, 49, 514–554. [Google Scholar] [CrossRef] [Green Version]
- Bureau, J.-C.; Färe, R.; Grosskopf, S. A Comparison of Three Nonparametric Measures of Productivity Growth in European and United States Agriculture. J. Agric. Econ. 1995, 46, 309–326. [Google Scholar] [CrossRef]
- Gopinath, M.; Arnade, C.; Shane, M.; Roe, T. Agricultural competitiveness: The case of the United States and major EU countries. Agric. Econ. 1997, 16, 99–109. [Google Scholar] [CrossRef] [Green Version]
- USDA. U.S.-EU Food and Agriculture Comparisons; Agriculture and Trade Reports, WRS-04-04; Economic Research Service, U.S. Department of Agriculture: Washington, DC, USA, January 2004.
- Gandolfo, G. The Classical (Ricardo-Torrens) Theory of Comparative Costs. In International Economics; Springer: Berlin/Heidelberg, Germany, 1986; pp. 7–32. [Google Scholar]
- Eurostat. Extra-EU Trade in Agricultural Goods. Available online: https://ec.europa.eu/eurostat/statistics-explained/index.php/Extra-EU_trade_in_agricultural_goods#Main_trading_partners_for_agricultural_products (accessed on 12 March 2021).
- Davidova, S.; Gorton, M.; Iraizoz, B.; Ratinger, T. Variations in Farm Performance in Transitional Economies: Evidence from the Czech Republic. J. Agric. Econ. 2003, 54, 227–245. [Google Scholar] [CrossRef]
- Baer-Nawrocka, A.; Markiewicz, N. Zróżnicowanie przestrzenne potencjału produkcyjnego rolnictwa w krajach Unii Europejskiej (The Spatial Differentiation of Agricultural Potential in EU Countries). Rocz. Nauk Rol. Ser. G 2010, 97, 9–15. [Google Scholar]
- Łukiewska, K.; Chrobocińska, K. Przestrzenne zróżnicowanie potencjału produkcyjnego rolnictwa w Polsce (Spatial Differentiation of Production Potential of Agriculture in Poland). Rocz. Nauk. Ekon. Rol. I Rozw. Obsz. Wiej. 2015, 102, 56–65. [Google Scholar]
- Poczta, W.; Średzińska, J.; Chenczke, M. Economic Situation of Dairy Farms in Identified Clusters of European Union Countries. Agriculture 2020, 10, 92. [Google Scholar] [CrossRef] [Green Version]
- Eurostat. Farm Structure. Available online: https://ec.europa.eu/eurostat/web/main/data/database (accessed on 30 January 2021).
- Eurostat. Economic Accounts for Agriculture. Available online: https://ec.europa.eu/eurostat/web/main/data/database (accessed on 30 January 2021).
- Eurostat. Land Prices and Rents. Available online: https://ec.europa.eu/eurostat/web/main/data/database (accessed on 31 January 2021).
- Eurostat. Labour Costs. Available online: https://ec.europa.eu/eurostat/web/main/data/database (accessed on 31 January 2021).
- USDA. Census of Agriculture 2017; United States Department of Agriculture, National Agricultural Statistics Service: Washington, DC, USA, 2019.
- U.S. Bureau of Labor Statistics. Average Hourly Earnings of All Employees, Total Private [CES0500000003]. Available online: https://fred.stlouisfed.org/series/CES0500000003 (accessed on 31 January 2021).
- Alvarez, S.; Paas, W.; Descheemaeker, K.; Tittonell, P.; Groot, J. Typology Construction, A Way of Dealing with Farm Diversity. General Guidelines for Humidtropics; Report for the CGIAR Research Program on Integrated System for the Humid Tropics; Wageningen University: Wageningen, The Netherlands, 2014. [Google Scholar]
- Blazy, J.-M.; Ozier-Lafontaine, H.; Doré, T.; Thomas, A.; Wery, J. A methodological framework that accounts for farm diversity in the prototyping of crop management systems. Application to banana-based systems in Guadeloupe. Agric. Syst. 2009, 101, 30–41. [Google Scholar] [CrossRef]
- Pacini, G.C.; Colucci, D.; Baudron, F.; Righi, E.; Corbeels, M.; Tittonell, P.; Stefanini, F.M. Combining Multi-Dimensional Scaling and Cluster Analysis to Describe the Diversity of Rural Households. Exp. Agric. 2014, 50, 376–397. [Google Scholar] [CrossRef] [Green Version]
- Kamińska, A.; Nowak, A. Zastosowanie analizy skupień do badania zróżnicowania regionalnego potencjału produkcyjnego rolnictwa w Polsce (An application of cluster analysis to make a survey of regional productive potential differentiation in Polish agriculture). Rocz. Nauk. Stowarzyszenia Ekon. Rol. I Agrobiz. 2014, 16, 126–130. [Google Scholar]
- Grabiński, T.; Sokołowski, A. The Effectiveness of Some Signal Identification Procedures. In Signal Processing: Theories and Applications; Kunt, M., De Coulon, F., Eds.; North-Holland Publishing Co.: Amsterdam, The Netherlands, 1980; pp. 617–623. [Google Scholar]
- Ward, J.H., Jr. Hierarchical Grouping to Optimize an Objective Function. J. Am. Stat. Assoc. 1963, 58, 236–244. [Google Scholar] [CrossRef]
- Milligan, G.W.; Cooper, M.C. A study of standardization of variables in cluster analysis. J. Classif. 1988, 5, 181–204. [Google Scholar] [CrossRef]
- Jajuga, K.; Walesiak, M. Standardisation of data set under different measurement scales. In Classification and Information Processing at the Turn of the Millennium; Decker, R., Gaul, W., Eds.; Springer: Berlin/Heidelberg, Germany, 2000; pp. 105–112. [Google Scholar]
- Cymerman, J.; Cymerman, W. Zastosowanie analizy skupień do klasyfikacji województw według rozwoju rynków nieruchomości rolnych (The Application of Cluster Analysis to the Classification of Voivodships According to the Development of Agricultural Real Estate Markets). Świat Nieruchom. World Real Estate J. 2017, 101, 55–61. [Google Scholar]
- Zalewska, E. Zastosowanie analizy skupień i metody porządkowania liniowego w ocenie polskiego szkolnictwa wyższego (Application of Cluster Analysis and Linear Ordering in the Assessment of Polish Higher Education). Res. Pap. Wrocław Univ. Econ. 2017, 469, 234–242. [Google Scholar] [CrossRef] [Green Version]
- Mojena, R. Hierarchical grouping methods and stopping rules: An evaluation. Comput. J. 1977, 20, 359–363. [Google Scholar] [CrossRef] [Green Version]
- Milligan, G.W.; Cooper, M.C. An examination of procedures for determining the number of clusters in a data set. Psychometrika 1985, 50, 159–179. [Google Scholar] [CrossRef]
- Wysocki, F. Metody Taksonomiczne w Rozpoznawaniu Typów Ekonomicznych Rolnictwa i Obszarów Wiejskich (Taxonomic Methods to Identify Economic Types of Agriculture and Rural Areas); Poznan University of Life Sciences: Poznań, Poland, 2010. [Google Scholar]
- Poczta, W. Rolnictwo Polskie w Przededniu Integracji z Unią Europejską (Polish Agriculture on the Eve of Integration with the European Union); Poznan University of Life Sciences: Poznań, Poland, 2003. [Google Scholar]
- Huettel, S.; Wildermann, L.; Croonenbroeck, C. How do institutional market players matter in farmland pricing? Land Use Policy 2016, 59, 154–167. [Google Scholar] [CrossRef]
- Seeman, T.; Šrédl, K.; Prášilová, M.; Svoboda, R. The Price of Farmland as a Factor in the Sustainable Development of Czeh Agriculture (A Case Study). Sustainability 2020, 12, 5622. [Google Scholar] [CrossRef]
- Martin-Retortillo, M.; Pinilla, V. Why did Agricultural Labour Productivity Not Converge in Europe from 1950 to 2005? EHES Working Paper No. 25; European Historical Economics Society: Paris, France, October 2012; Available online: http://www.ehes.org/EHES_No25.pdf (accessed on 14 February 2021).
- National Bank of Poland. Middle Exchange Rates Archive—Table A. Available online: https://www.nbp.pl/homen.aspx?c=/ascx/ArchAen.ascx (accessed on 30 January 2021).
- Debertin, D.L. Agricultural Production Economics, 2nd ed.; University of Kentucky: Lexington, KY, USA, 2012. [Google Scholar] [CrossRef]
- Tarnowska, A. Produktywność wybranych czynników wytwórczych w rolnictwie krajów Unii Europejskiej w latach 2005–2012 (Productivity of chosen production factors in agriculture in the European Union in the years 2005–2012). Rocz. Nauk. Stowarzyszenia Ekon. Rol. I Agrobiz. 2014, 16, 214–219. [Google Scholar]
- Pawlak, K.; Poczta, W. Competitiveness of Polish Agriculture in the Context of Globalization and Economic Integration Competitive Potential and Position. Probl. Agric. Econ. 2020, 4, 86–107. [Google Scholar] [CrossRef]
- Gołaś, Z. Labour Productivity Growth and Convergence in Agriculture of the European Union. Int. J. Econ. Financ. Issues 2019, 9, 11–17. [Google Scholar] [CrossRef]
- Nowak, A.; Krukowski, A. Competitiveness of farms in new European Union member states. Agron. Sci. 2019, 74, 73–80. [Google Scholar] [CrossRef]
- Burja, C.; Burja, V. Farms Size and Efficiency of the Production Factors in Romanian Agriculture. Econ. Agric. 2016, 63, 361–374. [Google Scholar]
- Bórawski, P.; Guth, M.; Bełdycka-Bórawska, A.; Jankowski, K.J.; Parzonko, A.; Dunn, J.W. Investments in Polish Agriculture: How Production Factors Shape Conditions for Environmental Protection? Sustainability 2020, 12, 8160. [Google Scholar] [CrossRef]
- Hornowski, A.; Parzonko, A.; Kotyza, P.; Kondraszuk, T.; Bórawski, P.; Smutka, L. Factors Determining the Development of Small Farms in Central and Eastern Poland. Sustainability 2020, 12, 5095. [Google Scholar] [CrossRef]
- Špička, J.; Smutka, L. The Technical Efficiency of Specialised Milk Farms: A Regional View. Sci. World J. 2014, 985149. [Google Scholar] [CrossRef] [PubMed] [Green Version]
- Latruffe, L.; Balcombe, K.; Davidova, S.; Zawalińska, K. Determinants of technical efficiency of crop and livestock farms in Poland. Appl. Econ. 2004, 36, 1255–1263. [Google Scholar] [CrossRef]
- Bojnec, S.; Latruffe, L. Farm. Size and Efficiency: The Case of Slovenia. In Proceedings of the 100th seminar of the EAAE, Development of Agriculture and Rural Areas in Central and Eastern Europe, Novi Sad, Serbia, 21–23 June 2007. [Google Scholar]
- Burja, V. Performance Disparities Between Agricultural Holdings of Romania and of the European Union. Ann. Constantin Brâncuşi Univ. Târgu Jiueconomy Ser. 2014, 97–102. [Google Scholar]
- Alexandri, C.; Gavrilescu, C.; Luca, L.; Voicilas, D.-M. National Strategy for Agriculture in Romania—Horizon 2035. Rural Areas Dev. 2017, 14, 135–152. [Google Scholar]
- Wiatrak, A.P. Dochody i Akumulacja w Gospodarce Chłopskiej (Income and Accumulation in the Peasant Economy); PWN Group: Warsaw, Poland, 1982. [Google Scholar]
- Poczta, W.; Średzińska, J.; Standar, A. Sytuacja finansowa gospodarstw rolnych krajów UE według potencjału produkcyjnego (Financial situation in the agricultural holdings of the EU countries according to the potential for production). J. Agribus. Rural Dev. 2008, 4, 83–94. [Google Scholar]
- Huffmann, W.E.; Evenson, R.E. Structural and productivity change in US agriculture, 1950–1982. Agric. Econ. 2001, 24, 127–147. [Google Scholar] [CrossRef]
- Eurostat. National Accounts. Available online: https://ec.europa.eu/eurostat/web/main/data/database (accessed on 16 February 2021).
- Cuerva, M.C. Dynamics of European agricultural productivity: An analysis of regional convergence. Rev. Agric. Environ. Stud. 2011, 92, 237–258. [Google Scholar]
- Brückler, M.; Resl, T.; Reindl, A. Comparison of organic and conventional crop yields in Austria. Die Bodenkult. J. Land Manag. Food Environ. 2017, 68, 223–236. [Google Scholar] [CrossRef] [Green Version]
- Darnhofer, I.; D’Amico, S.; Fouilleux, E. A relational perspective on the dynamics of the organic sector in Austria, Italy, and France. J. Rural Stud. 2019, 68, 200–212. [Google Scholar] [CrossRef]


| Countries | UAA a | Employment | Capital Input (Intermediate Consumption and Fixed Capital Consumption) b | |||
|---|---|---|---|---|---|---|
| Thous. ha | % | Thous. Persons | % | Million Euro | % | |
| Austria | 2670 | 1.5 | 167.4 | 1.8 | 5831.3 | 1.9 |
| Belgium | 1354 | 0.8 | 54.0 | 0.6 | 6785.3 | 2.2 |
| Denmark | 2615 | 1.5 | 61.6 | 0.6 | 9443.9 | 3.1 |
| Finland | 2194 | 1.3 | 92.9 | 1.0 | 4302.4 | 1.4 |
| France | 27,814 | 16.1 | 697.9 | 7.4 | 53,726.2 | 17.7 |
| Germany | 16,715 | 9.7 | 532.0 | 5.6 | 46,009.8 | 15.1 |
| Greece | 4554 | 2.6 | 453.4 | 4.8 | 6821.1 | 2.2 |
| Ireland | 4884 | 2.8 | 110.4 | 1.2 | 6167.2 | 2.0 |
| Italy | 12,598 | 7.3 | 871.2 | 9.2 | 33,695.4 | 11.1 |
| Luxembourg | 131 | 0.1 | 3.1 | 0.0 | 407.1 | 0.1 |
| Netherlands | 1796 | 1.0 | 176.0 | 1.9 | 21,061.6 | 6.9 |
| Portugal | 3642 | 2.1 | 304.4 | 3.2 | 5446.1 | 1.8 |
| Spain | 23,230 | 13.4 | 819.4 | 8.6 | 26,983.6 | 8.9 |
| Sweden | 3021 | 1.7 | 91.5 | 1.0 | 5611.1 | 1.8 |
| United Kingdom | 16,394 | 9.5 | 369.6 | 3.9 | 21,359.2 | 7.0 |
| EU-15 | 123,612 | 71.4 | 4804.8 | 50.7 | 253,651.2 | 83.4 |
| Bulgaria | 4492 | 2.6 | 221.0 | 2.3 | 2735.1 | 0.9 |
| Croatia | 1563 | 0.9 | 113.3 | 1.2 | 1538.2 | 0.5 |
| Cyprus | 112 | 0.1 | 9.6 | 0.1 | 416.8 | 0.1 |
| Czechia | 3455 | 2.0 | 146.3 | 1.5 | 4121.2 | 1.4 |
| Estonia | 995 | 0.6 | 23.1 | 0.2 | 738.2 | 0.2 |
| Hungary | 4671 | 2.7 | 222.7 | 2.3 | 5794.9 | 1.9 |
| Latvia | 1931 | 1.1 | 61.4 | 0.6 | 1108.1 | 0.4 |
| Lithuania | 2925 | 1.7 | 105.5 | 1.1 | 2237.9 | 0.7 |
| Malta | 11 | 0.0 | 2.2 | 0.0 | 68.8 | 0.0 |
| Poland | 14,406 | 8.3 | 1672.2 | 17.6 | 16,758.0 | 5.5 |
| Romania | 12,503 | 7.2 | 1974.9 | 20.8 | 12,077.1 | 4.0 |
| Slovakia | 1890 | 1.1 | 68.5 | 0.7 | 1976.2 | 0.6 |
| Slovenia | 488 | 0.3 | 53.0 | 0.6 | 984.8 | 0.3 |
| EU-13 | 49,442 | 28.6 | 4673.7 | 49.3 | 50,555.4 | 16.6 |
| EU-28 | 173,054 | 100.0 | 9478.5 | 100.0 | 304,206.6 | 100.0 |
| USA | 364,305 | 100.0 | 2188.2 | 100.0 | 206,048.8 | 100.0 |
| Countries | UAA per 1 Person Employed (ha) | Value of Capital Inputs per 1 Person Employed (Thous. Euro) | Value of Capital Inputs per 1 ha UAA (Thous. Euro) |
|---|---|---|---|
| Austria | 15.95 | 34.83 | 2.18 |
| Belgium | 25.07 | 125.65 | 5.01 |
| Denmark | 42.45 | 153.31 | 3.61 |
| Finland | 23.62 | 46.31 | 1.96 |
| France | 39.85 | 76.98 | 1.93 |
| Germany | 31.42 | 86.48 | 2.75 |
| Greece | 10.04 | 15.04 | 1.50 |
| Ireland | 44.24 | 55.86 | 1.26 |
| Italy | 14.46 | 38.68 | 2.67 |
| Luxembourg | 42.26 | 131.32 | 3.11 |
| Netherlands | 10.20 | 119.67 | 11.73 |
| Portugal | 11.96 | 17.89 | 1.50 |
| Spain | 28.35 | 32.93 | 1.16 |
| Sweden | 33.02 | 61.32 | 1.86 |
| United Kingdom | 44.36 | 57.79 | 1.30 |
| EU-15 | 25.73 | 52.79 | 2.05 |
| Bulgaria | 20.33 | 12.38 | 0.61 |
| Croatia | 13.80 | 13.58 | 0.98 |
| Cyprus | 11.67 | 43.42 | 3.72 |
| Czechia | 23.62 | 28.17 | 1.19 |
| Estonia | 43.07 | 31.96 | 0.74 |
| Hungary | 20.97 | 26.02 | 1.24 |
| Latvia | 31.45 | 18.05 | 0.57 |
| Lithuania | 27.73 | 21.21 | 0.77 |
| Malta | 5.00 | 31.27 | 6.25 |
| Poland | 8.61 | 10.02 | 1.16 |
| Romania | 6.33 | 6.12 | 0.97 |
| Slovakia | 27.59 | 28.85 | 1.05 |
| Slovenia | 9.21 | 18.58 | 2.02 |
| EU-13 | 10.58 | 10.82 | 1.02 |
| EU-28 | 18.26 | 32.09 | 1.76 |
| USA | 166.49 | 94.16 | 0.57 |
| Countries | Agricultural Production | |||||||
|---|---|---|---|---|---|---|---|---|
| Per 1 ha UAA | Per 1 Person Employed | Per 1 Euro of Capital Inputs | Per 1 Euro of Current Assets | |||||
| Euro | EU-28 = 100 | Euro | EU-28 = 100 | Euro | EU-28 = 100 | Euro | EU-28 = 100 | |
| Austria | 2580 | 106.9 | 41,146 | 93.4 | 1.18 | 86.0 | 1.69 | 98.8 |
| Belgium | 6167 | 255.5 | 154,622 | 351.0 | 1.23 | 89.6 | 1.39 | 81.3 |
| Denmark | 4210 | 174.5 | 178,708 | 405.6 | 1.17 | 84.9 | 1.36 | 79.6 |
| Finland | 1710 | 70.9 | 40,385 | 91.7 | 0.87 | 63.5 | 1.21 | 70.6 |
| France | 2555 | 105.9 | 101,842 | 231.2 | 1.32 | 96.4 | 1.64 | 95.9 |
| Germany | 3388 | 140.4 | 106,437 | 241.6 | 1.23 | 89.7 | 1.58 | 92.6 |
| Greece | 2415 | 100.1 | 24,257 | 55.1 | 1.61 | 117.5 | 1.95 | 114.0 |
| Ireland | 1736 | 71.9 | 76,779 | 174.3 | 1.37 | 100.1 | 1.59 | 93.2 |
| Italy | 4025 | 166.8 | 58,210 | 132.1 | 1.51 | 109.6 | 2.14 | 125.4 |
| Luxembourg | 3002 | 124.4 | 126,845 | 287.9 | 0.97 | 70.4 | 1.28 | 74.5 |
| Netherlands | 15,667 | 649.3 | 159,877 | 362.9 | 1.34 | 97.3 | 1.64 | 95.7 |
| Portugal | 2042 | 84.6 | 24,427 | 55.4 | 1.37 | 99.5 | 1.60 | 93.4 |
| Spain | 2129 | 88.2 | 60,348 | 137.0 | 1.83 | 133.5 | 2.27 | 132.6 |
| Sweden | 2031 | 84.2 | 67,054 | 152.2 | 1.09 | 79.7 | 1.36 | 79.3 |
| United Kingdom | 1718 | 71.2 | 76,203 | 173.0 | 1.32 | 96.1 | 1.56 | 91.3 |
| EU-15 | 2812 | 116.5 | 72,345 | 164.2 | 1.37 | 99.8 | 1.73 | 100.9 |
| Bulgaria | 912 | 37.8 | 18,534 | 42.1 | 1.50 | 109.1 | 1.79 | 104.6 |
| Croatia | 1369 | 56.7 | 18,879 | 42.9 | 1.39 | 101.3 | 1.74 | 101.8 |
| Cyprus | 6217 | 257.6 | 72,527 | 164.6 | 1.67 | 121.7 | 1.73 | 101.2 |
| Czechia | 1423 | 59.0 | 33,608 | 76.3 | 1.19 | 86.9 | 1.44 | 84.3 |
| Estonia | 852 | 35.3 | 36,700 | 83.3 | 1.15 | 83.7 | 1.39 | 81.5 |
| Hungary | 1764 | 73.1 | 37,007 | 84.0 | 1.42 | 103.6 | 1.71 | 99.8 |
| Latvia | 668 | 27.7 | 21,007 | 47.7 | 1.16 | 84.8 | 1.32 | 76.9 |
| Lithuania | 952 | 39.5 | 26,406 | 59.9 | 1.24 | 90.7 | 1.47 | 85.7 |
| Malta | 10,465 | 433.7 | 52,327 | 118.8 | 1.67 | 121.9 | 1.84 | 107.8 |
| Poland | 1773 | 73.5 | 15,277 | 34.7 | 1.52 | 111.1 | 1.70 | 99.4 |
| Romania | 1271 | 52.7 | 8050 | 18.3 | 1.32 | 95.9 | 1.68 | 98.2 |
| Slovakia | 1199 | 49.7 | 33,095 | 75.1 | 1.15 | 83.6 | 1.30 | 76.2 |
| Slovenia | 2363 | 97.9 | 21,755 | 49.4 | 1.17 | 85.3 | 1.60 | 93.3 |
| EU-13 | 1416 | 58.7 | 14,976 | 34.0 | 1.38 | 100.9 | 1.64 | 95.9 |
| EU-28 | 2413 | 100.0 | 44,057 | 100.0 | 1.37 | 100.0 | 1.71 | 100.0 |
| USA | 946 | 39.2 | 157,535 | 357.6 | 1.67 | 121.9 | 1.91 | 111.4 |
| Feature | Class | Total | ||||||||||
|---|---|---|---|---|---|---|---|---|---|---|---|---|
| I | II | III | IV | V | VI | VII | VIII | IX | X | XI | ||
| Share of land in total inputs (%) | 1.2 | 1.3 | 1.2 | 0.8 | 2.7 | 3.5 | 1.3 | 1.8 | 1.6 | 1.0 | 1.9 | 1.9 |
| Share of labor in total inputs (%) | 61.2 | 38.9 | 37.2 | 50.1 | 33.5 | 44.4 | 37.7 | 33.0 | 50.7 | 61.0 | 58.9 | 46.1 |
| UAA per 1 person employed (ha) | 8.6 | 29.4 | 23.0 | 28.3 | 166.5 | 44.3 | 33.0 | 34.3 | 21.2 | 7.8 | 14.3 | 46.1 |
| Value of capital inputs per 1 person employed (Thous. Euro) | 10.0 | 23.7 | 21.7 | 53.8 | 94.2 | 57.3 | 86.0 | 140.4 | 35.9 | 9.1 | 30.9 | 43.7 |
| Ratio of current assets to fixed assets (Euro/Euro) | 8.7 | 7.4 | 5.0 | 3.3 | 7.1 | 5.6 | 3.9 | 6.6 | 3.0 | 4.3 | 2.4 | 5.0 |
| Productivity of current assets (Euro/Euro) | 1.7 | 1.3 | 1.6 | 1.3 | 1.9 | 1.6 | 1.6 | 1.4 | 2.2 | 1.7 | 1.7 | 1.8 |
| Feature | Class | ||||||||||
|---|---|---|---|---|---|---|---|---|---|---|---|
| I | II | III | IV | V | VI | VII | VIII | IX | X | XI | |
| Share of land in total inputs (%) | −1.7 | −1.6 | −1.7 | −2.7 | 1.9 | 3.8 | −1.4 | −0.3 | −0.8 | −2.3 | −0.1 |
| Share of labor in total inputs (%) | 2.6 | −1.2 | −1.5 | 0.7 | −2.1 | −0.3 | −1.4 | −2.2 | 0.8 | 2.5 | 2.2 |
| UAA per 1 person employed (ha) | −2.3 | −1.0 | −1.4 | −1.1 | 7.3 | −0.1 | −0.8 | −0.7 | −1.5 | −2.3 | −1.9 |
| Value of capital inputs per 1 person employed (Thous. Euro) | −1.5 | −0.9 | −0.9 | 0.4 | 2.2 | 0.6 | 1.8 | 4.2 | −0.3 | −1.5 | −0.6 |
| Ratio of current assets to fixed assets (Euro/Euro) | 3.9 | 2.6 | 0.1 | −1.7 | 2.2 | 0.7 | −1.1 | 1.7 | −2.1 | −0.7 | −2.7 |
| Productivity of current assets (Euro/Euro) | −0.7 | −3.4 | −1.2 | −3.5 | 0.8 | −1.6 | −1.2 | −2.9 | 2.9 | −0.4 | −0.8 |
| Class | Characteristics of Type |
|---|---|
| I | High—the highest in the analyzed population—the share of labor in total inputs; small UAA per 1 person employed; very high ratio of current assets to fixed assets |
| II | High ratio of current assets to fixed assets; very low productivity of current assets |
| III | Average type, not distinguished by any particularly characteristic features from the other countries |
| IV | Low share of land in total inputs—the lowest among analyzed countries; very low productivity of current assets—the lowest in the analyzed population |
| V | Low share of labor in total inputs; very high UAA per 1 person employed—the highest in the analyzed population; high level of capital assets per 1 person employed and high ratio of current assets to fixed assets |
| VI | Very high share of land in total inputs—the highest in the analyzed population |
| VII | Average type, not distinguished by any particularly characteristic features from the other countries |
| VIII | Low share of labor in total inputs; very high level of capital assets per 1 person employed—the highest in the analyzed population; low productivity of current assets |
| IX | Low ratio of current assets to fixed assets; high productivity of current assets—the highest in the analyzed population |
| X | Low share of land, but high share of labor in total assets; lowest level of land assets per 1 person employed in the analyzed population |
| XI | High share of labor in total inputs and low ratio of current assets to fixed assets |
Publisher’s Note: MDPI stays neutral with regard to jurisdictional claims in published maps and institutional affiliations. |
© 2021 by the authors. Licensee MDPI, Basel, Switzerland. This article is an open access article distributed under the terms and conditions of the Creative Commons Attribution (CC BY) license (http://creativecommons.org/licenses/by/4.0/).
Share and Cite
Pawlak, K.; Smutka, L.; Kotyza, P. Agricultural Potential of the EU Countries: How Far Are They from the USA? Agriculture 2021, 11, 282. https://doi.org/10.3390/agriculture11040282
Pawlak K, Smutka L, Kotyza P. Agricultural Potential of the EU Countries: How Far Are They from the USA? Agriculture. 2021; 11(4):282. https://doi.org/10.3390/agriculture11040282
Chicago/Turabian StylePawlak, Karolina, Luboš Smutka, and Pavel Kotyza. 2021. "Agricultural Potential of the EU Countries: How Far Are They from the USA?" Agriculture 11, no. 4: 282. https://doi.org/10.3390/agriculture11040282
APA StylePawlak, K., Smutka, L., & Kotyza, P. (2021). Agricultural Potential of the EU Countries: How Far Are They from the USA? Agriculture, 11(4), 282. https://doi.org/10.3390/agriculture11040282