
Impact of Fiscal Expenditure on Farmers’ Livelihood Capital in the Ethnic Minority Mountainous Region of Sichuan, China


Abstract
:1. Introduction
2. Materials and Methods
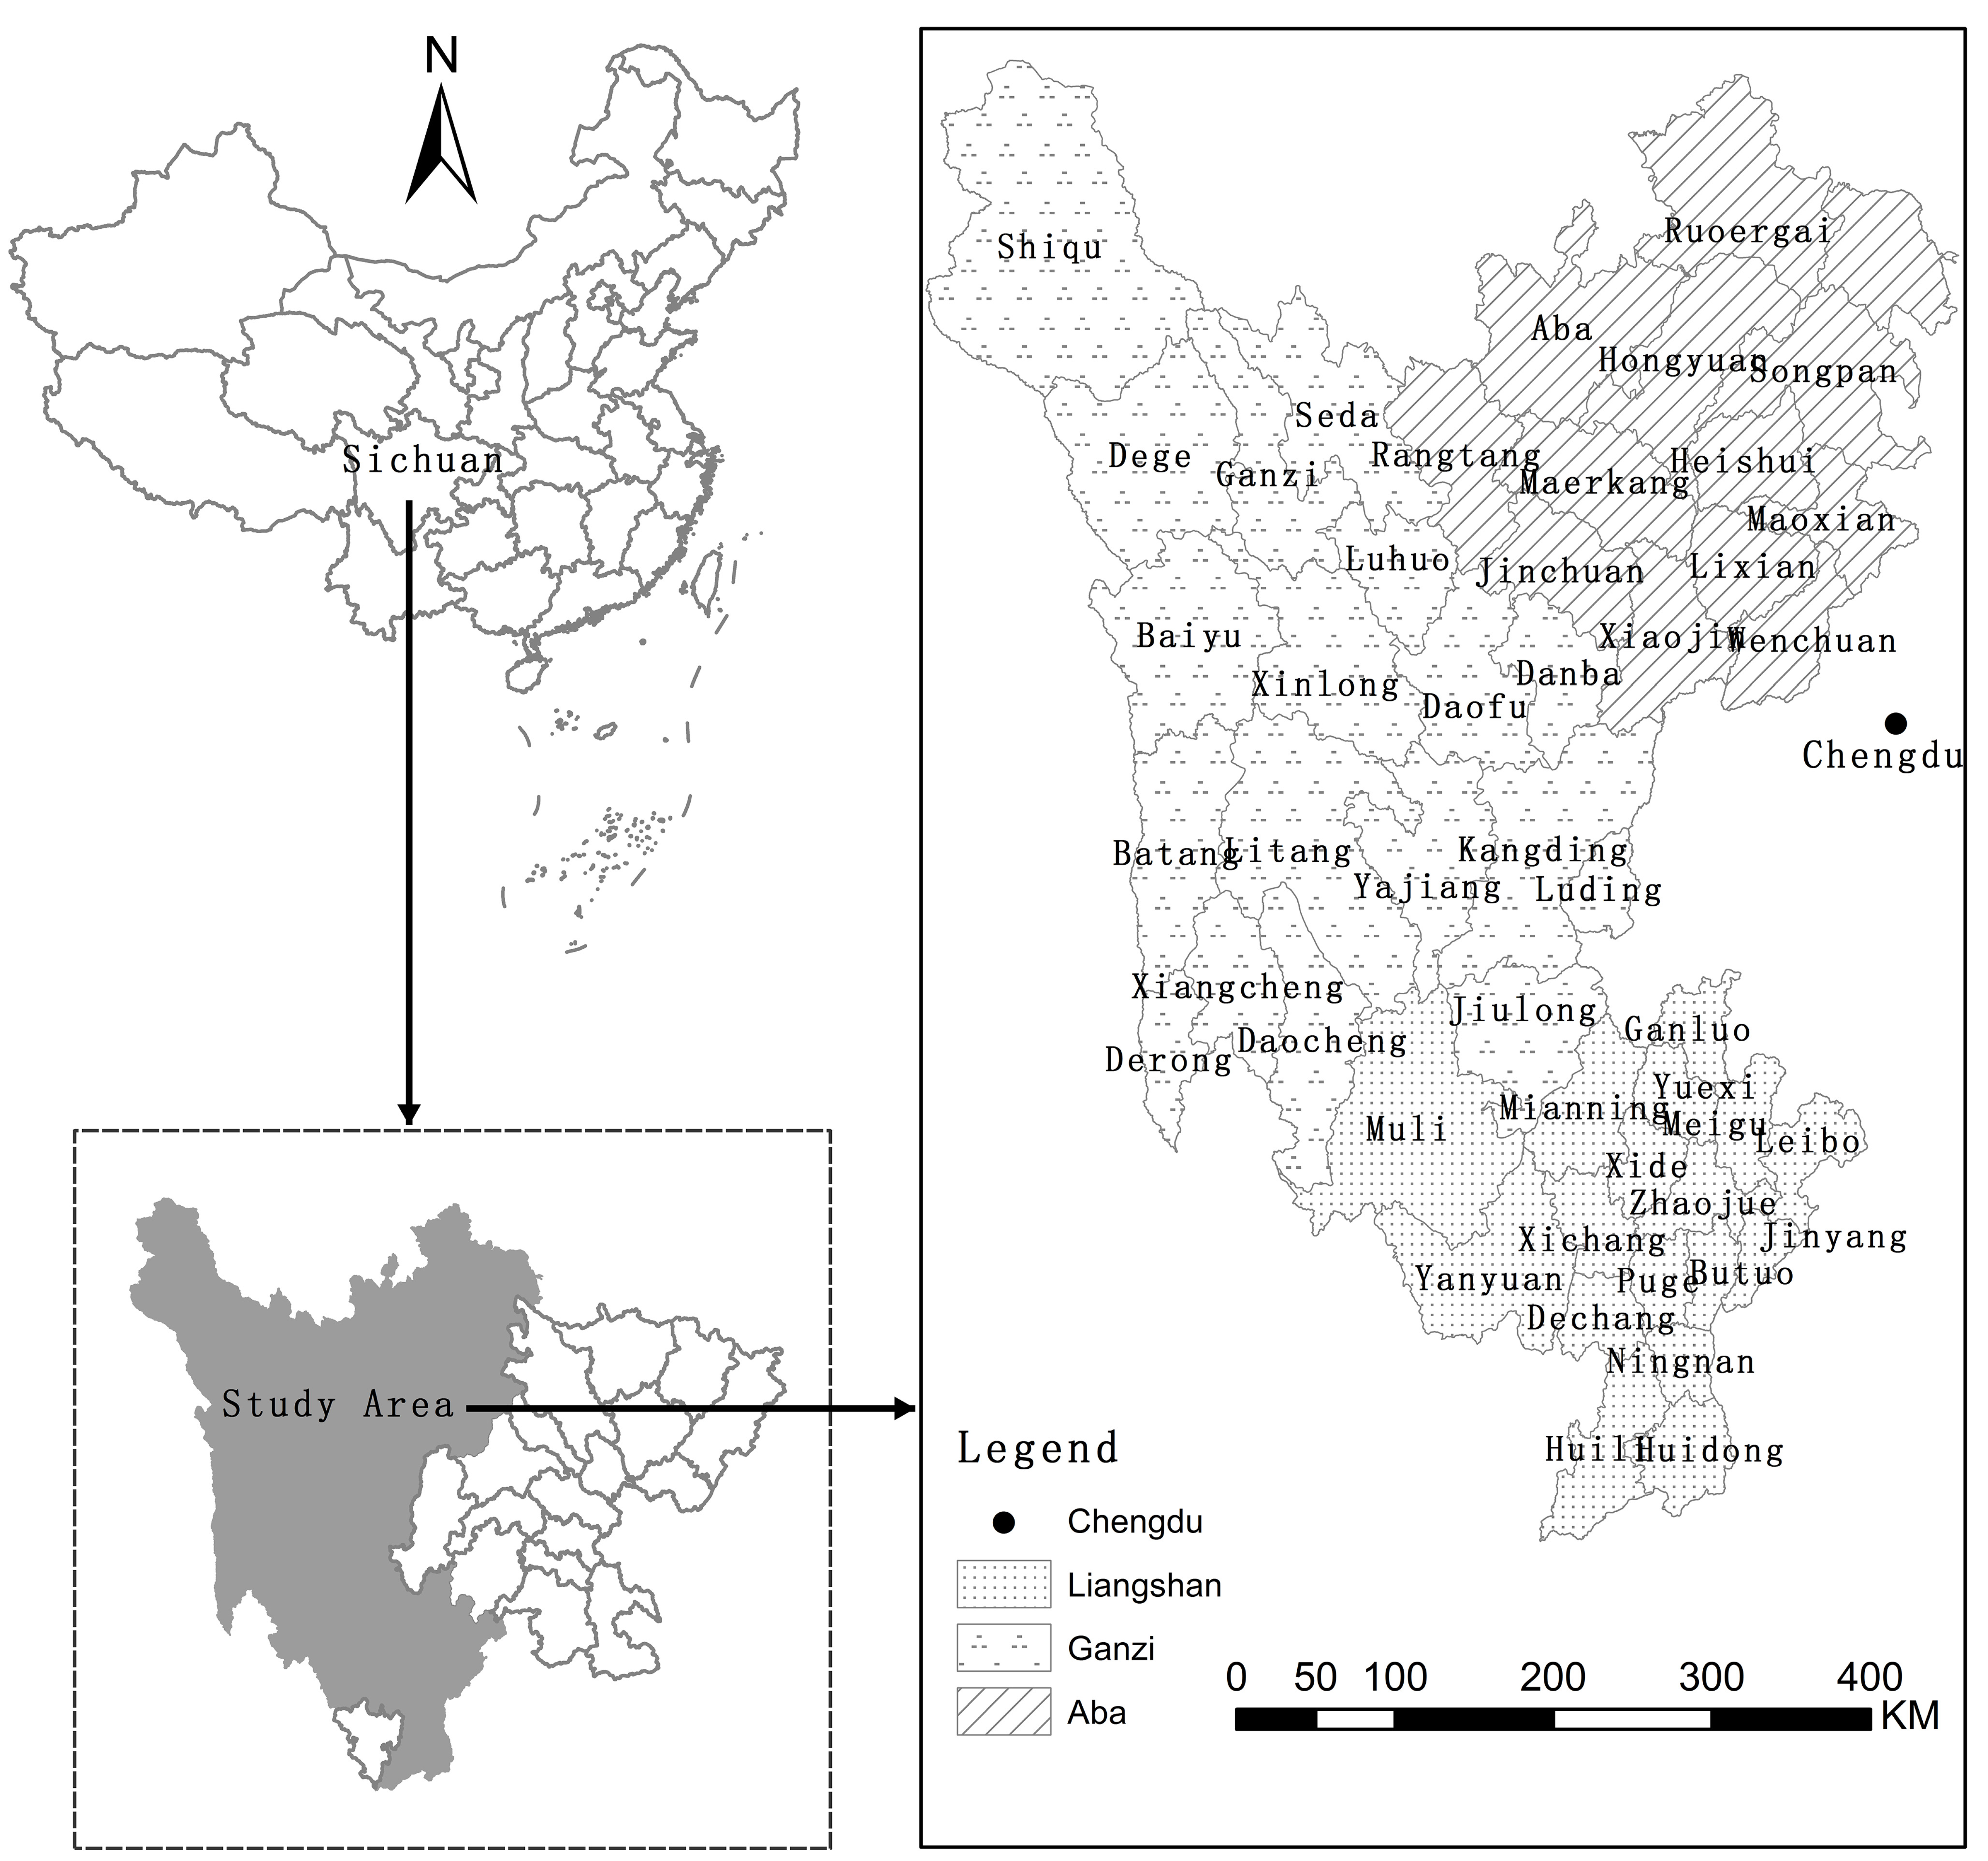
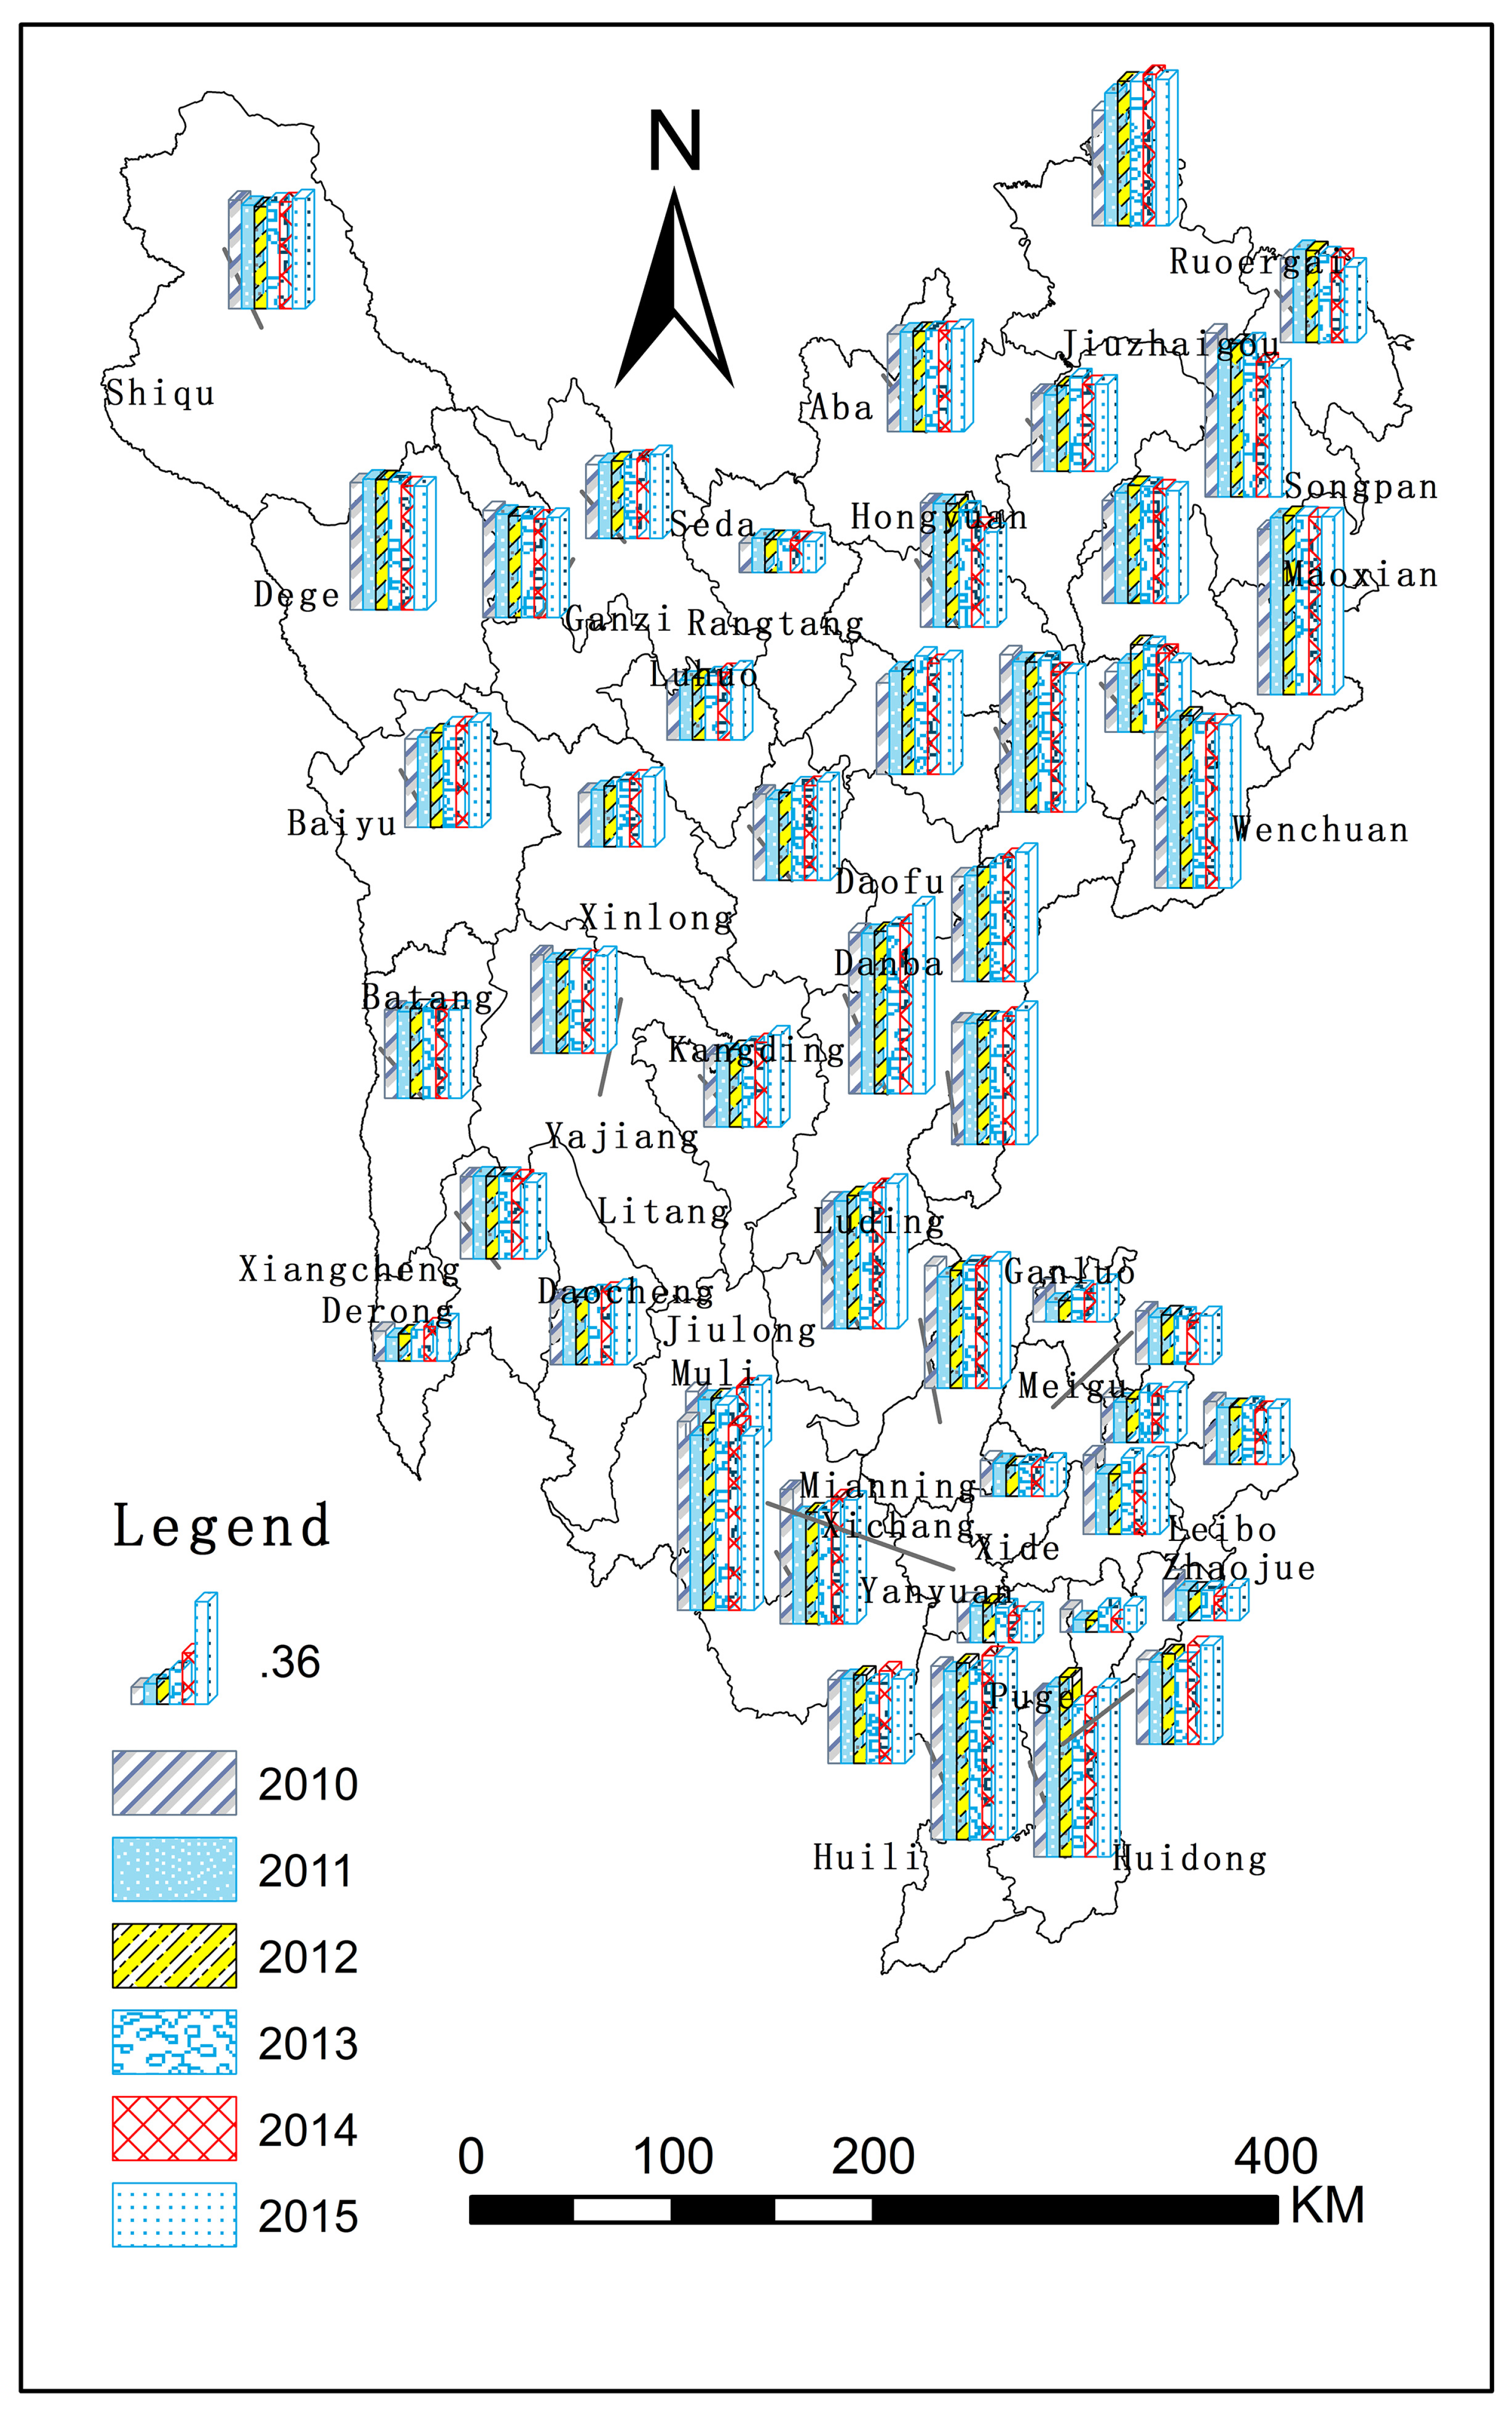
2.1. Overview of the Study Area
2.2. Source of Data
2.3. Research Methods
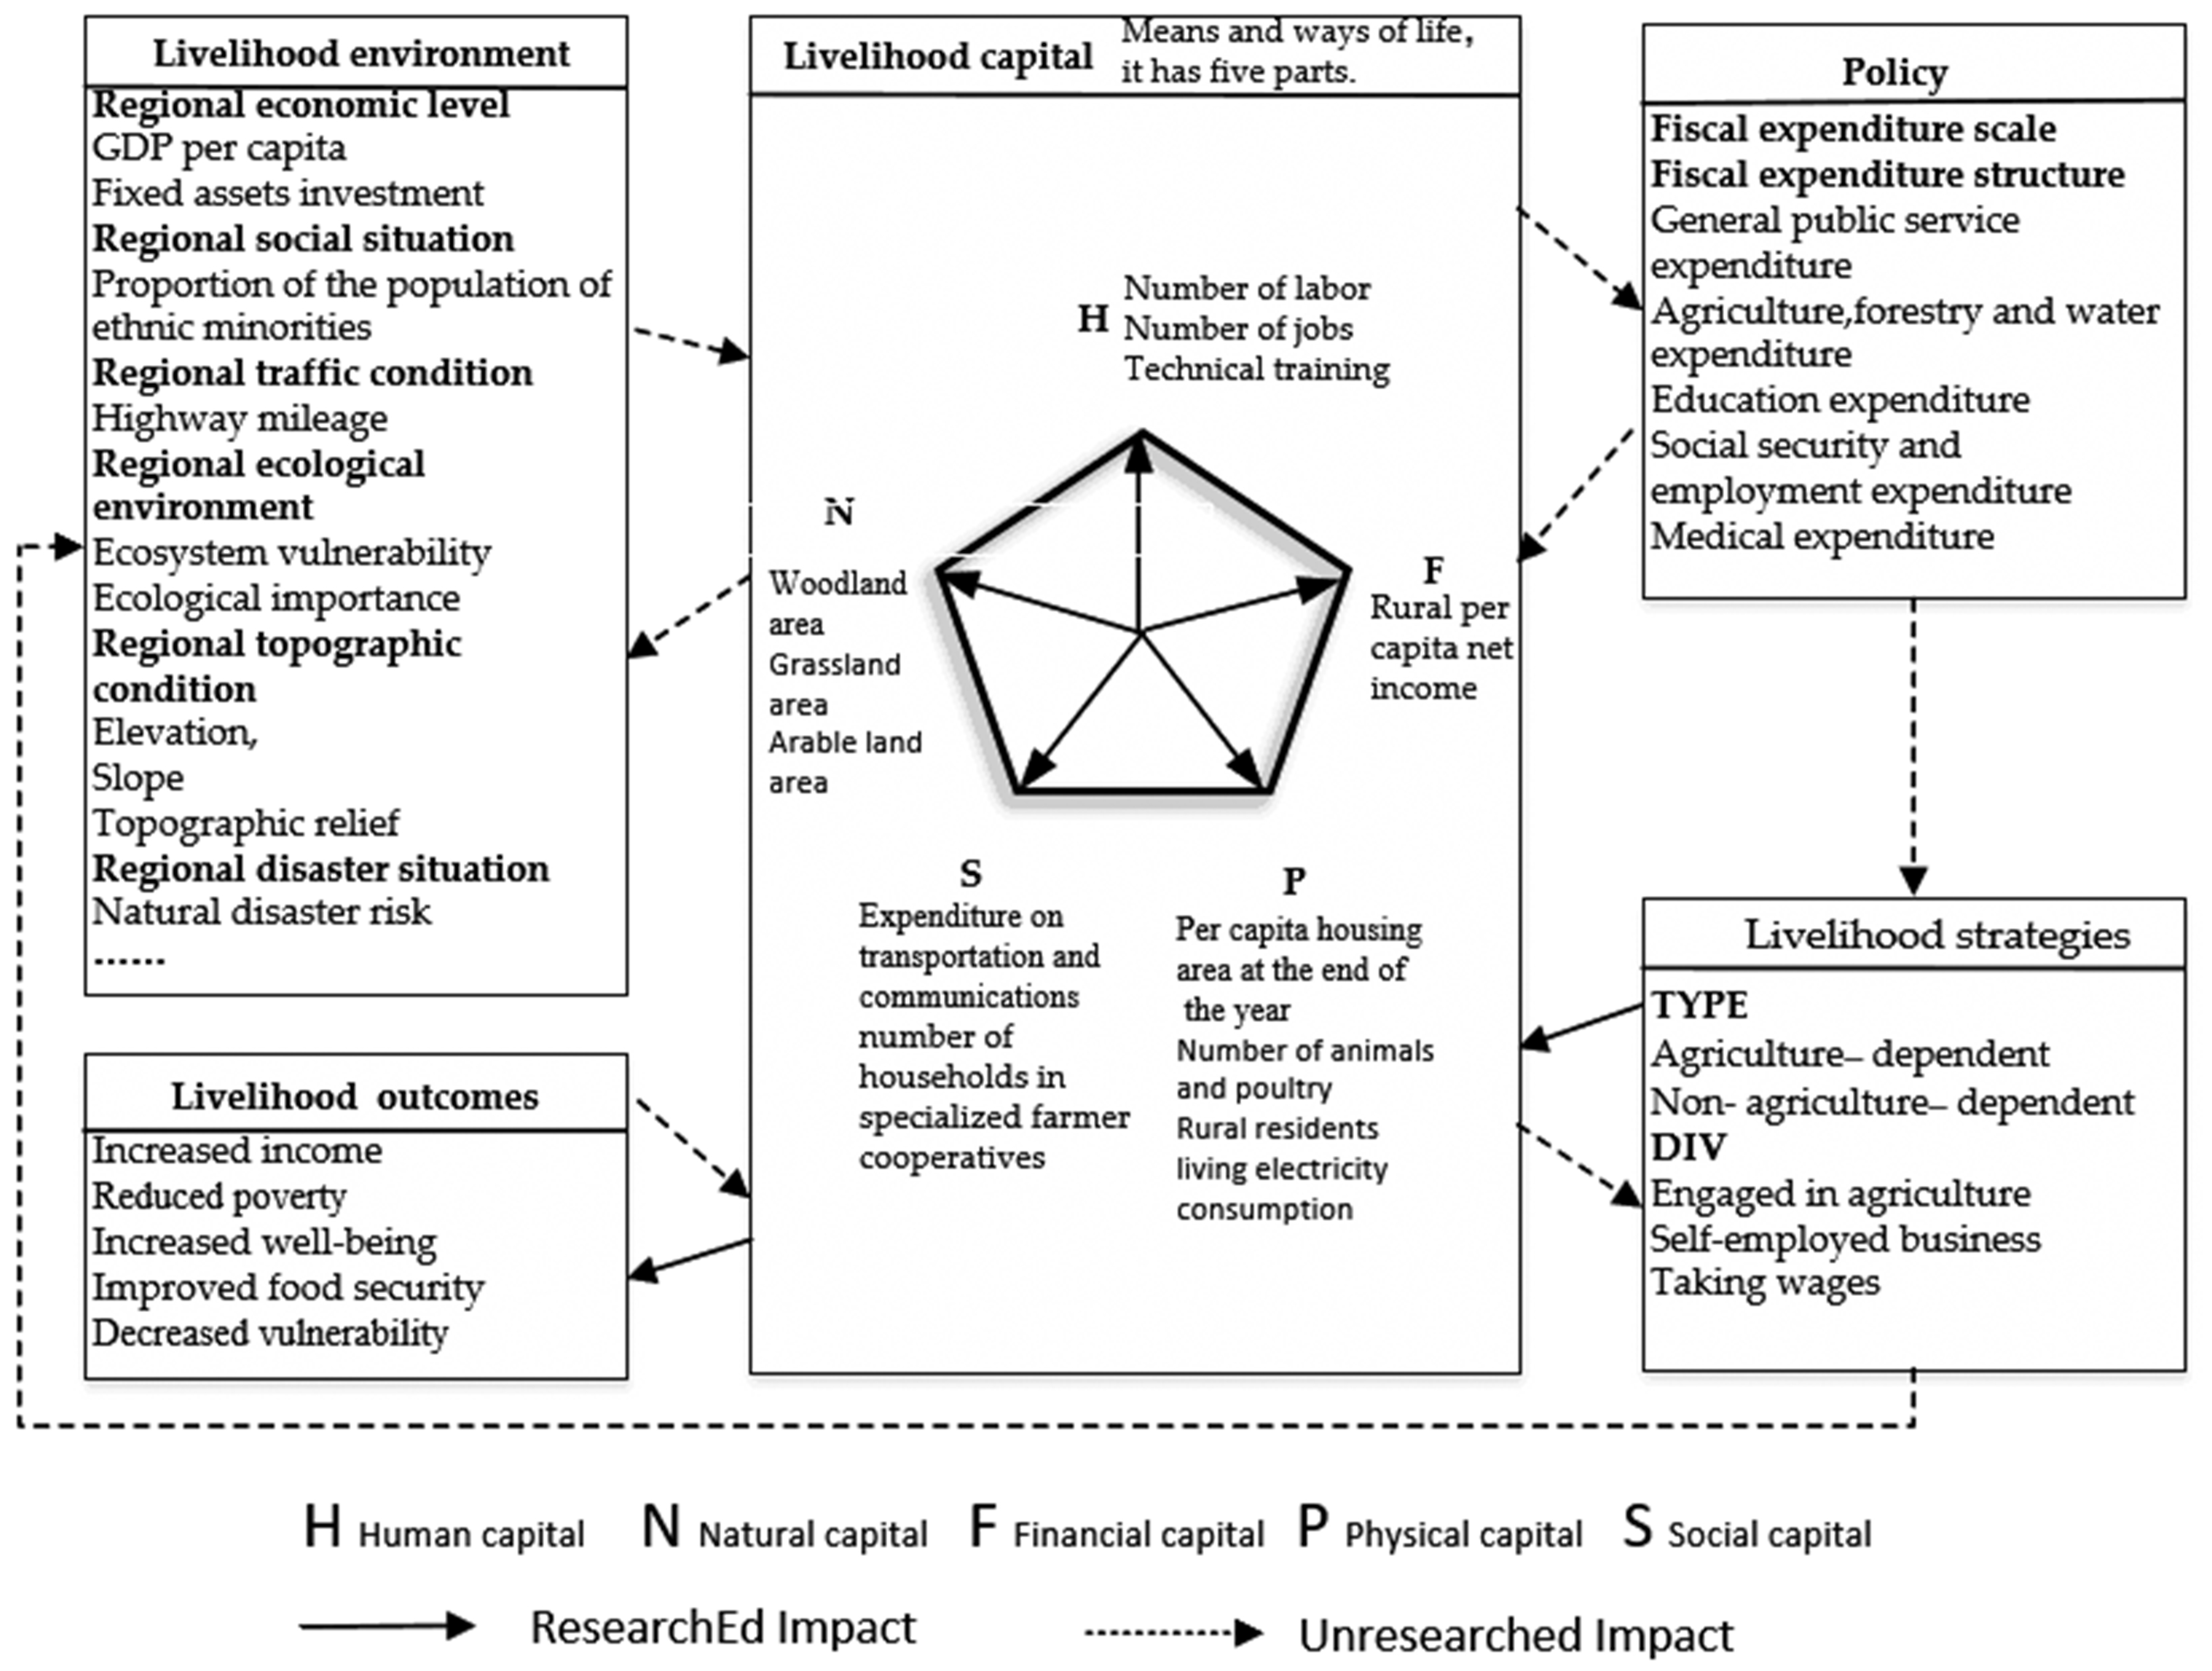
2.3.1. Construction of Indicator System
- (1)
- Livelihood capital indicators. This paper refers to related research [34,35,36,37,38] and combines the actual situation of the three states to construct a farmer’s livelihood capital indicator system. Natural capital includes forest land area, grassland area, and cultivated land area. Material capital includes per-capita housing area, number of animals, and rural household electricity consumption. Social capital includes the consumption expenditure of transportation and communication, as well as farmers’ professional cooperative members. Human capital includes the number of labor resources, the number of rural employees, and the number of people trained. Finally, the financial capital includes the per-capita net income of farmers.
- (2)
- Financial expenditure indicators. The scale of fiscal expenditure is measured by the proportion of regional fiscal expenditure to GDP. At the same time, according to the specific classification criteria of fiscal expenditure in the three-state statistical yearbooks, and also taking into account the uniformity and data availability of fiscal expenditure structure indicators in 47 counties in the study area from 2010 to 2015, the fiscal expenditure is divided into five types: general public service expenditures, agriculture and forestry water expenditures, education expenditures, social security and employment expenditures, and medical expenditures. Moreover, the proportion of various expenditures to the total fiscal expenditure is calculated to measure the structure of fiscal expenditure.
- (3)
- Other indicators. For the control variables in the model, the regional economic level is measured by the county’s per-capita GDP and the total investment of social fixed assets. The regional social status is measured by the proportion of the county’s minority population. The regional traffic conditions are measured by the county road mileage. The regional ecological environment is measured by ecosystem vulnerability and ecological importance. Regional topographic conditions are measured by altitude, slope, and topographic relief. Finally, regional disaster conditions are measured by the risk of natural disasters.
2.3.2. Calculation Method of Livelihood Capital Level
2.3.3. Econometric Model Setting: Dynamic Panel Data Model
3. Results
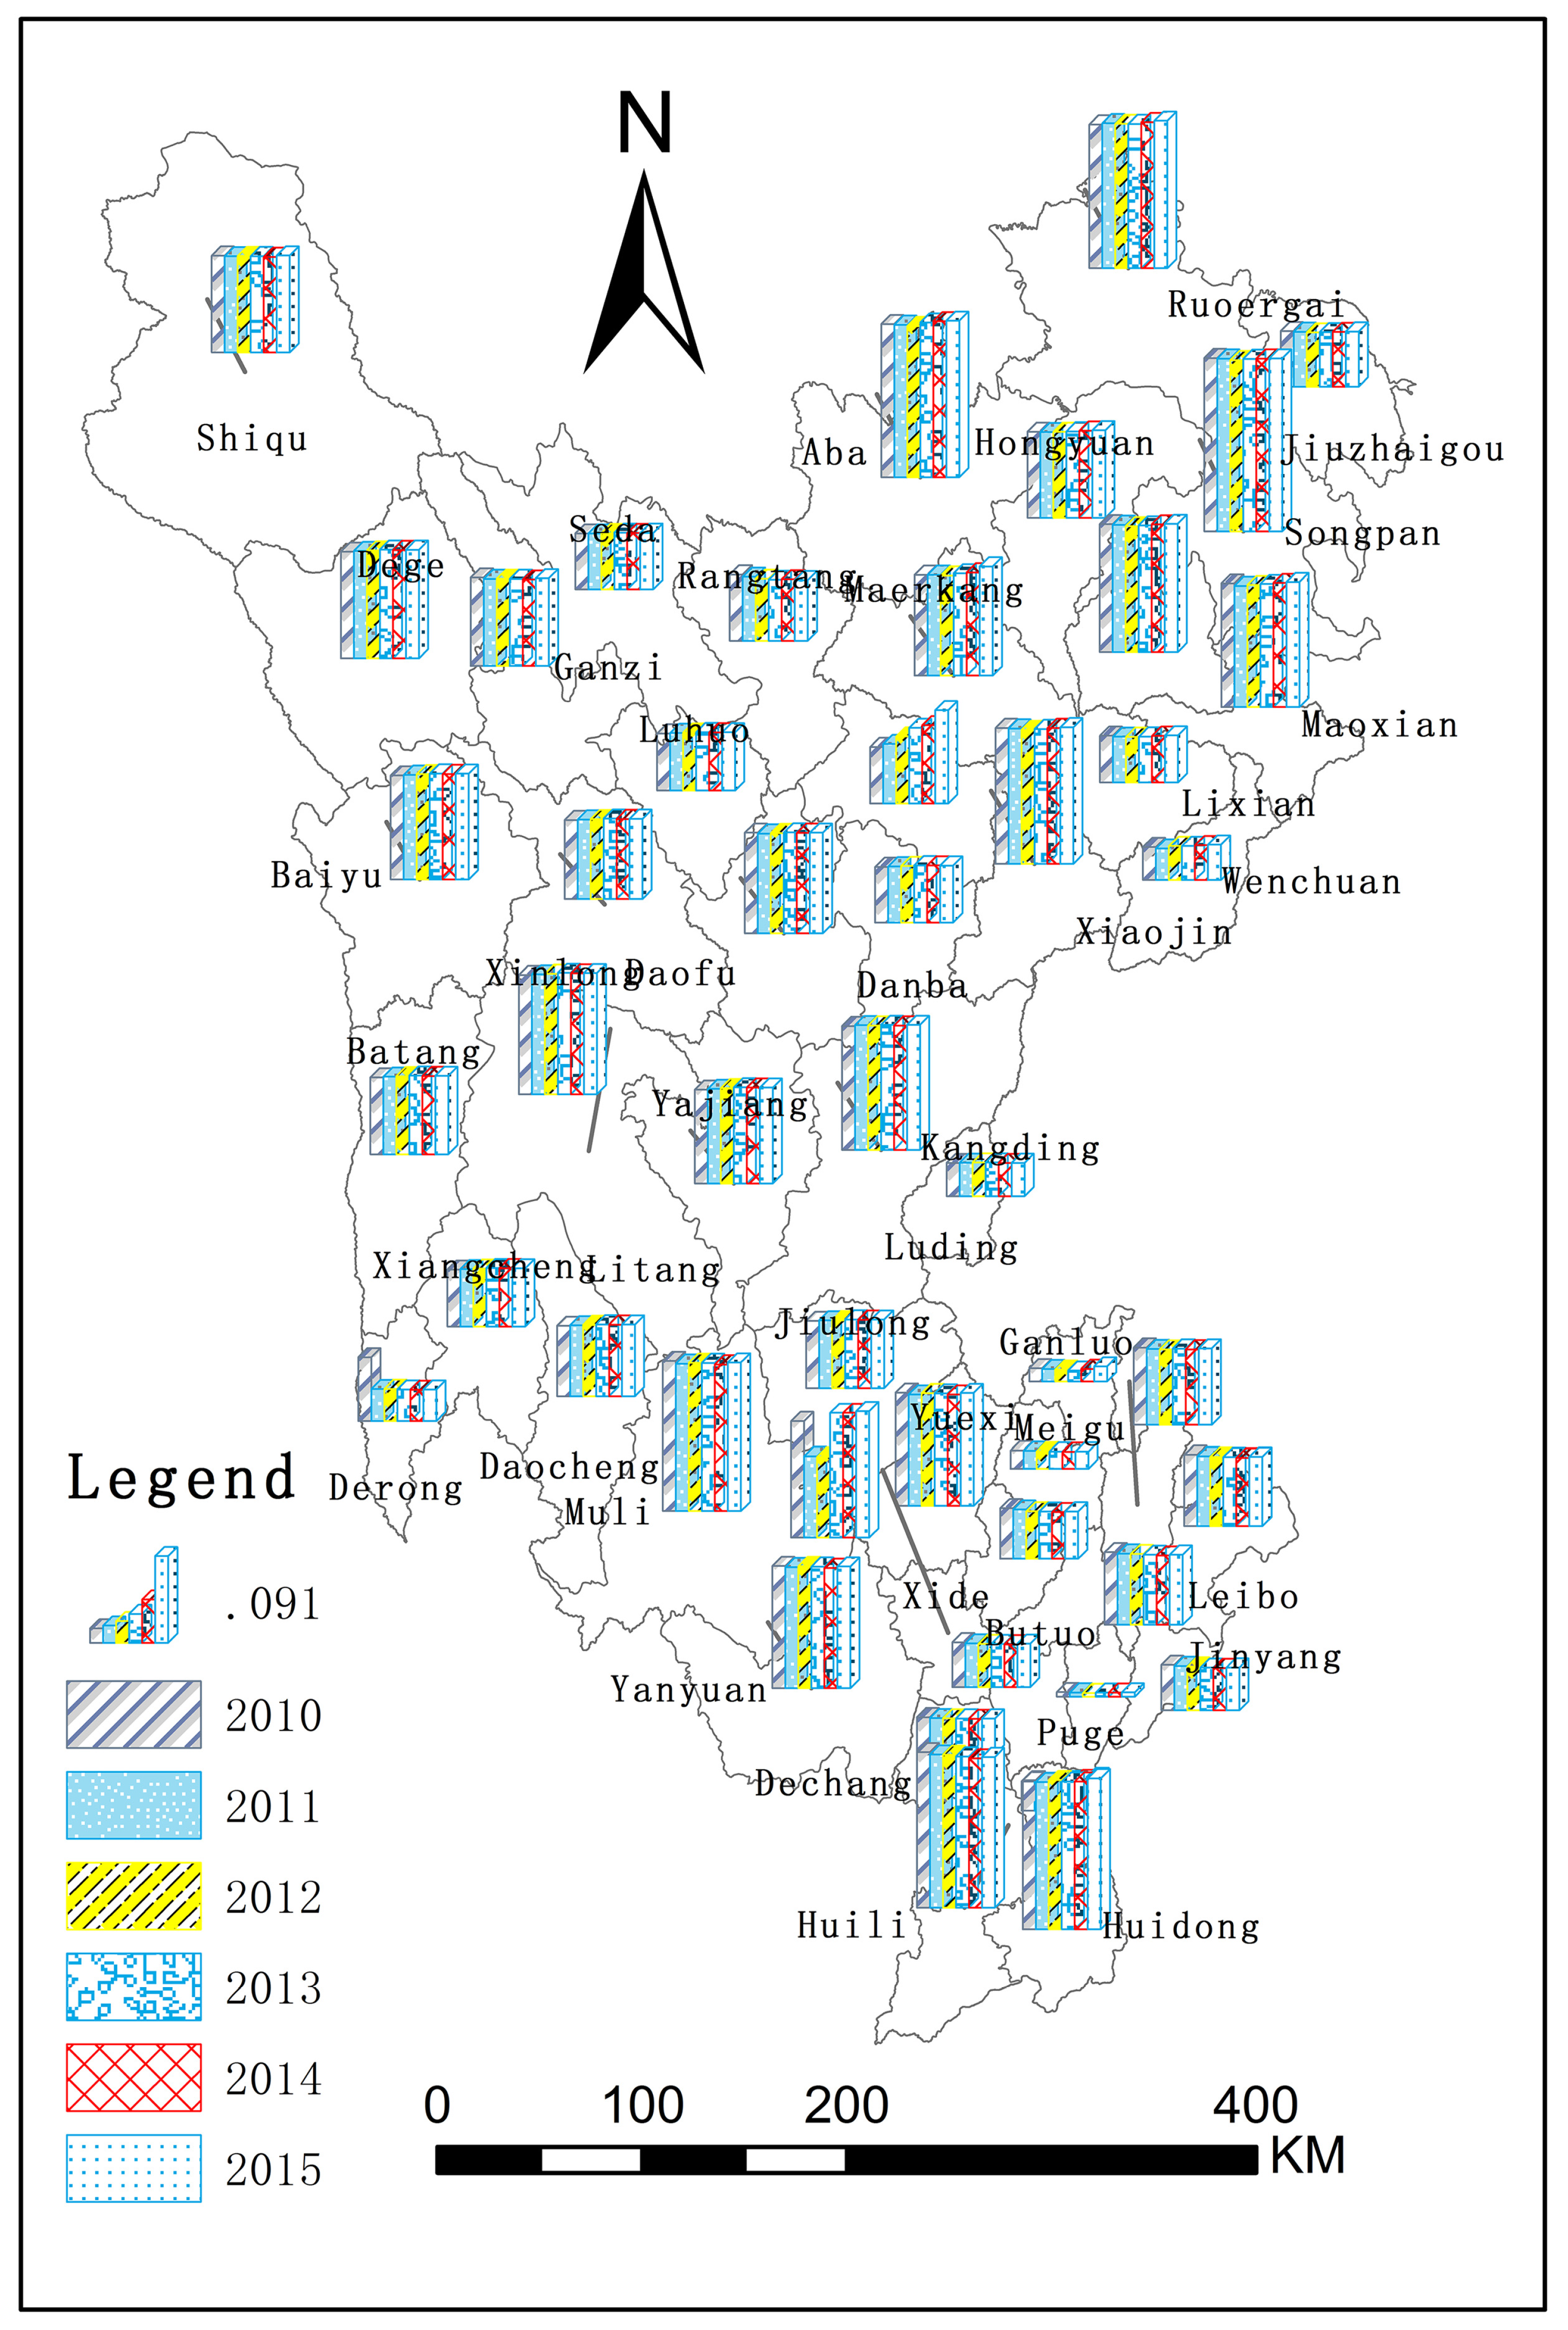
3.1. Descriptive Statistics
3.1.1. Livelihood Capital Level
3.1.2. Scale and Structure of Fiscal Expenditure
3.2. Econometric Model Results
3.2.1. Unit Root Test and Co-Integration Test of Panel Data
- (1)
- Unit root test. Although the panel data reflect the information in the section, there are still time-series data. The panel data also have the possibility of a unit root. In this paper, the LLC test, IPS test, Fisher–ADF test, and Fisher–PP test were used to conduct unit root tests for explained variables and explanatory variables. If the panel data pass three or more of the four methods, the panel data are stable. The specific test results are as follows:
- (2)
- Cointegration test. After confirming that variable indexes can be used for panel analysis, the KAO test method was adopted to conduct a co-integration test of panel data. The test results are as follows:
3.2.2. The Impact of the Fiscal Expenditure Scale on Livelihood Capital
- (1)
- Panel model selection test. Firstly, the Hausman test was used to determine whether the random effect model or the fixed effect model should be used. Assuming that there was a random effect in the model, and the original hypothesis would be accepted if the p-value was greater than 0.05: “the random effect is not related to explanatory variables”. The test results are as Table 3:
3.2.3. The Impact of Fiscal Expenditure Structure on Livelihood Capital
- (1)
- Panel model selection test. Firstly, the Hausman test was used to determine whether the random effect panel data model or the fixed effect panel data model should be established. When P was more than 0.05, the random effect model was generally adopted. Otherwise, the fixed-effect model was adopted. The test results are as Table 5:
4. Discussion
5. Conclusions and Policy Implications
5.1. Conclusions
- (1)
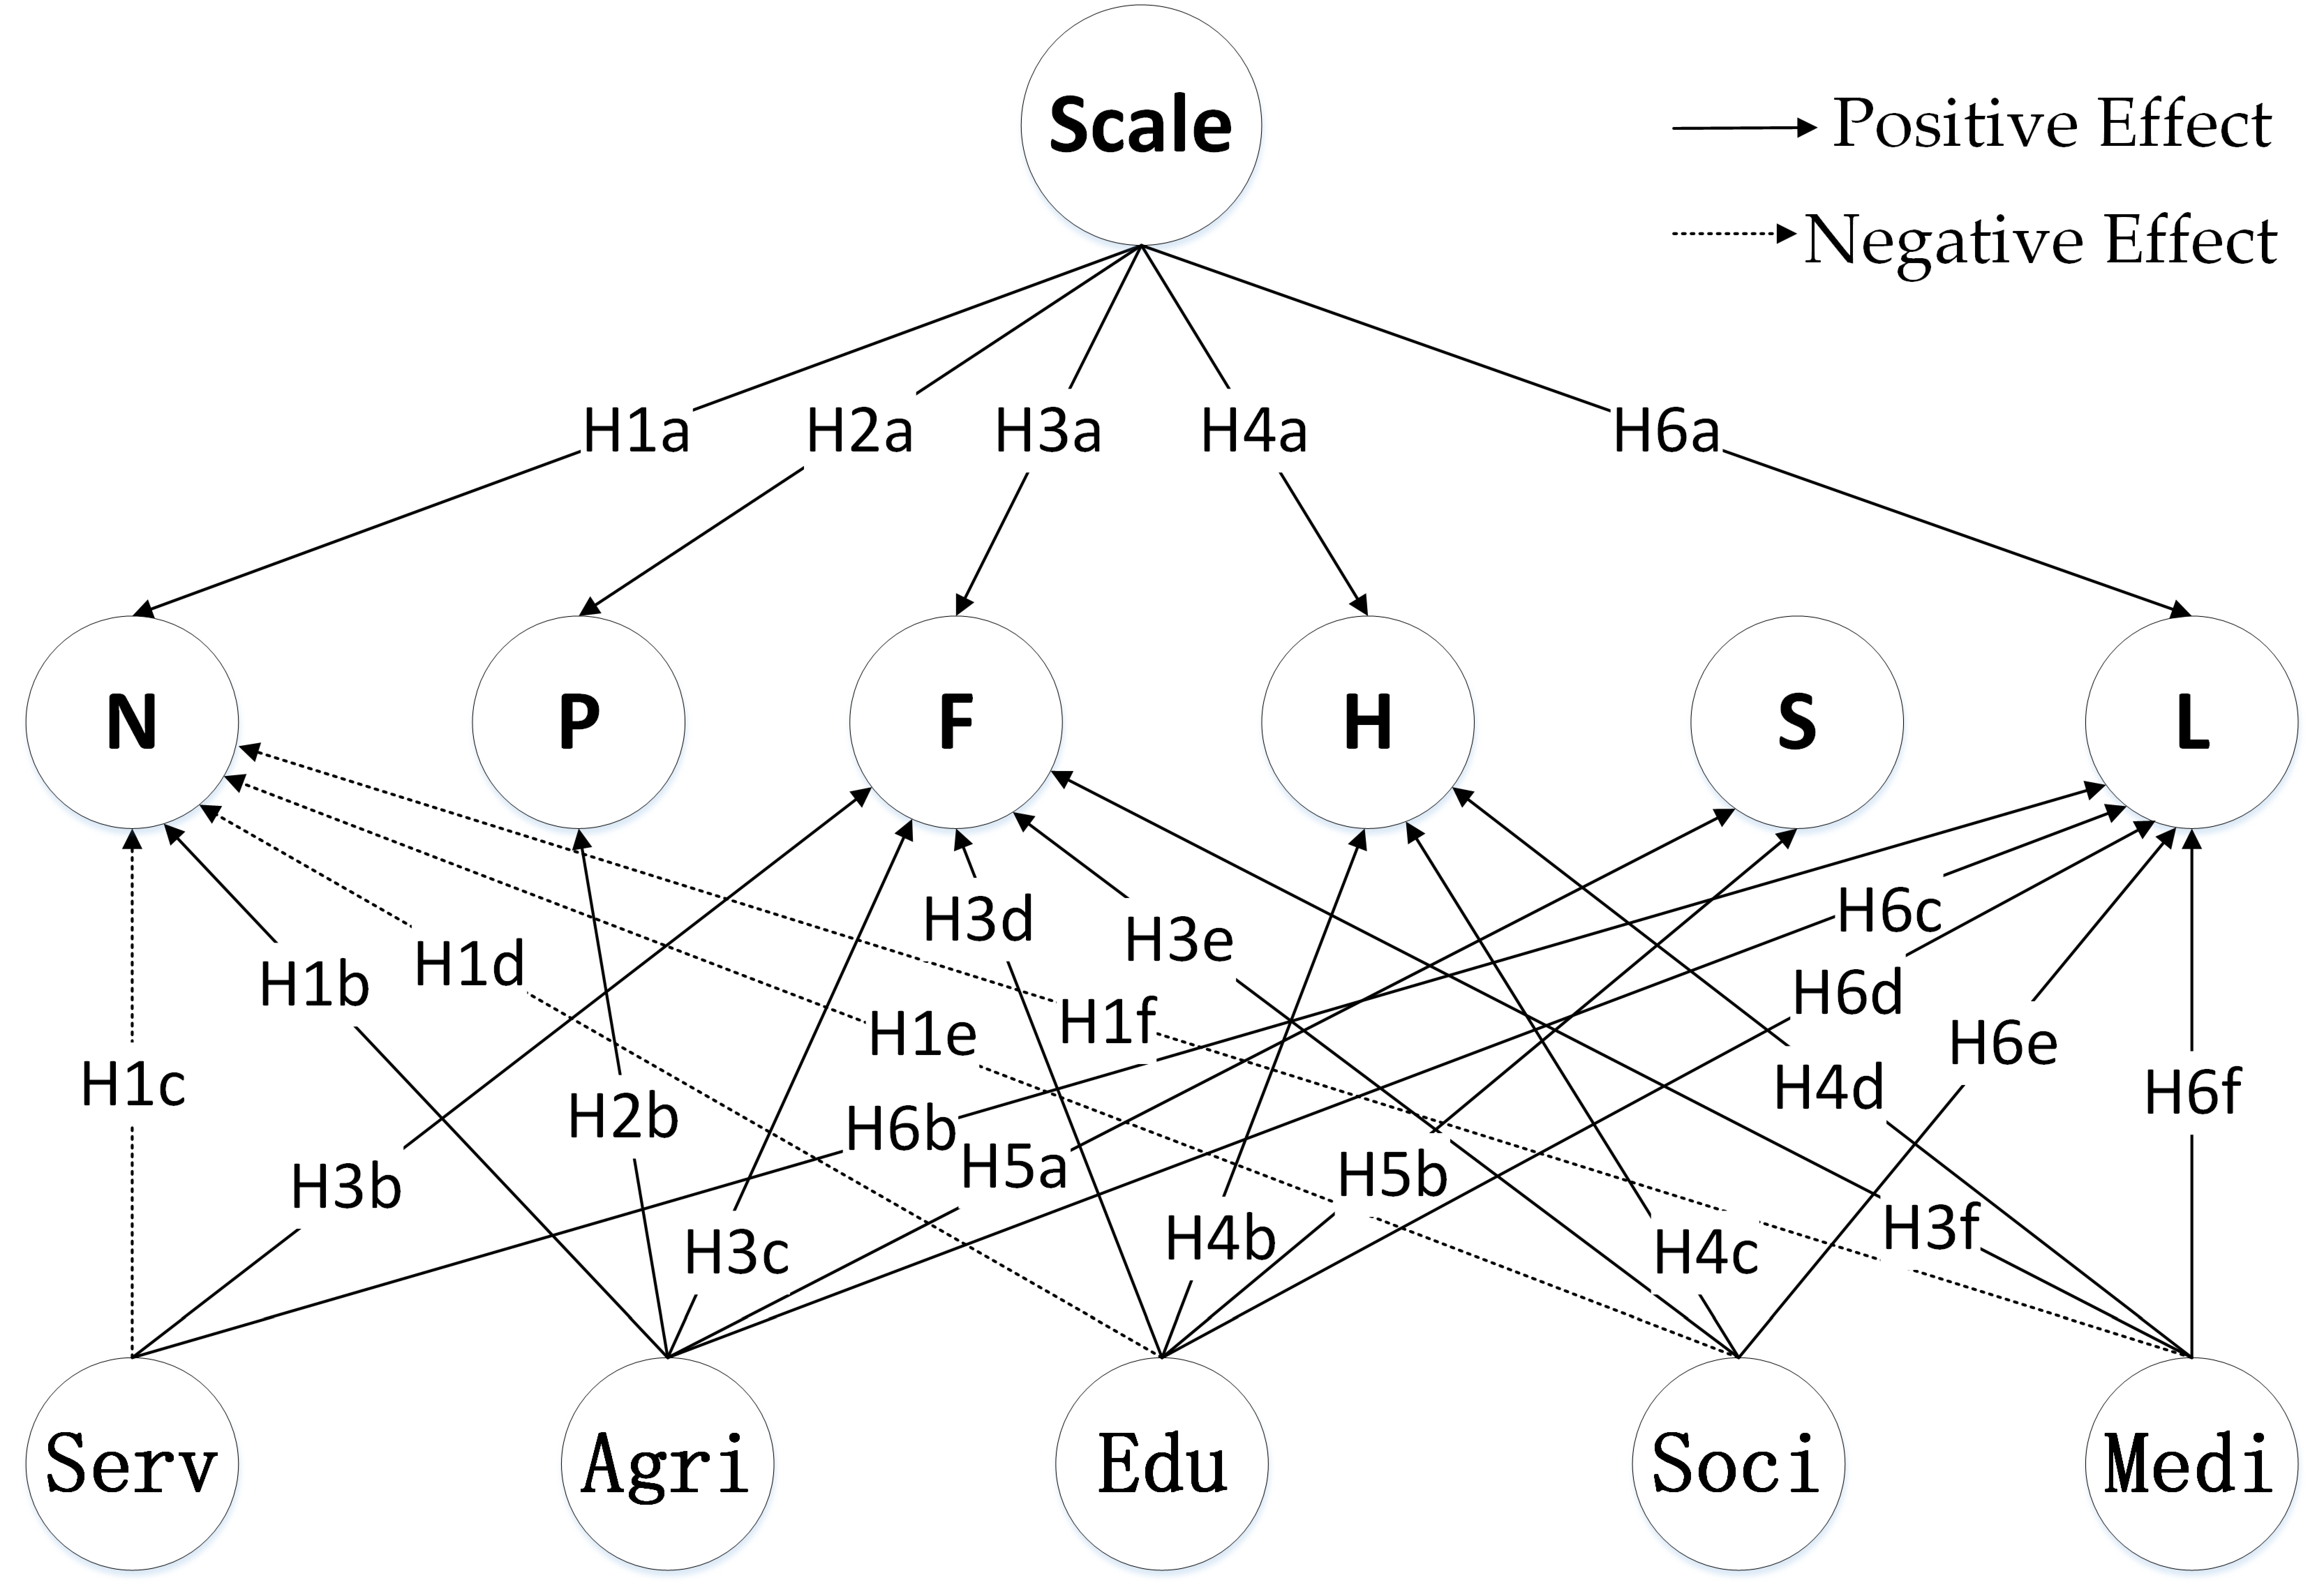
- Characteristics of livelihood capital: From 2010 to 2015, the average stock of human capital in the three states was the highest during the livelihood capital composition, followed by physical capital, natural capital, and finally, financial capital and social capital;
- (2)
- Natural capital and physical capital were positively affected by the total scale of fiscal expenditure, agriculture, forestry, and water expenditure, and the former was negatively affected by general public service expenditure, education expenditure, social security and employment expenditure, and medical expenditure;
- (3)
- Financial capital and the total amount of livelihood capital were positively affected by the total scale of fiscal expenditure, agriculture, forestry and water expenditure, education expenditure, social security and employment expenditure, and medical expenditure, and negatively affected by general public service expenditure;
- (4)
- Human capital was positively affected by the total scale of fiscal expenditure, education expenditure, social security and employment expenditure, and medical expenditure;
- (5)
- Social capital was positively affected by agriculture, forestry and water expenditure, and education expenditure.
5.2. Policy Implications
Author Contributions
Funding
Institutional Review Board Statement
Informed Consent Statement
Data Availability Statement
Conflicts of Interest
References
- Cui, P. Progress in Research on Mountain Diasters in China and Scientific Issues to Be Concerned in the Future. Prog. Geogr. 2010, 33, 145–152. [Google Scholar] [CrossRef]
- Chen, G.J.; Fang, Y.P.; Chen, Y. China Mountain Development Report—Research on Mountain Settlement in China; The Commercial Press: Beijing, China, 2007. [Google Scholar]
- Su, F.; Shang, H.Y. The Impact of Farmers’ Livelihood Capital on Their Risk Coping Strategies: Taking Zhangye City in the Heihe River Basin as an Example. China Rural. Econ. 2012, 8, 79–87. [Google Scholar]
- Xin, G.X.; Yan, J.Z.; Yang, Q.Y. The Changes of Rural Households’ Living Life and Their Livelihood Transformation in New Rural Construction. J. Southwest Univ. 2012, 34, 122–130. [Google Scholar] [CrossRef]
- Su, F.; Pu, X.D. Research on the relationship between livelihood capital and livelihood strategy. China Popul. Resour. Environ. 2009, 6, 119–124. [Google Scholar]
- Liu, C.F.; Liu, Y.Y.; Wang, C. Characteristics and Influencing Factors of Livelihood Capital of Poor Farmers in Loess Hilly Region: Taking Suizhong County of Gansu Province as an Example. Econ. Geogr. 2017, 37, 153–162. [Google Scholar] [CrossRef]
- Kenneth, J.A.; Mordecai, K. Optimal growth with irreversible investment in a Ramsey model. Econom. J. Econom. Soc. 1970, 38, 331–344. [Google Scholar] [CrossRef]
- Barro, R.J. Government Spending in A Simple Model of Endogenous Growth. J. Political Econ. 1990, 98, S103–S125. [Google Scholar] [CrossRef] [Green Version]
- Gong, L.T.; Zou, H.Y. The impact of government public spending growth and volatility on economic growth. Foreign Econ. Theory Rev. 2001, 9, 58–63. [Google Scholar]
- Helms, L.J. The effect of State and Local Taxes on Economics Growth, A Time Series—Cross Section Approach. Rev. Econ. Stat. 1985, 67, 574–582. [Google Scholar] [CrossRef]
- Easterly, R. Fiscal Policy and Economic Growth, An Empirical Investigation. J. Monet. Econ. 1993, 32, 417–458. [Google Scholar] [CrossRef]
- Cai, Z.Z. An Econometric Analysis of the Contribution of Education to Economic Growth: An Empirical Basis of the Strategy of Rejuvenating the Country through Science and Education. Econ. Res. 1999, 2, 40–48. [Google Scholar]
- Cai, Z.H. Analysis of Livelihood Capital of Farmers in Poor Villages in Wenchuan Earthquake Area. China Rural. Econ. 2010, 12, 55–67. [Google Scholar]
- He, R.W.; Liu, S.Q.; Liu, Y.W. Evaluation of livelihood capital of typical mountain farmers and its spatial pattern: Taking Liangshan Yi Autonomous Prefecture in Sichuan Province as an example. J. Mt. Res. 2014, 32, 641–651. [Google Scholar] [CrossRef]
- Nawrotzki, J.R.; Huntrer, M.L.; Dickinson, W.T. Rural livelihood and access to natural capitals: Differences between migrants and non-migrants in Madagascar. Demogr. Res. 2012, 26, 661–700. [Google Scholar] [CrossRef] [PubMed] [Green Version]
- Cui, S.Y.; Xu, D.D.; Peng, L.; Liu, S.Q. Characteristics and Differences of Subsistence Immigrants and Aboriginal Livelihood Capital in the Three Gorges Reservoir Area: Taking Wanzhou District of Chongqing as an Example. J. Southwest China Norm. Univ. (Nat. Sci. Ed.) 2016, 4, 80–86. [Google Scholar] [CrossRef]
- Xu, D.D.; Zhang, J.F.; Rasul, G.; Liu, S.Q.; Xie, F.T.; Cao, M.T. Household livelihood strategies and dependence on agriculture in the mountainous settlements in the Three Gorges reservoir area, China. Sustainability 2015, 7, 4850–4869. [Google Scholar] [CrossRef] [Green Version]
- Ellis, F. Rural Livelihoods and Diversity in Developing Countries; Oxford University Press: New York, NY, USA, 2000. [Google Scholar]
- Noelia, Z.C.; Raquel, M.P. Exploring local people’s views on the livelihood impacts of privately versus community managed conservation strategies in the Ruvuma landscape of North Mozambique-South Tanzania. J. Environ. Manag. 2017, 11, 853–862. [Google Scholar] [CrossRef]
- Du, Y.H.; Huang, X.Z. Research on the relationship between financial capital agricultural expenditure and farmers’ income. Stat. Res. 2006, 9, 47–50. [Google Scholar] [CrossRef]
- Li, H.Z.; Qian, Z.H. Financial Supporting Agriculture Policy and Agricultural Growth in China, Analysis of Causality and Structure. China Rural. Econ. 2004, 8, 38–43. [Google Scholar]
- Liu, H. An empirical analysis of the impact of fiscal support for agriculture on agricultural economic growth. Agric. Econ. Issues 2008, 10, 30–35. [Google Scholar] [CrossRef]
- Meng, Z.X.; Meng, H.S. An Empirical Study on the Relationship between Financial Expenditure and Farmers’ Income in Shanxi Province. China Urban Econ. 2011, 3. [Google Scholar]
- Wang, H.Y.; Meng, Q.S.; Yan, H.S.; Tang, K. Research on the Relationship between Fiscal Agricultural Expenditure and Peasant Income Growth. J. Northwest A&F Univ. (Soc. Sci. Ed.) 2014, 14, 72–79. [Google Scholar] [CrossRef]
- Yang, C.M. An Empirical Analysis of the Sources of Farmers’ Income in China: Also on the Countermeasures to Increase Farmers’ Income. Financ. Trade Econ. 2007, 2. [Google Scholar]
- Xiong, J.F.; Ding, S.J. Invalidity test of the impact of “NRCMS” on farmers’ livelihood strategies. Econ. Issues 2010, 1, 15–22. [Google Scholar] [CrossRef]
- Wang, M.; Pan, Y.H. Research on the relationship between fiscal agricultural investment and farmers’ net income. Agric. Econ. Issues 2007, 5, 99–105. [Google Scholar] [CrossRef]
- Yan, C.L.; Gong, L.T. Financial expenditure, tax expenditure, taxation and long-term economic growth. Econ. Res. 2009, 6. [Google Scholar]
- Xie, X.X.; Zhang, S.Q.; Zhu, S.T. Effects of Returning Farmland to Forests on Sustainable Livelihood of Farmers. J. Peking Univ. (Nat. Sci.) 2010, 46, 457–464. [Google Scholar] [CrossRef]
- Zhu, Y.C. Research on the income distribution effect of China’s financial support for agriculture. Contemp. Financ. Econ. 2013, 9, 39–48. [Google Scholar]
- Luo, D.; Jiao, J. Empirical study on the impact of national financial support for farmers on farmers’ income. Agric. Econ. Issues 2014, 12, 48–53. [Google Scholar] [CrossRef]
- Li, C.; Liu, W.; Huang, Q. Analysis of the Status Quo and Influencing Factors of Farmers’ Livelihood Capital in the Background of Relocation of Southern Shaanxi Immigrants. Contemp. Econ. Sci. 2014, 36, 106–126. [Google Scholar] [CrossRef]
- Huang, X.Z.; Wang, H.L. On the Performance of China’s Financial Supporting Agriculture Funds from the Perspective of Increasing Farmers’ Income. J. Cent. Univ. Financ. Econ. 2005, 1, 10–13. [Google Scholar] [CrossRef]
- Shui, W.; Bai, J.P.; Zhang, S. Analysis of the influencing factors on resettled farmer’s satisfaction under the policy of the balance between urban construction land increasing and rural construction land decreasing. Sustainability 2014, 6, 8522–8535. [Google Scholar] [CrossRef] [Green Version]
- Fearnside, P.M. Challenges for sustainable development in Brazilian Amazonia. Sustain. Dev. 2018, 26, 141–149. [Google Scholar] [CrossRef]
- Asongu, S.A.; Odhiambo, N.M. Environmental degradation and inclusive human development in sub-Saharan Africa. Sustain. Dev. 2019, 27, 25–34. [Google Scholar] [CrossRef] [Green Version]
- Lan, X.; Weng, L.F.; Yu, H.Z. Addressing policy challenges in implementing Sustainable Development Goals through an adaptive governance approach: A view from transitional China. Sustain. Dev. 2018, 26, 150–158. [Google Scholar] [CrossRef]
- Nölting, B.; Mann, C. Governance strategy for sustainable land management and water reuse: Challenges for transdisciplinary research. Sustain. Dev. 2018, 26, 691–700. [Google Scholar] [CrossRef]
- Zhang, W.M. Evaluation Model of Urban Sustainable Development Based on Entropy Method. J. Xiamen Univ. (Philos. Soc. Sci.) 2004, 2, 109–115. [Google Scholar] [CrossRef]
- Shao, X.K.; Hu, H.G. Endogenous in the empirical study of economic growth. China Popul. Resour. Environ. 2015, 3, 109–118. [Google Scholar]
- Liu, J. The impact of sustainable livelihood capital on Farmers’ Income: An Empirical Study Based on information entropy method. Stat. Decis. Mak. 2012, 17, 103–105. [Google Scholar]
- Xu, D.D.; Peng, L.; Liu, S.Q.; Chen, T.T. Influences of migrant work income on the poverty vulnerability disaster threatened area, A case study of the Three Gorges Reservoir area, China. Int. J. Disaster Risk Reduct. 2017, 22, 62–70. [Google Scholar] [CrossRef]
- Zhang, Y. Research on the realization path of financial support for farmers’ sustainable livelihood in the Lijiang River Basin. Mod. Mark. 2020, 5, 48–49. [Google Scholar]
- Ye, H. Analysis on the impact of public finance policy on Farmers’ income under the framework of livelihood capital—Based on the survey of two minority poor counties in Chongqing. J. Cent. South Univ. Natl. (Humanit. Soc. Sci.) 2015, 35, 114–119. [Google Scholar]


| Variable | LLC Inspection | IPS Inspection | Fisher-ADF Inspection | Fisher-PP Inspection | Conclusion | ||||
|---|---|---|---|---|---|---|---|---|---|
| Statistic | Prob. | Statistic | Prob. | Statistic | Prob. | Statistic | Prob. | ||
| Ln(L) | −58.2228 | 0.0000 | −8.1172 | 0.0000 | 169.886 | 0.0000 | 240.732 | 0.0000 | smooth |
| Ln(N) | −10.8309 | 0.0000 | −1.9693 | 0.0000 | 139.498 | 0.0010 | 221.014 | 0.0000 | smooth |
| Ln(H) | −9.4903 | 0.0000 | 1.0279 | 0.8480 | 91.6564 | 0.4316 | 148.349 | 0.0001 | unsmooth |
| Ln(F) | −20.9230 | 0.0000 | −4.3754 | 0.0000 | 166.355 | 0.0000 | 256.927 | 0.0000 | smooth |
| Ln(P) | −15.7834 | 0.0000 | −3.1471 | 0.0008 | 136.790 | 0.0026 | 157.768 | 0.0000 | smooth |
| Ln(S) | −4.2573 | 0.0000 | −0.4374 | 0.3309 | 118.305 | 0.0338 | 159.544 | 0.0000 | unsmooth |
| Ln(scale) | −6.4886 | 0.0000 | −1.2572 | 0.1043 | 135.138 | 0.0035 | 176.209 | 0.0000 | unsmooth |
| Ln(serv) | −1.0002 | 0.1586 | 2.5064 | 0.9939 | 79.2989 | 0.8609 | 96.6032 | 0.4065 | unsmooth |
| Ln(agri) | −26.8221 | 0.0000 | −7.0439 | 0.0000 | 217.499 | 0.0000 | 263.765 | 0.0000 | smooth |
| Ln(edu) | −15.6641 | 0.0000 | −2.5413 | 0.0055 | 132.798 | 0.0052 | 152.080 | 0.0001 | smooth |
| Ln(soci) | −13.8534 | 0.0000 | −2.6424 | 0.0041 | 145.934 | 0.0005 | 212.445 | 0.0000 | smooth |
| Ln(medi) | −31.5377 | 0.0000 | −6.3457 | 0.0000 | 199.340 | 0.0000 | 250.617 | 0.0000 | smooth |
| D(Ln(H)) | −13.7270 | 0.0000 | −3.5690 | 0.0002 | 118.433 | 0.0239 | 145.353 | 0.0002 | smooth |
| D(Ln(S)) | −20.5257 | 0.0000 | −8.3196 | 0.0000 | 191.713 | 0.0000 | 231.648 | 0.0000 | smooth |
| D(Ln(scale)) | −32.2714 | 0.0000 | −11.1713 | 0.0000 | 236.607 | 0.0000 | 253.670 | 0.0000 | smooth |
| D(Ln(serv)) | −26.6454 | 0.0000 | −7.1366 | 0.0000 | 159.854 | 0.0000 | 175.612 | 0.0000 | smooth |
| D(X1) | −18.1361 | 0.0000 | −8.2638 | 0.0000 | 182.687 | 0.0000 | 217.028 | 0.0000 | smooth |
| Inspection Methods | Statistics of | Statistical Quantity | p-Values |
|---|---|---|---|
| KAO inspection | ADF | −4.1044 | 0.0000 |
| Dependent Variable | Chi-Sq. Statistic | p-Values | Select the Model |
|---|---|---|---|
| Ln(L) | 14.5117 | 0.0127 | Fixed effect model |
| Ln(N) | 6.6073 | 0.2515 | Stochastic effect model |
| Ln(H) | 9.8278 | 0.0803 | Stochastic effect model |
| Ln(F) | 21.9866 | 0.0005 | Fixed effect model |
| Ln(P) | 14.2657 | 0.0140 | Fixed effect model |
| Ln(S) | 13.7952 | 0.0170 | Fixed effect model |
| Variables | Total Livelihood Capital | Natural Capital | Human Capital | Financial Capital | Physical Capital | Social Capital | ||||||
|---|---|---|---|---|---|---|---|---|---|---|---|---|
| Model 1 | Model 2 | Model 3 | Model 4 | Model 5 | Model 6 | Model 7 | Model 8 | Model 9 | Model 10 | Model 11 | Model 12 | |
| Ln(L(−1)) | 0.900 *** (−43.32) | 0.748 *** (14.94) | ||||||||||
| Ln(N(−1)) | 0.360 *** (−41.54) | 0.299 *** (−15.52) | ||||||||||
| Ln(H(−1)) | −0.138 *** (−25.88) | −0.26 *** (−17.82) | ||||||||||
| Ln(F(−1)) | 0.741 *** (−31.54) | 0.820 *** (−21.36) | ||||||||||
| Ln(P(−1)) | 0.862 *** (−18.56) | 1.058 *** (−12.18) | ||||||||||
| Ln(S(−1)0 | 0.812 *** (−33) | 0.658 *** (−21.17) | ||||||||||
| Ln(Scale) | 0.025 * (−1.78) | 0.010 * (−0.3) | 0.075 *** (−11.57) | 0.038 *** (−3.55) | 0.294 *** (−4.47) | 0.02 *** (−0.36) | 0.359 *** (−4.03) | 0.323 ** (−1.21) | 0.080 *** (−4.62) | 0.039 ** (−1.81) | −0.198 (−4.20) | 0.101 (−2.22) |
| Ln(Pergdp) | 0.071 *** (1.51) | −0.074 ** (−2.33) | 0.85 *** (−4.37) | 0.217 *** (−1.1) | 0.102 ** (−0.87) | 0.243 (−1) | ||||||
| Ln(Invest) | 0.014 * (−0.91) | −0.057 * (−4.14) | 0.21 *** (−3.47) | 0.107 * (−1.73) | −0.048 (−1.33) | 0.071 (−0.69) | ||||||
| Ln(Mino) | −0.346 ** (−0.71) | 0.707 ** (−2.46) | −4.23 ** (−2.52) | −2.08 ** (−2.25) | 0.620 *** (−2.82) | −0.085 (−0.29) | ||||||
| Ln(Way) | 0.119 *** (−2.05) | −0.104 *** (−3.20) | 0.50 * (−1.86) | 0.406 ** (−1.45) | 0.087 ** (−2.01) | 0.306 (−1.47) | ||||||
| Sarganχ2(d) | 16.06 (−10) | 11.78 (−10) | 20.69 (−10) | 23.78 (−10) | 21.04 (−10) | 18.78 (−10) | 24.17 (−10) | 13.76 (−10) | 29.49 (−10) | 25.41 (−10) | 12.25 (−10) | 21.21 (−10) |
| Sargan P | 0.10 | 0.30 | 0.23 | 0.08 | 0.21 | 0.43 | 0.07 | 0.18 | 0.10 | 0.46 | 0.27 | 0.10 |
| AR(2)P | 0.57 | 0.39 | 0.11 | 0.17 | 0.31 | 0.31 | 0.16 | 0.16 | 0.61 | 0.58 | 0.60 | 0.72 |
| Dependent Variable | Chi-Sq. Statistic | p-Values | Select the Model |
|---|---|---|---|
| Ln(L) | 44.1814 | 0.0000 | Fixed effect model |
| Ln(N) | 15.2392 | 0.1236 | Stochastic effect model |
| Ln(H) | 13.8866 | 0.1782 | Stochastic effect model |
| Ln(F) | 23.5164 | 0.0090 | Fixed effect model |
| Ln(P) | 8.6153 | 0.5690 | Stochastic effect model |
| Ln(S) | 11.5976 | 0.3129 | Stochastic effect model |
| Variables | Total Livelihood Capital | Natural Capital | Human Capital | Financial Capital | Physical Capital | Social Capital | ||||||
|---|---|---|---|---|---|---|---|---|---|---|---|---|
| Model 13 | Model 14 | Model15 | Model 16 | Mode l17 | Model 18 | Model 19 | Model 20 | Model 21 | Model 22 | Model 23 | Model 24 | |
| Ln(L(-1)) | 0.901 *** (−36) | 0.758 *** (−17.72) | ||||||||||
| Ln(N(-1)) | 0.315 *** (−41.07) | 0.267 *** (−10.23) | ||||||||||
| Ln(H(-1)) | −0.129 *** (−20.47) | −0.242 *** (−10.00) | ||||||||||
| Ln(F(-1)) | 0.694 *** (−64.19) | 0.824 *** (−14.77) | ||||||||||
| Ln(P(-1)) | 0.971 *** (−21.66) | 1.116 *** (−9.22) | ||||||||||
| Ln(S(-1) | 0.792 *** (−31.68) | 0.660 *** (−20.59) | ||||||||||
| Ln(Serv) | −0.013 * (−0.46) | −0.041 * (−1.12) | −0.069 *** (−3.42) | −0.108 *** (−4.55) | −0.112 (−2.17) | 0.112 −0.93 | −0.627 *** (−3.93) | −0.483 ** −2.46 | 0.024 (−0.33) | −0.01 (−0.11) | 0.286 −1.19 | −0.066 (−0.31) |
| Ln(Agri) | 0.116 ** (−0.3) | 0.403 ** (−0.77) | 0.586 * (−1.82) | 0.663 ** (−2.18) | −0.268 (−3.30) | −0.257 (−1.20) | 0.129 ** (−0.67) | 0.090 ** (−0.43) | 0.078 * (−0.78) | 0.188 ** (−1.78) | 0.535 * (−2.69) | 0.481 * (−1.88) |
| Ln(Edu) | 0.115 ** (−0.34) | 0.595 ** (−1.43) | −0.097 *** (−5.27) | −0.117 *** (−6.49) | 0.475 *** (−4.02) | 0.450 *** (−4.24) | 0.072 * (−0.41) | 0.589 ** (−2.1) | −0.13 (−1.68) | −0.091 (−1.22) | 0.338 ** (−2.17) | 0.326 * (−1.7) |
| Ln(Soci) | 0.101 ** (−0.45) | 0.051 * (−1.21) | −0.017 ** (−2.51) | −0.099 *** (−3.20) | 0.045 *** (−0.92) | 0.101 ** (−0.82) | 0.772 ** (−4.08) | 0.552 ** (−2.55) | −0.073 (−0.98) | −0.143 (−1.55) | 0.58 (−5.77) | 0.436 (−3.44) |
| Ln(Medi) | 0.027 * (−0.74) | 0.045 * (−0.95) | −0.067 *** (−4.56) | −0.147 *** (−7.76) | 0.330 *** (−3.83) | 0.224 ** (−1.26) | 0.198 ** (−1.13) | 0.252 ** (−1.12) | −0.125 (−1.46) | −0.141 (−1.51) | 0.069 (−0.34) | −0.115 (−0.48) |
| Ln(Pergdp) | 0.437 ** (−0.82) | −0.088 *** (−2.72) | 0.543 ** (−2.26) | 0.515 ** (−1.93) | 0.015 ** (−0.12) | 0.006 (−0.02) | ||||||
| Ln(Invest) | 0.03 (−2.43) | −0.054 *** (−4.41) | 0.169 ** (−2.25) | 0.029 *** (−0.44) | −0.055 (−1.57) | 0.136 (−1.29) | ||||||
| Ln(Mino) | −0.111 *** (−1.16) | 0.619 (−1.63) | −0.333 ** (−1.55) | −0.519 ** (−2.03) | 0.803 ** (−2.98) | −0.561 ** (−2.04) | ||||||
| Ln(Way) | 0.125 * (−1.72) | −0.208 *** (−3.81) | 0.109 ** (−0.54) | 0.052 ** (−0.18) | −0.075 (−1.44) | 0.088 (−0.45) | ||||||
| Sarganχ2 (d) | 11.048 (−10) | 14.1111 (−10) | 22.4752 (−10) | 20.7586 (−10) | 25.2916 (−10) | 11.7704 (−10) | 25.6425 (−10) | 14.3549 (−10) | 21.2546 (−10) | 12.6974 (−10) | 20.8281 (−10) | |
| Sargan P | 0.3538 | 0.168 | 0.1291 | 0.228 | 0.48 | 0.3007 | 0.4331 | 0.1574 | 0.194 | 0.2411 | 0.2231 | |
| AR(2)P | 0.5091 | 0.4022 | 0.1614 | 0.286 | 0.307 | 0.3086 | 0.1547 | 0.1568 | 0.4364 | 0.5781 | 0.6077 | |
Publisher’s Note: MDPI stays neutral with regard to jurisdictional claims in published maps and institutional affiliations. |
© 2022 by the authors. Licensee MDPI, Basel, Switzerland. This article is an open access article distributed under the terms and conditions of the Creative Commons Attribution (CC BY) license (https://creativecommons.org/licenses/by/4.0/).
Share and Cite
Guo, S.; Wang, B.; Zhou, K.; Wang, H.; Zeng, Q.; Xu, D. Impact of Fiscal Expenditure on Farmers’ Livelihood Capital in the Ethnic Minority Mountainous Region of Sichuan, China. Agriculture 2022, 12, 881. https://doi.org/10.3390/agriculture12060881
Guo S, Wang B, Zhou K, Wang H, Zeng Q, Xu D. Impact of Fiscal Expenditure on Farmers’ Livelihood Capital in the Ethnic Minority Mountainous Region of Sichuan, China. Agriculture. 2022; 12(6):881. https://doi.org/10.3390/agriculture12060881
Chicago/Turabian StyleGuo, Shili, Beibei Wang, Kui Zhou, Hui Wang, Qiuping Zeng, and Dingde Xu. 2022. "Impact of Fiscal Expenditure on Farmers’ Livelihood Capital in the Ethnic Minority Mountainous Region of Sichuan, China" Agriculture 12, no. 6: 881. https://doi.org/10.3390/agriculture12060881
APA StyleGuo, S., Wang, B., Zhou, K., Wang, H., Zeng, Q., & Xu, D. (2022). Impact of Fiscal Expenditure on Farmers’ Livelihood Capital in the Ethnic Minority Mountainous Region of Sichuan, China. Agriculture, 12(6), 881. https://doi.org/10.3390/agriculture12060881