3.1. Feature Selection
The average values of the image parameters from different pineapple cultivars are tabulated in
Table 1. All image parameters of different pineapple cultivars had significant differences at the 95% confidence level (
p < 0.05). The values in all image parameters were calculated as a pixel count. The highest eccentricity and perimeter were found in the MD2 cultivar with the values of 0.72 and 1464.30, respectively. For the Josapine cultivar, the highest values of the image parameters were obtained in area (63976.00), orientation (0.70), and extent (0.84). On the other hand, the image parameter values remained unchanged for minimum intensity (0.54), maximum of ROI (0.97), and minimum of ROI (0.55) for all pineapple cultivars, respectively. As for the remaining image parameters, the highest values were found in Morris including centroid (157.39), major axis length (393.74), minor axis length (292.21), maximum intensity (0.96), mean intensity (0.67), and mean of ROI (0.81). For this reason, the utilisation of image parameters was best described to define the behaviour of the thermal images, contributing to the high dependency based on different pineapple cultivars.
In order to explore the dataset, a quantitative feature comparison was determined to evaluate the differences between the pineapple cultivars for the classification task. It was revealed that the distribution of image parameter values was significantly different between all pineapple cultivars. Considering the difference in the fruit cultivar, the temperature differences were attributed to the selected features of the thermal images [
35]. The changes of image parameters showed the pixel distribution based on the temperature mapping attained at the surface of the pineapples for different fruit cultivars. The image features were the basic elements for the cultivar discrimination, which would be useful in determining the characteristics and parameters of the sample [
36]. Apart from that, the output from the feature selection of the image parameters is applied as input for developing machine learning algorithms to further improve the classification accuracy.
3.2. Relationship Analysis
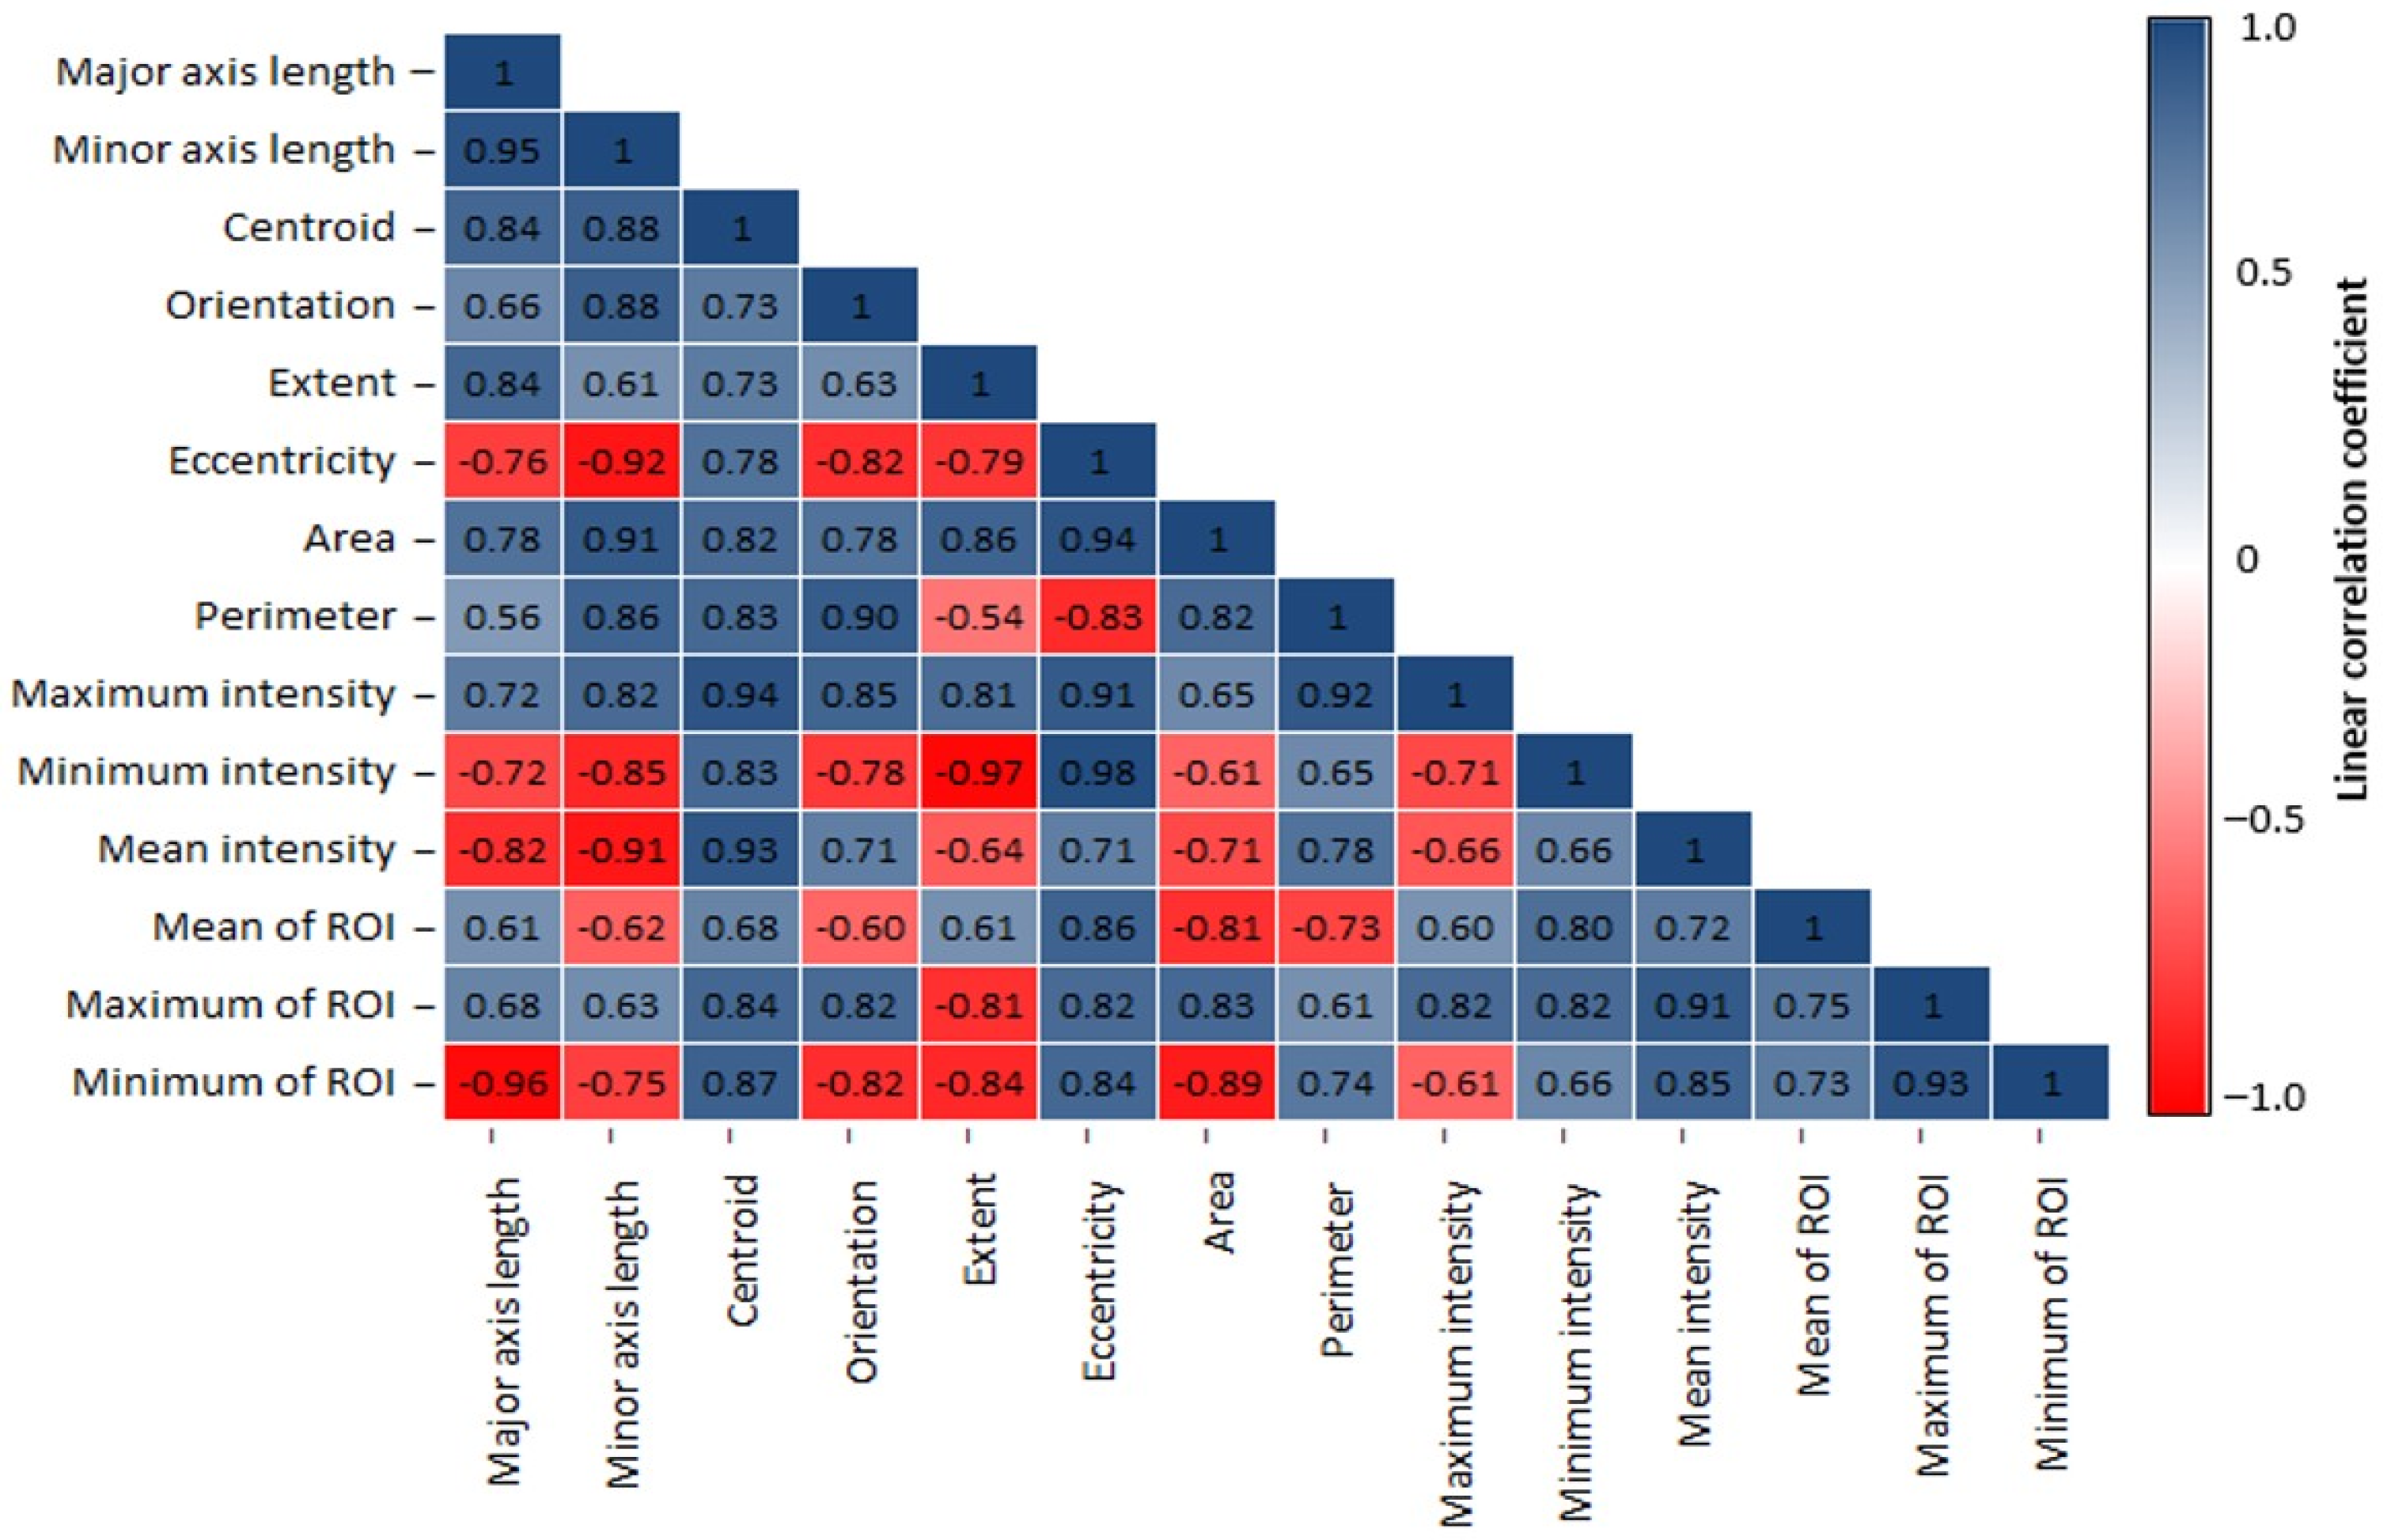
The image parameters derived from the pixel values and shape features were used to distinguish the pineapple cultivars. The linear correlation coefficients between all image parameters of pineapple images are shown in
Figure 4. Among all of the image parameters, minimum intensity was highly correlated with eccentricity with a correlation coefficient (r) of 0.98. In contrast, extent was negatively correlated (r = −0.97) with minimum intensity. A low correlation was found between perimeter and major axis length (r = 0.56). It was demonstrated that the centroid was positively correlated with maximum intensity, area, extent, and orientation with linear correlation coefficients ranging from 0.68 to 0.94. Based on the pixel value features, only the maximum intensity was found to be positively correlated with all of the shape features.
In addition, specific image parameters with high correlations could be chosen to be associated with a certain feature for the classification. A high correlation was observed due to the variation between the fruit cultivars indicating the relationship between the pixel values and shape features of the pineapples. Koklu and Ozkan [
28] identified different types of dry beans using shape and dimensional features taken from two-dimensional images for classifying the varieties. Feature extraction was generated to achieve feature values, which were used to statistically compare between the classes for the classification [
37]. In this case, linear correlation has been used to investigate the relationships among fruit properties and cultivars as well as to obtain discriminatory features [
32]. In relation to the relationship analysis, all of the image parameters were significantly correlated, which were feasible to determine the classification of pineapple cultivars according to different storage conditions.
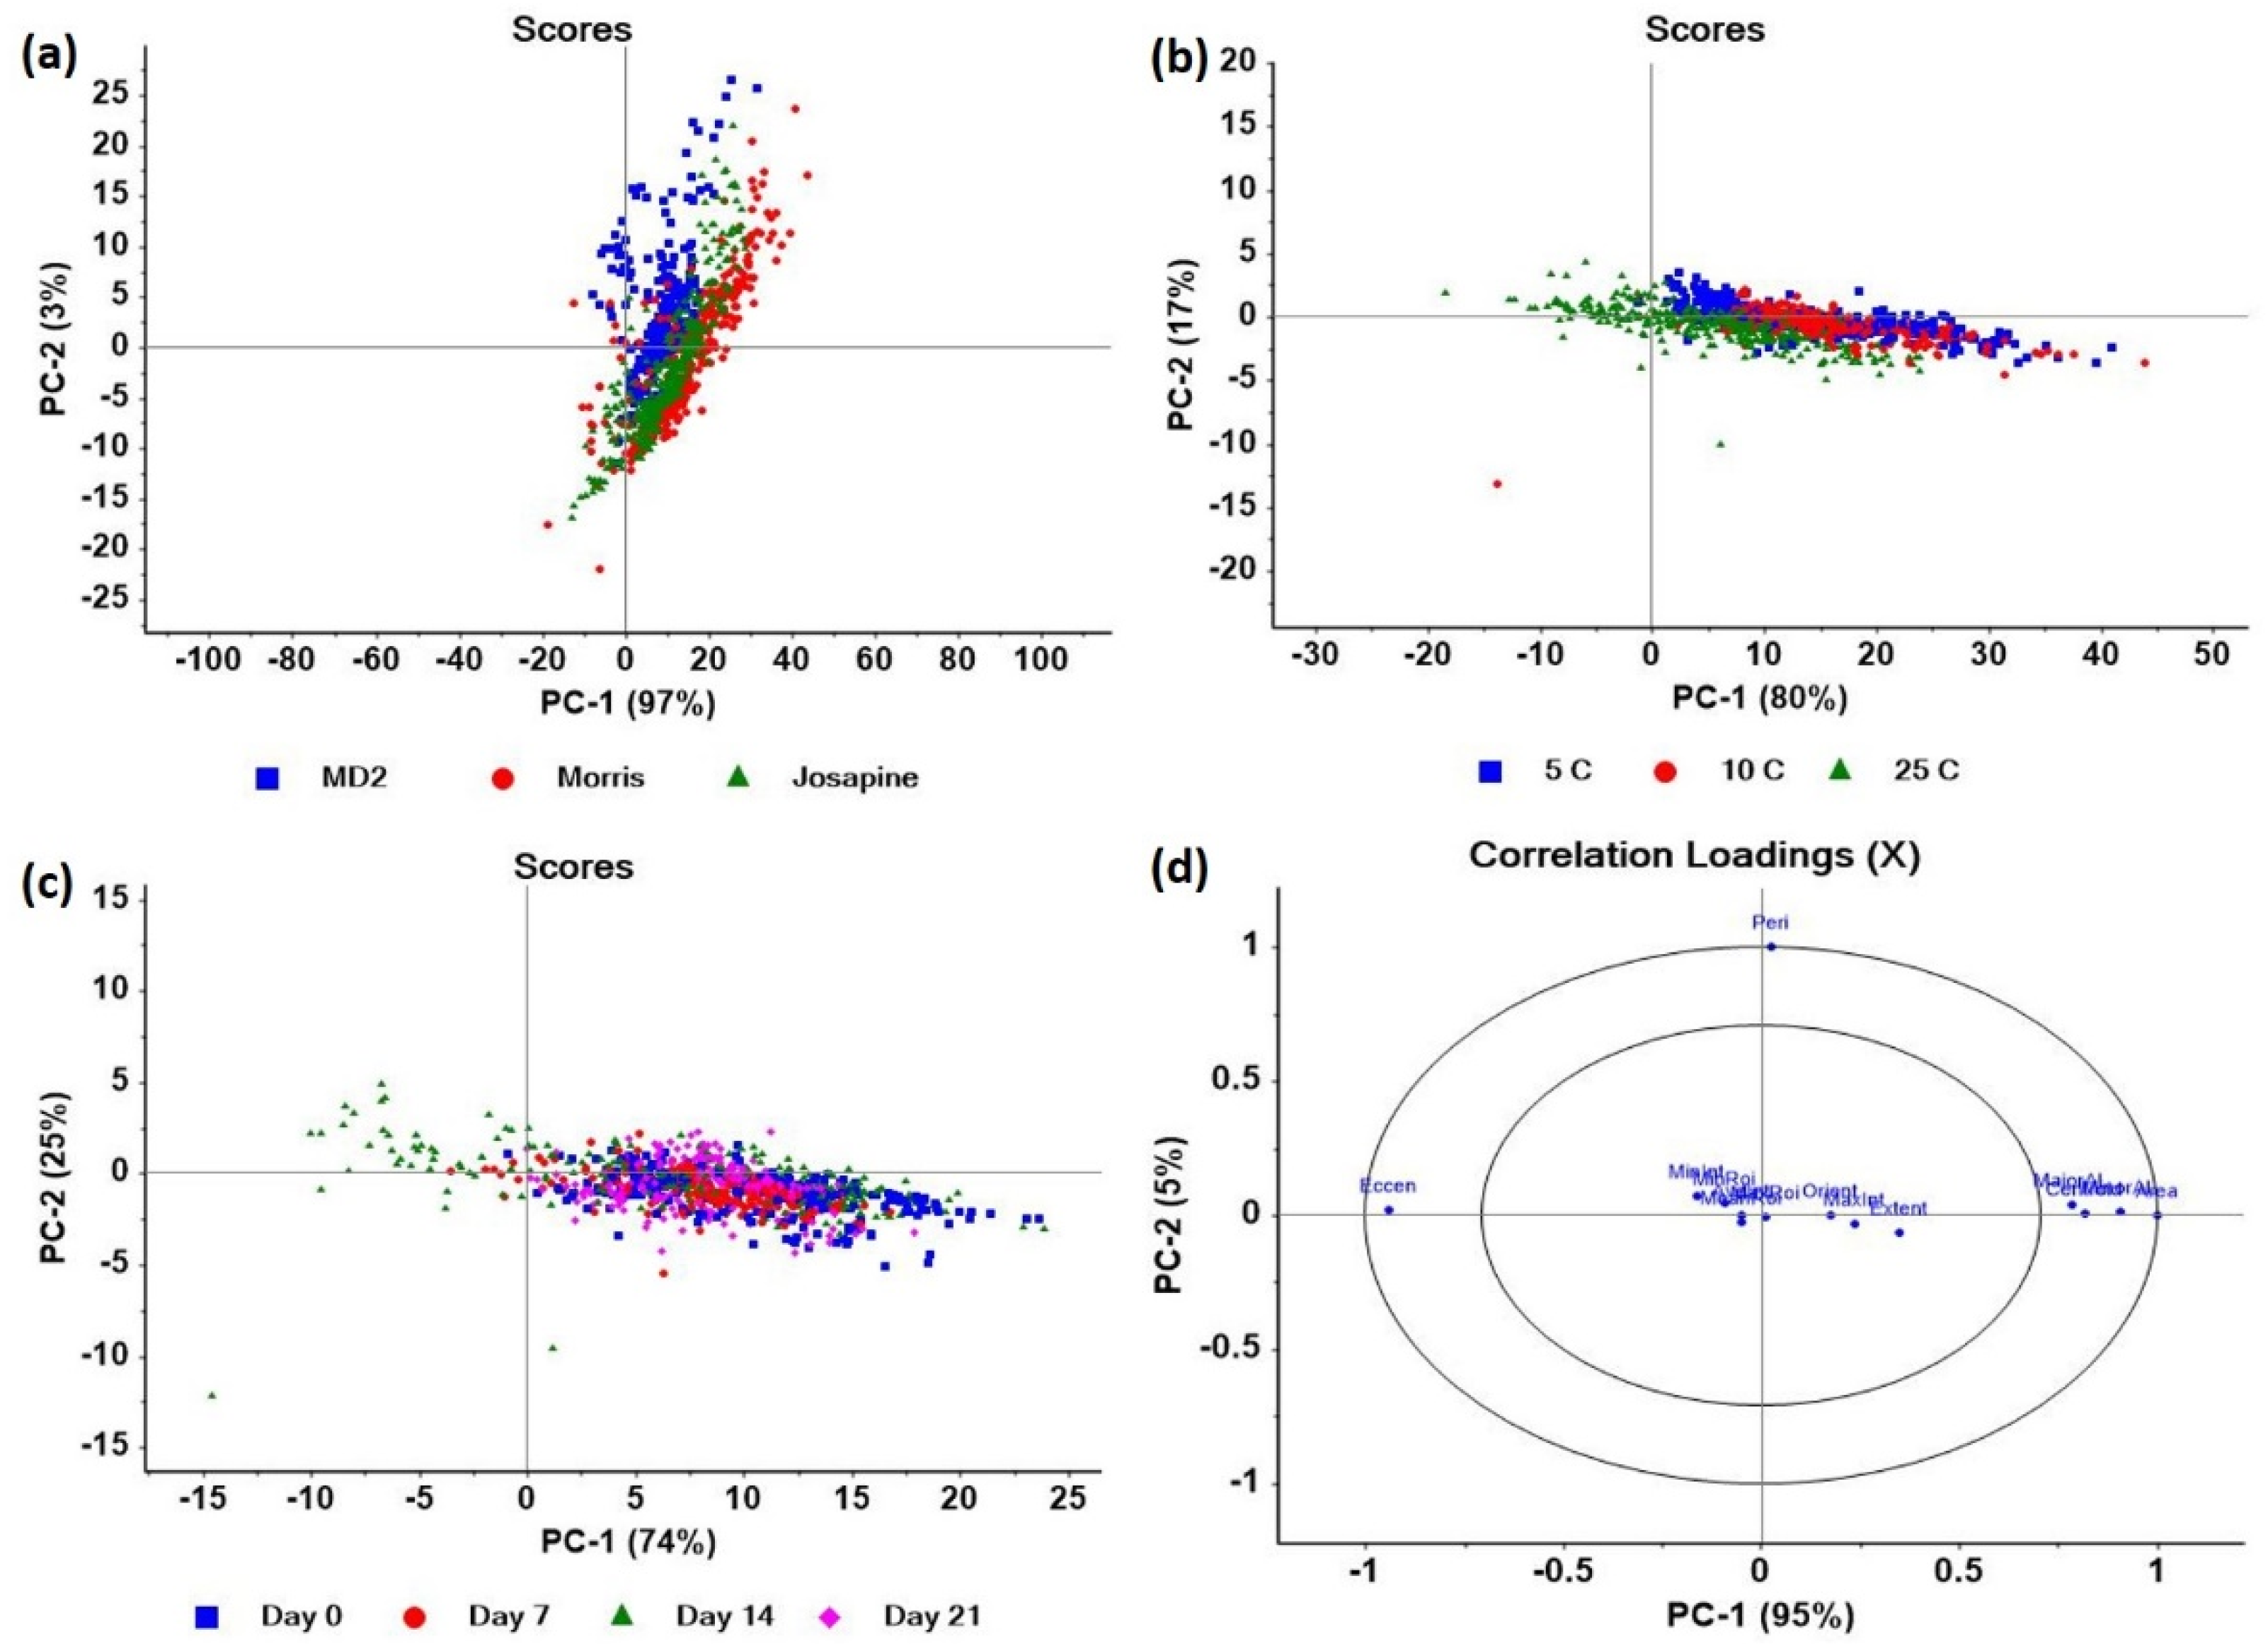
3.3. Classification Results Using PCA
Based on the image parameters of pineapple images, the effectiveness of PCA models was evaluated as shown in
Figure 5. The PCA model was established to verify the clustering ability of the three different pineapple cultivars, namely MD2, Josapine, and Morris. It was observed that the three different pineapple cultivars were successfully classified by two PCs with PC1 (97%) and PC2 (3%), accumulating a total variance of 100%, respectively (
Figure 5a). The classification results using PCA models were in agreement with Kuzy et al. [
38] who demonstrated high capability in terms of clustering patterns between Farthing and Meadowlark berries. Further, the findings revealed that the three pineapple cultivars showed positive scores along both PC1 and PC2 according to the variability loadings.
According to the clustering performance based on the storage temperatures, the results clearly distinguished the variations by two components of PC1 (80%) and PC2 (17%) with total variances of 97% (
Figure 5b), respectively. For this reason, it could be explained that each pineapple cultivar subjected to three different storage temperatures (5, 10, and 25 °C) showed significant variations in the quality attributes of the fruit. As a result, all of the pineapple cultivars stored at three different storage temperatures were correctly discriminated according to the variability of the image parameters. Additionally, the findings successfully discriminated the variations of image parameters in relation to different storage days as proportioned by PC1 (74%) and PC2 (25%), resulting in a total variance of 99% (
Figure 5c). In order to investigate the effect of the image parameters, both PC1 and PC2 signified the ability of the infrared thermal imaging technique to distinguish the variations observed in the pineapple samples during storage.
With respect to the classification scores corresponding with the selected image parameters and different pineapple cultivars, the correlation loadings were strongly correlated with PC1 (95%) and PC2 (5%), accumulating a total variance of 100% (
Figure 5d). The results indicated that maximum intensity, mean intensity, minimum intensity, maximum of ROI, mean of ROI, and minimum of ROI, orientation, and extent described the best combination of image parameters for the classification of pineapple cultivars were subjected to the interior ellipse in the PCA plot. Furthermore, the loading scores aided in the detection of optimal image parameters, which were suitable for the classification task of pineapple cultivars based on different storage conditions. All pineapple samples consisting of MD2, Josapine, and Morris were correctly distinguished in their respective clusters according to their cultivar-related functions. The discrimination of pineapple cultivars based on the image parameters was important as an indicator to provide a clear visualisation influenced by the different storage conditions. These observations were similar to those of Sanchez et al. [
39], who reported total variances of 100% for the classification of sweet potato varieties based on the quality properties during storage. With regard to the experimental factors used, the PCA method required at least two variables to evaluate the classification performance of the samples [
40]. Thus, the baseline data could be applied to evaluate the variability of other physicochemical properties of pineapples for a wide range of cultivars and experimental factors.
3.4. Comparison of Machine Learning Models
The implementation of machine learning algorithms was developed to determine the classification accuracy for the detection of pineapple cultivars based on different storage conditions using an infrared thermal imaging technique. The classification performance of the pineapple cultivars at different storage days and temperatures using the LDA method is presented in
Table 2. The LDA results were obtained according to the classification performance of pineapple cultivars at 25 °C (93.21–98.03%), followed by 10 °C (92.49–97.91%), and 5 °C (92.81–97.64%), respectively. It can be denoted that the classification accuracy of the LDA models increased over storage days for all pineapple cultivars at different storage temperatures. The LDA models attained the highest classification accuracies recorded at 25 °C for both Day 0 (94.67%) and Day 7 (96.39%) from the Josapine cultivar, respectively. The Morris cultivar obtained the highest classification accuracy among all storage days at 25 °C (98.03%) for Day 21. The performance of the infrared thermal imaging technique based on LDA was found to be feasible, which obtained overall classification rates up to 96.25% under different storage conditions for all pineapple cultivars.
The classification performance of the pineapple cultivars at different storage days and temperatures using the QDA method is shown in
Table 3. The findings were described based on the classification performance of the pineapple cultivars at 25 °C (92.66–99.28%), followed by 10 °C (92.53–98.47%) and 5 °C (93.85–97.60%), respectively. The classification accuracy of the QDA models gradually increased over the storage days for all pineapple cultivars at different storage temperatures. The QDA models obtained the highest classification accuracies recorded at 25 °C for both Day 7 (95.71%) and Day 21 (99.28%) from the Josapine cultivar, respectively. Based on the QDA results, it was signified that the overall classification rates achieved up to 96.40% under different storage conditions for all pineapple cultivars.
The classification performance of pineapple cultivars at different storage days and temperatures using the SVM method is demonstrated in
Table 4. The findings were evaluated according to the classification performance of the pineapple cultivars at 25 °C (96.32–99.93%), followed by 10 °C (94.96–99.72%), and 5 °C (96.02–99.62%), respectively. It was also observed that the classification accuracy of the SVM models increased over storage days for all pineapple cultivars at different storage temperatures. The SVM models achieved the highest classification accuracies recorded at 25 °C for Day 7 (99.11%), Day 14 (99.92%), and Day 21 (99.93%) from the Morris cultivar, respectively. Similarly, the Morris cultivar obtained the highest classification accuracy for Day 0 (98.26%) which was recorded at 5 °C. Moreover, it was revealed that the overall classification rates achieved up to 99.30% under different storage conditions for all pineapple cultivars.
The classification performance of pineapple cultivars at different storage days and temperatures using the kNN method is presented in
Table 5. The kNN results were obtained according to the classification performance of the pineapple cultivars at 25 °C (95.83–99.93%), followed by 10 °C (96.42–99.75%) and 5 °C (95.39–99.46%), respectively. It was demonstrated that the classification accuracy of the kNN models increased over the storage days for all pineapple cultivars at different storage temperatures. The kNN models obtained the highest classification accuracies recorded at 25 °C for Day 7 (98.41%), Day 14 (99.48%), and Day 21 (99.93%) from the Morris cultivar, respectively. Likewise, the Morris cultivar also attained the highest classification accuracy for Day 0 (97.49%), which was recorded at 10 °C. In addition, the overall classification rates achieved up to 98.70% under different storage conditions for all pineapple cultivars.
The classification performance of pineapple cultivars at different storage days and temperatures using the decision tree method is tabulated in
Table 6. The findings were achieved based on the classification performance of the pineapple cultivars at 10 °C (96.37–99.95%), followed by 25 °C (94.59–99.86%) and 5 °C (95.20–99.59%), respectively. It was signified that the classification accuracy of the decision tree models significantly increased over the storage days for all pineapple cultivars at different storage temperatures. The decision tree models achieved the highest classification accuracies recorded at 25 °C for Day 7 (99.86%) and Day 14 (99.74%) from the Morris cultivar, respectively. It was also revealed that the overall classification rates achieved up to 98.67% under different storage conditions for all pineapple cultivars.
The classification performance of the pineapple varieties at different storage days and temperatures using the naïve Bayes method is shown in
Table 7. The promising naïve Bayes results were accounted according to the classification performance of the pineapple cultivars at 5 °C (95.27–99.96%), followed by 10 °C (95.09–99.96%), and 25 °C (93.67–99.92%), respectively. Based on the results, the classification accuracy of the naïve Bayes models increased over the storage days for all pineapple varieties at different storage temperatures. The naïve Bayes models obtained the highest classification accuracies recorded at 10 °C for Day 21 (99.96%) from the Morris cultivar. The Josapine cultivar also obtained the highest classification accuracy at 10 °C (97.49%) which was recorded at Day 7. It was also found that the overall classification rates achieved up to 98.03% under different storage conditions for all pineapple cultivars. These findings inferred that the changes in image parameters of pineapple cultivars using the infrared thermal imaging technique could show promising use in monitoring various storage conditions.
In general, all of the machine learning algorithms succeeded in achieving up to 99.30% of the overall classification rates in distinguishing pineapple cultivars according to various storage conditions. The typical trend of classification accuracy was enhanced in the large total number of features selected from the feature extraction [
38]. Regardless of the discrepancy in the classification accuracies between the pineapple cultivars, it should be noted that the reference measurement described the significant changes in image parameters. Vélez Rivera et al. [
41] obtained a success rate of 90% in detecting mechanical defects in mango using several algorithms such as LDA, kNN, and naïve Bayes. In the majority of cases, the high correlation of fruit properties could be predicted based on the selected features from the images [
32]. In view of the different storage conditions of the fruit, infrared thermal imaging coupled with machine learning demonstrated strong performance and ability for the given classification applications.
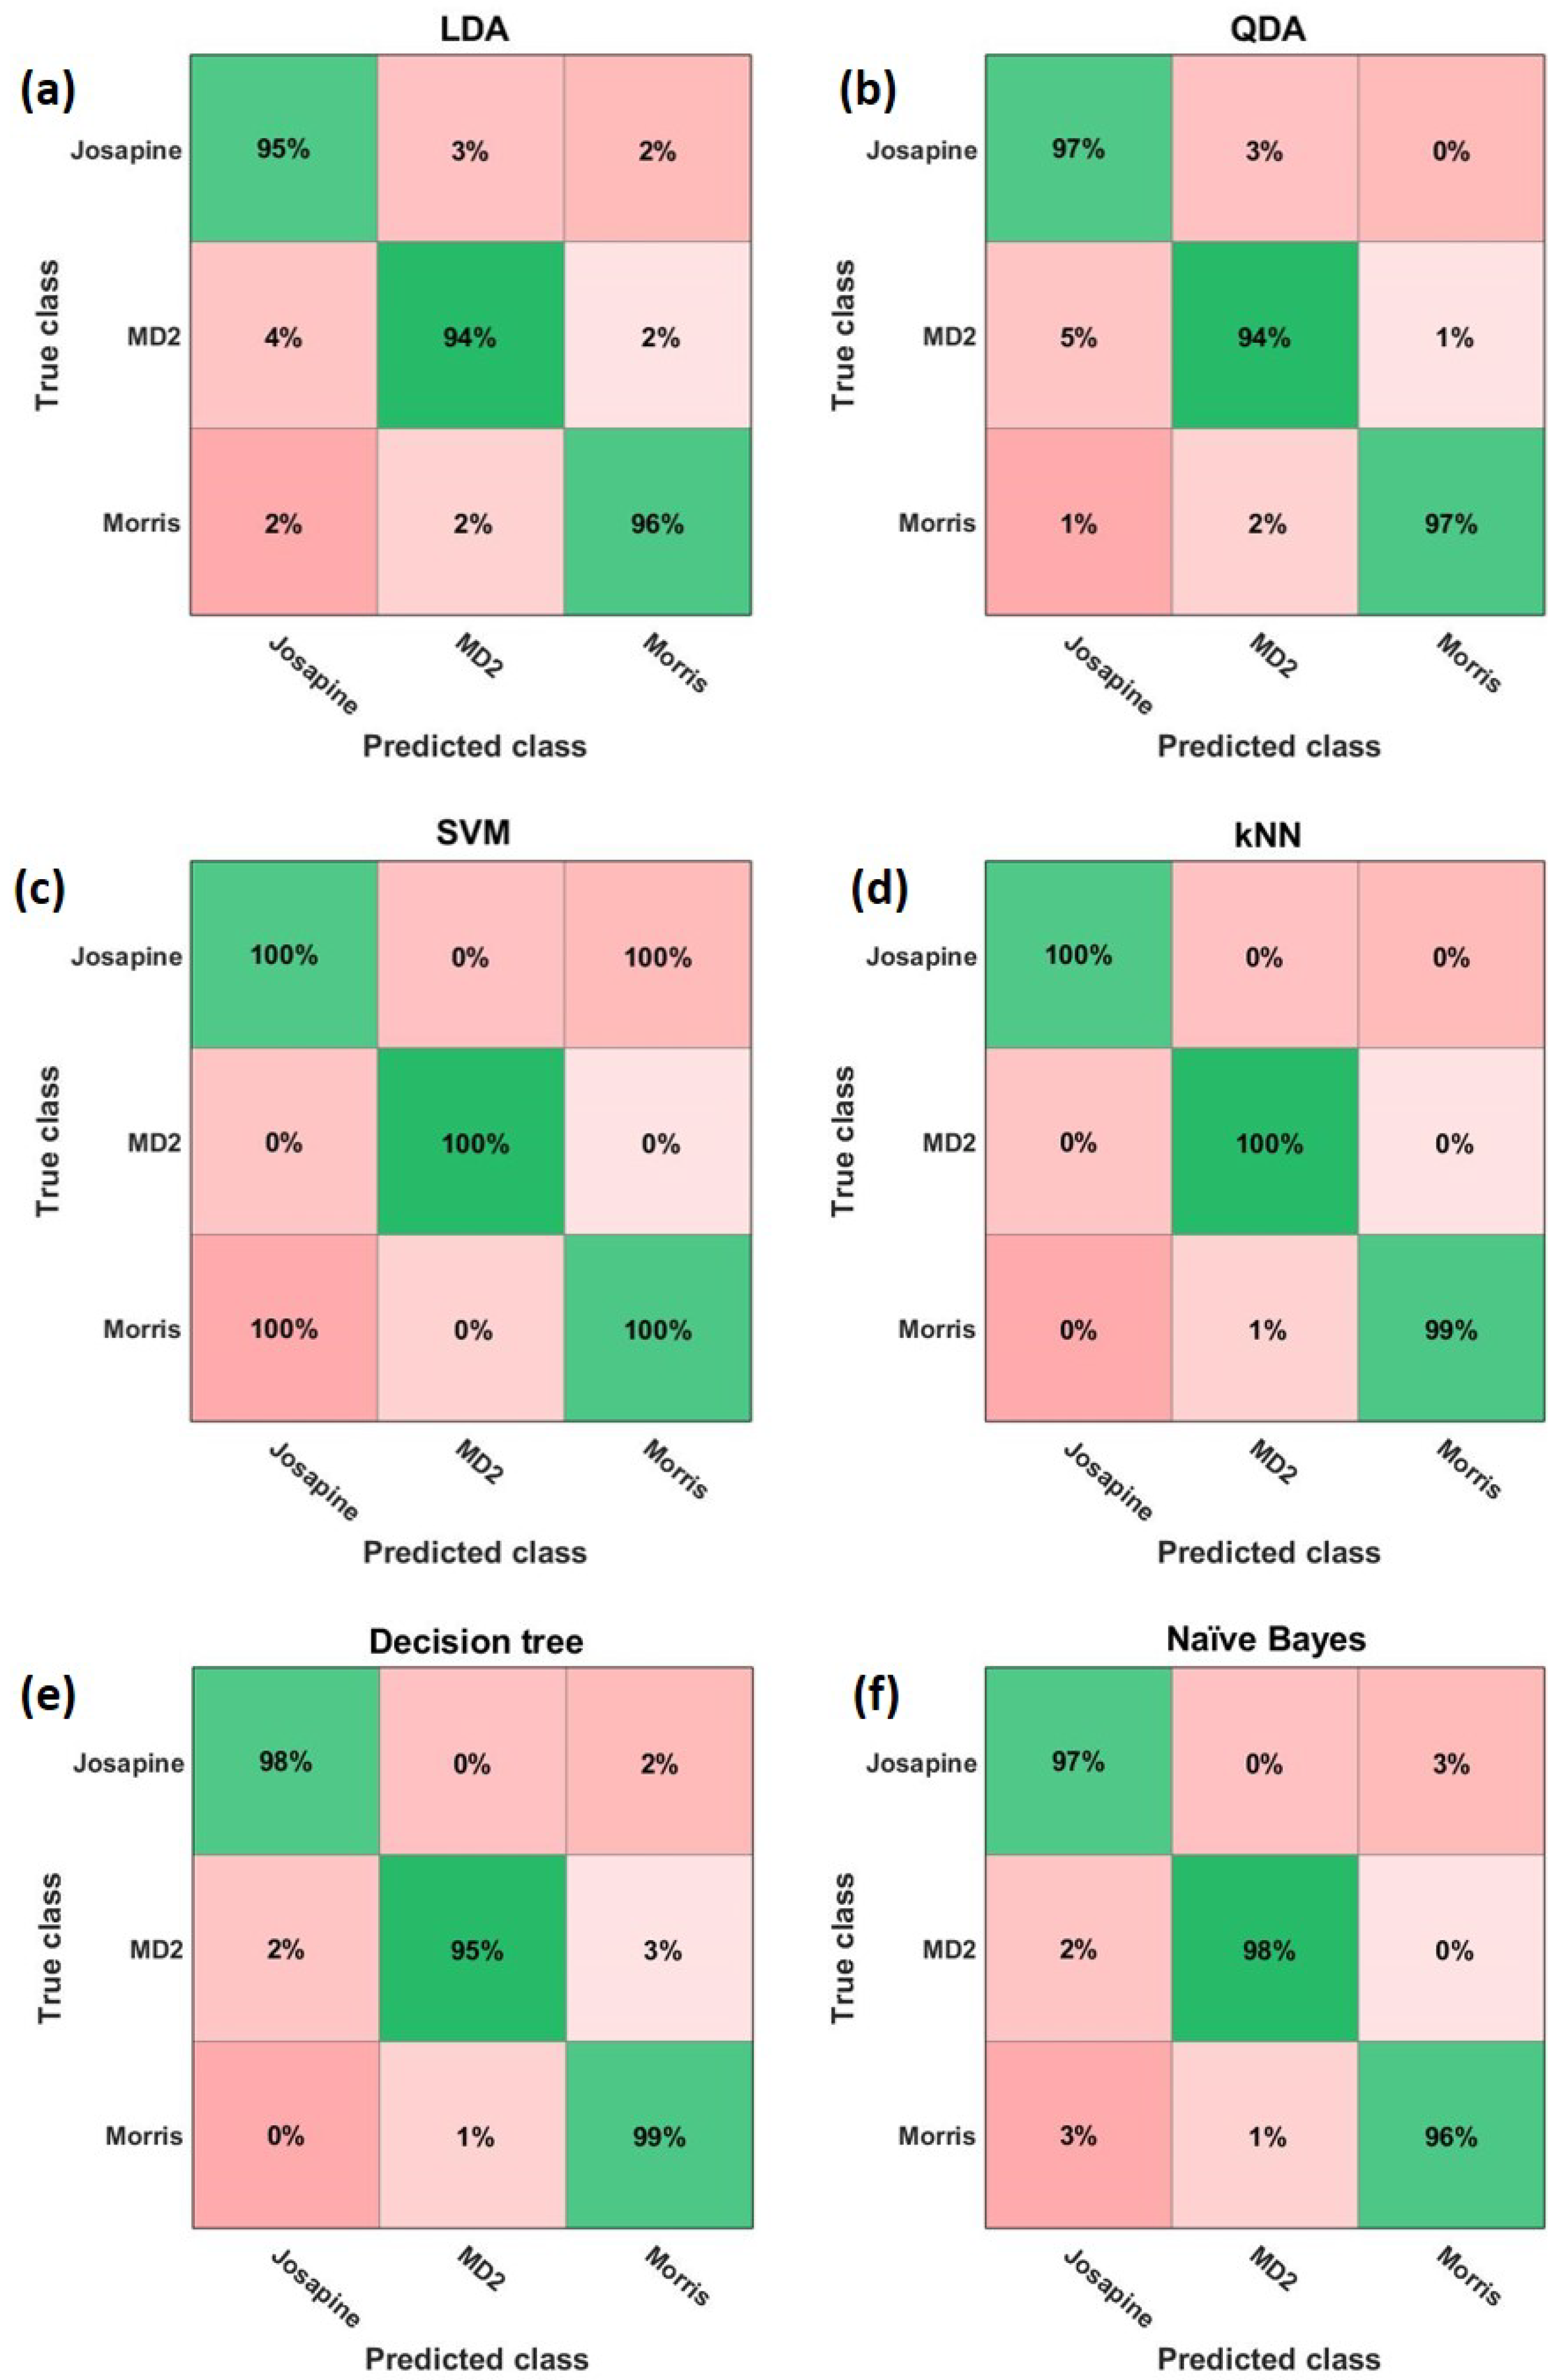
To further classify pineapple cultivars according to the image parameters, selected feature extraction allows the machine learning algorithms to achieve classification accuracy. The comparative performance in terms of classification accuracy for the classification of pineapple cultivars between the machine learning algorithms is monitored based on the optimal combination of image parameters. In this case, the distinct features selected from the image parameters provided a different optimal combination applied for each machine learning algorithm using a confusion matrix. Specifically, eight image parameters were selected including maximum intensity, mean intensity, minimum intensity, maximum of ROI, mean of ROI, minimum of ROI, orientation, and extent based on the feature selection using PCA analysis to achieve the highest performance of classification accuracy. The confusion matrices with average classification rates of different pineapple cultivars using six different machine learning algorithms are illustrated in
Figure 6.
It can be demonstrated that the LDA achieved an accuracy of 95%, 94%, and 96% for the correct classification of Josapine, MD2, and Morris, respectively. The highest classification accuracy for correctly classified Josapine (97%), Morris (97%), and MD2 (94%) was achieved by QDA. On the other hand, the SVM outperformed the rest of the machine learning algorithms, with the highest classification rate of 100% for the correct classification of all pineapple cultivars. In the case of the kNN algorithm, both Josapine and MD2 were correctly classified with the highest classification accuracy of 100%. The decision tree reached a good classification accuracy of 98% for Josapine, 95% for MD2, and 99% for Morris, respectively. For the naïve Bayes algorithm, the highest classification accuracy obtained was 98% for the correctly classified MD2 cultivar. The dataset of each pineapple cultivar was validated without retraining the machine learning algorithms in order to test the generalisability to other cultivars. Different algorithms should be employed according to the condition according to the current state of the data analysis in obtaining more accurate classification results.
With respect to the misclassification of different pineapple cultivars, this could be attributed to the differences in terms of maturity stages and the relationship of variation in quality attributes [
42]. In a previous study by van de Looverbosch et al. [
37], the superior SVM algorithm was investigated in order to detect two cultivars of pear with several internal disorder severities, which obtained the highest classification accuracy of 95%. Generally, the performance of all of the machine learning algorithms described the highest classification accuracies based on the optimal combination of features of the image parameters. It was observed that all of the machine learning models successfully classified the pineapple cultivars with the highest correct classification up to 100%. Feature extraction may provide the means to choose a minimum number of image parameters for a given classification task in such a way as to reduce the computational complexity and enhance the model performance [
25]. Hence, it can be denoted that all of the machine learning algorithms were able to distinguish between the different pineapples cultivars acquired using the infrared thermal imaging technique.


