
Comparative Evaluation of the Dynamics of Animal Husbandry Air Pollutant Emissions Using an IoT Platform for Farms

 , ,
, , 
Abstract
:1. Introduction
- To present the current knowledge on the relationship between air pollutants and animal welfare and the relationship between air pollutant variation and farm management.
- To propose a case study in a real environment where an IoT infrastructure is used for monitoring key parameters of the stable environment: gas sensors (NH3) and PM sensors (PM2.5, PM1, PM10).
- To estimate the air pollutants’ concentrations (in two seasons—winter and summer) based on European Monitoring and Evaluation Programme (EMEP) methodology and to compare the estimated values with the monitored concentrations.
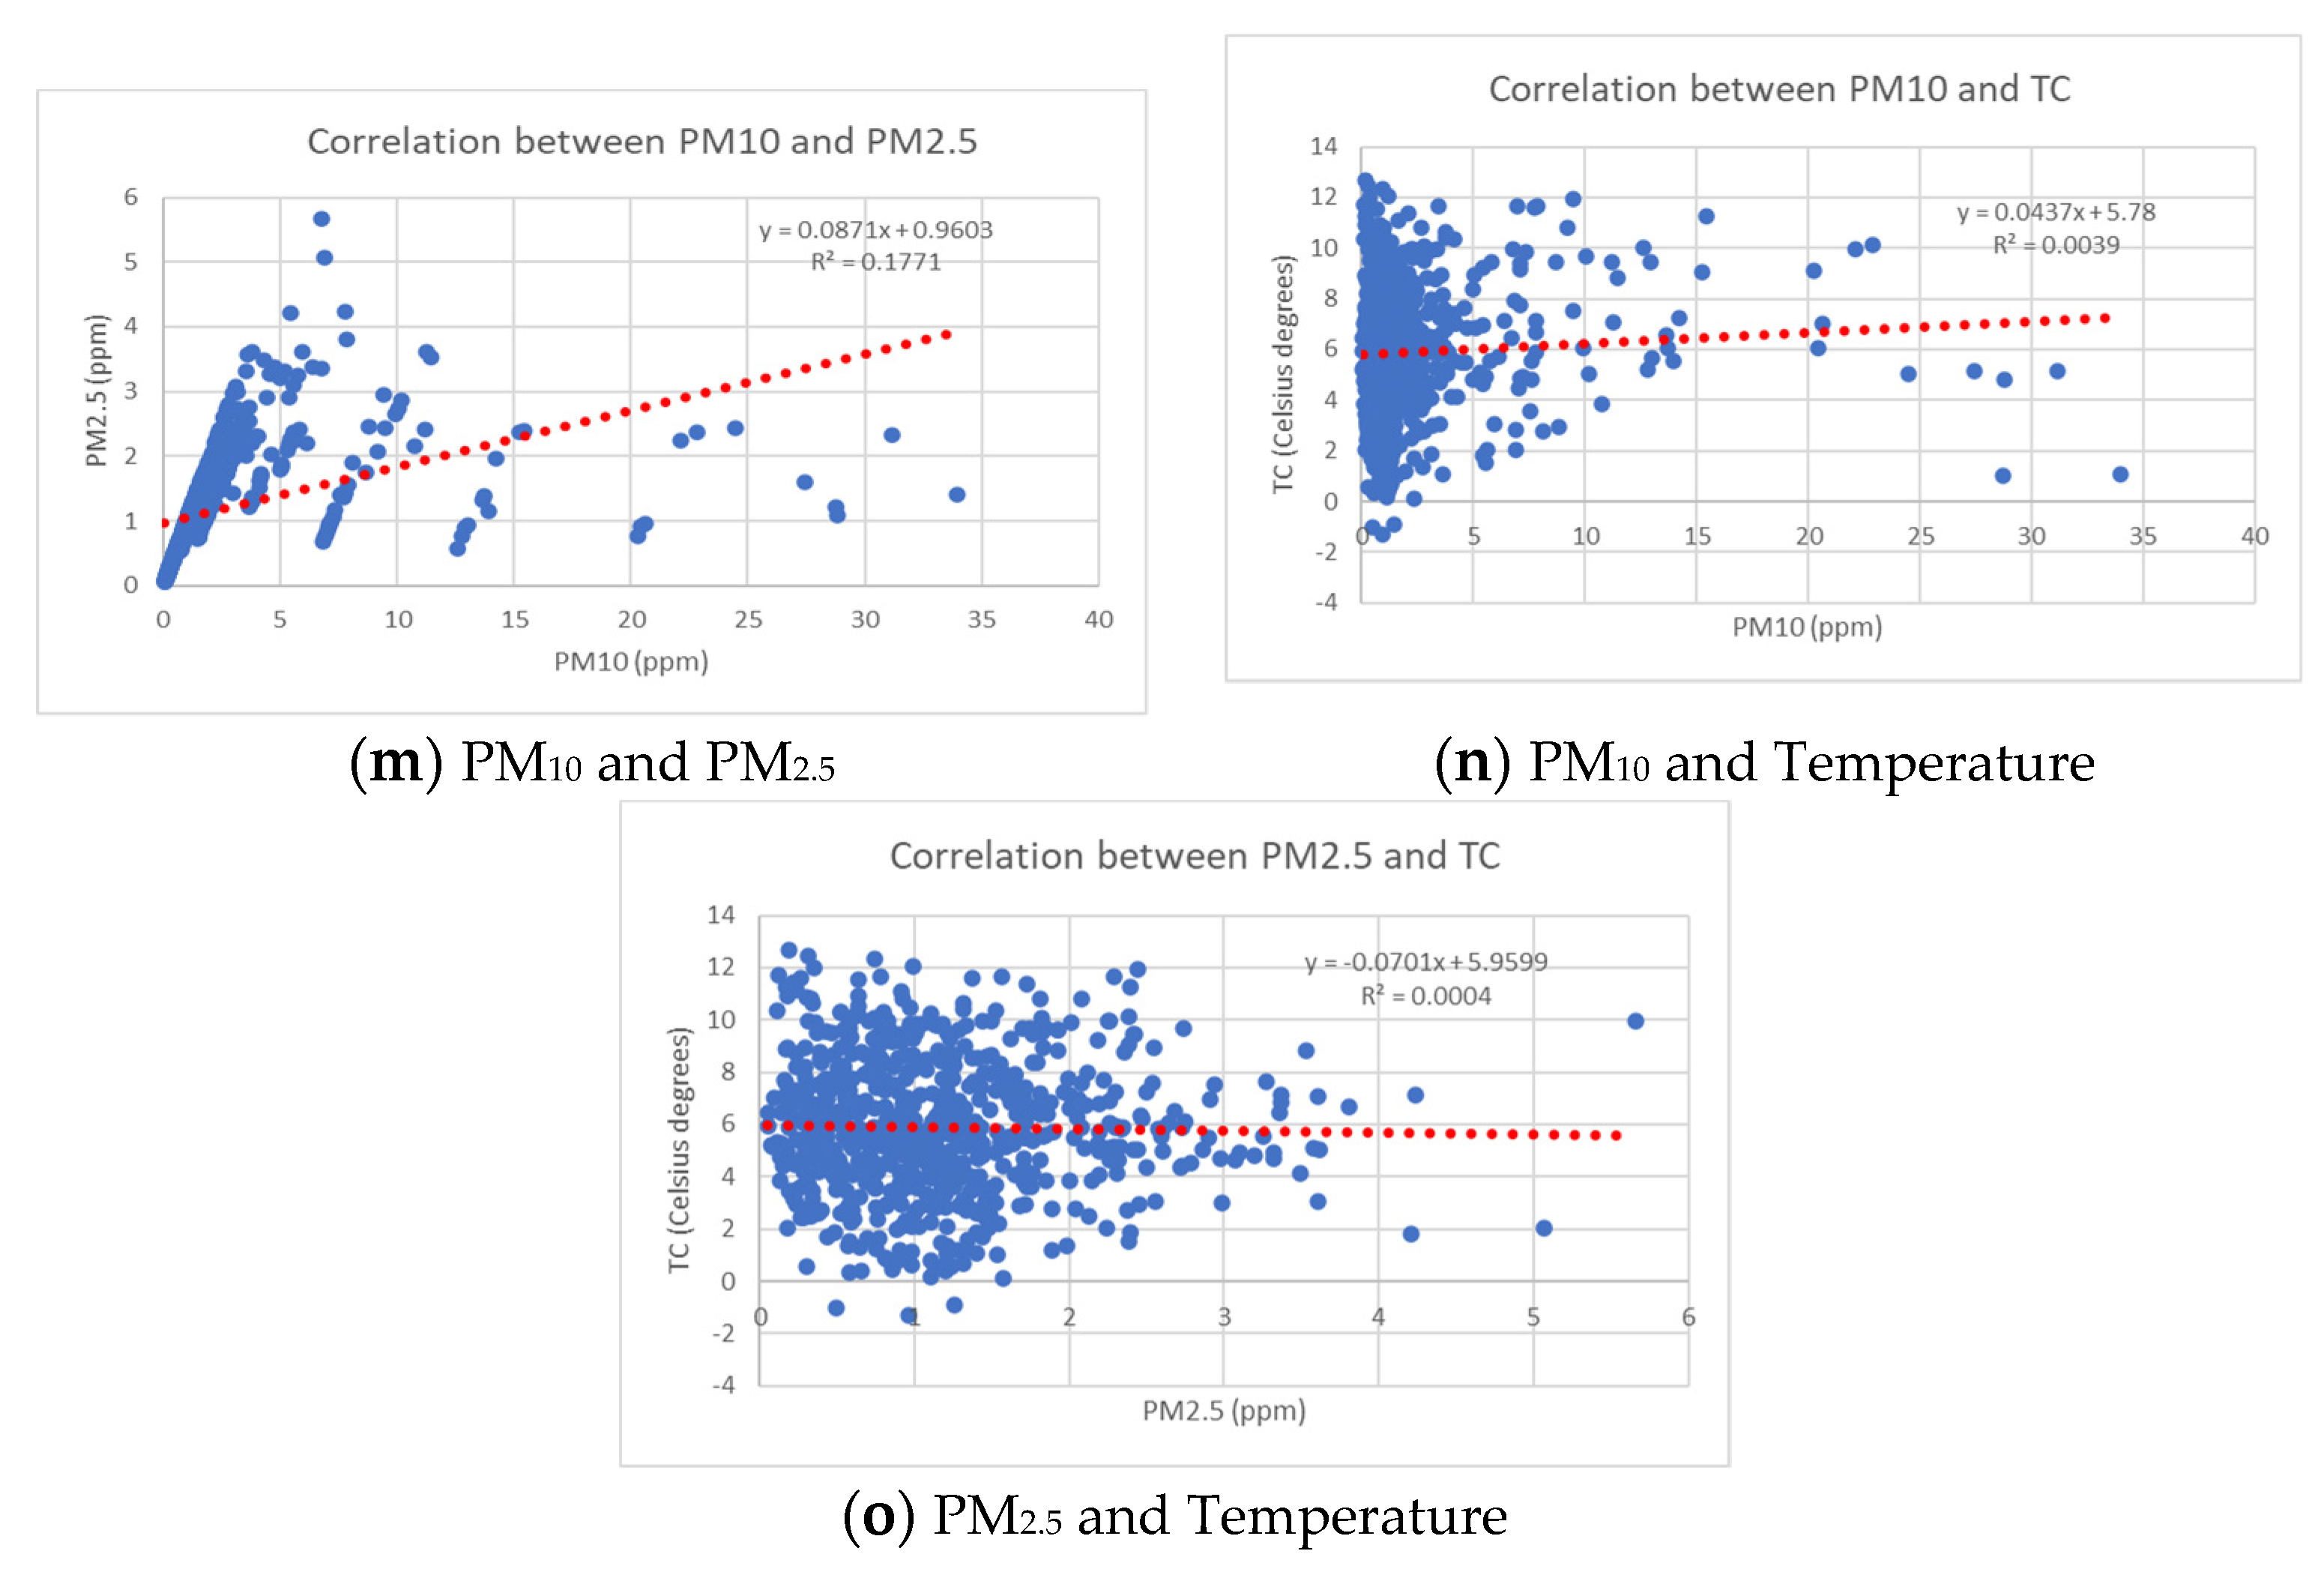
- To study the behavior of air pollutants in correlation with micro-climate parameters.
2. State of the Art
3. Measurement Platform for AP Concentration Monitoring and Case Study Description
3.1. Platform Architecture
- Device Layer: includes sensors (i.e., for measurement of the concentrations of APs such as NH3, CO, CO and PMx), devices and client agents (to collect and transmit data to the IoT platform).
- Network Layer: includes the communication component (which uses low-power radio transmission technologies such as LoRa and cellular IoT) and the gateway (which sends the data packets to the next Layer).
- Cloud Layer: has the role of transforming data into knowledge. In this way, intelligence is added as a higher level of services. This layer receives the data and integrates and transforms them into knowledge. The data are received through the use of The Things Network and MQTT protocol.
- Application Layer: uses the knowledge generated in the previous layer to provide an overview of the farm performance (based on specific KPIs such as productivity, AP concentrations etc.) and their visual representation (various graphic representations).
3.2. Case Study
4. Comparison between Estimated and Monitored AP Concentrations
4.1. AP Concentration Estimated Using EMEP Methodology
- GE = gross energy intake
- GP = crude protein
- GB = crude fat
- CelB = crude fibers
- SEN = non-nitrate extractable substances
4.2. AP Concentration Monitored Using Sensors
5. Conclusions
Author Contributions
Funding
Institutional Review Board Statement
Data Availability Statement
Acknowledgments
Conflicts of Interest
Abbreviations
| AAP | Average Annual Population |
| ANFIS-GP | Adaptive Neuro-Fuzzy Inference Systems with Grid Partitioning |
| ANFIS-SC | Adaptive Neuro-Fuzzy Inference Systems with Subtractive Clustering |
| AP | Air Pollutant |
| AQI | Air Quality Index |
| AQM | Air Quality Monitoring |
| CFC | Cloud Farm Controller |
| CoAP | Constrained Application Protocol |
| CP | Crude Protein |
| EF | Emission Factor |
| EMEP | European Monitoring and Evaluation Programme |
| EPA | United States Environmental Protection Agency |
| EX-ACT | EX-Ante Carbon-balance Tool |
| FEM | Farm Emissions Model |
| HTTP | Hypertext Transfer Protocol |
| IoT | Internet of Things |
| IPCC | Intergovernmental Panel on Climate Change |
| KF | Kalman Filter |
| KPI | Key Performance Indicator |
| LEACH | Low Energy Adaptive Clustering Hierarchy Aggregation |
| LFC | Local Farm Controller |
| LMC | Litter Moisture Content |
| MLP | Multilayer Perceptron |
| MLR | Multiple Linear Regression |
| MQTT | Message Queuing Telemetry Transport |
| NPM | National Practices Model |
| pH | Potential of Hydrogen |
| PM | Microscopic Particles |
| PMx | Microscopic Particles less than x microns in diameter, where x {1, 2.5, 10} |
| REST | Representational State Transfer |
| WSN | Wireless Sensor Network |
| CO | carbon monoxide |
| CO2 | carbon dioxide |
| CH4 | methane |
| N₂O | nitrous oxide |
| NO2 | nitrogen dioxide |
| NH3 | ammonia |
| O3 | ozone |
| SO2 | sulfur dioxide |
References
- Vermeulen, S.J.; Campbell, B.M.; Ingram, J.S.I. Climate change and food systems. Annu. Rev. Environ. Resour. 2012, 37, 195–222. [Google Scholar] [CrossRef] [Green Version]
- Tilman, D.; Clark, M.; Williams, D.R.; Kimmel, K.; Polasky, S.; Packer, C. Future threats to biodiversity and pathways to their prevention. Nature 2017, 546, 73–81. [Google Scholar] [CrossRef] [PubMed]
- Clark, M.; Hill, J.; Tilman, D. The diet, health, and environment trilemma. Annu. Rev. Environ. Resour. 2018, 43, 109–134. [Google Scholar] [CrossRef] [Green Version]
- Crippa, M.; Solazzo, E.; Guizzardi, D.; Monforti-Ferrario, F.; Tubiello, F.N.; Leip, A. Food systems are responsible for a third of global anthropogenic GHG emissions. Nat. Food 2021, 2, 198–209. [Google Scholar] [CrossRef]
- FAO. The Global Dairy Sector: Fact; Food and Agricultural Organization of the United Nations: Rome, Italy, 2019. [Google Scholar]
- Diaz, S.; Settele, E.; Brondizio, E.; Ngo, H.; Gueze, M.; Agard, J.; Arneth, A.; Balvanera, P. Summary for Policymakers of the Global Assessment Report on Biodiversity and Ecosystem Services of the Intergovernmental Science-Policy Platform on Biodiversity and Ecosystem Services. IPBS 2019, 45, 680–681. [Google Scholar]
- Cambra-López, M.; Aarnink, A.J.A.; Zhao, Y.; Calvet, S.; Torres, A.G. Airborne particulate matter from livestock production systems: A review of an air pollution problem. Environ. Pollut. 2010, 158, 1–17. [Google Scholar] [CrossRef]
- Moore, K.D.; Young, E.; Wojcik, M.D.; Martin, R.S.; Gurell, C.; Bingham, G.E.; Pfeiffer, R.L.; Prueger, J.H.; Hatfield, J.L. Ammonia measurements and emissions from a California dairy using point and remote sensors. Trans. ASABE 2014, 57, 181–198. [Google Scholar]
- Hristov, A.N.; Hanigan, M.; Cole, A.; Todd, R.; McAllister, T.A.; Ndegwa, P.M.; Rotz, A. Review: Ammonia emissions from dairy farms and beef feedlots. Can. J. Anim. Sci. 2011, 91, 1–35. [Google Scholar] [CrossRef] [Green Version]
- Powell, J.M.; Broderick, G.A.; Misselbrook, T.H. Seasonal diet affects ammonia emissions from tie-stall dairy barns. J. Dairy Sci. 2008, 91, 857–869. [Google Scholar] [CrossRef] [Green Version]
- James, T.; Meyer, D.; Esparza, E.; Depeters, E.J.; Perez-Monti, H. Effects of dietary nitrogen manipulation on ammonia volatilization from manure from holstein heifers. J. Dairy Sci. 1999, 82, 2430–2439. [Google Scholar] [CrossRef]
- Frank, B.; Persson, M.; Gustafsson, G. Feeding dairy cows for de- creased ammonia emissions. Livest. Prod. Sci. 2002, 76, 171–179. [Google Scholar] [CrossRef]
- Frank, B.; Swensson, C. Relationship between content of crude pro- tein in rations for dairy cows and milk yield, concentration of urea in milk, and ammonia emissions. J. Dairy Sci. 2002, 85, 1829–1838. [Google Scholar] [CrossRef] [PubMed]
- Swensson, C. Relationship between content of crude protein in rations for dairy cows, N in urine and ammonia release. Livest. Prod. Sci. 2003, 84, 125–133. [Google Scholar] [CrossRef]
- Broderick, G.A. Effects of varying dietary protein and energy levels on the production of lactating dairy cows. J. Dairy Sci. 2003, 86, 1370–1381. [Google Scholar] [CrossRef]
- Colmenero, J.J.O.; Broderick, G.A. Effect of dietary crude protein concentration on milk production and nitrogen utilization in lactating dairy cows. J. Dairy Sci. 2006, 89, 1704–1712. [Google Scholar] [CrossRef] [PubMed] [Green Version]
- Aguerre, J.M.; Wattiaux, M.A.; Hunt, T.; Larget, B.R. Effect of dietary crude protein on ammonia-N emission measured by herd nitrogen mass balance in a freestall dairy barn managed under farm-like conditions. Animal 2010, 4, 1390–1400. [Google Scholar] [CrossRef] [Green Version]
- Powell, M.J.; Wattiaux, M.A.; Broderick, G.A. Evaluation of milk urea nitrogen as a management tool to reduce ammonia emissions from dairy farms. J. Dairy Sci. 2011, 94, 4690–4694. [Google Scholar] [CrossRef]
- Cantalapiedra-Hijar, G.; Peyraud, J.L.; Lemosquet, S.; Molina-Alcaide, E.; Boudra, H.; Nozière, P.; Marty-Ortigues, I. Dietary carbohydrate composition modifies the milk N efficiency in late lactation cows fed low crude protein diets. Animal 2014, 8, 275–285. [Google Scholar] [CrossRef] [PubMed] [Green Version]
- Oenema, O.; Bannink, A.; Sommer, S.G.; van Groenigen, J.W.; Velthof, G.L. Gaseous Nitrogen Emissions from Livestock Farming Systems. In Nitrogen in the Environment: Sources, Problems, and Management, 2nd ed.; Hatfield, J.L., Follett, R.F., Eds.; Academic Press: San Diego, CA, USA, 2008. [Google Scholar]
- Zhang, G.; Strøm, J.S.; Li, B.; Rom, H.B.; Morsing, S.; Dahl, P.; Wang, C. Emission of ammonia and other contaminant gases from naturally ven- tilated dairy cattle buildings. Biosyst. Eng. 2005, 92, 355–364. [Google Scholar] [CrossRef]
- Montes, F.; Meinen, R.; Dell, C.; Rot, A.; Hristov, A.N.; Oh, G.; Waghorn, G.; Gerber, P.J.; Henderson, B.; Makkar, H.P.S.; et al. Mitigation of methane and nitrous oxide emissions from animal operations: II. A review of manure management mitigation options. J. Anim. Sci. 2013, 91, 5070–5094. [Google Scholar] [CrossRef] [Green Version]
- Leytem, B.A.; Dungan, R.S.; Bjornberg, D.L.; Koehn, A.C. Greenhouse gas and ammonia emissions from an open-freestall dairy in southern Idaho. J. Environ. Qual. 2013, 42, 10–20. [Google Scholar] [CrossRef] [PubMed] [Green Version]
- Pereira, J.; Misselbrook, T.H.; Chadwick, D.R.; Coutinhoc, J.; Trindade, H. Ammonia emissions from naturally ventilated dairy cattle buildings and outdoor concrete yards in Portugal. Atmos. Environ. 2010, 44, 3413–3421. [Google Scholar] [CrossRef]
- Van der Stelt, B.; Temminghoff, E.J.M.; Van Vliet, P.C.J.; Van Riemsdijk, W.H. Volatilization of ammonia from manure as affected by manure additives, temperature and mixing. Bioresour. Technol. 2007, 98, 3449–3455. [Google Scholar] [CrossRef] [PubMed]
- Saha, C.K.; Ammon, C.; Berg, W.; Fiedler, M.; Loebsin, C.; Sanftleben, P.; Brunsch, R.; Amon, T. Seasonal and diel variations of ammonia and methane emissions from a naturally ventilated dairy building and the associated factors in- fluencing emissions. Sci. Total Environ. 2014, 468, 53–62. [Google Scholar] [CrossRef]
- Oenema, O.; Velthof, G.; Klimont, Z.; Winiwarter, W. Emissions from Agriculture and Their Control Potentials; TSAP Report #3, Version 2.1, Service Contract on Monitoring and Assessment of Sectorial Implementation Actions, (ENV.C.3/SER/2011/0009): 27; International Institute for Applied Systems Analysis: Laxenburg, Austria, 2012. [Google Scholar]
- Sankey, J.B.; Eitel, J.U.H.; Glenn, N.F.; Germino, M.J.; Vierling, L.A. Quantifying relationships of burning, roughness, and potential dust emission with laser altimetry of soil surfaces at submeter scales. Geomorphology 2011, 135, 181–190. [Google Scholar] [CrossRef]
- Place, S.E.; Mitloehner, F.M. Invited review: Contemporary environmental issues: A review of the dairy industry’s role in climate change and air quality and the potential of mitigation through improved production efficiency. J. Dairy Sci. 2010, 93, 3407–3416. [Google Scholar] [CrossRef]
- Sutton, M.; Howard, C.; Erisman, J. The European Nitrogen Assessment: Sources, Effects and Policy Perspectives; Cambridge University Press: Cambridge, UK, 2011. [Google Scholar]
- Lelieveld, J.; Evans, J.S.; Fnais, M.; Giannadaki, D.; Pozzer, A. The contribution of outdoor air pollution sources to premature mortality on a global scale. Nature 2015, 525, 367–371. [Google Scholar] [CrossRef]
- D’Amato, G.; Cecchi, L. Effects of climate change on environmental factors in respiratory allergic diseases. Clin. Exp. Allergy 2008, 38, 1264–1274. [Google Scholar] [CrossRef]
- Auvermann, B.A. Texas/New Mexico Open-Lot Research. In Proceedings of the Western Dairy Air Quality Symposium, Sacramento, CA, USA, 20 April 2011. [Google Scholar]
- Auvermann, B.A.; Romanillos, A. Effect of Increased Stocking Density on Fugitive Dust Emissions of PM10 from Cattle feedyards. In Proceedings of the International Meeting of the Air and Waste Management Association, Salt Lake City, UT, USA, 18–22 June 2000. [Google Scholar]
- Bonifacio, H.F.; Maghirang, R.G.; Razote, E.B.; Auvermann, B.W.; Harner, J.P.; Murphy, J.P.; Guo, L.; Sweeten, J.M.; Hargrove, W.L. Particulate control efficiency of a water sprinkler system at a beef cattle feedlot in Kansas. Trans. ASABE 2011, 54, 295–304. [Google Scholar] [CrossRef]
- Fan, C.; Tian, L.; Zhou, L.; Hou, D.; Song, Y.; Qiao, X.; Li, J. Examining the Impacts of Urban Form on Air Pollutant Emissions: Evidence from China. J. Environ. Manag. 2018, 212, 405–414. [Google Scholar] [CrossRef]
- Premachandra, D.S.P.R.D.; Nayantha, K.H.D.; Jayasinghe, C. Investigation on Micro-Climatic Features Affecting the Indoor Air Quality in Suburbs, University of Muratuwa. In Proceedings of the 5th International Conference on Sustainable Built Environment, Kandy, Sri Lanka, 12–15 December 2014. [Google Scholar]
- Popa, R.A.; Popa, D.C.; Gheorghe, E.M.; George, S.; Bălănescu, M.; Paștea, D.; Vulpe, A.; Marius, V.; Drăgulinescu, A.M. Hybrid platform for assessing air pollutants released from animal husbandry activities for sustainable livestock agriculture. Sustainability 2021, 13, 9633. [Google Scholar] [CrossRef]
- IPCC. 2019 Refinement to the 2006 IPCC Guidelines for National Greenhouse Gas Inventories; Calvo Buendia, E., Tanabe, K., Kranjc, A., Baasansuren, J., Fukuda, M., Ngarize, S., Osako, A., Pyrozhenko, Y., Shermanau, P., Federici, S., Eds.; IPCC: Geneva, Switzerland, 2019. [Google Scholar]


| Sensor Name | Parameter | Measurement Unit | Minimum Measured Value | Maximum Measured Value |
|---|---|---|---|---|
| BME280 1 | Temperature | °C | 0 | 65 |
| BME280 | Humidity | % RH | 0 | 100 |
| BME280 | Pressure | kPa | 30 | 110 |
| MICS-6814 2 | CO | ppm | 30 | 1000 |
| MICS-6814 | NO2 | ppm | 0.05 | 5 |
| CCS_811 3 | CO2 | ppm | 350 | 10,000 |
| SEN0237-A 4 | O2 | % | 0 | 30 |
| CCS811 | VOC | ppm | 30 | 400 |
| OPC-N2 5 | PM1 | μg/m³ | 0 | 1 |
| OPC-N2 | PM2.5 | μg/m³ | 0 | 2.5 |
| OPC-N2 | PM10 | μg/m³ | 0 | 10 |
| Crt. No. | Parameter | Guideline | Equation/Table Number in IPCC, 2019 and EMEP, 2019 |
|---|---|---|---|
| Calculated parameters | |||
| 1 | Nex | IPCC, 2019 | 10.31 A |
| 2 | Nintake | IPCC, 2019 | 10.32 |
| 3 | Nretention | IPCC, 2019 | 10.33 |
| 4 | NEg | IPCC, 2019 | 10.6 |
| 5 | mhous_N | EMEP, 2019 | 5 |
| 6 | mhous_TAN | EMEP, 2019 | 10 |
| 7 | mhous_solid_N | EMEP, 2019 | 14 |
| 8 | Ehous_solid | EMEP, 2019 | 16 |
| 9 | Estorage_solid | EMEP, 2019 | 34 |
| 10 | EMMS_NH3 | EMEP, 2019 | 46 |
| Default values | |||
| 1 | XTAN | EMEP, 2019 | Table 3.9 |
| 2 | EFhousing | EMEP, 2019 | Table 3.9 |
| 3 | EFPM2.5, EFPM10 | EMEP, 2019 | Table 3.5 |
| Category | PB (g/kg) | GB (g/kg) | CelB (g/kg) | SEN (g/kg) | GE (Kcal/kg) |
|---|---|---|---|---|---|
| Barley straw | 32.00 | 14.00 | 390.00 | 381.00 | 3772.91 |
| Alfalfa hay | 120.00 | 30.00 | 330.00 | 340.00 | 3969.90 |
| Corn silage | 22.00 | 8.00 | 85.00 | 127.00 | 1138.58 |
| Corn kernels | 90.00 | 40.00 | 22.00 | 710.00 | 3960.88 |
| Barley kernels | 100.00 | 20.00 | 56.00 | 678.00 | 3857.50 |
| Rape seed meal | 350.00 | 25.00 | 130.00 | 312.00 | 4163.24 |
| Wheat bran | 150.00 | 40.00 | 105.00 | 530.00 | 3951.05 |
| Soybean meal | 443.00 | 14.00 | 63.00 | 311.00 | 4265.60 |
| Beer wort | 50.40 | 15.20 | 38.10 | 70.00 | 907.09 |
| Green mass | 31.00 | 4.80 | 60.00 | 70.00 | 802.22 |
| Category | Animal Category | |||||
|---|---|---|---|---|---|---|
| Dairy Cattle | Primiparous and Heifers | Youth (3–9 Months) | ||||
| Summer | Winter | Summer | Winter | Summer | Winter | |
| kg/Head/Day | kg/Head/Day | kg/Head/Day | kg/Head/Day | kg/Head/Day | kg/Head/Day | |
| Barley straw | 0.5 | 0.5 | 1.5 | 1.5 | 1.0 | 1.0 |
| Alfalfa hay | 2.0 | 2.0 | 3.5 | 3.5 | 2.0 | 2.0 |
| Corn silage | 20.0 | 20.0 | 15.0 | 17.0 | 9.0 | 9.0 |
| Corn kernels | 3.5 | 3.8 | 3.5 | 4.0 | 2.5 | 2.5 |
| Barley kernels | 1.5 | 1.5 | 1.5 | 1.0 | 0.3 | 0.3 |
| Rape seed meal | 2.5 | 2.5 | 2.0 | 2.0 | 0.3 | 0.3 |
| Wheat bran | 2.0 | 2.0 | - | - | - | - |
| Soybean meal | 2.0 | 2.0 | 2.0 | 2.0 | - | - |
| Beer wort | - | 8.0 | - | 3.0 | - | - |
| Green mass | 8.0 | - | 5.0 | - | - | - |
| Total | 42.0 | 42.3 | 34.0 | 34 | 15.1 | 15.1 |
| Category Season | Dairy Cows | Heifers and Primiparous | Youth (3–9 Months) |
|---|---|---|---|
| Winter | 330.91 | 270.33 | 143.40 |
| Summer | 335.90 | 280.10 | 143.40 |
| Category Parameter | Dairy Cows | Heifers and Primiparous | Youth (3–9 Months) | ||
|---|---|---|---|---|---|
| Days of life | 365 | 365 | 180 | ||
| Heads number | 120 | 40 | 40 | ||
| AAP | 365 | 365 | 19.73 | ||
| Season | Summer | Winter | Summer | Winter | All year |
| GE (MJ/head/day) | 330.91 | 335.90 | 270.33 | 280.10 | 143.40 |
| CP% (%) | 0.143 | 0.160 | 0.161 | 0.170 | 0.205 |
| Milk (kg/head/day) | 30 | 28 | - | - | - |
| Milk% (%) | 1.92 | 1.92 | - | - | - |
| WG (kg/day) | 0.2 | 0.2 | 0.4 | 0.4 | 0.9 |
| NEg (MJ/head/day) | 1.96 | 1.96 | 3.93 | 8.31 | 6.05 |
| Nex (kg/head/year) | 119.83 | 139.78 | 135.06 | 147.55 | 81.40 |
| Animal Category | NH3 (t/Year) | ||
|---|---|---|---|
| Season | |||
| Summer (185 Days) | Winter (180 Days) | All Year (365 Days) | |
| Dairy cattle | 1.21 | 1.40 | 2.61 |
| Primiparous and heifers | 0.48 | 0.5 | 0.98 |
| Young (3–9 months) | 0.92 | 0.92 | |
| Total | 4.51 | ||
| Category | Heads No | Life Days | AAP | EF | Emissions (kg/Year) | ||
|---|---|---|---|---|---|---|---|
| PM10 | PM2.5 | PM10 | PM2.5 | ||||
| Dairy cows | 120 | 365 | 110 | 0.63 | 0.41 | 75.6 | 49.2 |
| Heifers and primiparous | 40 | 365 | 50 | 0.63 | 0.41 | 25.2 | 16.4 |
| Young | 40 | 180 | 19.73 | 0.27 | 0.18 | 10.8 | 7.2 |
| Total | 111.6 | 72.8 | |||||
| Specification | HUM | NH3 | PM1 | PM10 | PM2.5 | T0C |
|---|---|---|---|---|---|---|
| HUM | - | 0.56HS t = 17.99 | 0.43HS t = 12.68 | 0.02NS t = 0.53 | 0.24HS t = 6.58 | -0.67HS t = 24.03 |
| NH3 | - | 0.41HS t = 11.97 | 0.12S t = 3.21 | 0.33HS t = 9.31 | -0.02NS t = 0.53 | |
| PM1 | - | 0.13S t = 3.49 | 0.71HS t = 26.84 | -0.23HS t = 6.29 | ||
| PM10 | - | 0.42HS t = 12.32 | 0.06NS t = 1.60 | |||
| PM2.5 | - | -0.02NS t = 0.53 |
| Specification | HUM | NH3 | PM1 | PM10 | PM2.5 | T0C |
| HUM | - | 0.25HS t = 6.30 | 0.18HS t = 4.46 | −0.31HS t = 7.95 | −0.18HS t = 4.46 | −0.89HS t = 47.61 |
| NH3 | - | 0.11S t = 2.70 | −0.03NS t = 0.73 | 0.002NS t = 0.048 | −0.25HS t = 6.29 | |
| PM1 | - | 0.39HS t = 10.33 | 0.65HS t = 20.86 | −0.01NS t = 0.24 | ||
| PM10 | - | 0.80HS t = 32.52 | 0.32HS t = 8.23 | |||
| PM2.5 | - | 0.25HS t = 6.30 |
Disclaimer/Publisher’s Note: The statements, opinions and data contained in all publications are solely those of the individual author(s) and contributor(s) and not of MDPI and/or the editor(s). MDPI and/or the editor(s) disclaim responsibility for any injury to people or property resulting from any ideas, methods, instructions or products referred to in the content. |
© 2022 by the authors. Licensee MDPI, Basel, Switzerland. This article is an open access article distributed under the terms and conditions of the Creative Commons Attribution (CC BY) license (https://creativecommons.org/licenses/by/4.0/).
Share and Cite
Popa, R.A.; Popa, D.C.; Pogurschi, E.N.; Vidu, L.; Marin, M.P.; Tudorache, M.; Suciu, G.; Bălănescu, M.; Burlacu, S.; Budulacu, R.; et al. Comparative Evaluation of the Dynamics of Animal Husbandry Air Pollutant Emissions Using an IoT Platform for Farms. Agriculture 2023, 13, 25. https://doi.org/10.3390/agriculture13010025
Popa RA, Popa DC, Pogurschi EN, Vidu L, Marin MP, Tudorache M, Suciu G, Bălănescu M, Burlacu S, Budulacu R, et al. Comparative Evaluation of the Dynamics of Animal Husbandry Air Pollutant Emissions Using an IoT Platform for Farms. Agriculture. 2023; 13(1):25. https://doi.org/10.3390/agriculture13010025
Chicago/Turabian StylePopa, Razvan Alexandru, Dana Catalina Popa, Elena Narcisa Pogurschi, Livia Vidu, Monica Paula Marin, Minodora Tudorache, George Suciu, Mihaela Bălănescu, Sabina Burlacu, Radu Budulacu, and et al. 2023. "Comparative Evaluation of the Dynamics of Animal Husbandry Air Pollutant Emissions Using an IoT Platform for Farms" Agriculture 13, no. 1: 25. https://doi.org/10.3390/agriculture13010025
APA StylePopa, R. A., Popa, D. C., Pogurschi, E. N., Vidu, L., Marin, M. P., Tudorache, M., Suciu, G., Bălănescu, M., Burlacu, S., Budulacu, R., & Vulpe, A. (2023). Comparative Evaluation of the Dynamics of Animal Husbandry Air Pollutant Emissions Using an IoT Platform for Farms. Agriculture, 13(1), 25. https://doi.org/10.3390/agriculture13010025