


The Impact of Economic Growth and Urbanisation on Environmental Degradation in the Baltic States: An Extended Kaya Identity

 ,
,
Abstract
:1. Introduction
2. Materials and Methods
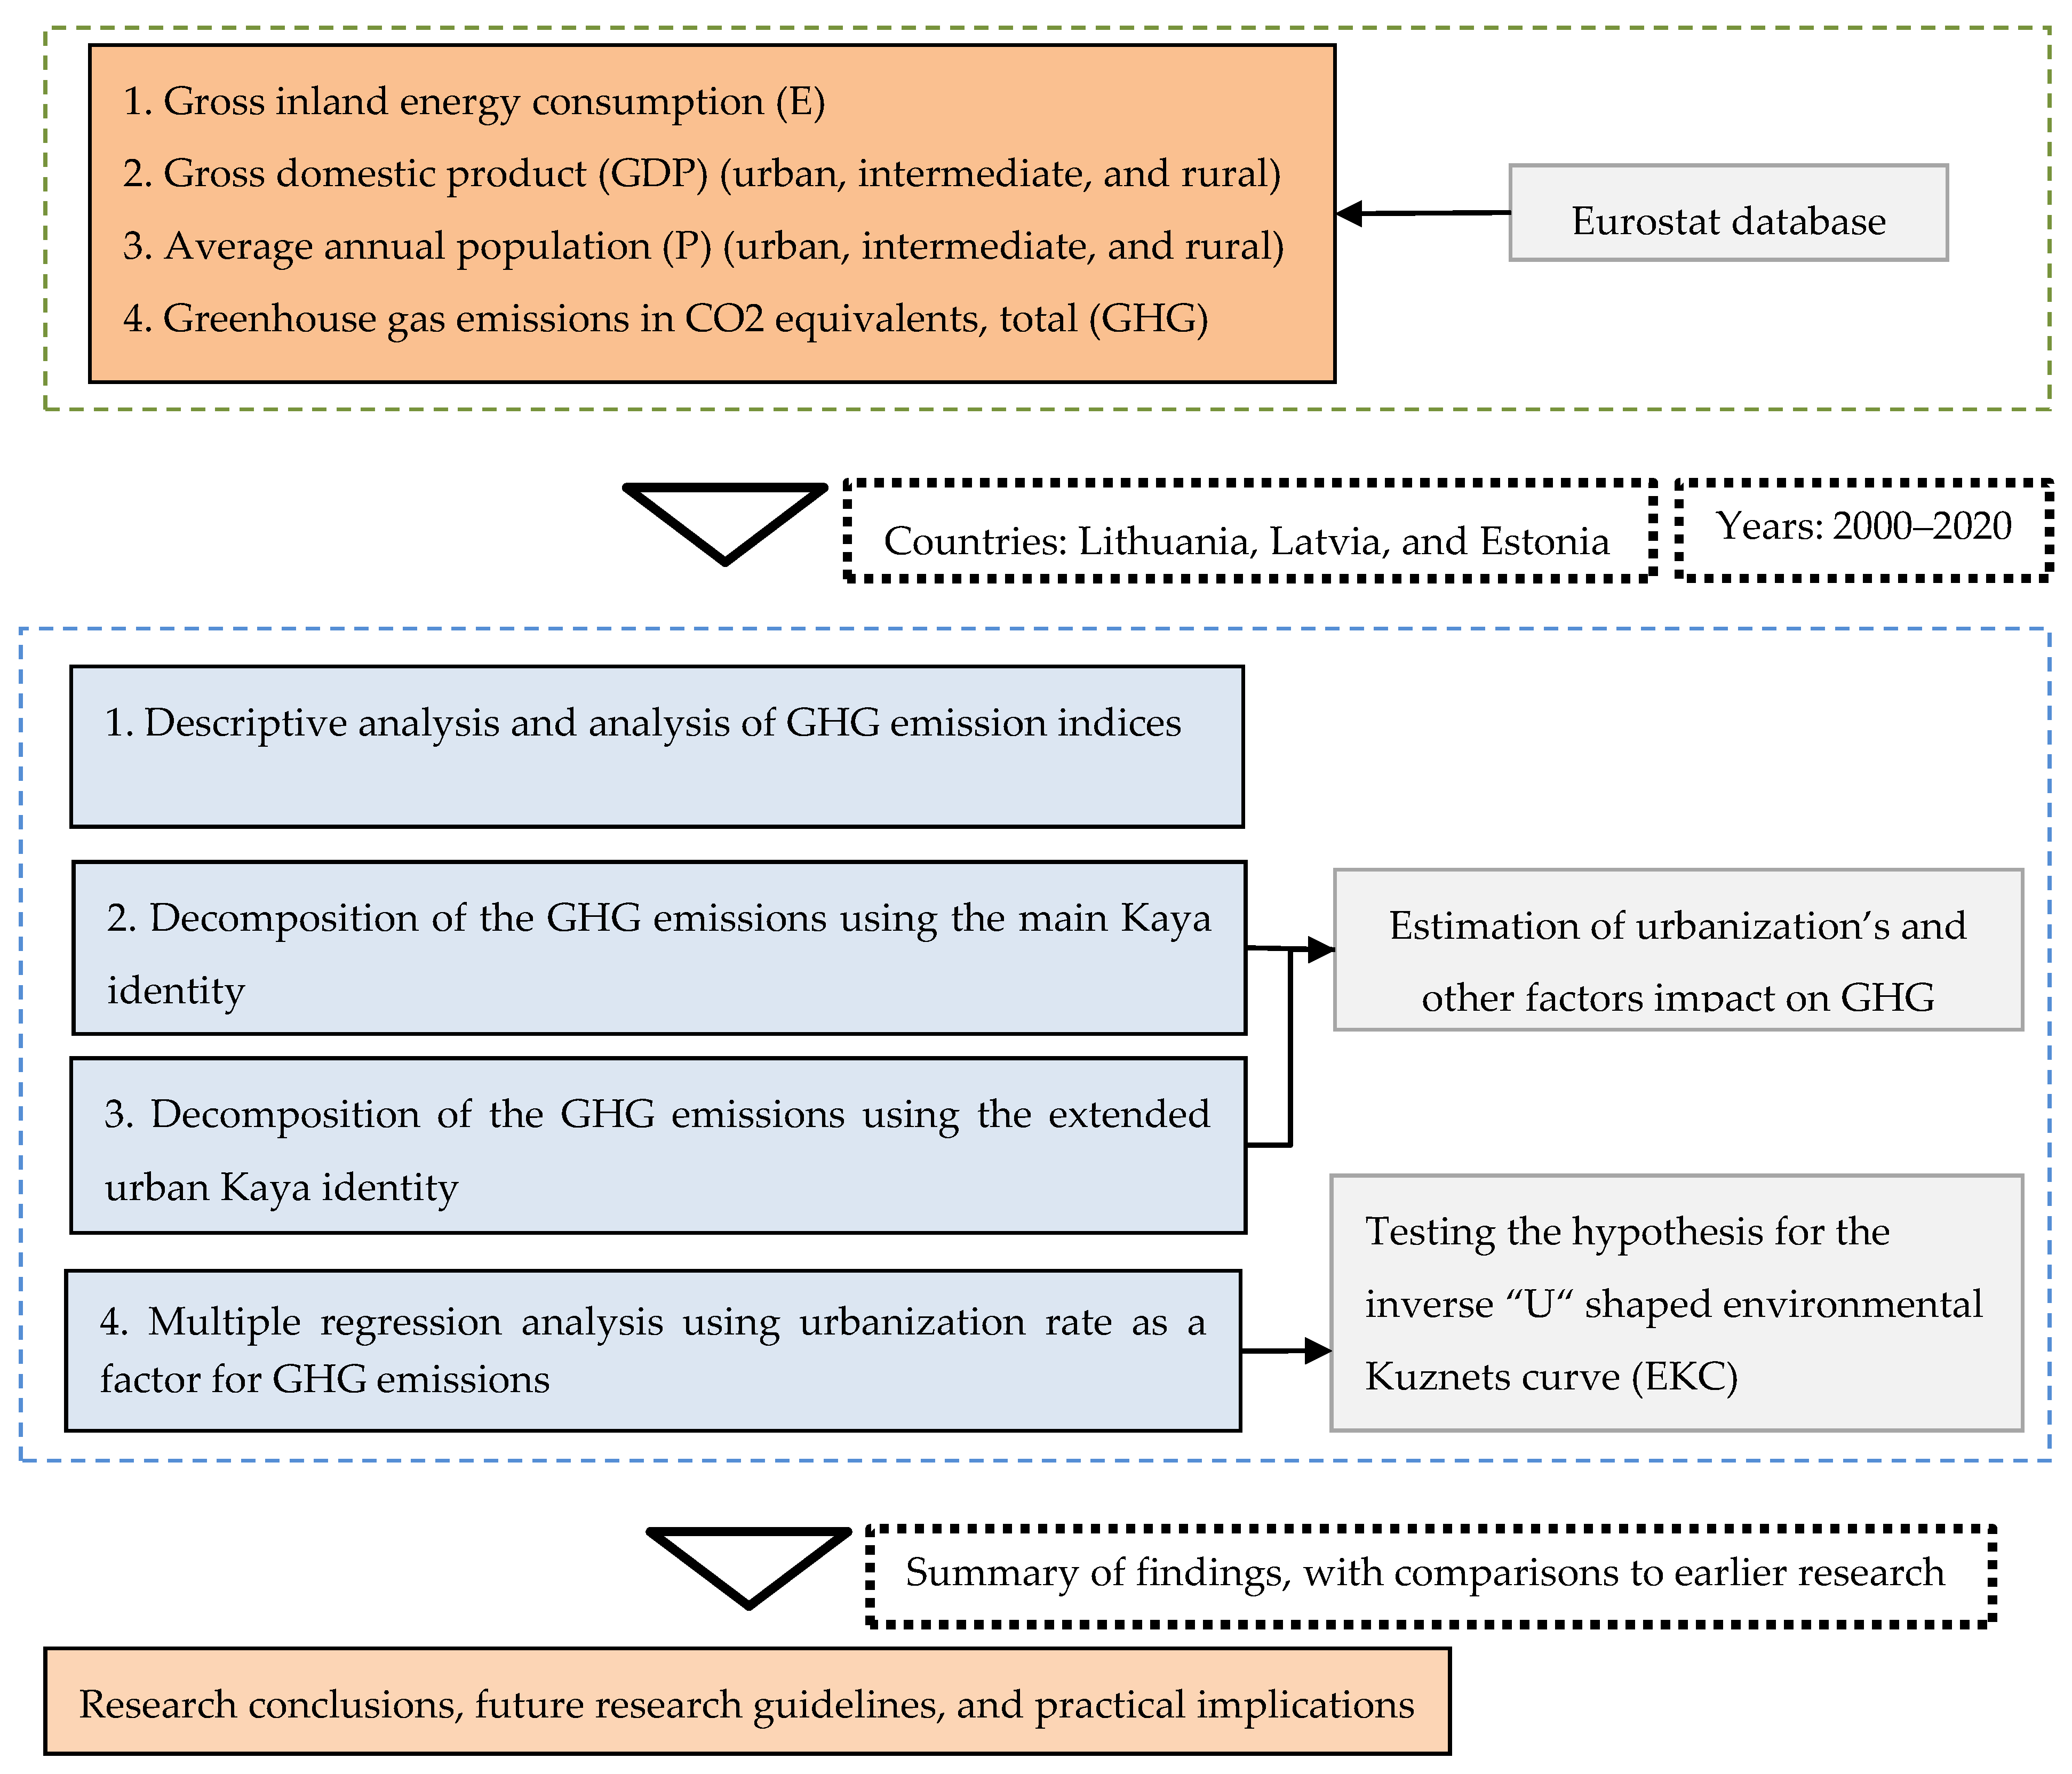
2.1. Data
2.2. Research Framework
2.3. Decomposition of the GHG Emissions Using the Main Kaya Identity
2.4. Decomposition of the GHG Emissions Using the Extended Urban Kaya Identity
2.5. Multiple Regression Analysis Using Urbanisation Rate as a Factor for GHG Emissions
3. Results
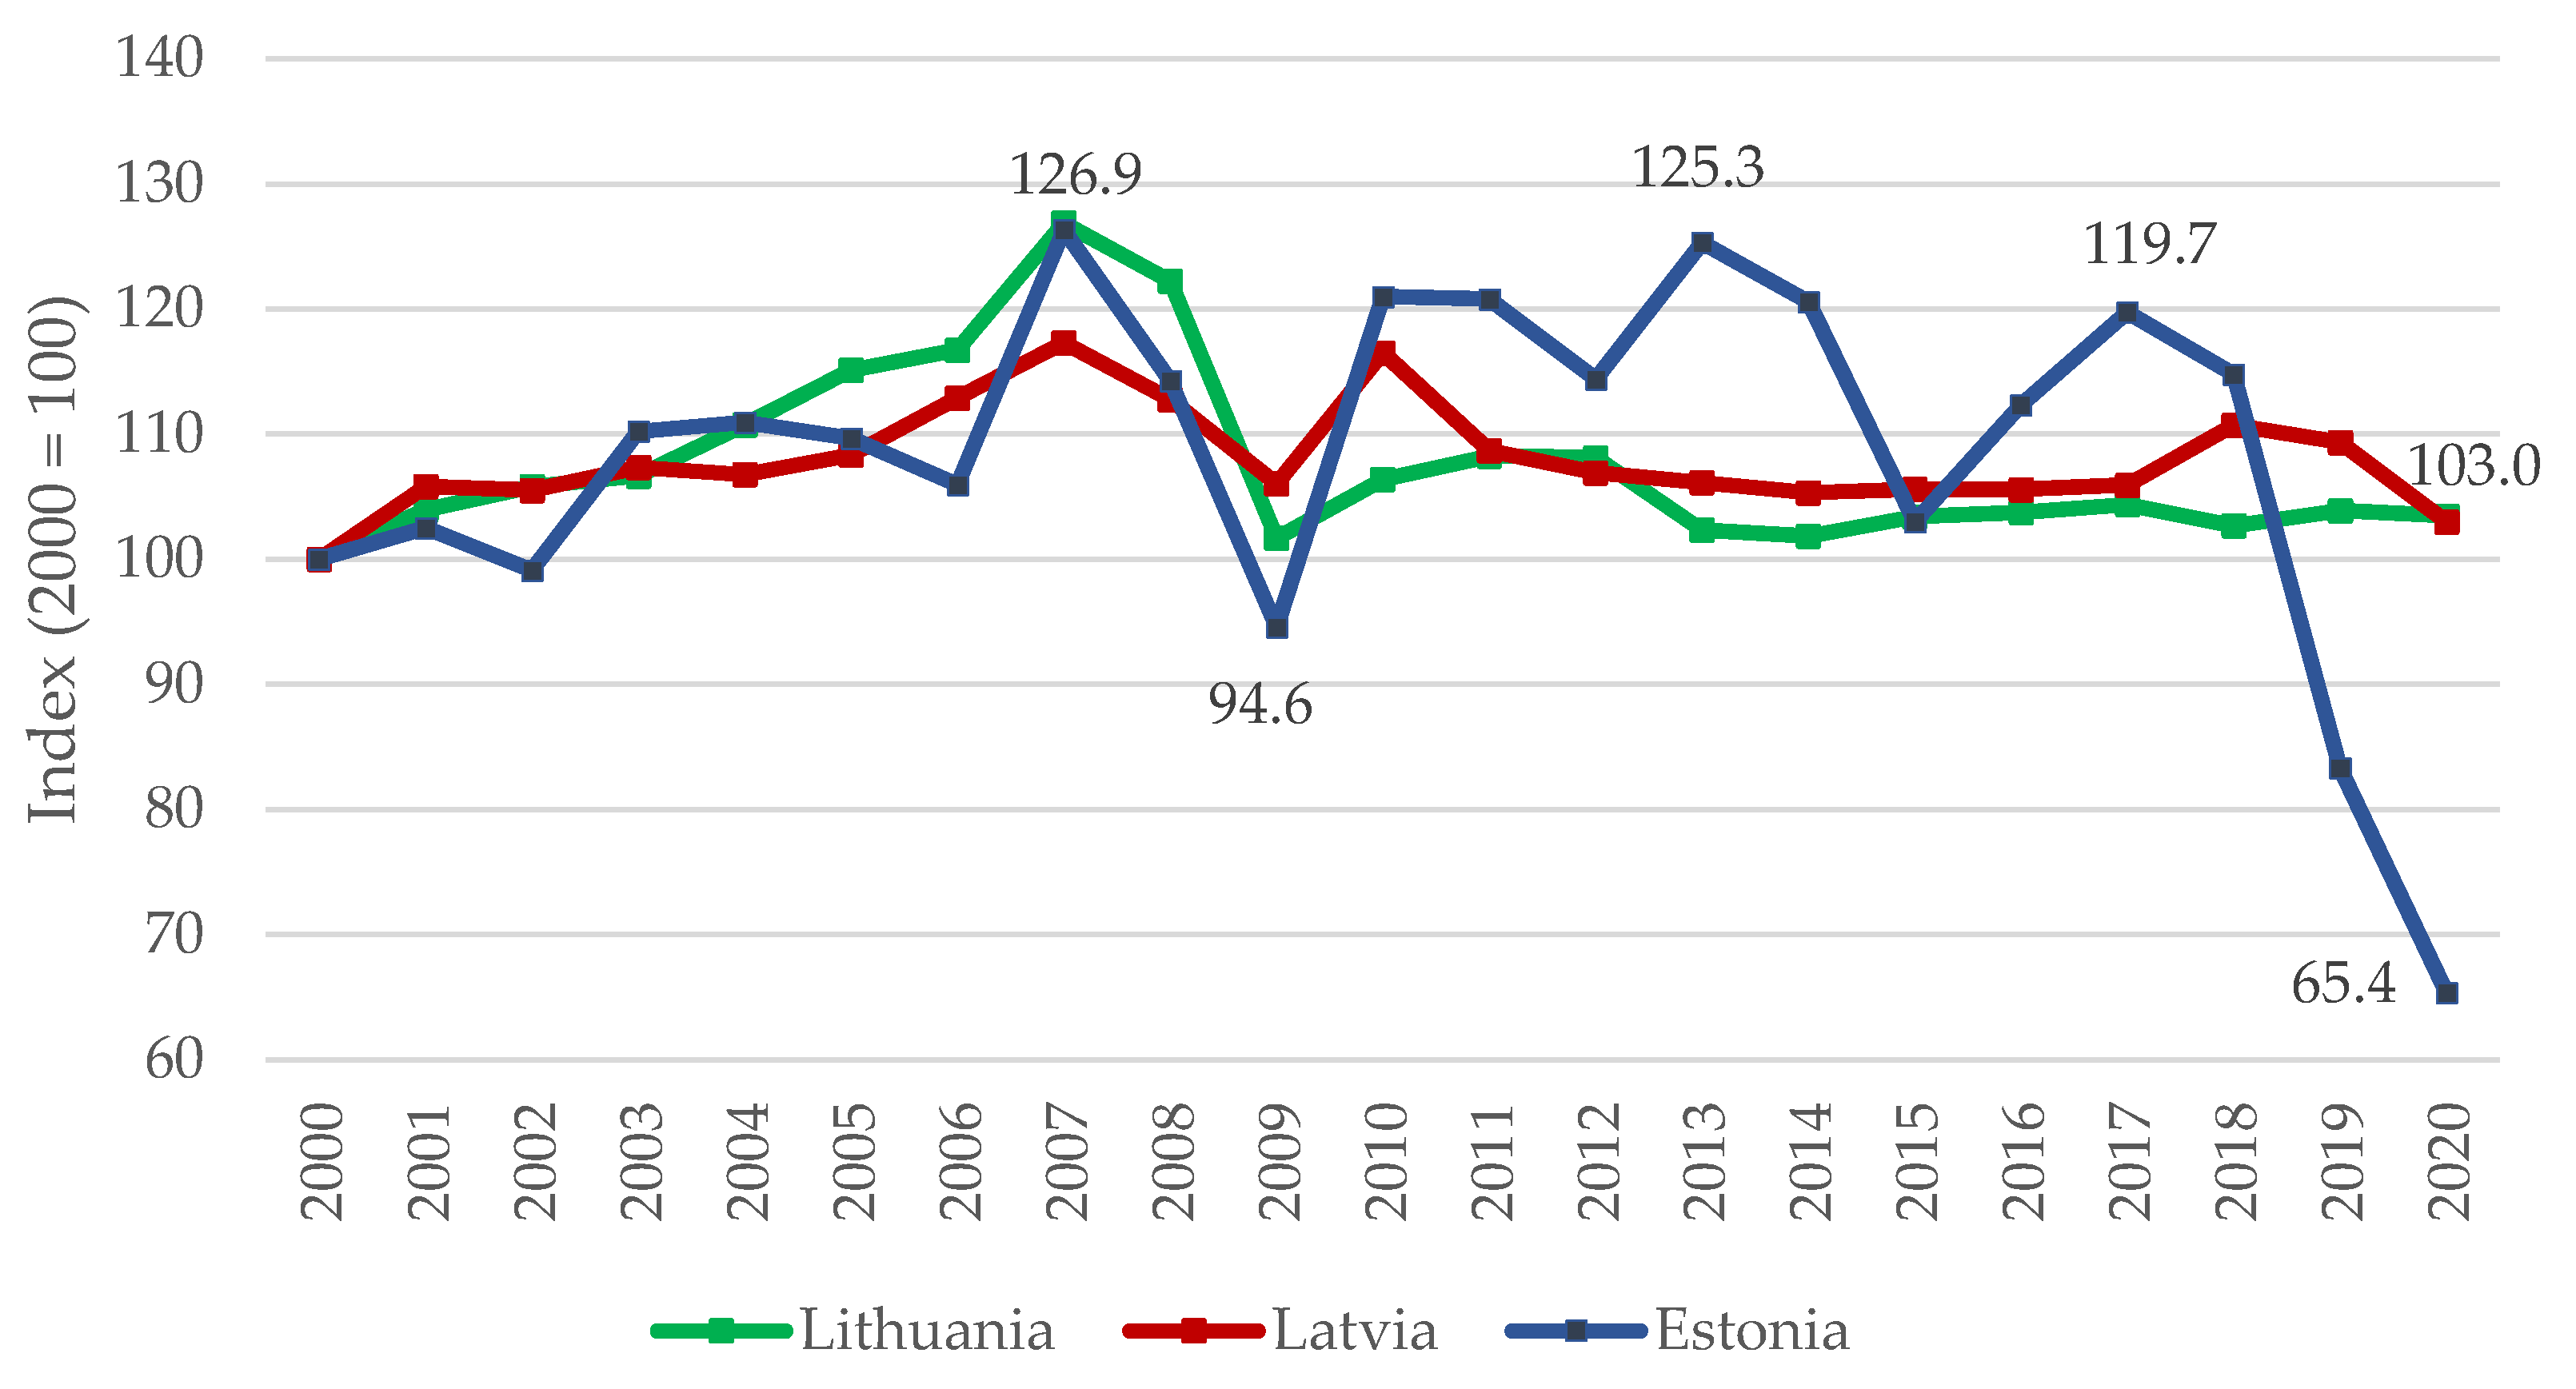
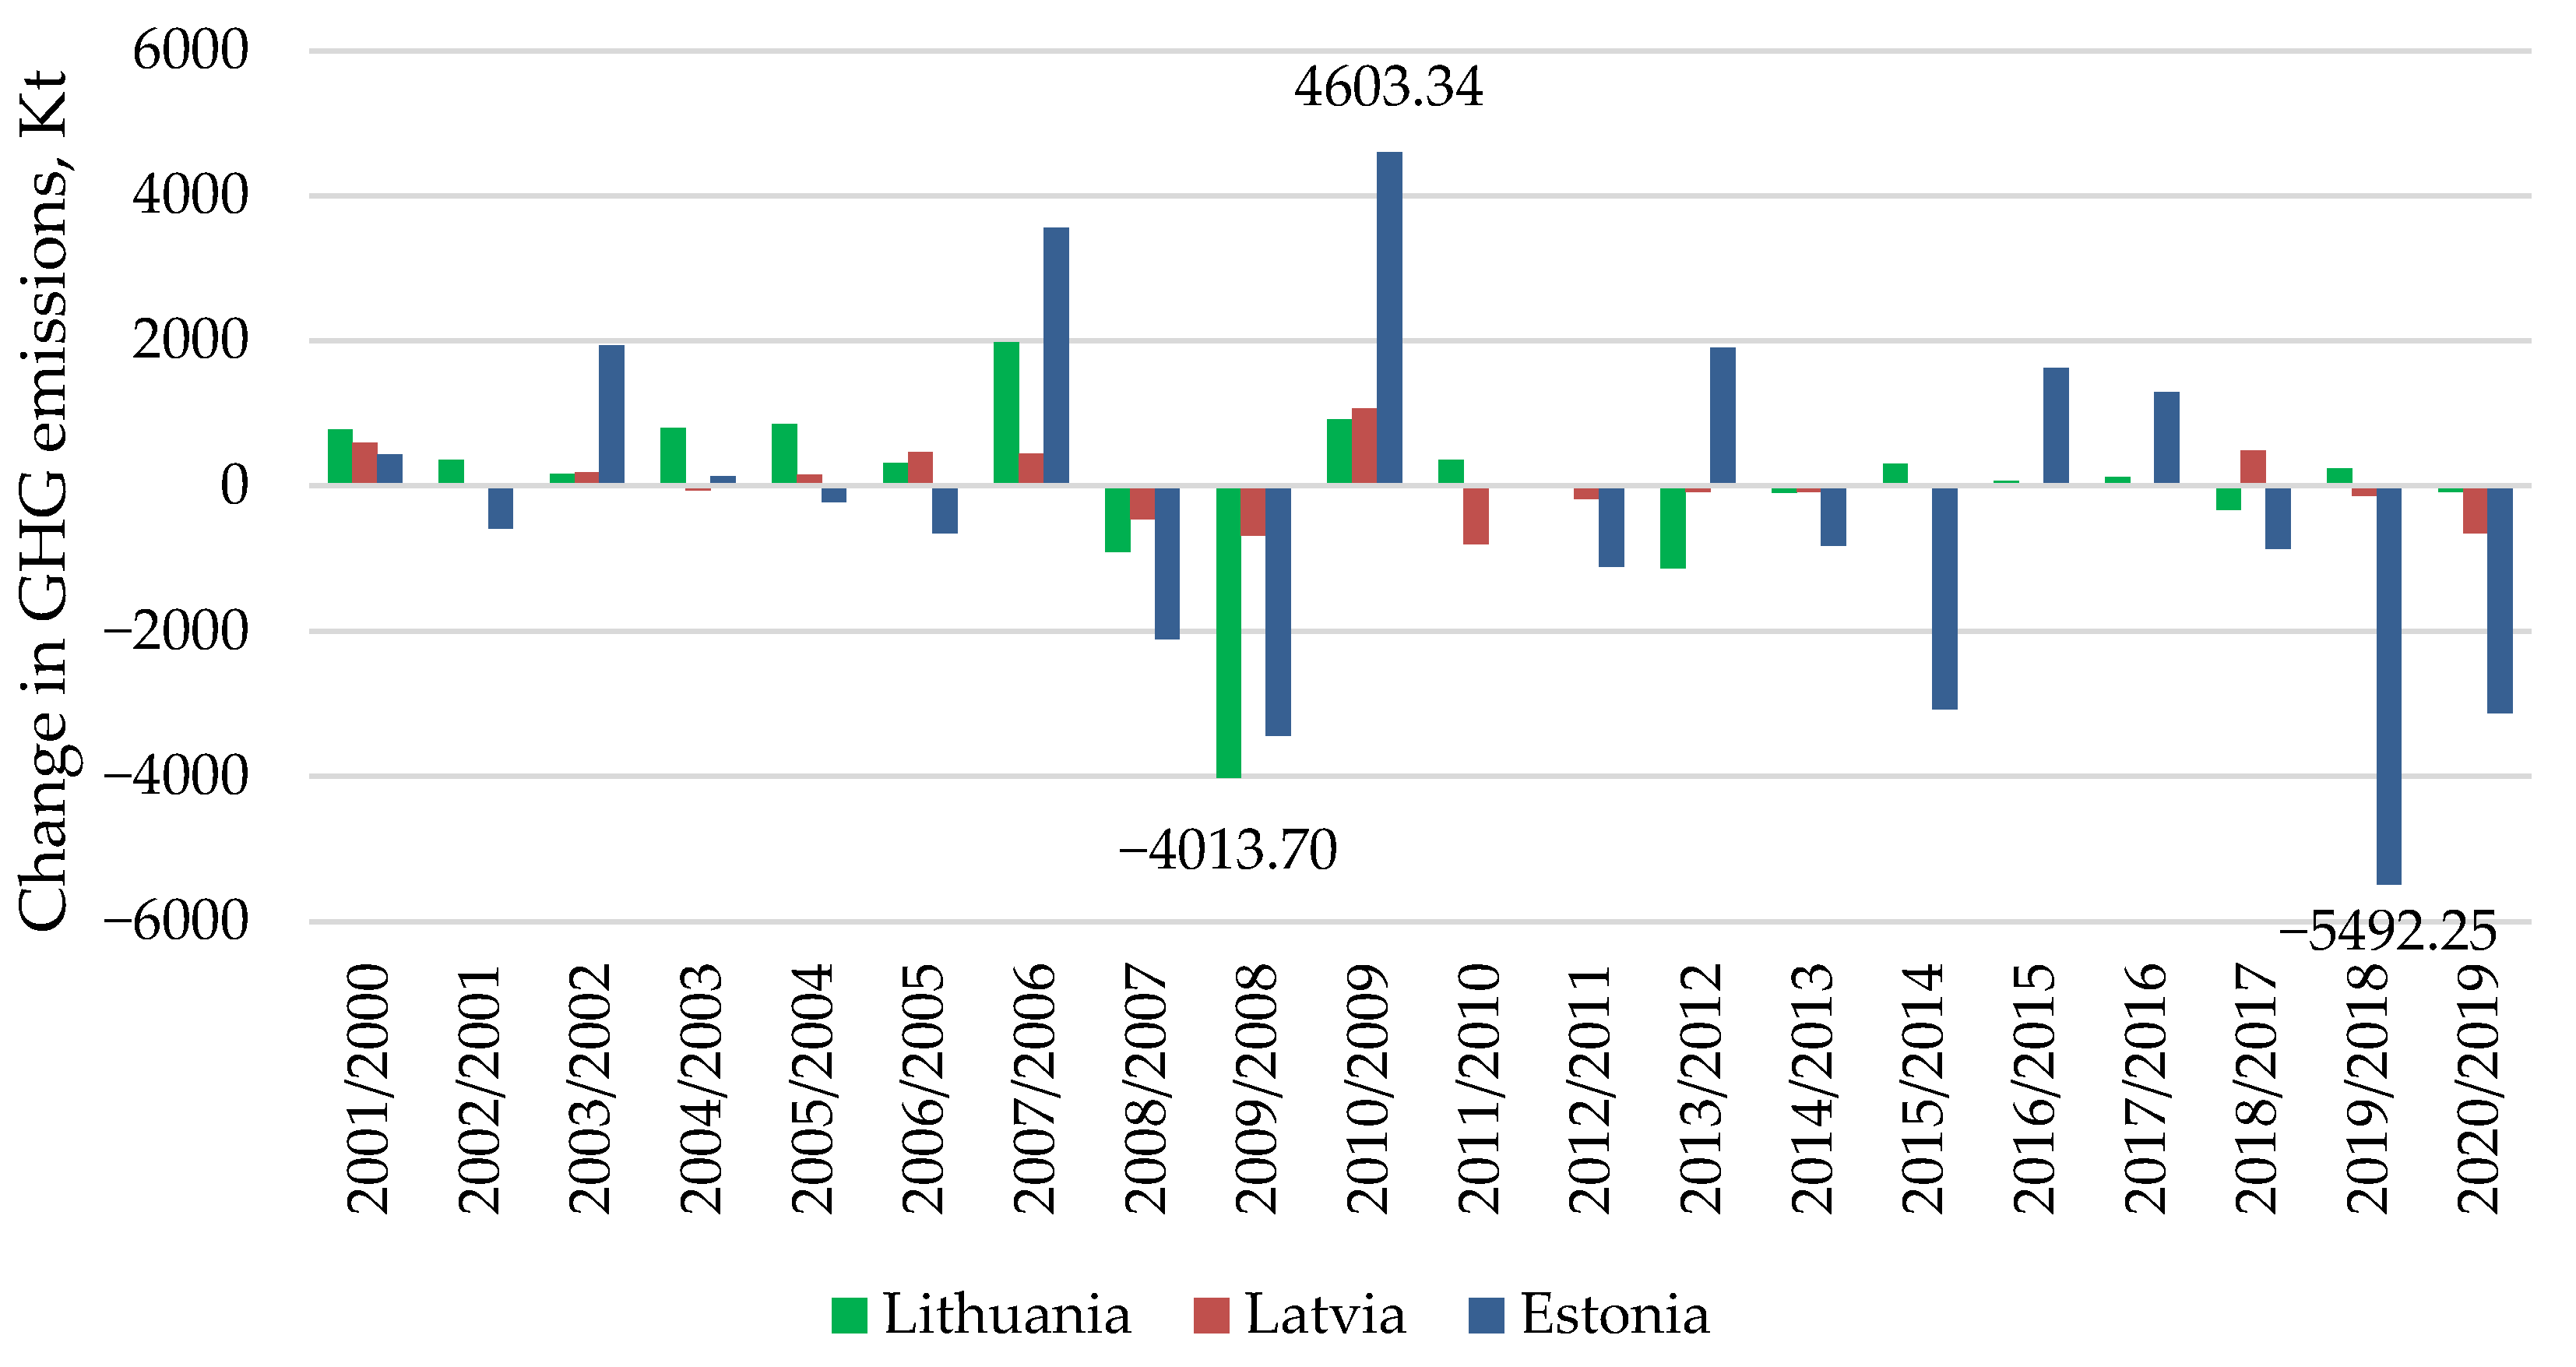
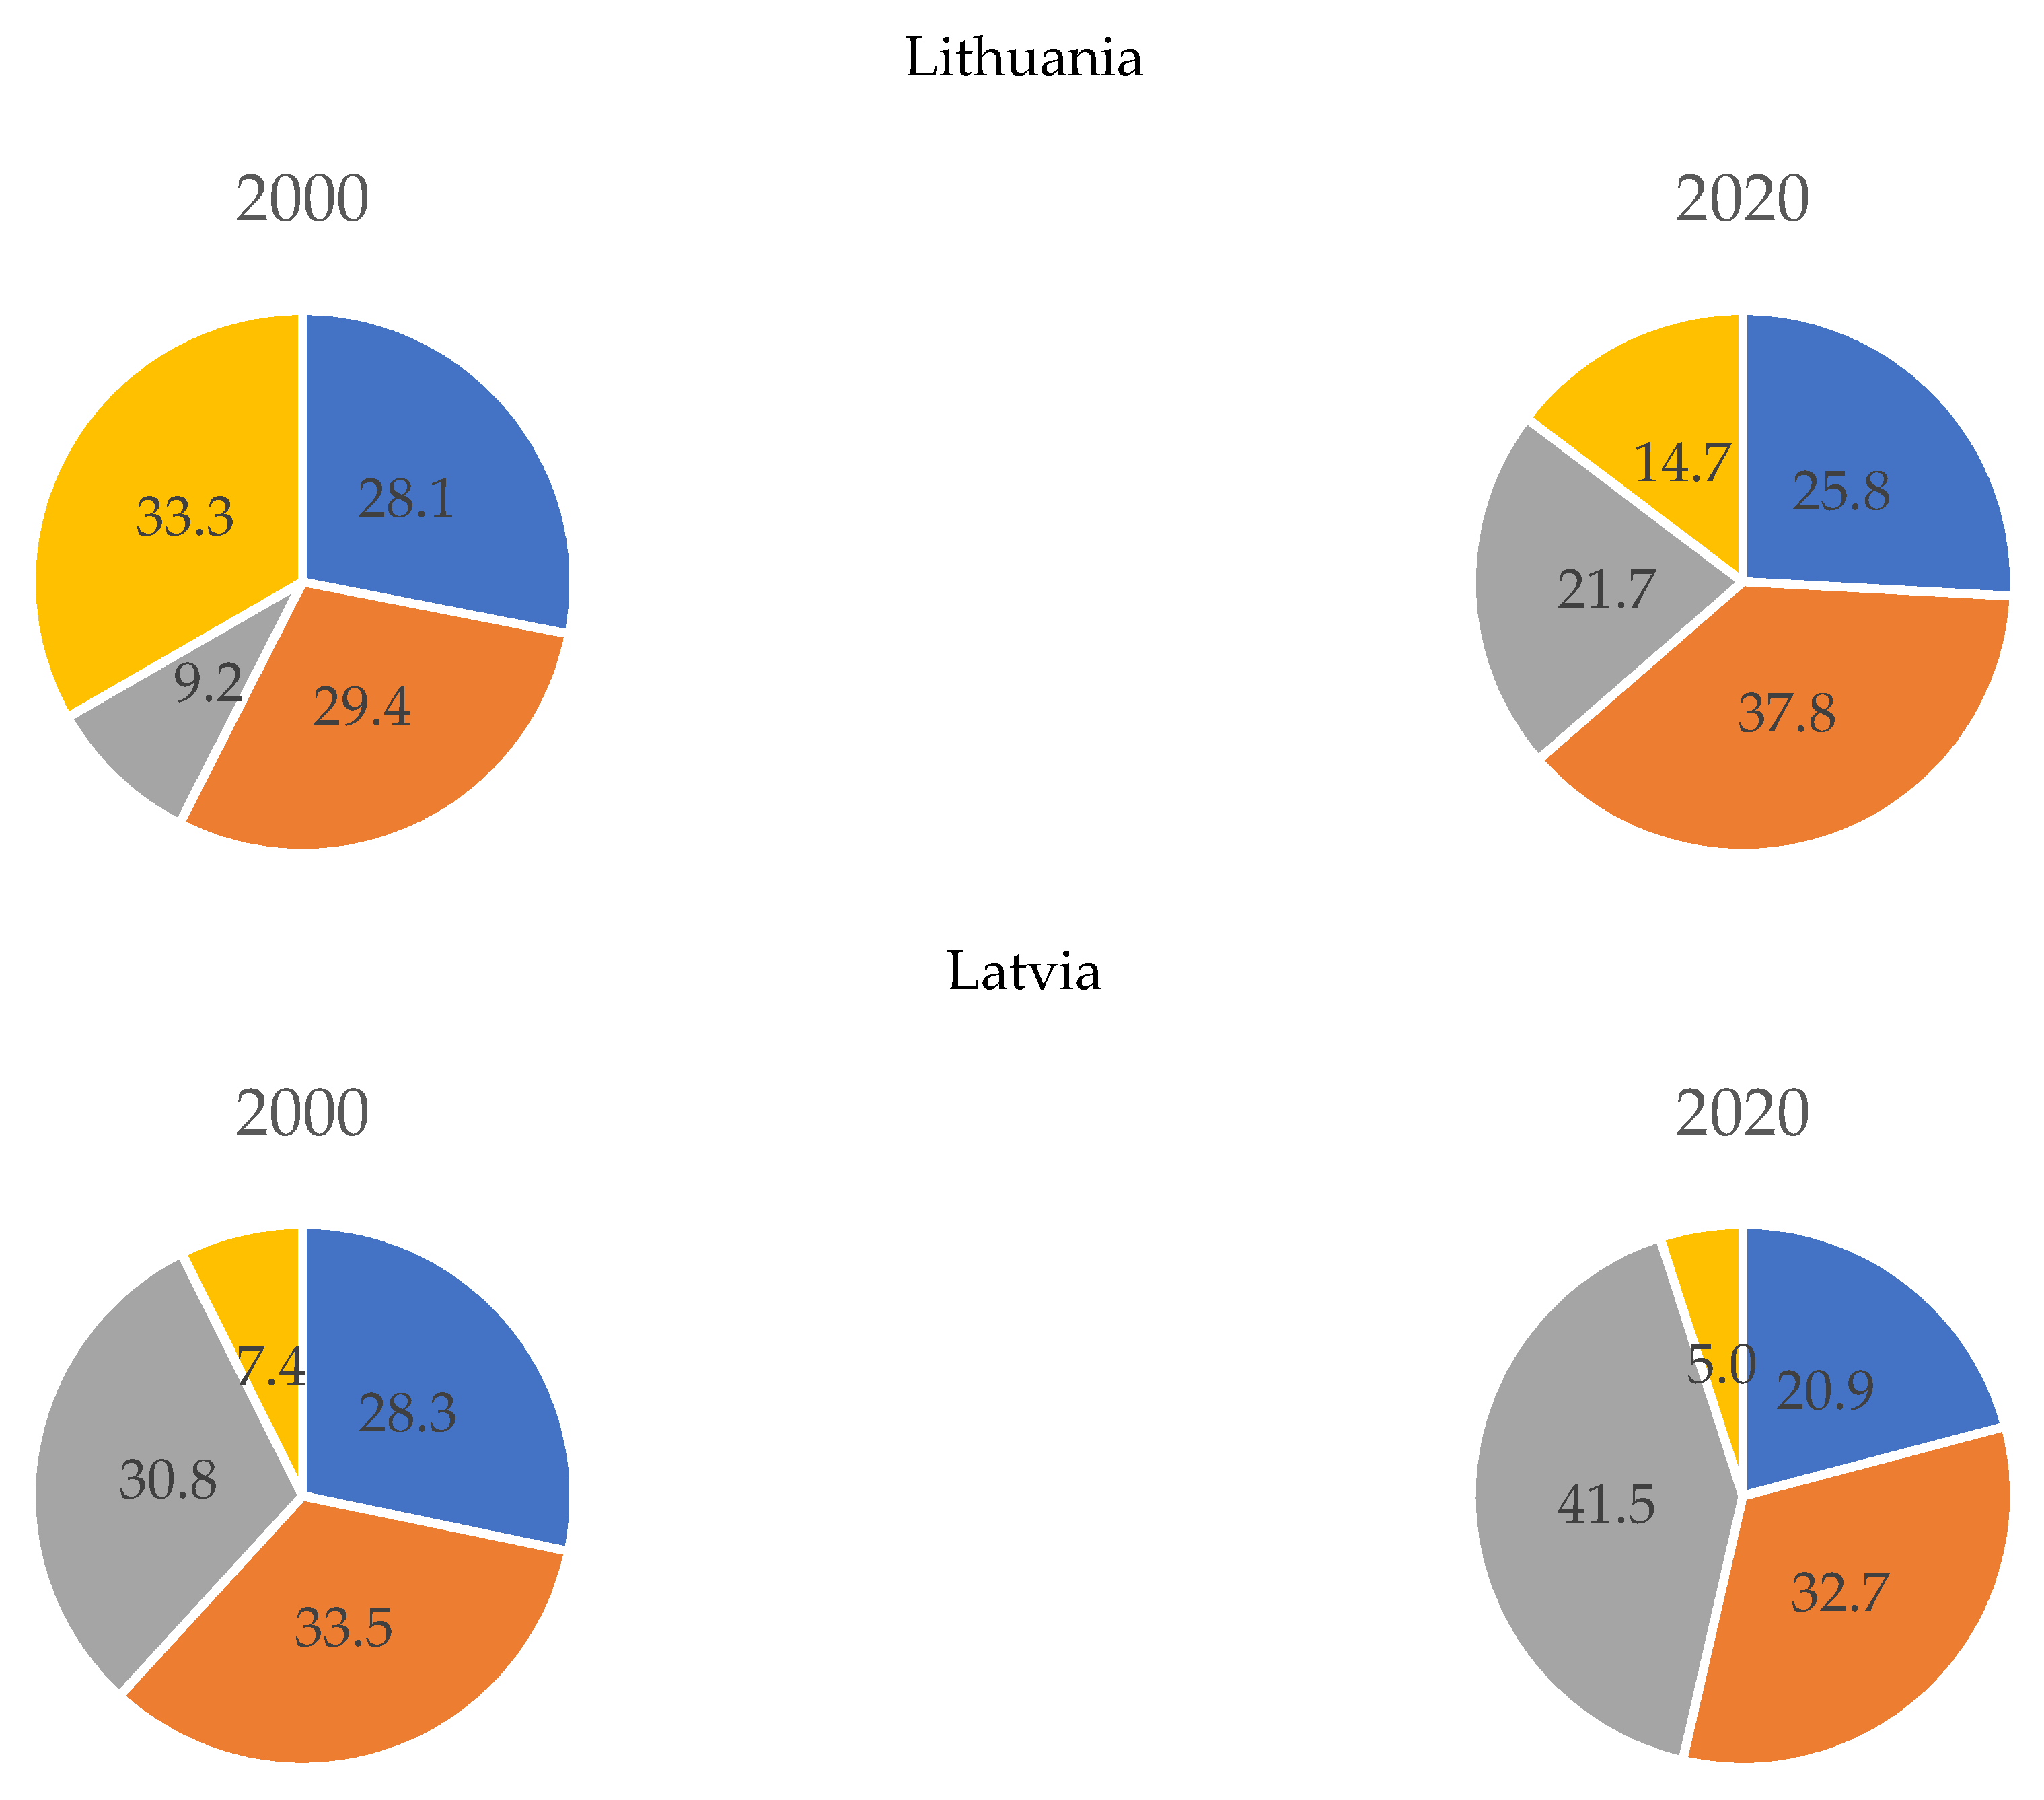
3.1. Descriptive Analysis and Analysis of GHG Emission Indices
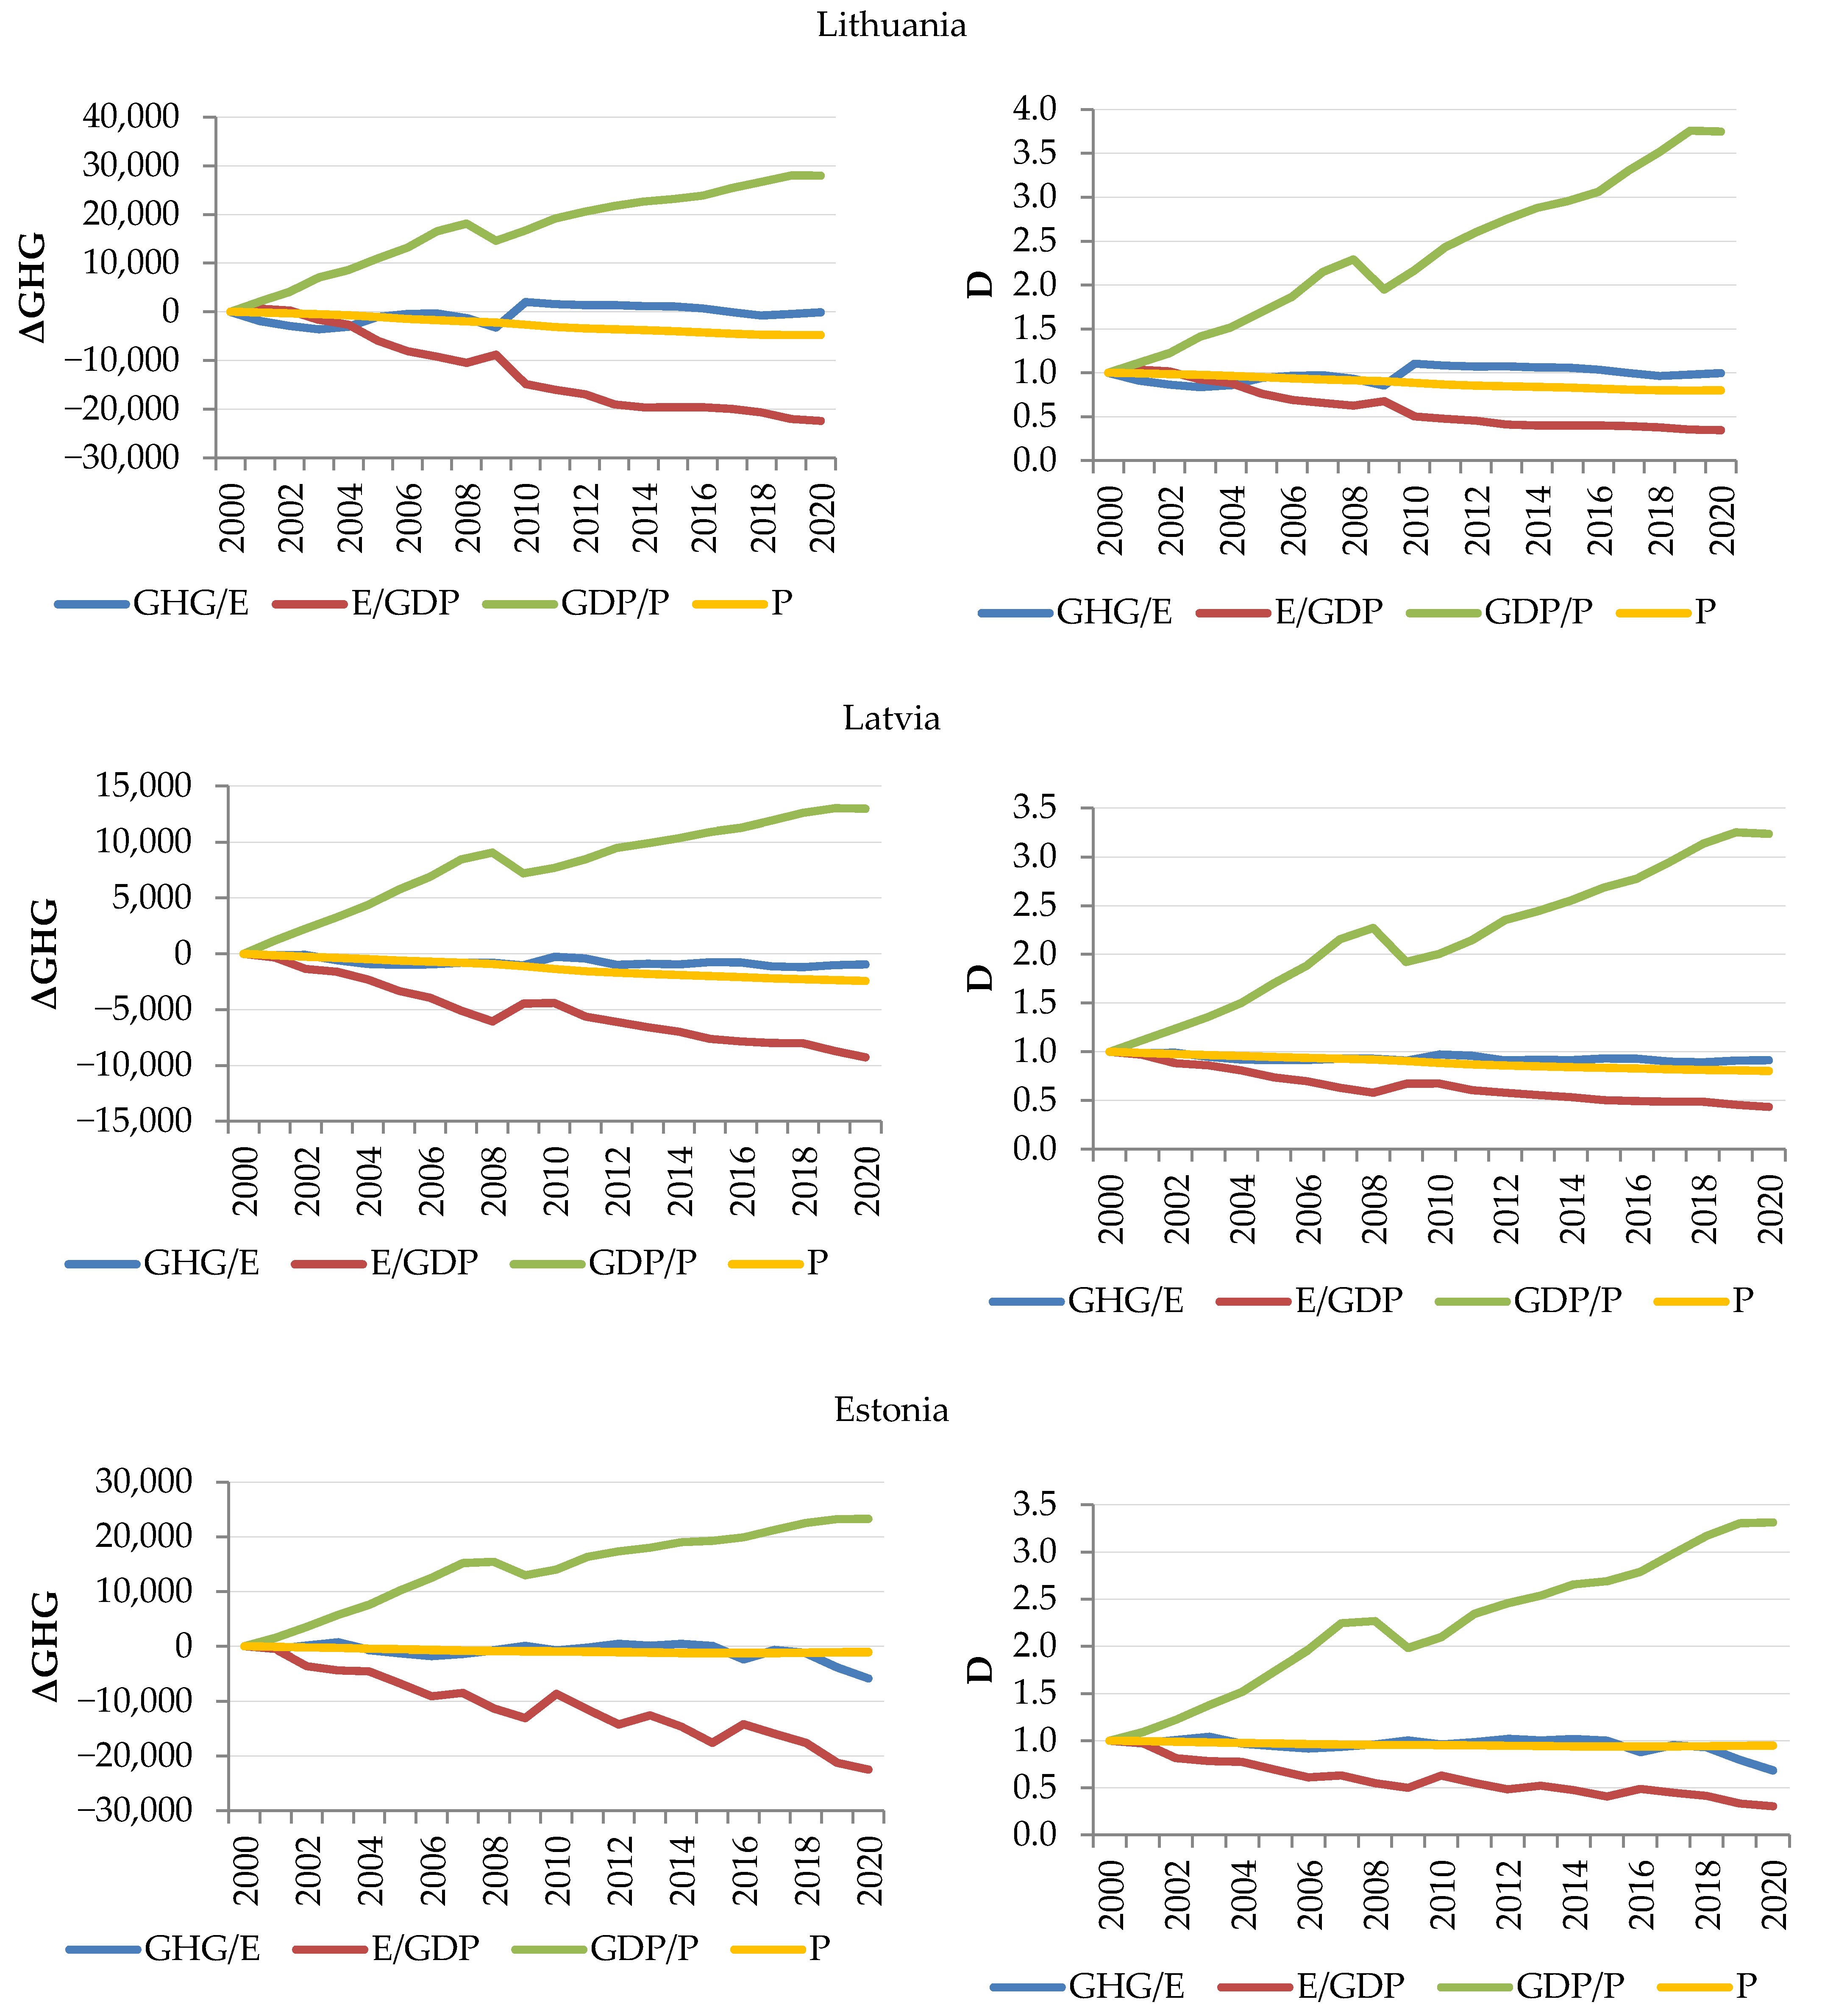
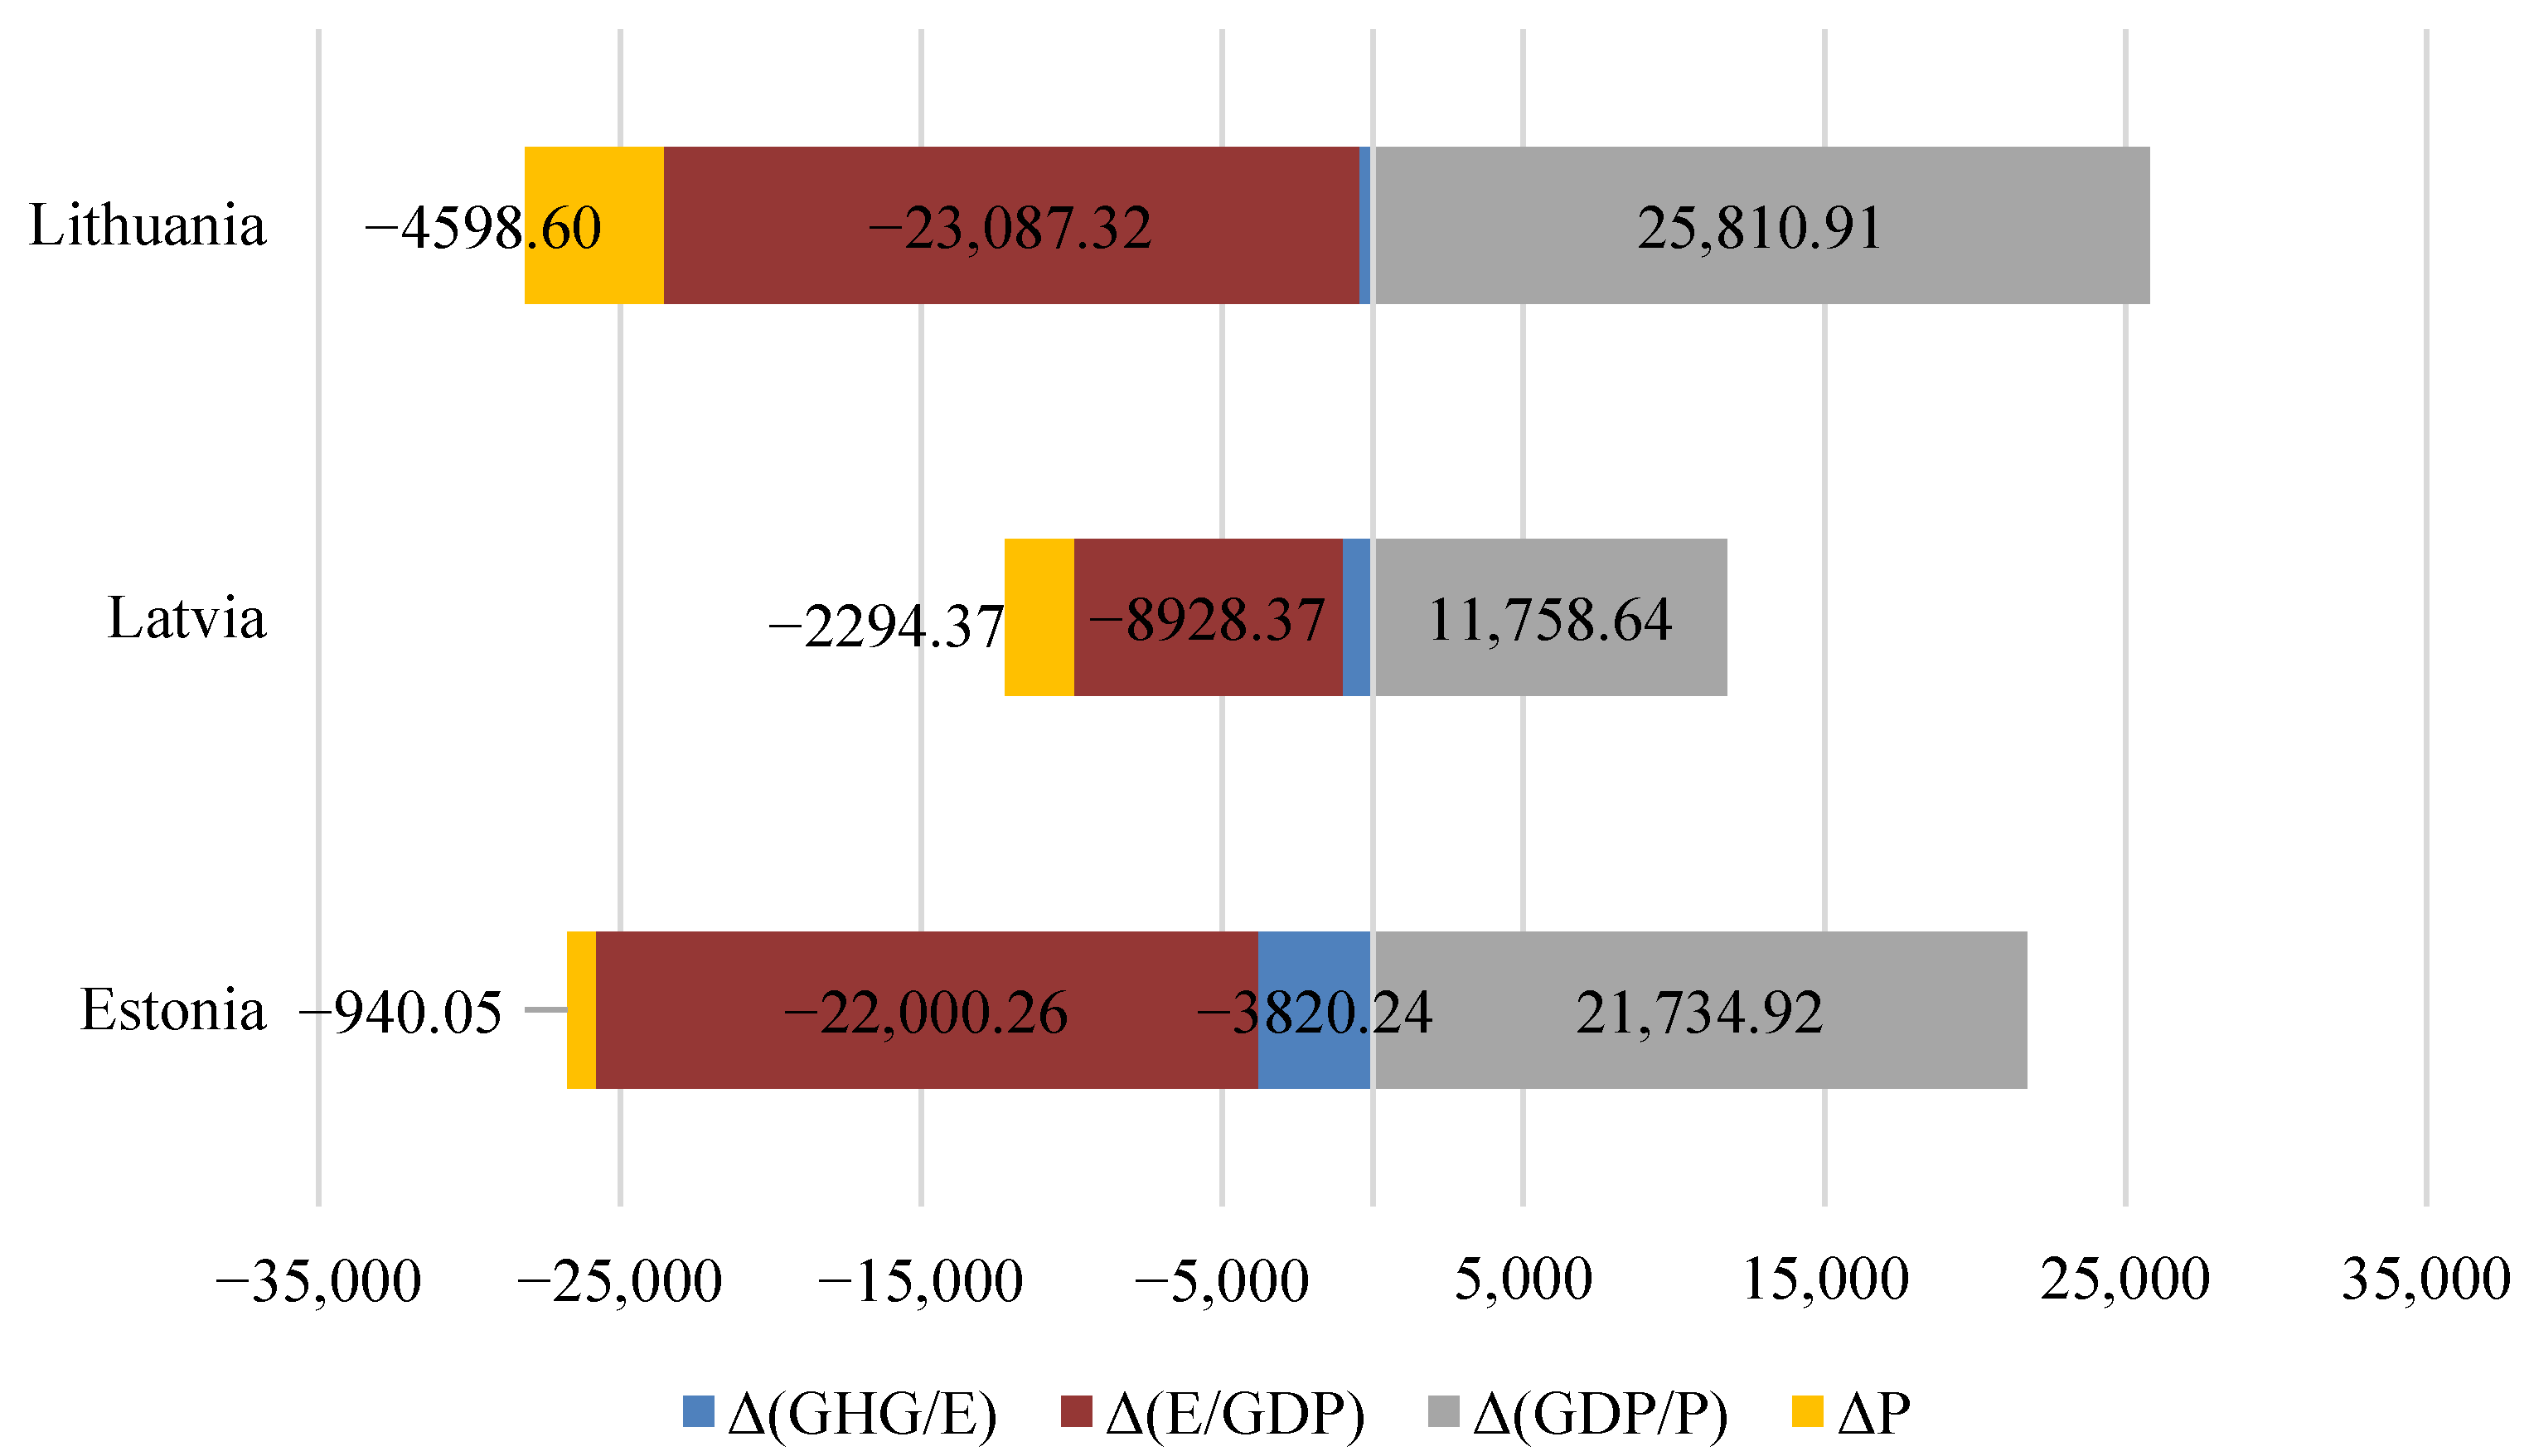
3.2. Estimates from the Main Kaya Identity
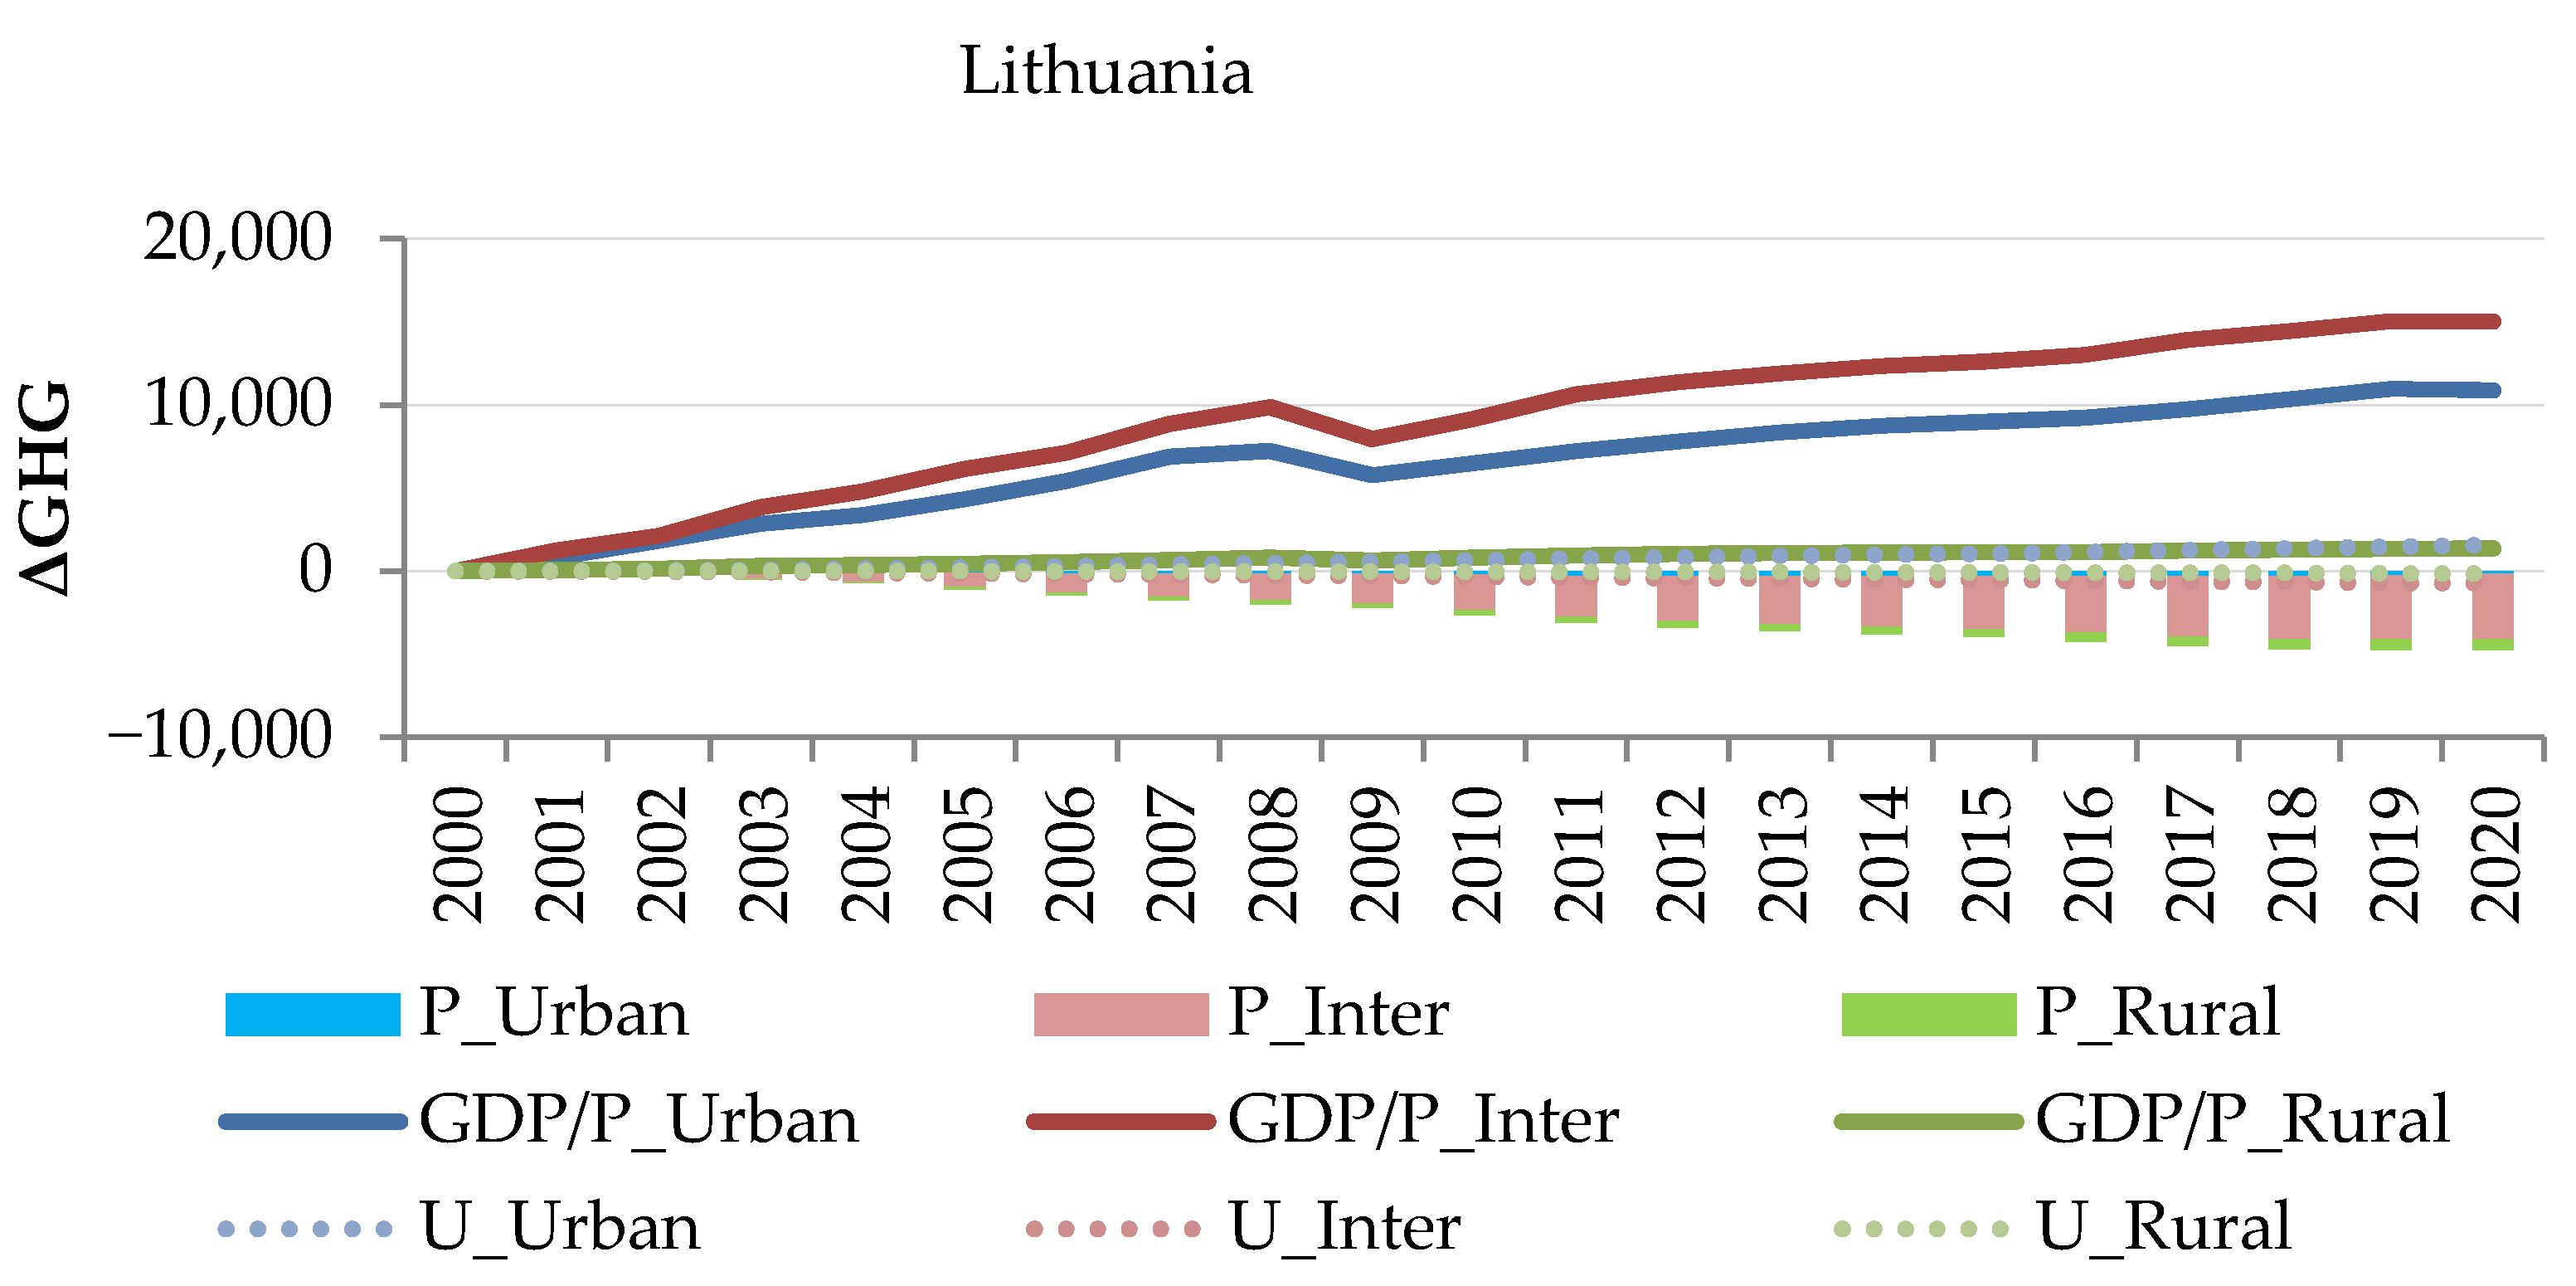
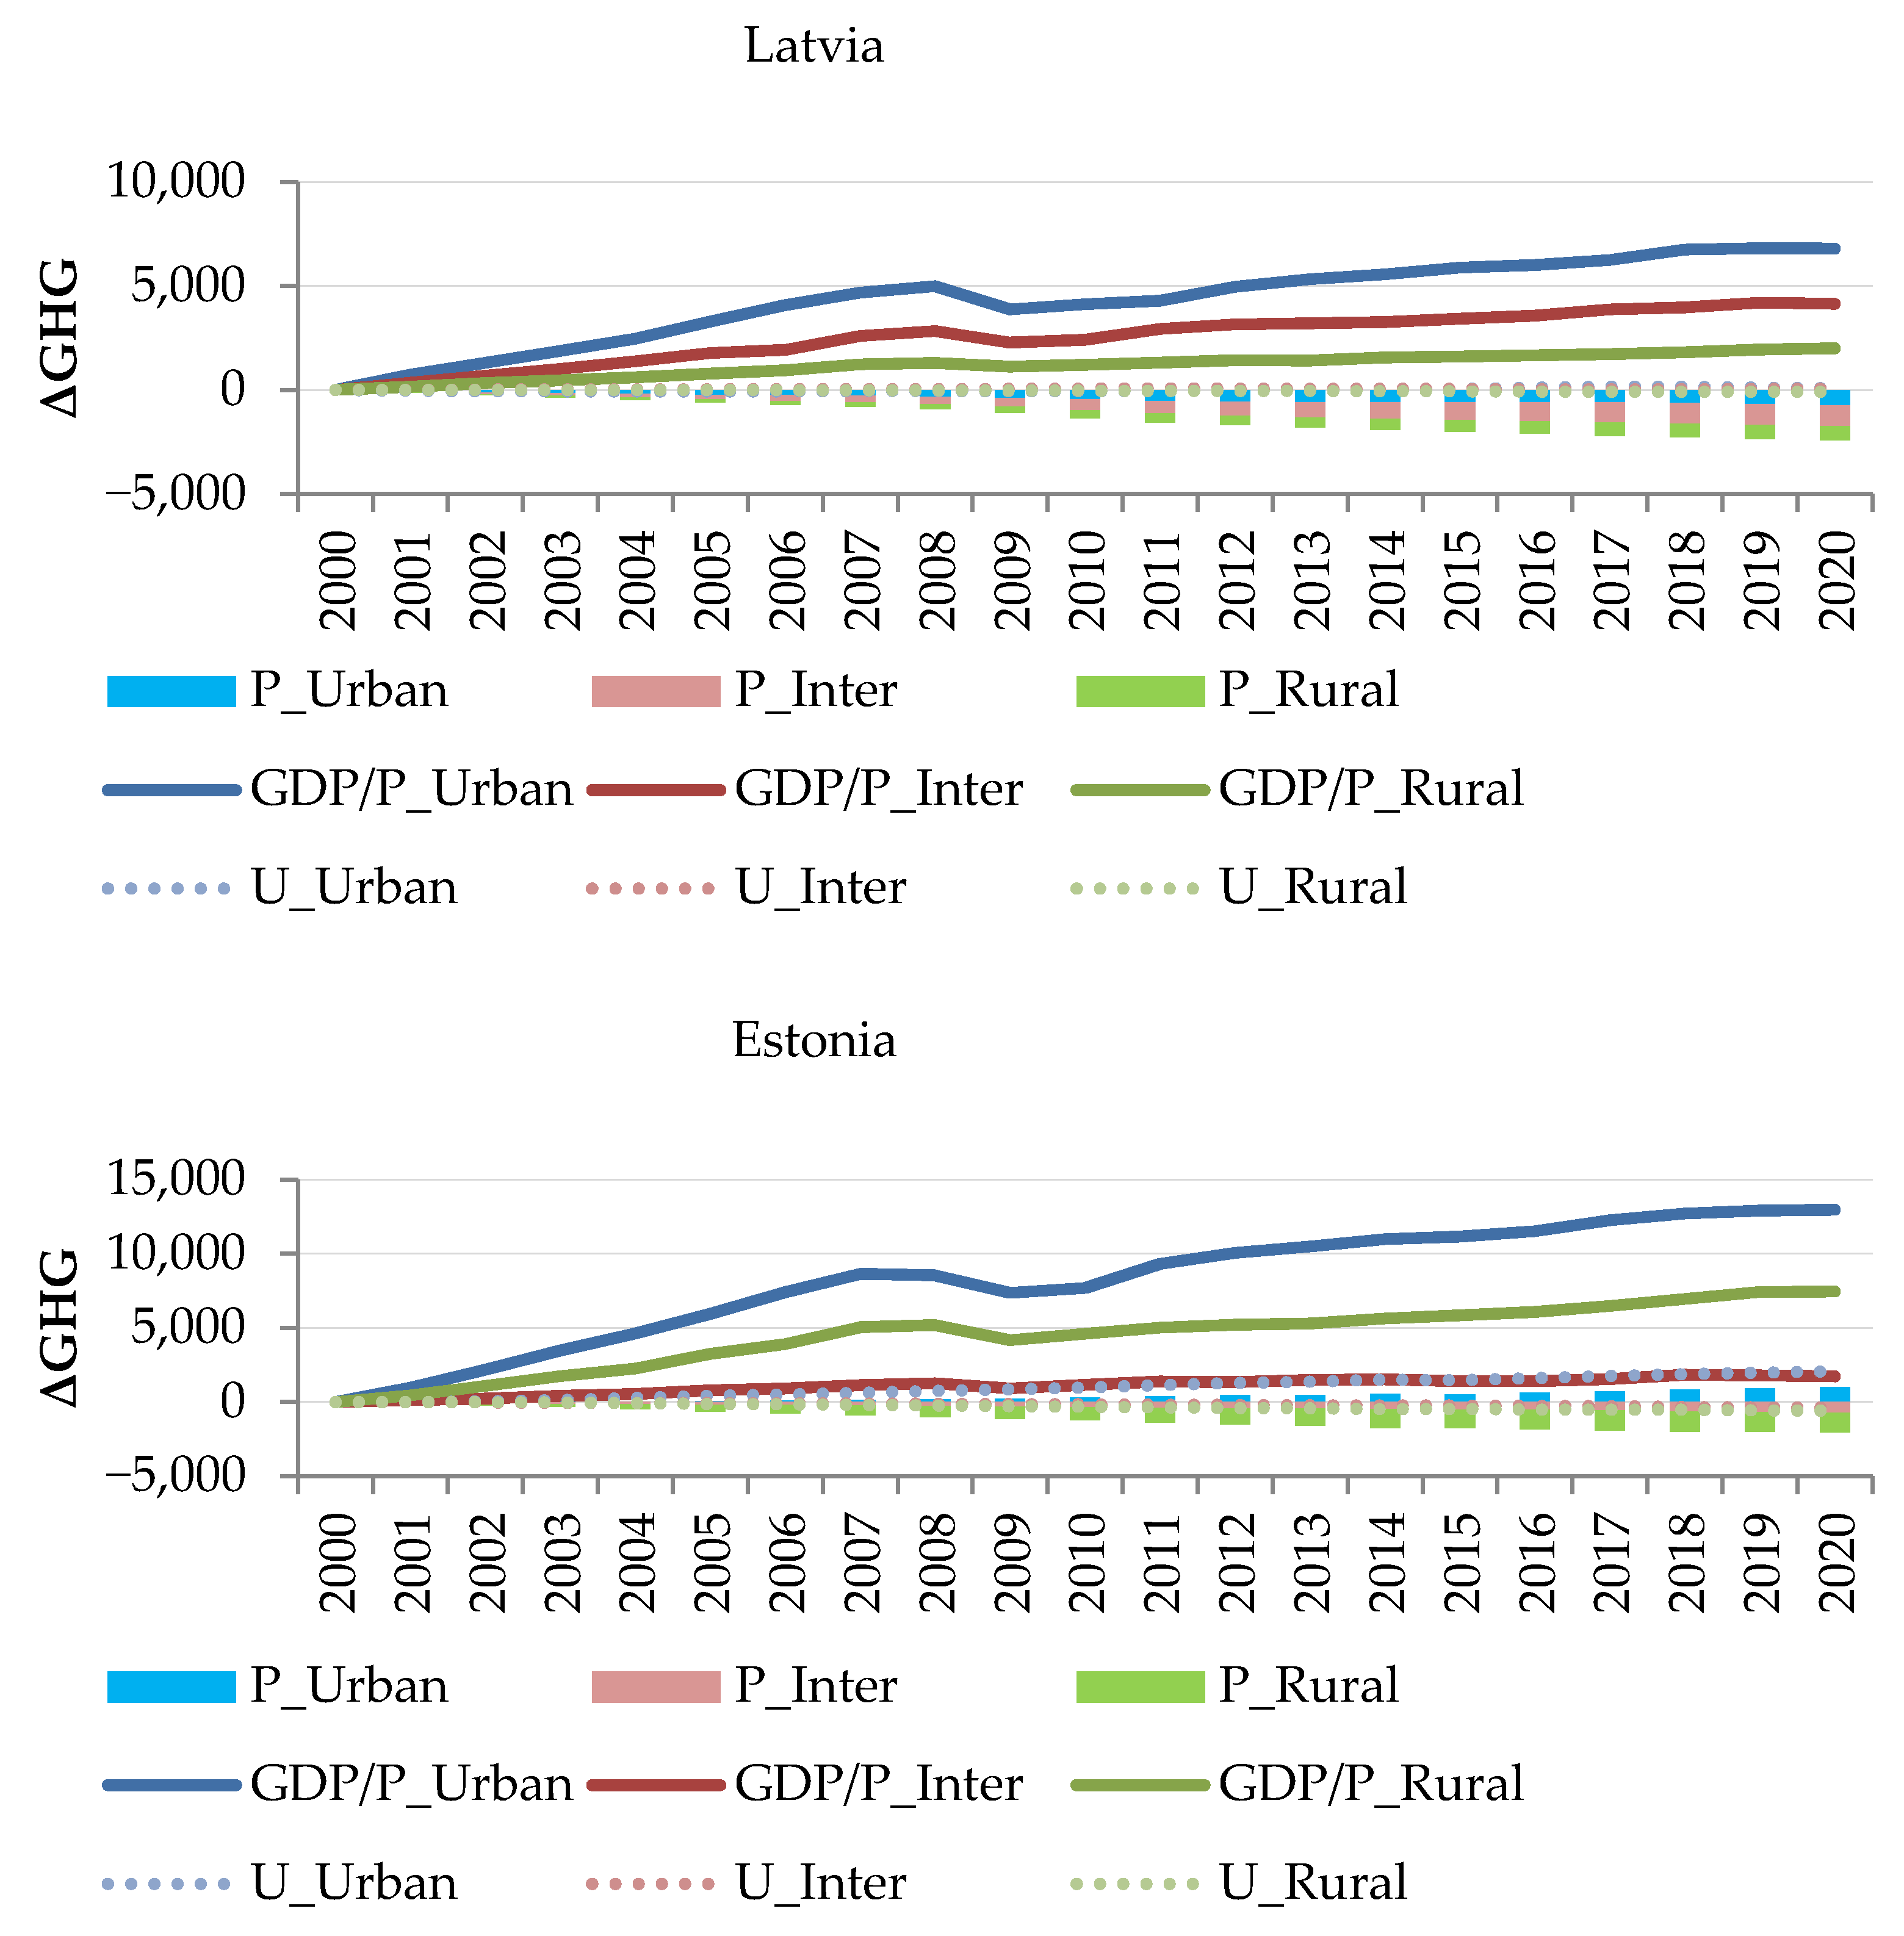
3.3. Estimates from the Extended Urban Kaya Identity
3.4. Estimates from the U-Kuznet’s Curve Model
4. Discussion
4.1. Comparison with Previous Studies
4.2. Limitations and Proposals for Future Research
4.3. Practical Implications
5. Conclusions
Author Contributions
Funding
Institutional Review Board Statement
Data Availability Statement
Conflicts of Interest
Appendix A


Appendix B


References
- Makutėnienė, D.; Staugaitis, A.J.; Makutėnas, V.; Juočiūnienė, D.; Bilan, Y. An Empirical Investigation into Greenhouse Gas Emissions and Agricultural Economic Performance in Baltic Countries: A Non-Linear Framework. Agriculture 2022, 12, 1336. [Google Scholar] [CrossRef]
- Eurostat; European Commission. Population by Broad Age Group (cens_21ag). Eurostat. Available online: https://ec.europa.eu/eurostat/databrowser/view/CENS_21AG/default/table?lang=en (accessed on 20 June 2023).
- The World Bank. Population, Total. Available online: https://data.worldbank.org/indicator/SP.POP.TOTL?locations=IE&name_desc=true (accessed on 20 June 2023).
- Eurostat; European Commission. GDP and Main Components (Output, Expenditure and Income) (Online Data Code: NAMA_10_GDP). Eurostat. Available online: https://ec.europa.eu/eurostat/databrowser/view/NAMA_10_GDP__custom_6960697/default/table?lang=en (accessed on 20 June 2023).
- Eurostat; European Commission. Main GDP Aggregates Per Capita (Online Data Code: NAMA_10_PC). Eurostat. Available online: https://ec.europa.eu/eurostat/databrowser/view/NAMA_10_PC/default/table?lang=en (accessed on 20 June 2023).
- Eurostat; European Commission. Average Annual Population to Calculate Regional GDP Data (Thousand Persons) by NUTS 3 Regions (Online Data Code: NAMA_10R_3POPGDP). Eurostat. Available online: https://ec.europa.eu/eurostat/databrowser/view/nama_10r_3popgdp/default/table?lang=en (accessed on 20 June 2023).
- Eurostat; European Commission. Greenhouse Gas Emissions by Source Sector (Source: EEA) (Online Data Code: ENV_AIR_GGE). Eurostat. Available online: https://ec.europa.eu/eurostat/databrowser/view/env_air_gge/default/table?lang=en (accessed on 20 June 2023).
- Cumming, G.S.; Buerkert, A.; Hoffmann, E.M.; Schlecht, E.; von Cramon-Taubadel, S.; Tscharntke, T. Implications of agricultural transitions and urbanisation for ecosystem services. Nature 2014, 515, 50–57. [Google Scholar] [CrossRef]
- Ali, H.S.; Abdul-Rahim, A.S.; Ribadu, M.B. Urbanisation and carbon dioxide emissions in Singapore: Evidence from the ARDL approach. Environ. Sci. Pollut. Res. 2017, 24, 1967–1974. [Google Scholar] [CrossRef]
- Avtar, R.; Tripathi, S.; Aggarwal, A.K.; Kumar, P. Population–urbanisation–energy nexus: A review. Resources 2019, 8, 136. [Google Scholar] [CrossRef]
- Camarero, L.; Oliva, J. Thinking in rural gap: Mobility and social inequalities. Palgrave Commun. 2019, 5, 95. [Google Scholar] [CrossRef]
- Young, A. Inequality, the urban-rural gap, and migration. Q. J. Econ. 2013, 128, 1727–1785. [Google Scholar] [CrossRef]
- Ranscombe, P. Rural areas at risk during COVID-19 pandemic. Lancet Infect. Dis. 2020, 20, 545. [Google Scholar] [CrossRef]
- Surya, B.; Ahmad, D.N.A.; Sakti, H.H.; Sahban, H. Land use change, spatial interaction, and sustainable development in the metropolitan urban areas, South Sulawesi Province, Indonesia. Land 2020, 9, 95. [Google Scholar] [CrossRef]
- Rana, I.A.; Routray, J.K.; Younas, Z.I. Spatiotemporal dynamics of development inequalities in Lahore City Region, Pakistan. Cities 2020, 96, 102418. [Google Scholar] [CrossRef]
- Penco, L.; Ivaldi, E.; Bruzzi, C.; Musso, E. Knowledge-based urban environments and entrepreneurship: Inside EU cities. Cities 2020, 96, 102443. [Google Scholar] [CrossRef]
- World Cities Report 2022: Envisaging the Future of Cities. United Nations Human Settlements Programme. 2022. Available online: https://unhabitat.org/sites/default/files/2022/06/wcr_2022.pdf (accessed on 25 June 2023).
- Yu, X.; Wu, Z.; Zheng, H.; Li, M.; Tan, T. How urban agglomeration improve the emission efficiency? A spatial econometric analysis of the Yangtze River Delta urban agglomeration in China. J. Environ. Manag. 2020, 260, 110061. [Google Scholar] [CrossRef]
- Tavakoli, A. How precisely “kaya identity” can estimate GHG emissions: A global review. Jordan J. Earth Environ. Sci. 2017, 8, 91–96. [Google Scholar]
- Ortega-Ruiz, G.; Mena-Nieto, A.; García-Ramos, J.E. Is India on the right pathway to reduce CO2 emissions? Decomposing an enlarged Kaya identity using the LMDI method for the period 1990–2016. Sci. Total Environ. 2020, 737, 139638. [Google Scholar] [CrossRef] [PubMed]
- Yang, P.; Liang, X.; Drohan, P.J. Using Kaya and LMDI models to analyze carbon emissions from the energy consumption in China. Environ. Sci. Pollut. Res. 2020, 27, 26495–26501. [Google Scholar] [CrossRef]
- Tavakoli, A. A journey among top ten emitter country, decomposition of “Kaya Identity”. Sustain. Cities Soc. 2018, 38, 254–264. [Google Scholar] [CrossRef]
- Su, W.; Wang, Y.; Streimikiene, D.; Balezentis, T.; Zhang, C. Carbon dioxide emission decomposition along the gradient of economic development: The case of energy sustainability in the G7 and Brazil, Russia, India, China and South Africa. Sustain. Dev. 2020, 28, 657–669. [Google Scholar] [CrossRef]
- Khusna, V.A.; Kusumawardani, D. Decomposition of Carbon Dioxide (CO2) Emissions in ASEAN Based on Kaya Identity. Indones. J. Energy 2021, 4, 101–114. [Google Scholar] [CrossRef]
- Lin, S.J.; Beidari, M.; Lewis, C. Energy consumption trends and decoupling effects between carbon dioxide and gross domestic product in South Africa. Aerosol Air Qual. Res. 2015, 15, 2676–2687. [Google Scholar] [CrossRef]
- Ziemele, J.; Gravelsins, A.; Blumberga, D. Decomposition analysis of district heating system based on complemented Kaya identity. Energy Procedia 2015, 75, 1229–1234. [Google Scholar] [CrossRef]
- Wu, C.; Liao, M.; Liu, C. Acquiring and geo-visualizing aviation carbon footprint among urban agglomerations in China. Sustainability 2019, 11, 4515. [Google Scholar] [CrossRef]
- Miškinis, V.; Galinis, A.; Konstantinavičiūtė, I.; Lekavičius, V.; Neniškis, E. The role of renewable energy sources in dynamics of energy-related GHG emissions in the Baltic states. Sustainability 2021, 13, 10215. [Google Scholar] [CrossRef]
- Zhang, X.; Zhao, Y.; Xu, X.; Wang, C. Urbanisation Effect on Energy-Related Carbon Emissions in Jiangsu Province from the Perspective of Resident Consumption. Pol. J. Environ. Stud. 2017, 26, 1875–1884. [Google Scholar] [CrossRef] [PubMed]
- Wang, S.; Liu, X.; Zhou, C.; Hu, J.; Ou, J. Examining the impacts of socioeconomic factors, urban form, and transportation networks on CO2 emissions in China’s megacities. Appl. Energy 2017, 185, 189–200. [Google Scholar] [CrossRef]
- Yuan, R.; Rodrigues, J.F.; Wang, J.; Tukker, A.; Behrens, P. A global overview of developments of urban and rural household GHG footprints from 2005 to 2015. Sci. Total Environ. 2022, 806, 150695. [Google Scholar] [CrossRef]
- Wu, Y.; Shen, J.; Zhang, X.; Skitmore, M.; Lu, W. The impact of urbanisation on carbon emissions in developing countries: A Chinese study based on the U-Kaya method. J. Clean. Prod. 2016, 135, 589–603. [Google Scholar] [CrossRef]
- Xue, Y.; Ren, J.; Bi, X. Impact of influencing factors on CO2 emissions in the Yangtze river delta during urbanisation. Sustainability 2019, 11, 4183. [Google Scholar] [CrossRef]
- Zhang, C.; Lin, Y. Panel estimation for urbanisation, energy consumption and CO2 emissions: A regional analysis in China. Energy Policy 2012, 49, 488–498. [Google Scholar] [CrossRef]
- Shahbaz, M.; Sbia, R.; Hamdi, H.; Ozturk, I. Economic growth, electricity consumption, urbanisation and environmental degradation relationship in United Arab Emirates. Ecol. Indic. 2014, 45, 622–631. [Google Scholar] [CrossRef]
- Ponce de Leon Barido, D.; Marshall, J.D. Relationship between urbanisation and CO2 emissions depends on income level and policy. Environ. Sci. Technol. 2014, 48, 3632–3639. [Google Scholar] [CrossRef]
- Dogan, E.; Turkekul, B. CO2 emissions, real output, energy consumption, trade, urbanisation and financial development: Testing the EKC hypothesis for the USA. Environ. Sci. Pollut. Res. 2016, 23, 1203–1213. [Google Scholar] [CrossRef]
- Hossain, S. An econometric analysis for CO2 emissions, energy consumption, economic growth, foreign trade and urbanisation of Japan. Low Carbon Econ. 2012, 3, 92–105. [Google Scholar] [CrossRef]
- Ali, H.S.; Law, S.H.; Zannah, T.I. Dynamic impact of urbanisation, economic growth, energy consumption, and trade openness on CO2 emissions in Nigeria. Environ. Sci. Pollut. Res. 2016, 23, 12435–12443. [Google Scholar] [CrossRef]
- Rahman, S.M.; Ogura, Y.; Uddin, M.N.; Haque, R.; Rahman, S.M. Economy, Commerce, and Energy: How Do the Factors Influence Carbon Dioxide Emissions in Japan? An Application of ARDL Model. Stat. Polit. Policy 2022, 13, 219–233. [Google Scholar] [CrossRef]
- Martínez-Zarzoso, I.; Maruotti, A. The impact of urbanisation on CO2 emissions: Evidence from developing countries. Ecol. Econ. 2011, 70, 1344–1353. [Google Scholar] [CrossRef]
- Lazăr, D.; Minea, A.; Purcel, A.A. Pollution and economic growth: Evidence from Central and Eastern European countries. Energy Econ. 2019, 81, 1121–1131. [Google Scholar] [CrossRef]
- Territorial Typologies Manual—Urban-Rural Typology. Eurostat Statistics Explained. Available online: https://ec.europa.eu/eurostat/statistics-explained/index.php?title=Territorial_typologies_manual_-_urban-rural_typology#Classes_for_the_typology_and_their_conditions (accessed on 22 June 2023).
- Kaya, Y. Impact of Carbon Dioxide Emission Control on GNP Growth: Interpretation of Proposed Scenarios; Intergovernmental Panel on Climate Change/Response Strategies Working Group: Geneva, Switzerland, 1989. [Google Scholar]
- Ang, B.W. LMDI decomposition approach: A guide for implementation. Energy Policy 2015, 86, 233–238. [Google Scholar] [CrossRef]
- Cheng, L.; Mi, Z.; Sudmant, A.; Coffman, D.M. Bigger cities better climate? Results from an analysis of urban areas in China. Energy Econ. 2022, 107, 105872. [Google Scholar] [CrossRef]
- Csalódi, R.; Czvetkó, T.; Sebestyén, V.; Abonyi, J. Sectoral Analysis of Energy Transition Paths and Greenhouse Gas Emissions. Energies 2022, 15, 7920. [Google Scholar] [CrossRef]
- Eurostat; European Commission. Simplified Energy Balances (Online Data Code: NRG_BAL_S). Eurostat. Available online: https://ec.europa.eu/eurostat/databrowser/view/nrg_bal_s/default/table?lang=en (accessed on 28 June 2023).
- Lin, Y.; Ma, L.; Li, Z.; Ni, W. The carbon reduction potential by improving technical efficiency from energy sources to final services in China: An extended Kaya identity analysis. Energy 2023, 263, 125963. [Google Scholar] [CrossRef]
- Engo, J. Decomposition of Cameroon’s CO2 emissions from 2007 to 2014: An extended Kaya identity. Environ. Sci. Pollut. Res. 2019, 26, 16695–16707. [Google Scholar] [CrossRef]
- Pui, K.L.; Othman, J. The influence of economic, technical, and social aspects on energy-associated CO2 emissions in Malaysia: An extended Kaya identity approach. Energy 2019, 181, 468–493. [Google Scholar] [CrossRef]
- Sudarmaji, E.; Achsani, N.A.; Arkeman, Y.; Fahmi, I. Decomposition factors household energy subsidy consumption in Indonesia: Kaya identity and logarithmic mean divisia index approach. Int. J. Energy Econ. Policy 2022, 12, 355–364. [Google Scholar] [CrossRef]
- Li, W.; Ou, Q.; Chen, Y. Decomposition of China’s CO2 emissions from agriculture utilizing an improved Kaya identity. Environ. Sci. Pollut. Res. 2014, 21, 13000–13006. [Google Scholar] [CrossRef] [PubMed]
- Karstensen, J.; Peters, G.P.; Andrew, R.M. Trends of the EU’s territorial and consumption-based emissions from 1990 to 2016. Clim. Chang. 2018, 151, 131–142. [Google Scholar] [CrossRef]
- Miskinis, V.; Galinis, A.; Bobinaite, V.; Konstantinaviciute, I.; Neniskis, E. Impact of Key Drivers on Energy Intensity and GHG Emissions in Manufacturing in the Baltic States. Sustainability 2023, 15, 3330. [Google Scholar] [CrossRef]
- Luo, G.; Baležentis, T.; Zeng, S. Per capita CO2 emission inequality of China’s urban and rural residential energy consumption: A Kaya-Theil decomposition. J. Environ. Manag. 2023, 331, 117265. [Google Scholar] [CrossRef]
- Kar, A.K. Environmental Kuznets curve for CO2 emissions in Baltic countries: An empirical investigation. Environ. Sci. Pollut. Res. 2022, 29, 47189–47208. [Google Scholar] [CrossRef]
- Rahman, H.U.; Ghazali, A.; Bhatti, G.A.; Khan, S.U. Role of economic growth, financial development, trade, energy and FDI in environmental Kuznets curve for Lithuania: Evidence from ARDL bounds testing approach. Eng. Econ. 2020, 31, 39–49. [Google Scholar] [CrossRef]
- Simionescu, M.; Wojciechowski, A.; Tomczyk, A.; Rabe, M. Revised environmental Kuznets curve for V4 countries and Baltic states. Energies 2021, 14, 3302. [Google Scholar] [CrossRef]
- Liobikienė, G.; Butkus, M.; Bernatonienė, J. Drivers of greenhouse gas emissions in the Baltic states: Decomposition analysis related to the implementation of Europe 2020 strategy. Renew. Sustain. Energy Rev. 2016, 54, 309–317. [Google Scholar] [CrossRef]
- Syed, Q.R.; Bouri, E. Impact of economic policy uncertainty on CO2 emissions in the US: Evidence from bootstrap ARDL approach. J. Public Aff. 2022, 22, e2595. [Google Scholar] [CrossRef]
- Hasson, A.; Masih, M. Energy Consumption, Trade Openness, Economic Growth, Carbon Dioxide Emissions and Electricity Consumption: Evidence from South Africa Based on ARDL. Available online: https://mpra.ub.uni-muenchen.de/79424/1/MPRA_paper_79424.pdf (accessed on 3 May 2023).
- Raggad, B. Carbon dioxide emissions, economic growth, energy use, and urbanisation in Saudi Arabia: Evidence from the ARDL approach and impulse saturation break tests. Environ. Sci. Pollut. Res. 2018, 25, 14882–14898. [Google Scholar] [CrossRef]
- Eskander, S.M.; Nitschke, J. Energy use and CO2 emissions in the UK universities: An extended Kaya identity analysis. J. Clean. Prod. 2021, 309, 127199. [Google Scholar] [CrossRef]
- Ma, M.; Cai, W.; Cai, W. Carbon abatement in China’s commercial building sector: A bottom-up measurement model based on Kaya-LMDI methods. Energy 2018, 165, 350–368. [Google Scholar] [CrossRef]
- Ma, M.; Cai, W. What drives the carbon mitigation in Chinese commercial building sector? Evidence from decomposing an extended Kaya identity. Sci. Total Environ. 2018, 634, 884–899. [Google Scholar] [CrossRef]
- Huo, T.; Ma, Y.; Cai, W.; Liu, B.; Mu, L. Will the urbanisation process influence the peak of carbon emissions in the building sector? A dynamic scenario simulation. Energy Build. 2021, 232, 110590. [Google Scholar] [CrossRef]
- Mavromatidis, G.; Orehounig, K.; Richner, P.; Carmeliet, J. A strategy for reducing CO2 emissions from buildings with the Kaya identity—A Swiss energy system analysis and a case study. Energy Policy 2016, 88, 343–354. [Google Scholar] [CrossRef]
- Zhang, H.; Chen, B.; Deng, H.; Du, H.; Yang, R.; Ju, L.; Liu, S. Analysis on the evolution law and influencing factors of Beijing’s power generation carbon emissions. Energy Rep. 2022, 8, 1689–1697. [Google Scholar] [CrossRef]
- Chovancová, J.; Popovičová, M.; Huttmanová, E. Decoupling transport-related greenhouse gas emissions and economic growth in the European Union countries. J. Sustain. Dev. Energy Water Environ. Syst. 2023, 11, 1–18. [Google Scholar] [CrossRef]
- Gudipudi, R.; Rybski, D.; Lüdeke, M.K.; Zhou, B.; Liu, Z.; Kropp, J.P. The efficient, the intensive, and the productive: Insights from urban Kaya scaling. Appl. Energy 2019, 236, 155–162. [Google Scholar] [CrossRef]
- Okorie, D.I. An input-output augmented Kaya identity and application: Quantile regression approach. Soc. Sci. Humanit. Open 2021, 4, 100214. [Google Scholar] [CrossRef]
- Hwang, Y.; Um, J.S.; Hwang, J.; Schlüter, S. Evaluating the causal relations between the Kaya Identity Index and ODIAC-based fossil fuel CO2 flux. Energies 2020, 13, 6009. [Google Scholar] [CrossRef]
- Lin, B.; Agyeman, S.D. Assessing Ghana’s carbon dioxide emissions through energy consumption structure towards a sustainable development path. J. Clean. Prod. 2019, 238, 117941. [Google Scholar] [CrossRef]
- Asumadu-Sarkodie, S.; Owusu, P.A. Multivariate co-integration analysis of the Kaya factors in Ghana. Environ. Sci. Pollut. Res. 2016, 23, 9934–9943. [Google Scholar] [CrossRef]
- Wu, Y.; Luo, J.; Shen, L.; Skitmore, M. The effects of an energy use paradigm shift on carbon emissions: A simulation study. Sustainability 2018, 10, 1639. [Google Scholar] [CrossRef]
- Siksnelyte, I.; Zavadskas, E.K.; Bausys, R.; Streimikiene, D. Implementation of EU energy policy priorities in the Baltic Sea Region countries: Sustainability assessment based on neutrosophic MULTIMOORA method. Energy Policy 2019, 125, 90–102. [Google Scholar] [CrossRef]
- Bigerna, S.; Polinori, P. Convergence of KAYA components in the European Union toward the 2050 decarbonization target. J. Clean. Prod. 2022, 366, 132950. [Google Scholar] [CrossRef]
- Robalino-López, A.; García-Ramos, J.E.; Golpe, A.A.; Mena-Nieto, A. CO2 emissions convergence among 10 South American countries. A study of Kaya components (1980–2010). Carbon Manag. 2016, 7, 1–12. [Google Scholar] [CrossRef]
- Sharif, T.; Uddin, M.M.M.; Alexiou, C. Testing the moderating role of trade openness on the environmental Kuznets curve hypothesis: A novel approach. Ann. Oper. Res. 2022, 1–39. [Google Scholar] [CrossRef]
- Miskinis, V.; Galinis, A.; Konstantinaviciute, I.; Lekavicius, V.; Neniskis, E. Comparative analysis of the energy sector development trends and forecast of final energy demand in the Baltic States. Sustainability 2019, 11, 521. [Google Scholar] [CrossRef]
- Su, M.; Pauleit, S.; Yin, X.; Zheng, Y.; Chen, S.; Xu, C. Greenhouse gas emission accounting for EU member states from 1991 to 2012. Appl. Energy 2016, 184, 759–768. [Google Scholar] [CrossRef]
- Liu, H.; Zhang, J.; Yuan, J. Can China achieve its climate pledge: A multi-scenario simulation of China’s energy-related CO2 emission pathways based on Kaya identity. Environ. Sci. Pollut. Res. 2022, 29, 74480–74499. [Google Scholar] [CrossRef] [PubMed]
- Štreimikienė, D.; Balezentis, T. Kaya identity for analysis of the main drivers of GHG emissions and feasibility to implement EU “20–20–20” targets in the Baltic States. Renew. Sustain. Energy Rev. 2016, 58, 1108–1113. [Google Scholar] [CrossRef]
- Streimikiene, D. Analysis of the Main Drivers of GHG Emissions in Visegrad Countries: Kaya Identity Approach. Contemp. Econ. 2022, 16, 387–396. [Google Scholar] [CrossRef]
- Gudipudi, R.; Rybski, D.; Lüdeke, M.K.; Kropp, J.P. Urban emission scaling—Research insights and a way forward. Environ. Plan. B Urban Anal. City Sci. 2019, 46, 1678–1683. [Google Scholar] [CrossRef]
- Huang, Y.; Liao, C.; Zhang, J.; Guo, H.; Zhou, N.; Zhao, D. Exploring potential pathways towards urban greenhouse gas peaks: A case study of Guangzhou, China. Appl. Energy 2019, 251, 113369. [Google Scholar] [CrossRef]
- González-Torres, M.; Pérez-Lombard, L.; Coronel, J.F.; Maestre, I.R. Revisiting Kaya Identity to define an emissions indicators pyramid. J. Clean. Prod. 2021, 317, 128328. [Google Scholar] [CrossRef]
- Dolge, K.; Blumberga, D. Economic growth in contrast to GHG emission reduction measures in Green Deal context. Ecol. Indic. 2021, 130, 108153. [Google Scholar] [CrossRef]
- Kaya, O.; Klepacka, A.M.; Florkowski, W.J. Achieving renewable energy, climate, and air quality policy goals: Rural residential investment in solar panel. J. Environ. Manag. 2019, 248, 109309. [Google Scholar] [CrossRef]


| Indicator | GHG | GHG/E | E/GDP | GDP/P | P |
|---|---|---|---|---|---|
| Lithuania | |||||
| Mean | 20,999.597 | 2.601 | 0.182 | 16.499 | 3113.619 |
| Median | 20,380.940 | 2.600 | 0.150 | 16.077 | 3097.280 |
| Minimum | 19,529.000 | 2.223 | 0.104 | 7.016 | 2794.160 |
| Maximum | 24,775.060 | 2.934 | 0.310 | 26.359 | 3499.490 |
| Std. Dev. | 1385.423 | 0.217 | 0.072 | 6.009 | 245.322 |
| Std. Dev. % | 6.597 | 8.331 | 39.737 | 36.424 | 7.879 |
| Skewness | 1.472 | −0.248 | 0.587 | 0.085 | 0.156 |
| Kurtosis | 1.957 | −0.962 | −1.094 | −1.039 | −1.450 |
| Latvia | |||||
| Mean | 10,999.760 | 2.460 | 0.159 | 14.522 | 2112.379 |
| Median | 10,882.180 | 2.425 | 0.148 | 14.378 | 2097.300 |
| Minimum | 10,192.570 | 2.354 | 0.106 | 6.673 | 1900.870 |
| Maximum | 11,954.290 | 2.638 | 0.245 | 21.703 | 2367.620 |
| Std. Dev. | 425.630 | 0.083 | 0.041 | 4.617 | 153.645 |
| Std. Dev. % | 3.869 | 3.359 | 26.054 | 31.791 | 7.274 |
| Skewness | 0.708 | 0.953 | 0.692 | −0.065 | 0.152 |
| Kurtosis | 0.726 | −0.081 | −0.466 | −0.952 | −1.431 |
| Estonia | |||||
| Mean | 18,898.625 | 3.524 | 0.254 | 17.361 | 1342.338 |
| Median | 19,362.260 | 3.589 | 0.237 | 17.674 | 1333.290 |
| Minimum | 11,407.080 | 2.536 | 0.131 | 7.802 | 1314.870 |
| Maximum | 22,046.440 | 3.861 | 0.431 | 25.847 | 1401.250 |
| Std. Dev. | 2538.389 | 0.304 | 0.082 | 5.541 | 27.088 |
| Std. Dev. % | 13.432 | 8.629 | 32.457 | 31.919 | 2.018 |
| Skewness | −1.333 | −1.936 | 0.674 | −0.172 | 0.877 |
| Kurtosis | 2.707 | 5.094 | −0.033 | −0.900 | −0.276 |
| Years | ∆urban | ∆inter. | ∆rural | Durban | Dinter | Drural | Years | ∆urban | ∆inter | ∆rural | Durban | Dinter | Drural |
|---|---|---|---|---|---|---|---|---|---|---|---|---|---|
| Lithuania | |||||||||||||
| 2000/2001 | 13.7 | −11.3 | 1.7 | 1.0007 | 0.9994 | 1.0001 | 2010/2011 | 91.1 | −48.8 | −4.4 | 1.0044 | 0.9977 | 0.9998 |
| 2001/2002 | 26.5 | −16.2 | −0.2 | 1.0013 | 0.9992 | 1.0000 | 2011/2012 | 82.5 | −42.0 | −5.9 | 1.0039 | 0.9980 | 0.9997 |
| 2002/2003 | 44.9 | −24.8 | −1.6 | 1.0022 | 0.9988 | 0.9999 | 2012/2013 | 82.2 | −39.4 | −7.1 | 1.0040 | 0.9981 | 0.9997 |
| 2003/2004 | 64.4 | −34.6 | −3.0 | 1.0030 | 0.9984 | 0.9999 | 2013/2014 | 74.1 | −33.8 | −7.1 | 1.0037 | 0.9983 | 0.9996 |
| 2004/2005 | 80.6 | −40.8 | −5.2 | 1.0037 | 0.9982 | 0.9998 | 2014/2015 | 72.2 | −31.9 | −7.4 | 1.0036 | 0.9984 | 0.9996 |
| 2005/2006 | 82.9 | −39.4 | −5.9 | 1.0037 | 0.9983 | 0.9997 | 2015/2016 | 92.3 | −40.7 | −9.3 | 1.0046 | 0.9980 | 0.9995 |
| 2006/2007 | 82.3 | −36.8 | −6.1 | 1.0035 | 0.9985 | 0.9997 | 2016/2017 | 115.6 | −49.6 | −13.2 | 1.0057 | 0.9976 | 0.9994 |
| 2007/2008 | 87.5 | −38.9 | −6.9 | 1.0036 | 0.9984 | 0.9997 | 2017/2018 | 107.1 | −42.1 | −14.8 | 1.0053 | 0.9979 | 0.9993 |
| 2008/2009 | 82.7 | −38.9 | −6.1 | 1.0038 | 0.9982 | 0.9997 | 2018/2019 | 101.7 | −36.8 | −15.4 | 1.0051 | 0.9982 | 0.9992 |
| 2009/2010 | 93.1 | −47.7 | −4.9 | 1.0046 | 0.9977 | 0.9998 | 2019/2020 | 99.8 | −35.2 | −15.9 | 1.0049 | 0.9983 | 0.9992 |
| Latvia | |||||||||||||
| 2000/2001 | −31.4 | 10.6 | 2.2 | 0.9970 | 1.0010 | 1.0002 | 2010/2011 | 2.2 | 4.1 | −4.6 | 1.0002 | 1.0004 | 0.9996 |
| 2001/2002 | −26.0 | 9.8 | 0.8 | 0.9976 | 1.0009 | 1.0001 | 2011/2012 | 1.4 | 1.1 | −1.6 | 1.0001 | 1.0001 | 0.9999 |
| 2002/2003 | −11.5 | 6.1 | −1.2 | 0.9989 | 1.0006 | 0.9999 | 2012/2013 | 32.7 | −7.0 | −6.3 | 1.0030 | 0.9994 | 0.9994 |
| 2003/2004 | −5.0 | 3.9 | −1.6 | 0.9995 | 1.0004 | 0.9999 | 2013/2014 | 42.8 | −8.1 | −8.8 | 1.0040 | 0.9992 | 0.9992 |
| 2004/2005 | 1.6 | 3.3 | −3.4 | 1.0001 | 1.0003 | 0.9997 | 2014/2015 | 30.7 | −4.8 | −7.4 | 1.0029 | 0.9996 | 0.9993 |
| 2005/2006 | 14.5 | 1.5 | −6.4 | 1.0013 | 1.0001 | 0.9994 | 2015/2016 | 55.4 | −11.6 | −10.5 | 1.0052 | 0.9989 | 0.9990 |
| 2006/2007 | 9.7 | 4.1 | −7.2 | 1.0008 | 1.0004 | 0.9994 | 2016/2017 | 44.0 | −6.2 | −11.4 | 1.0041 | 0.9994 | 0.9989 |
| 2007/2008 | −2.2 | 7.0 | −5.5 | 0.9998 | 1.0006 | 0.9995 | 2017/2018 | 5.3 | 6.2 | −7.5 | 1.0005 | 1.0006 | 0.9993 |
| 2008/2009 | −5.1 | 8.6 | −5.9 | 0.9995 | 1.0008 | 0.9995 | 2018/2019 | −38.8 | 17.2 | −0.5 | 0.9965 | 1.0015 | 1.0000 |
| 2009/2010 | 0.0 | 9.0 | −8.5 | 1.0000 | 1.0008 | 0.9993 | 2019/2020 | −42.8 | 18.0 | 0.6 | 0.9961 | 1.0017 | 1.0001 |
| Estonia | |||||||||||||
| 2000/2001 | 9.7 | −9.9 | 6.3 | 1.0005 | 0.9994 | 1.0004 | 2010/2011 | 162.6 | −23.8 | −52.3 | 1.0077 | 0.9989 | 0.9975 |
| 2001/2002 | 50.5 | −16.7 | −4.6 | 1.0029 | 0.9990 | 0.9997 | 2011/2012 | 144.7 | −18.8 | −46.1 | 1.0071 | 0.9991 | 0.9978 |
| 2002/2003 | 85.2 | −17.4 | −19.2 | 1.0047 | 0.9990 | 0.9989 | 2012/2013 | 78.8 | −12.5 | −22.1 | 1.0038 | 0.9994 | 0.9989 |
| 2003/2004 | 139.5 | −12.5 | −48.3 | 1.0073 | 0.9994 | 0.9975 | 2013/2014 | 143.4 | −20.6 | −42.8 | 1.0067 | 0.9990 | 0.9980 |
| 2004/2005 | 145.5 | −12.5 | −51.8 | 1.0076 | 0.9994 | 0.9973 | 2014/2015 | −28.3 | −6.7 | 19.8 | 0.9985 | 0.9997 | 1.0010 |
| 2005/2006 | 94.8 | −9.5 | −32.7 | 1.0051 | 0.9995 | 0.9983 | 2015/2016 | 145.2 | −18.7 | −44.9 | 1.0078 | 0.9990 | 0.9976 |
| 2006/2007 | 117.5 | −13.4 | −39.5 | 1.0058 | 0.9993 | 0.9980 | 2016/2017 | 133.8 | −23.2 | −35.2 | 1.0066 | 0.9989 | 0.9983 |
| 2007/2008 | 124.4 | −19.3 | −39.3 | 1.0059 | 0.9991 | 0.9981 | 2017/2018 | 125.3 | −59.3 | 3.1 | 1.0061 | 0.9971 | 1.0002 |
| 2008/2009 | 105.2 | −15.9 | −32.8 | 1.0058 | 0.9991 | 0.9982 | 2018/2019 | 106.4 | −22.4 | −29.8 | 1.0062 | 0.9987 | 0.9983 |
| 2009/2010 | 114.3 | −15.2 | −37.5 | 1.0061 | 0.9992 | 0.9980 | 2019/2020 | 77.6 | −14.2 | −23.6 | 1.0060 | 0.9989 | 0.9982 |
| Years | ∆urban | ∆inter. | ∆rural | Durban | Dinter | Drural | Years | ∆urban | ∆inter | ∆rural | Durban | Dinter | Drural |
|---|---|---|---|---|---|---|---|---|---|---|---|---|---|
| Lithuania | |||||||||||||
| 2000/2001 | 822.2 | 1262.4 | 50.1 | 1.0422 | 1.0655 | 1.0025 | 2010/2011 | 725.4 | 1487.6 | 145.7 | 1.0352 | 1.0736 | 1.0070 |
| 2001/2002 | 994.3 | 869.3 | 72.9 | 1.0497 | 1.0434 | 1.0036 | 2011/2012 | 587.7 | 713.1 | 89.2 | 1.0282 | 1.0343 | 1.0042 |
| 2002/2003 | 1044.1 | 1724.8 | 171.5 | 1.0516 | 1.0867 | 1.0083 | 2012/2013 | 545.3 | 517.5 | 43.4 | 1.0269 | 1.0255 | 1.0021 |
| 2003/2004 | 521.0 | 931.6 | 46.5 | 1.0248 | 1.0449 | 1.0022 | 2013/2014 | 394.0 | 453.5 | 42.6 | 1.0200 | 1.0230 | 1.0021 |
| 2004/2005 | 943.7 | 1354.0 | 91.3 | 1.0437 | 1.0633 | 1.0041 | 2014/2015 | 215.1 | 264.5 | 7.5 | 1.0108 | 1.0133 | 1.0004 |
| 2005/2006 | 1095.3 | 975.0 | 103.7 | 1.0496 | 1.0440 | 1.0046 | 2015/2016 | 259.3 | 406.0 | 12.9 | 1.0129 | 1.0203 | 1.0006 |
| 2006/2007 | 1457.9 | 1713.3 | 125.1 | 1.0633 | 1.0747 | 1.0053 | 2016/2017 | 510.1 | 894.3 | 97.8 | 1.0254 | 1.0450 | 1.0048 |
| 2007/2008 | 342.6 | 1032.6 | 147.5 | 1.0142 | 1.0434 | 1.0061 | 2017/2018 | 622.1 | 526.9 | 49.7 | 1.0313 | 1.0264 | 1.0025 |
| 2008/2009 | −1450.4 | −1922.2 | −188.0 | 0.9356 | 0.9156 | 0.9914 | 2018/2019 | 612.1 | 617.8 | 59.3 | 1.0308 | 1.0311 | 1.0029 |
| 2009/2010 | 722.0 | 1222.6 | 168.3 | 1.0362 | 1.0620 | 1.0083 | 2019/2020 | −91.3 | −31.8 | 18.1 | 0.9955 | 0.9984 | 1.0009 |
| Latvia | |||||||||||||
| 2000/2001 | 722.7 | 345.1 | 144.6 | 1.0714 | 1.0335 | 1.0139 | 2010/2011 | 150.9 | 527.2 | 104.3 | 1.0132 | 1.0470 | 1.0091 |
| 2001/2002 | 574.3 | 335.9 | 173.5 | 1.0548 | 1.0317 | 1.0162 | 2011/2012 | 675.4 | 207.7 | 123.3 | 1.0634 | 1.0191 | 1.0113 |
| 2002/2003 | 573.2 | 324.4 | 133.2 | 1.0543 | 1.0304 | 1.0124 | 2012/2013 | 365.5 | 53.9 | −22.4 | 1.0342 | 1.0050 | 0.9979 |
| 2003/2004 | 584.0 | 369.4 | 140.0 | 1.0550 | 1.0344 | 1.0129 | 2013/2014 | 240.2 | 49.1 | 151.2 | 1.0225 | 1.0046 | 1.0141 |
| 2004/2005 | 821.2 | 388.7 | 176.3 | 1.0778 | 1.0361 | 1.0162 | 2014/2015 | 317.0 | 162.4 | 49.2 | 1.0299 | 1.0152 | 1.0046 |
| 2005/2006 | 800.3 | 157.3 | 170.9 | 1.0736 | 1.0140 | 1.0153 | 2015/2016 | 126.2 | 150.0 | 50.3 | 1.0118 | 1.0140 | 1.0047 |
| 2006/2007 | 590.5 | 675.9 | 282.7 | 1.0516 | 1.0593 | 1.0244 | 2016/2017 | 243.3 | 307.0 | 66.8 | 1.0228 | 1.0289 | 1.0062 |
| 2007/2008 | 319.0 | 230.0 | 69.2 | 1.0276 | 1.0198 | 1.0059 | 2017/2018 | 499.2 | 92.0 | 79.8 | 1.0463 | 1.0084 | 1.0073 |
| 2008/2009 | −1113.6 | −560.9 | −182.6 | 0.9049 | 0.9509 | 0.9838 | 2018/2019 | 54.1 | 240.4 | 140.6 | 1.0048 | 1.0217 | 1.0126 |
| 2009/2010 | 249.9 | 140.5 | 87.0 | 1.0223 | 1.0125 | 1.0077 | 2019/2020 | −13.6 | −67.5 | 50.3 | 0.9987 | 0.9938 | 1.0047 |
| Estonia | |||||||||||||
| 2000/2001 | 967.3 | 117.0 | 444.7 | 1.0563 | 1.0066 | 1.0255 | 2010/2011 | 1617.6 | 229.7 | 419.4 | 1.0797 | 1.0109 | 1.0201 |
| 2001/2002 | 1206.8 | 115.3 | 641.2 | 1.0710 | 1.0066 | 1.0371 | 2011/2012 | 746.4 | −34.6 | 186.3 | 1.0371 | 0.9983 | 1.0091 |
| 2002/2003 | 1298.0 | 185.2 | 659.1 | 1.0737 | 1.0102 | 1.0368 | 2012/2013 | 424.4 | 133.6 | 72.2 | 1.0205 | 1.0064 | 1.0035 |
| 2003/2004 | 1159.9 | 115.3 | 522.2 | 1.0620 | 1.0060 | 1.0274 | 2013/2014 | 504.6 | 56.4 | 350.4 | 1.0238 | 1.0026 | 1.0165 |
| 2004/2005 | 1309.6 | 250.7 | 994.0 | 1.0704 | 1.0131 | 1.0530 | 2014/2015 | 170.3 | −126.8 | 214.3 | 1.0088 | 0.9935 | 1.0111 |
| 2005/2006 | 1464.1 | 124.5 | 639.6 | 1.0809 | 1.0066 | 1.0346 | 2015/2016 | 359.6 | 5.9 | 224.8 | 1.0193 | 1.0003 | 1.0120 |
| 2006/2007 | 1242.6 | 221.8 | 1139.0 | 1.0634 | 1.0110 | 1.0580 | 2016/2017 | 736.2 | 141.1 | 409.4 | 1.0370 | 1.0070 | 1.0204 |
| 2007/2008 | −118.1 | 124.0 | 142.8 | 0.9944 | 1.0059 | 1.0068 | 2017/2018 | 455.1 | 277.6 | 461.7 | 1.0225 | 1.0137 | 1.0228 |
| 2008/2009 | −1157.5 | −335.6 | −1011.0 | 0.9383 | 0.9817 | 0.9459 | 2018/2019 | 191.8 | −32.6 | 488.5 | 1.0113 | 0.9981 | 1.0289 |
| 2009/2010 | 322.8 | 227.2 | 438.5 | 1.0174 | 1.0122 | 1.0237 | 2019/2020 | 57.1 | −74.6 | 12.8 | 1.0044 | 0.9942 | 1.0010 |
| Years | ∆urban | ∆inter. | ∆rural | Durban | Dinter | Drural | Years | ∆urban | ∆inter | ∆rural | Durban | Dinter | Drural |
|---|---|---|---|---|---|---|---|---|---|---|---|---|---|
| Lithuania | |||||||||||||
| 2000/2001 | −30.2 | −121.1 | −12.5 | 0.9985 | 0.9939 | 0.9994 | 2010/2011 | −62.5 | −361.1 | −49.6 | 0.9970 | 0.9829 | 0.9976 |
| 2001/2002 | −21.7 | −126.9 | −15.6 | 0.9989 | 0.9938 | 0.9992 | 2011/2012 | −18.3 | −230.2 | −34.9 | 0.9991 | 0.9892 | 0.9983 |
| 2002/2003 | −10.8 | −139.6 | −18.3 | 0.9995 | 0.9933 | 0.9991 | 2012/2013 | 0.7 | −178.6 | −30.0 | 1.0000 | 0.9913 | 0.9985 |
| 2003/2004 | −14.9 | −196.3 | −27.1 | 0.9993 | 0.9908 | 0.9987 | 2013/2014 | 4.1 | −148.7 | −26.8 | 1.0002 | 0.9926 | 0.9987 |
| 2004/2005 | −34.6 | −282.5 | −42.1 | 0.9984 | 0.9873 | 0.9981 | 2014/2015 | −2.5 | −157.2 | −28.9 | 0.9999 | 0.9922 | 0.9986 |
| 2005/2006 | −35.6 | −282.2 | −43.7 | 0.9984 | 0.9876 | 0.9981 | 2015/2016 | −8.2 | −210.5 | −38.3 | 0.9996 | 0.9896 | 0.9981 |
| 2006/2007 | −18.0 | −227.4 | −36.8 | 0.9992 | 0.9905 | 0.9985 | 2016/2017 | −0.1 | −237.2 | −47.0 | 1.0000 | 0.9884 | 0.9977 |
| 2007/2008 | −6.6 | −208.3 | −35.1 | 0.9997 | 0.9915 | 0.9986 | 2017/2018 | 19.2 | −170.5 | −41.6 | 1.0010 | 0.9916 | 0.9979 |
| 2008/2009 | −7.3 | −202.3 | −32.5 | 0.9997 | 0.9908 | 0.9985 | 2018/2019 | 54.6 | −76.8 | −31.0 | 1.0027 | 0.9962 | 0.9985 |
| 2009/2010 | −48.5 | −331.0 | −46.6 | 0.9976 | 0.9838 | 0.9977 | 2019/2020 | 70.4 | −38.4 | −26.7 | 1.0035 | 0.9981 | 0.9987 |
| Latvia | |||||||||||||
| 2000/2001 | −61.2 | −44.8 | −27.3 | 0.9942 | 0.9957 | 0.9974 | 2010/2011 | −66.2 | −91.4 | −54.9 | 0.9942 | 0.9921 | 0.9952 |
| 2001/2002 | −55.6 | −43.0 | −28.0 | 0.9948 | 0.9960 | 0.9974 | 2011/2012 | −42.0 | −60.2 | −32.8 | 0.9962 | 0.9945 | 0.9970 |
| 2002/2003 | −40.1 | −38.7 | −26.3 | 0.9963 | 0.9964 | 0.9976 | 2012/2013 | −15.9 | −60.8 | −35.0 | 0.9985 | 0.9944 | 0.9968 |
| 2003/2004 | −41.0 | −48.8 | −30.4 | 0.9962 | 0.9955 | 0.9972 | 2013/2014 | −6.5 | −57.1 | −36.2 | 0.9994 | 0.9947 | 0.9966 |
| 2004/2005 | −36.5 | −48.7 | −32.9 | 0.9967 | 0.9956 | 0.9970 | 2014/2015 | −11.3 | −48.6 | −31.8 | 0.9989 | 0.9955 | 0.9970 |
| 2005/2006 | −23.9 | −43.8 | −33.9 | 0.9979 | 0.9961 | 0.9970 | 2015/2016 | 1.1 | −61.3 | −38.2 | 1.0001 | 0.9943 | 0.9965 |
| 2006/2007 | −24.1 | −36.4 | −33.1 | 0.9979 | 0.9969 | 0.9972 | 2016/2017 | −6.2 | −54.2 | −40.0 | 0.9994 | 0.9950 | 0.9963 |
| 2007/2008 | −41.0 | −46.5 | −37.2 | 0.9965 | 0.9960 | 0.9968 | 2017/2018 | −24.8 | −29.7 | −30.6 | 0.9978 | 0.9973 | 0.9972 |
| 2008/2009 | −61.7 | −71.8 | −51.1 | 0.9945 | 0.9936 | 0.9954 | 2018/2019 | −48.7 | −10.3 | −17.4 | 0.9957 | 0.9991 | 0.9984 |
| 2009/2010 | −75.9 | −96.1 | −66.8 | 0.9933 | 0.9916 | 0.9941 | 2019/2020 | −49.1 | −6.5 | −14.3 | 0.9955 | 0.9994 | 0.9987 |
| Estonia | |||||||||||||
| 2000/2001 | −34.9 | −29.6 | −43.4 | 0.9980 | 0.9983 | 0.9975 | 2010/2011 | 88.4 | −42.6 | −103.3 | 1.0042 | 0.9980 | 0.9951 |
| 2001/2002 | −11.5 | −41.8 | −63.4 | 0.9993 | 0.9976 | 0.9964 | 2011/2012 | 69.7 | −37.0 | −101.4 | 1.0034 | 0.9982 | 0.9951 |
| 2002/2003 | 13.5 | −42.2 | −81.4 | 1.0007 | 0.9977 | 0.9956 | 2012/2013 | 19.4 | −28.6 | −70.5 | 1.0009 | 0.9986 | 0.9966 |
| 2003/2004 | 42.4 | −36.2 | −132.1 | 1.0022 | 0.9981 | 0.9932 | 2013/2014 | 67.3 | −39.5 | −98.7 | 1.0031 | 0.9982 | 0.9954 |
| 2004/2005 | 55.1 | −33.3 | −126.3 | 1.0029 | 0.9983 | 0.9935 | 2014/2015 | −25.5 | −12.4 | 23.9 | 0.9987 | 0.9994 | 1.0012 |
| 2005/2006 | 18.1 | −29.4 | −101.8 | 1.0010 | 0.9984 | 0.9946 | 2015/2016 | 106.5 | −30.5 | −60.7 | 1.0057 | 0.9984 | 0.9968 |
| 2006/2007 | 32.1 | −36.5 | −112.4 | 1.0016 | 0.9982 | 0.9945 | 2016/2017 | 90.6 | −40.4 | −55.0 | 1.0045 | 0.9980 | 0.9973 |
| 2007/2008 | 57.4 | −39.0 | −88.6 | 1.0027 | 0.9981 | 0.9958 | 2017/2018 | 112.6 | −87.2 | 28.9 | 1.0055 | 0.9957 | 1.0014 |
| 2008/2009 | 57.3 | −30.0 | −64.0 | 1.0032 | 0.9983 | 0.9965 | 2018/2019 | 110.2 | −26.3 | −10.2 | 1.0064 | 0.9985 | 0.9994 |
| 2009/2010 | 64.4 | −28.6 | −70.1 | 1.0034 | 0.9985 | 0.9963 | 2019/2020 | 75.0 | −19.3 | −15.3 | 1.0058 | 0.9985 | 0.9988 |
| GHG/P = GDP/P + (GDP/P)2 + D | GHG/P = GDP/P + (GDP/P)2+ UI + UI 2 + D | ||||
|---|---|---|---|---|---|
| Variable | Coefficient | p-Value | Variable | Coefficient | p-Value |
| Lithuania | |||||
| constant | 0.0734 | 0.8561 | constant | −1.3884 | 0.0023 |
| GDP/P | 1.2353 | 0.0009 | Uu2 | 0.1304 | <0.0001 |
| (GDP/P)2 | −0.2015 | 0.0028 | (GDP/P)2 | 1.3044 | <0.0001 |
| D_2009 | −0.0890 | 0.0408 | |||
| R-squared: 0.8248; n-test: 0.1113; BP-test: 0.1001. | R-squared: 0.9180; n-test: 0.3380; BP-test: 0.5392. | ||||
| Latvia | |||||
| constant | 0.5882 | 0.0793 | constant | 1.0772 | <0.0001 |
| GDP/P | 0.6146 | 0.0261 | GDP/P | 0.2192 | <0.0001 |
| (GDP/P)2 | −0.0783 | 0.1355 | |||
| R-squared: 0.9020; n-test: 0.0134; BP-test: 0.4889. | R-squared: 0.8887; n-test: 0.0108; BP-test: 0.9015. | ||||
| Estonia | |||||
| constant | −1.0234 | 0.4239 | constant | −20.9162 | 0.0024 |
| GDP/P | 2.6909 | 0.0121 | Uu | −54.3259 | 0.0008 |
| (GDP/P)2 | −0.4827 | 0.0156 | Uu2 | −31.1599 | 0.0007 |
| D_2009 | −0.2112 | 0.0382 | D_2009 | −0.2437 | 0.0092 |
| D_2020 | −0.4726 | 0.0003 | D_2020 | −0.3691 | 0.0017 |
| R-squared: 0.7444; n-test: 0.0691; BP-test: 0.0102. | R-squared: 0.8046; n-test: 0.2899; BP-test: 0.0065. | ||||
| Panel | |||||
| constant | −5.0909 | 0.1850 | constant | 4.1462 | 0.0659 |
| GDP/P | 5.0206 | 0.0865 | GDP/P | 4.9071 | 0.0023 |
| (GDP/P)2 | −0.7998 | 0.1261 | (GDP/P)2 | −0.8733 | 0.0024 |
| S_2004 | −0.5827 | 0.0493 | Uu | 14.3959 | <0.0001 |
| Uu2 | 5.8288 | <0.0001 | |||
| S_2004 | −0.3209 | 0.0439 | |||
| R-squared: 0.1437; n-test: <0.0001; CD test: <0.0001. | R-squared: 0.7669; n-test: 0.1843; CD test 0.7020. | ||||
Disclaimer/Publisher’s Note: The statements, opinions and data contained in all publications are solely those of the individual author(s) and contributor(s) and not of MDPI and/or the editor(s). MDPI and/or the editor(s) disclaim responsibility for any injury to people or property resulting from any ideas, methods, instructions or products referred to in the content. |
© 2023 by the authors. Licensee MDPI, Basel, Switzerland. This article is an open access article distributed under the terms and conditions of the Creative Commons Attribution (CC BY) license (https://creativecommons.org/licenses/by/4.0/).
Share and Cite
Makutėnienė, D.; Staugaitis, A.J.; Makutėnas, V.; Grīnberga-Zālīte, G. The Impact of Economic Growth and Urbanisation on Environmental Degradation in the Baltic States: An Extended Kaya Identity. Agriculture 2023, 13, 1844. https://doi.org/10.3390/agriculture13091844
Makutėnienė D, Staugaitis AJ, Makutėnas V, Grīnberga-Zālīte G. The Impact of Economic Growth and Urbanisation on Environmental Degradation in the Baltic States: An Extended Kaya Identity. Agriculture. 2023; 13(9):1844. https://doi.org/10.3390/agriculture13091844
Chicago/Turabian StyleMakutėnienė, Daiva, Algirdas Justinas Staugaitis, Valdemaras Makutėnas, and Gunta Grīnberga-Zālīte. 2023. "The Impact of Economic Growth and Urbanisation on Environmental Degradation in the Baltic States: An Extended Kaya Identity" Agriculture 13, no. 9: 1844. https://doi.org/10.3390/agriculture13091844
APA StyleMakutėnienė, D., Staugaitis, A. J., Makutėnas, V., & Grīnberga-Zālīte, G. (2023). The Impact of Economic Growth and Urbanisation on Environmental Degradation in the Baltic States: An Extended Kaya Identity. Agriculture, 13(9), 1844. https://doi.org/10.3390/agriculture13091844