2. Historical Evolution of Olive Cultivation in Andalusia
Andalusia, as a region, has one the oldest olive-growing traditions anywhere in the world. Today, it is home to almost 1.5 Mha of olive groves, representing over 15% of the total global olive land. This is not new, between the 1st and 3rd Centuries AD, the region of Baetica (today’s Andalusia) provided most of Rome’s supply of olive oil [
2]. Despite this long tradition, the major expansion of olive-growing in Southern Spain began in earnest in the 19th century, ushering in a wave of growth that still continues to this day. Since the mid-19th century, it has been documented that land with olive groves has increased from 0.411 Mha to the present-day figure of 1.496 Mha (
Table 1). A major factor in this expansion of olive cultivation in Spain during the19th century is the fall of the so called
Ancien Régime and the consequent implementation of liberal policies. These policies deregulated the market factors and the control by landlords who, up until then, had exercised their feudal privileges and had limited the expansion of olive-growing [
3,
4,
5]. In addition to these institutional aspects, from the second half of the 19th century onwards, industrialization played a key role in the transformation of the olive sector. The main innovations revolved around the development of new forms of transportation, which along with the wave of globalization of global economy resulted in a favorable institutional framework for Andalusian growers, who benefitted from the growing global demand for olive oil. Between 1896 and 1930, the total land area dedicated to olive-growing in Andalusia increased by 50% (from 0.668 Mha to 0.983 Mha), production increased 2.5 fold (from 87 kt to 219 kt) and exports throughout the country expanded by 380% (from 29 kt to 86 kt), see
Table 1. This period, during which Spain became the world’s leader in olive oil production, surpassing Italy, is known as the “Golden Age” of the olive grove.
This period ended with the Civil War (1936/1939), which was followed by Franco’s dictatorship. Both episodes ushered in a period of depression in the sector, characterized by a lack of agricultural development, the growth of the black market in all the sectors of the economy, and a widespread decline in exports [
6,
7]. The lack of any incentives to expand olive production led to the stagnation of the sector, a process that became even more marked in the 1960s. By this date, liberal economic policies were reinstated, but Spanish olive production found itself in a very precarious condition to compete in the global olive oil markets [
8].
This downturn was followed by a new period of growth from 1970 onwards (a second “Golden Age”), when growing global demand opened up new opportunities for Spanish olive-growers. Admission to the European Union brought among other things with it, the oil production subsidy program set up as part of the Common Agricultural Policy. This factor, along with a rise in international demand, the formation of lobbies promoting olive oil and the publication of new studies linking its consumption to health benefits, led to a new period of expansion [
9,
10,
11,
12]. This was also a period when the intensification of agriculture permitted unprecedented growth in productivity. Spain went from producing 333 kt and exporting 96 kt in 1966/1970 to producing 1222 kt and exporting 643 kt in 2006/2010. Although the total land area occupied increased from 1.71 to 2.36 Mha in this period, growth in production and exports was significantly higher [
4,
5,
11,
13].
Table 1.
Land area occupied by olive groves and oil production in Andalusia, Spain, and the World. Source: [
13].
Table 1.
Land area occupied by olive groves and oil production in Andalusia, Spain, and the World. Source: [13].
| | Total Land Area (Mha) | Olive Oil Production (kt) | Percentage of Total World Production |
|---|
| Andalusia | Spain | World | Andalusia | Spain | World | Andalusia | Spain |
|---|
| 1851/1860 | 0.411 | 0.857 | - | - | - | - | - | - |
| 1861/1870 | - | - | - | - | 174 | - | - | - |
| 1871/1880 | 0.657 | - | - | - | 194 | - | - | - |
| 1881/1890 | - | - | - | - | 202 | - | - | - |
| 1891/1900 | 0.616 | 1.146 | - | 115 | 208 | - | - | - |
| 1901/1910 | 0.786 | 1.349 | - | 113 | 199 | - | - | - |
| 1911/1920 | 0.823 | 1.498 | - | 172 | 283 | 684 | 25.09 | 41.34 |
| 1921/1930 | 0.926 | 1.708 | - | 213 | 339 | 812 | 26.27 | 41.74 |
| 1931/1940 | 0.986 | 1.910 | 5.500 | 202 | 320 | 853 | 23.65 | 37.46 |
| 1941/1950 | 1.050 | 1.987 | - | 219 | 314 | 948 | 23.14 | 33.08 |
| 1951/1960 | 1.108 | 2.108 | - | 259 | 374 | 1080 | 23.97 | 34.60 |
| 1961/1970 | 1.170 | 1.945 | - | 265 | 341 | 1312 | 20.18 | 25.96 |
| 1971/1980 | 1.192 | 2.090 | - | 314 | 413 | 1603 | 19.59 | 25.79 |
| 1981/1990 | 1.197 | 2.052 | 6.747 | 405 | 516 | 1681 | 24.12 | 30.72 |
| 1991/2000 | 1.301 | 2.136 | 7.800 | 565 | 720 | 2201 | 25.66 | 32.71 |
| 2001/2010 | 1.496 | 2.361 | 9.296 | 953 | 1164 | 2762 | 34.52 | 42.15 |
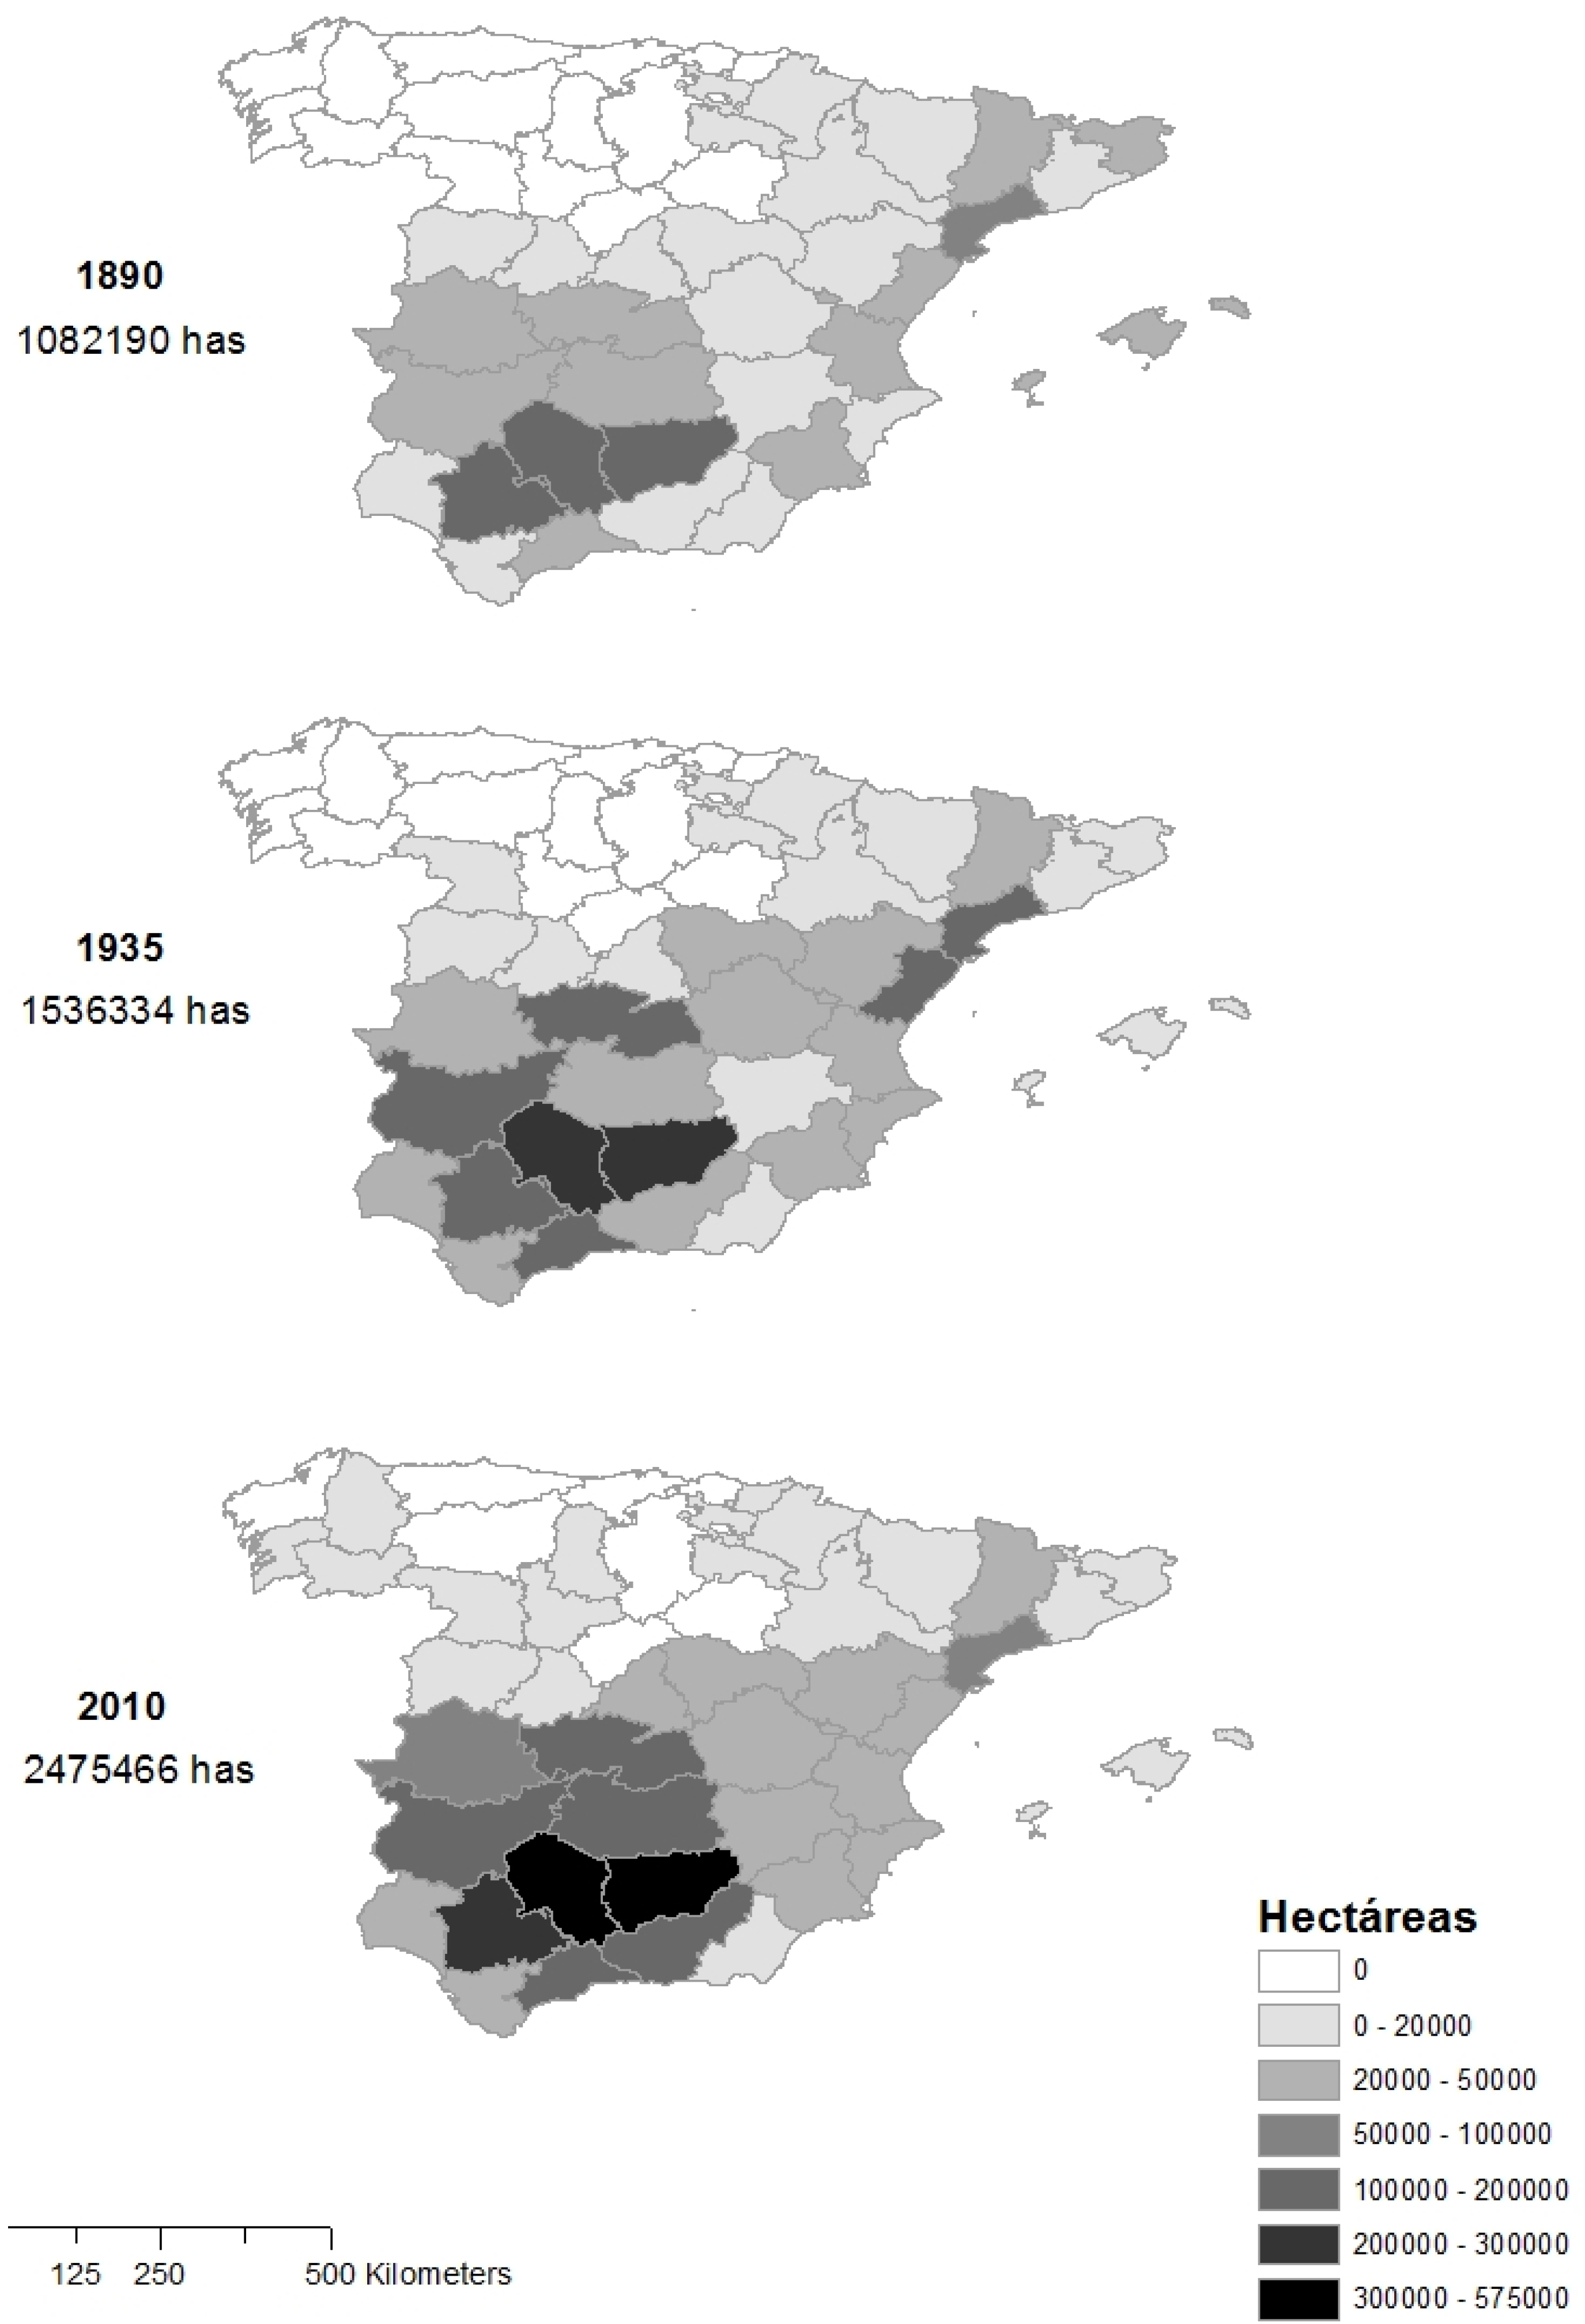
It should be noted that this growth concentrated around very specific geographical areas. Olive-growing has historically been centered around the Mediterranean and southern areas of the Peninsula, particularly Andalusia, and within this region, in the provinces of Jaen, Cordoba, and Seville, which have accounted for close to 50% of the total olive production area in Spain from the late 19th century to the present day (
Figure 1). Between 1890 and 2010, when Spanish olive groves increased their total land area from 1.082 Mha to 2.36 Mha, 44% of the new plantations have been set up in Jaen, Cordoba, and Seville, and 66% are located in Andalusia. Andalusia currently accounts for 62% of the total olive land area in Spain and 15% in the world, making it home to the largest concentration of tree crops in Europe (
Table 1).
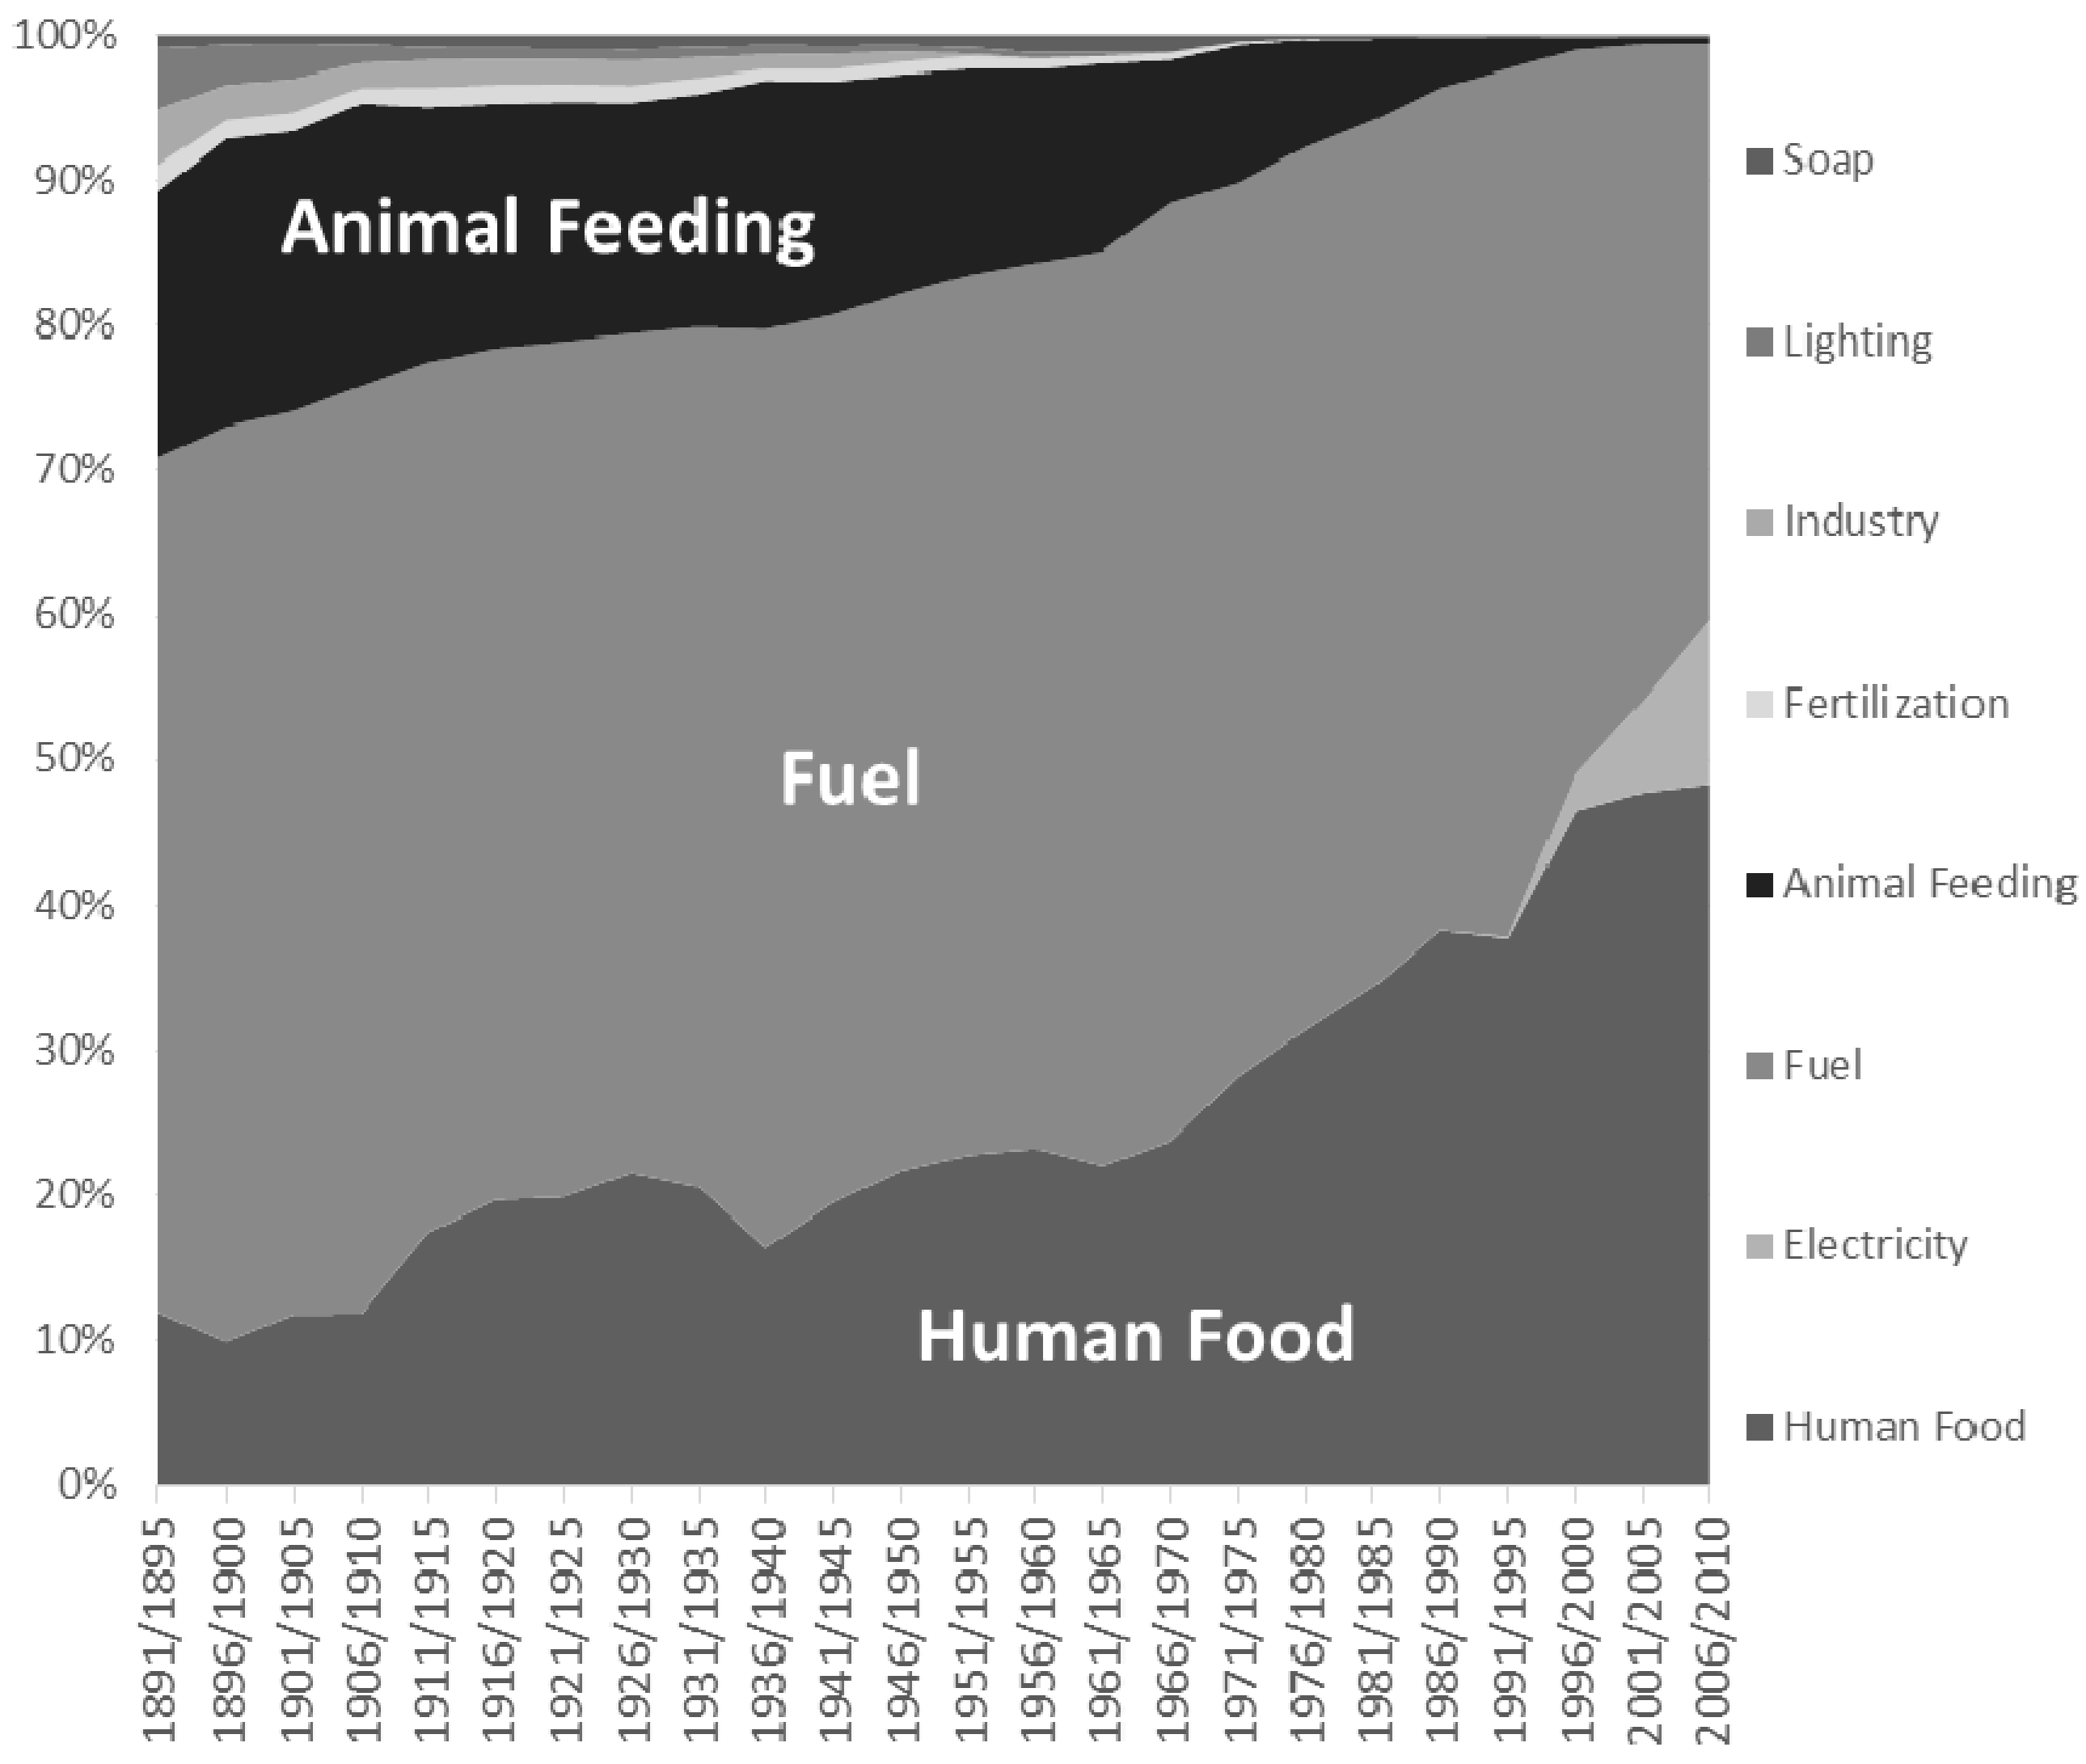
Behind this history of expansion lie changes in productive functionality, management approaches and crop ecology. In the pre-industrial age, the morphology of the olive orchard in Southern Spain was completely different to how it is today. Recent studies have documented that between the 18th and 19th centuries, olive orchards were viewed more in terms of harnessing forest resources than as an agricultural crop [
11]. They were characterized by having a small number of trees per hectare, scarce labor, little input, and therefore relatively low olive production. Hence, the role played by traditional olive production was not so much that of a commercial crop linked to the exportation of oil, but rather a harnessing of resources capable of supplying a higher number of goods for domestic purposes. Oil was not only used for human consumption but also for lighting, as an industrial lubricant, or to make soap. The wet solid waste from the oil milling process, known as “orujo”, was used for fertilization purposes, as fuel, or as animal feed. Olive wood was one of the main fuels used in olive growing areas. Furthermore, since tillage was practiced sparingly, plant cover between the trees grew in abundance and was used as animal feed, as were the leaves from the tree. In 1891/1895, of the total production used from each hectare of olive groves in Andalusia, measured in energy terms, only 11.9% was used for human consumption, whereas 18.4% was used for animal feed, and 59.0% was used as fuel (
Figure 2).
Figure 1.
Land area occupied by olive groves in Spain, by province: (
a) in 1890; (
b) 1935; and (
c) 2010. Source: [
13].
Figure 1.
Land area occupied by olive groves in Spain, by province: (
a) in 1890; (
b) 1935; and (
c) 2010. Source: [
13].
Figure 2.
End uses of olive products in Andalusia. Source: authors’ own elaboration based on [
11,
13].
Figure 2.
End uses of olive products in Andalusia. Source: authors’ own elaboration based on [
11,
13].
This process of transition in production took place not only through a change in the demand for products, but also in the way olive groves were managed over the course of the century. There is no time-series data on a national level regarding the use of fertilizers in olive groves, though there is scattered evidence. Agronomical reports for 1888 and 1921 indicate that Spanish olive groves received practically no input in terms of fertilization beyond the nitrogen fixation offered by spontaneous leguminous plants cover and the return of pruning waste to the soil [
14,
15,
16,
17]. From the 1960s onwards, Spanish agriculture embarked on a process of intensification, with a rapid increase in the use of both inorganic fertilizers—sometimes in excess [
18]—and industrial machinery. Nevertheless, there are indications that this trend towards increased fertilizer input started in some orchards in the region prior to 1960 [
15]. This trend towards intensification can be noted even in the pre-industrial age: for instance, in the case of soil tillage Moldboard ploughs were not used in Andalusia until the late 19th century. Prior to that, the Roman plough was used once or twice a year. Intensification came about gradually over the course of the 19th century, and in the early 20th century, the lanes between the trees were ploughed three or four times, eliminating almost all of the plant cover. In the second half of the 20th century, industrial machinery was introduced, and in the late 20th century herbicide treatments, alone or in combination with ploughing, eliminated practically all proliferation of plant cover between the tree lines.
A further, and probably more dramatic, change came about as a result of the expansion of the irrigation in olive-growing, mostly in terms of deficit irrigation. Deficit irrigation means applying a limited amount of water which is below the trees’ requirement for maximum transpiration and yield. At the end of the 19th Century, barely 70,000 hectares of olive groves were irrigated. In the first half of the 20th century, this figure remained stable at around 100,000 hectares. By the late 20th century this figure had rocketed, reaching the figure of 452,877 hectares by 2009 [
19].
The increased use of industrial machinery, synthetic fertilization, and irrigation explains the rise in olive production, mainly through the increased use of external inputs from the mid 20th century onwards. In Andalusia, the average production of olives per hectare increased from 747 kg ha−1year−1 in 1896/1900 to 3205 kg ha−1year−1 in 2006/2010.
This change also allowed for a substantial rise in the number of trees grown per hectare. Traditional rainfed conditions and systems of fertilization could only sustain low planting density and modest production levels [
20]. Between the late 19th century and up until 1960, plantation patterns remained relatively stable throughout Spain, with an average of 80 and 90 trees ha
−1. Currently, only 37% of the total land area given over to olive groves has 100 or fewer trees ha
−1, 34% has between 100 and 200 trees ha
−1 and 28% has over 200 trees ha
−1 [
21].
In this respect, the intercropping of olive trees with other crops has also been reduced: at the end of the 1960s, there were over 300,000 hectares of intercropped olive groves; now, there are just some 191,000 hectares [
21]. Furthermore, since the 70s, this same source estimates the number of isolated olive trees scattered among other crops or land uses as rising from almost 4 million in the late 70s to just over 180,000 today.
The history of the olive grove both in Spain as a whole and in Andalusia has been one of steady expansion and major transformations. Olive production is currently seen as a highly productive single crop, and although olives are mostly produced for oil, a significant percentage is also used for the processing of table olives (approximately 5.6% of Spanish olive surface is dedicated to such production). Traditionally (before the transformations of the 19th century) the olive grove played a very different role as the supplier of a wide range of goods and products used for domestic purposes. The process of transformation was brought about by changes in demand for products but also in the management approaches applied to the crop.
In environmental terms and from a historical perspective, this process of intensification required greater input of fertilizers and an increase in all agronomic operations, such as tillage. Case studies have documented that, in the late 19th century, soil losses increased in intensity and the balance of nutrients became negative [
14,
22]. The industrialization of the sector in the second half of the 19th century led to the mass usage of external inputs, including labor intensive harvesting systems, until the advent of mechanized harvesting in the more modern plantations of the 1990s—which has also generated major problems such as increased soil losses, the contamination of soil and waterbodies, and the loss of biodiversity [
1].
3. Historical Erosion Rates in Olive Orchards
Unfortunately, soil erosion in the Mediterranean is not a recent phenomenon and has been widespread since ancient times [
23]. As a result of this long-lasting and continued human pressure, present-day degradation of soils has reached severe levels. Clear warning signs, such as completely truncated soils or areas with extremely stony soil, are visible throughout many of the Mediterranean olive-growing areas on slopes. Today’s olive farmers have thus inherited a long history of soil erosion acting on their soils. Many of them are confronted with soil properties that have either already changed irrevocably, such as soil depth, or are progressing towards a critical threshold where the soil’s response to environmental drivers (for example in terms of infiltration capacity) could change drastically if the remaining fertile soil layer is washed away. In order to design suitable management strategies, it is useful to take into account the history of soil erosion in olive orchards and, ideally, draw lessons from the past in order to prevent future degradation. The study of historical soil erosion dynamics also allows us to evaluate the effect of extreme events, which under Mediterranean conditions can be responsible for more than half of the soil erosion over decadal time [
24]. Their low recurrence interval implies that it is difficult to measure them in field experiments, whose record span does not go yet beyond 5–10 years. Determining soil erosion rates over time scales that encompass at least several decades can provide a very much needed insight into long-term trends even though it usually implies greater uncertainty about the absolute accuracy of the measurements, as compared to more controlled experiments.
The evolution of soil erosion in olive orchards is closely tied to their expansion and the changes in soil management. As indicated in the preceding section, soil management practices have significantly changed over the ages. This, together with a rapid expansion over the last two centuries of the extent of olive-growing areas, (
Table 1 and
Figure 1), has led to important changes in soil erosion rates and its relative contribution to the overall sediment budget on regional scale.
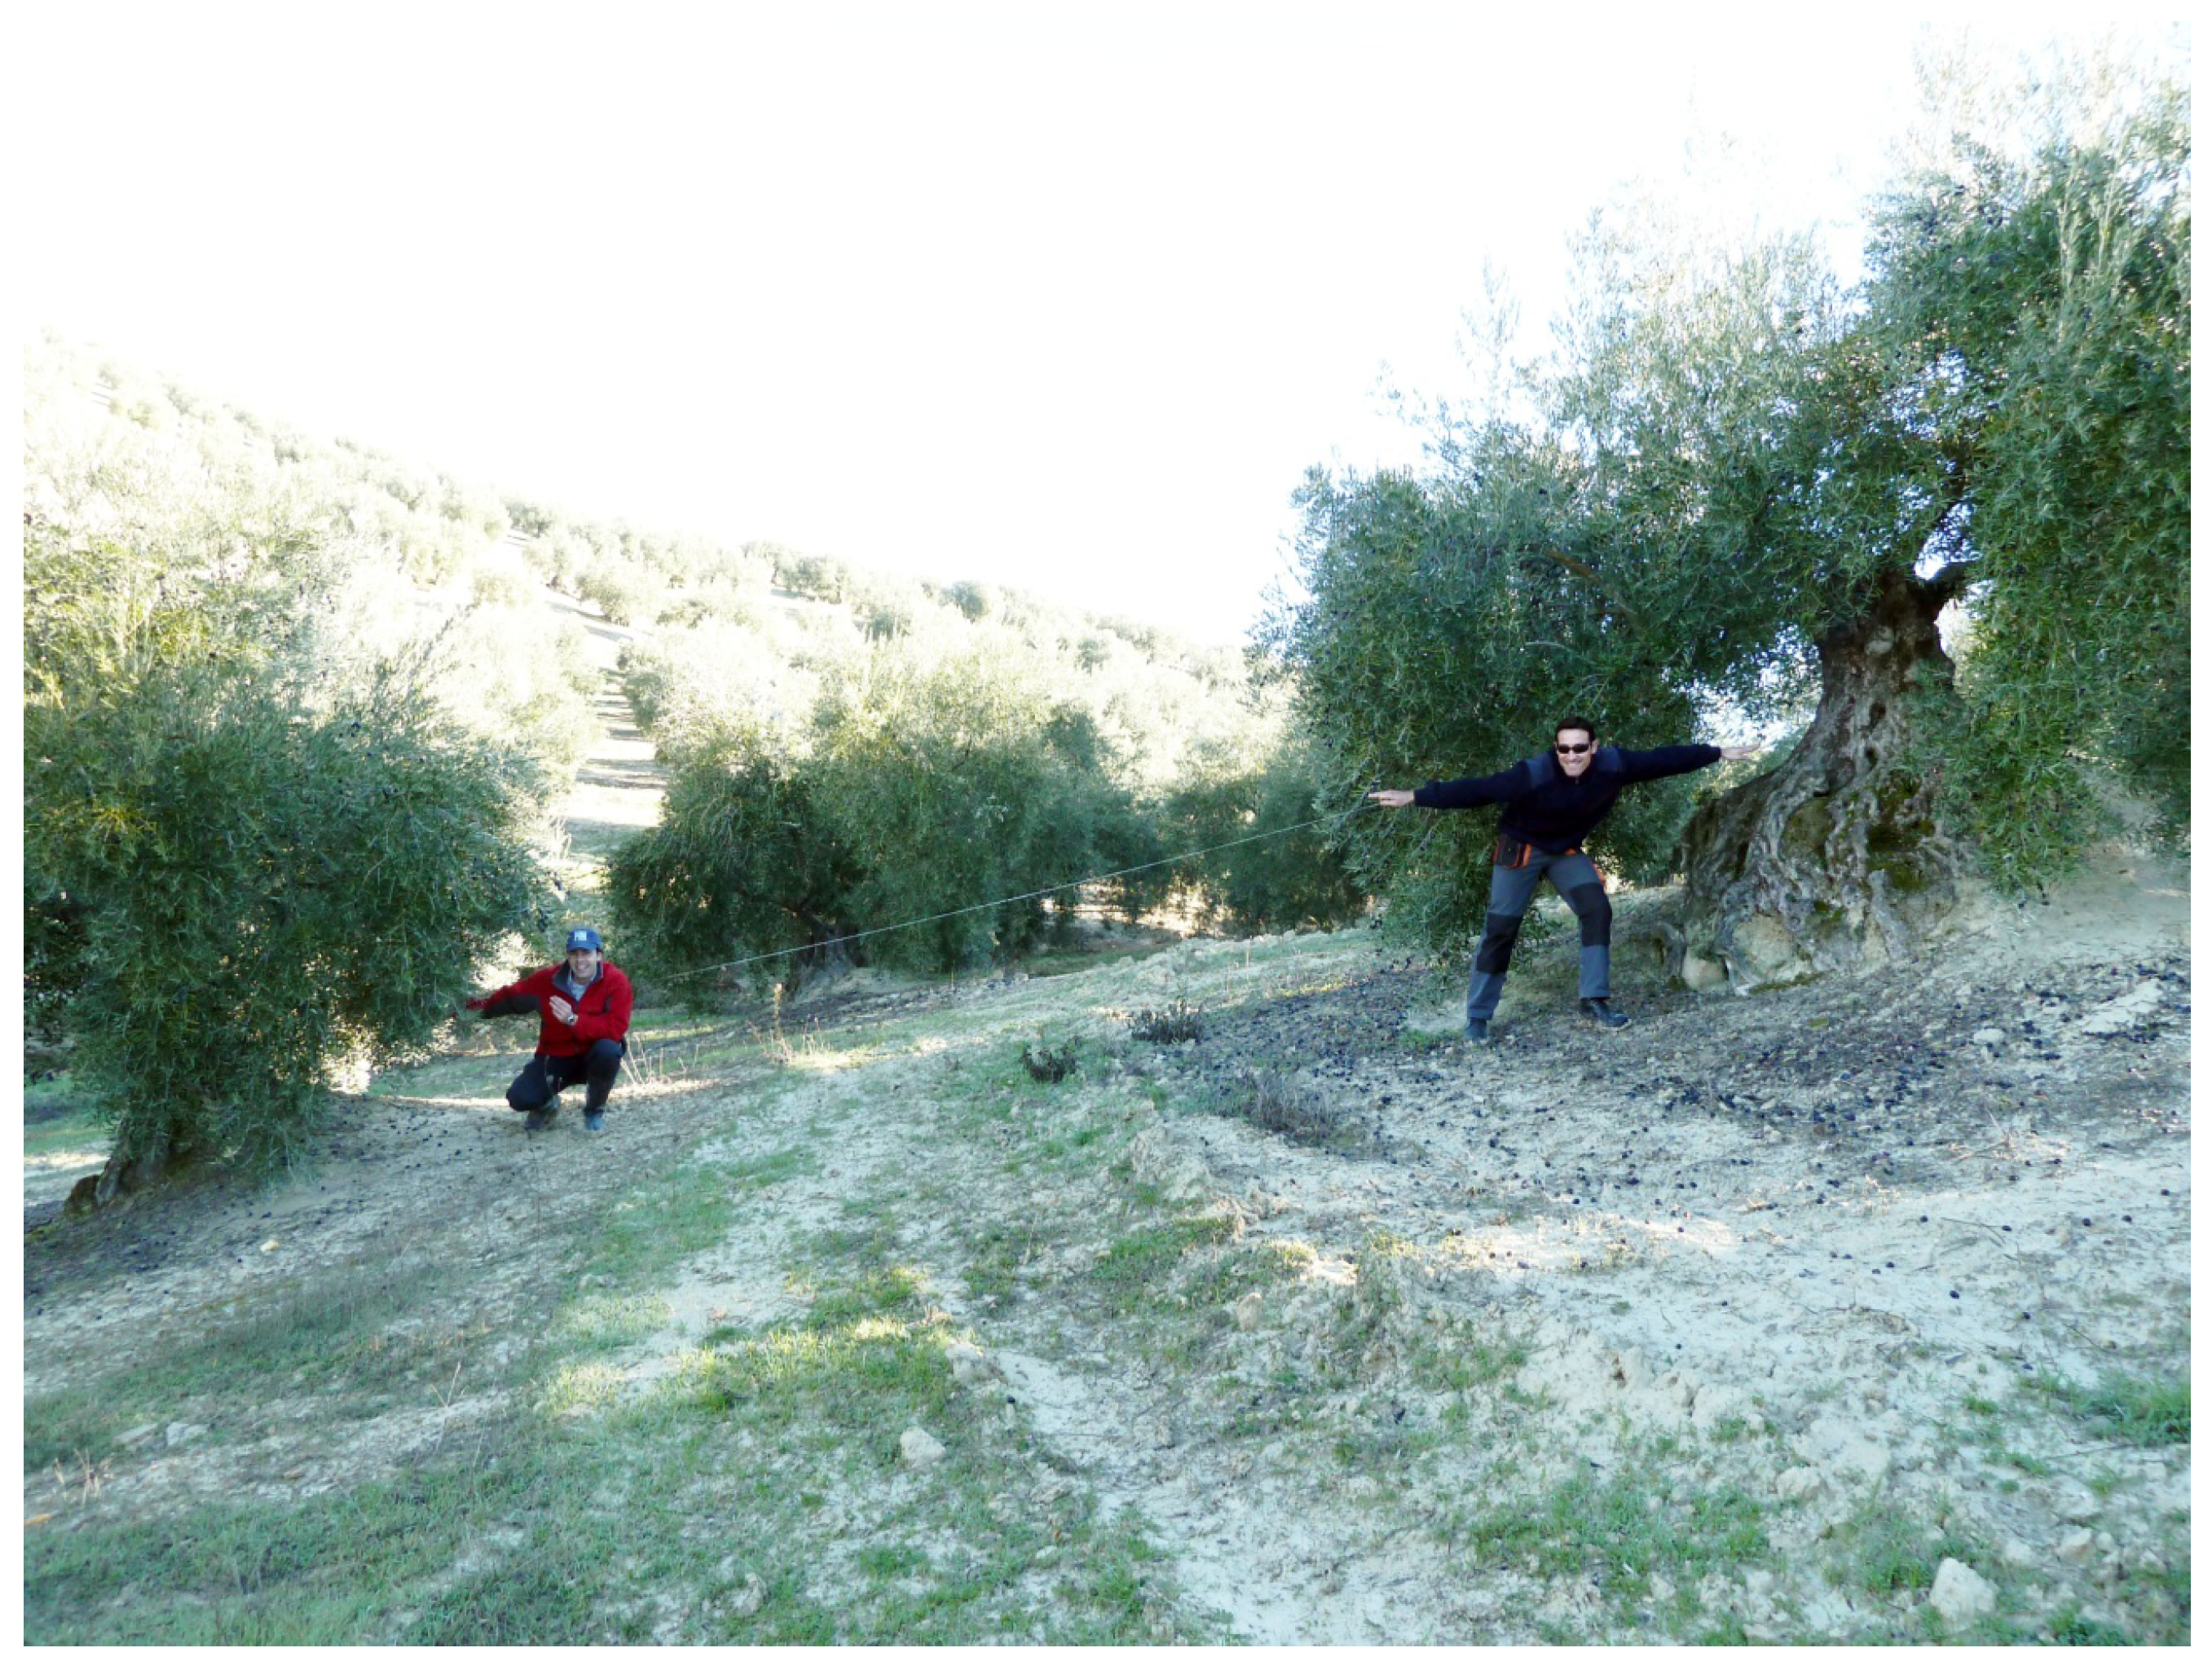
An initial estimate of historical soil erosion rates in olive orchards can be made based on the measurement of the height of the mounds that are formed around the olive trees [
25]. This simple technique takes advantage of the permanent character of this tree crop. From a set of measurements of tree mound height in an orchard, the original soil surface at the time of planting can reconstructed and interpolated. The difference with the current surface allows us then to determine the eroded soil volume over the area being measured (
Figure 3). If the trees’ planting date can be established by interviews or, preferably, with the help of historical documents, soil loss rates can be calculated over a time period of up to almost 300 years, which is the maximum tree age observed in the field so far. Using this technique, we determined [
22,
25] soil loss rates over time scales of decades to centuries, and reported mean soil loss rates between 61 and 184 t ha
−1 year
−1 over 7 different sites near Córdoba (Southern Spain)and between 23 and 64 t ha
−1 year
−1 over 3 different sites near Montefrío (Southern Spain).
In order to clarify the relationship between soil erosion and soil management, more studies on historical soil erosion rates are needed. Changes over the last decades have been drastic, and include, for example, the introduction of mechanized agriculture with frequent tillage. Radioisotope tracer techniques are an ideal tool for the study of historical soil erosion and deposition rates on medium-term time scales, and have been successfully applied in different parts of the world. The most widely used isotope is
137Cs, whose half-life allows us to determine soil erosion rates over a time scale of about 60 years, although other isotopes such as
210Pb could be used for longer time scales (
ca. 100 years). However, up to date, only a few studies have used this technique in fields under olive cultivation. Mabit
et al. [
26] evaluated the potential of this technique in the area of Montefrío (Southern Spain). After extensive validation which used an unexcavated area within a protected archaeological site from Iberian times as a reference area, they concluded that erosion rates in a nearby orchard had reached maximum average values of 19 t ha
−1 year
−1 from the 1950’s to date, with an estimated sediment delivery downslope of 29%. These figures imply not only an accelerated erosion rate on the hillslope, but also that even on this field’s scale, about one third of the eroded soil is redeposited on the footslopes. Similar results have been obtained in other studies on historical soil erosion. For example, in Belgium, a sediment budget in a small river catchment (
ca. 758 km
2) over the last 10,000 years, revealed that 15% of the eroded sediment was still stored as hillslope deposits [
27], and a bigger amount as floodplain sediment (68%). In Mediterranean environments under olive cultivation, there is the need to collect more data before a similar sediment budget can be established on an historical time scale.
Figure 3.
Reconstruction of historical soil loss since olive plantation based on surface topography reconstruction with tree mounds.
Figure 3.
Reconstruction of historical soil loss since olive plantation based on surface topography reconstruction with tree mounds.
To our knowledge, only one study exists that integrates soil erosion and sediment transport over larger spatial scales and longer time frames (up to 4000 years) in olive growing areas. Martín-Puertas
et al. [
28] studied sediment deposits in the Laguna de Zoñar, a 370 ha endorheic basin in Southern Spain. While the land use has varied a lot over this period, the sediment record indicates important anthropogenic activity associated with olive trees since Iberian times (
circa 500 BC), and at present, the catchment is almost exclusively under olive cultivation. Short periods of increased erosion and sediment delivery to this lake were identified in 650 BC, 300 BC, 300–370 AD, 1350, and during the last centuries two important episodes were identified (1950–1970 and after 1980). While these phases of increased erosion reflect both climatic and human influences, the heavy metal enrichment ratios that indicate an intensification of human activity during the Iberian-Roman Period and the use of fertilizers during the last 50 years are especially significant.
The field measurements and datings discussed above are crucial for quantifying historical soil erosion rates. However, the modeling of historical soil erosion dynamics is an indispensable tool to better understand the relationship between soil management intensity and soil erosion rates in the past and to extrapolate the limited field data available to a broader area and a higher temporal resolution. One of the major limitations for the application of soil erosion models at historical time scales is originated by the necessary input parameter data and by the limited data set for validation. Based on an extensive study of the documentary sources [
22], soil management could be documented in detail over a 250 year period in the Montefrío area (Southern Spain). Eight different periods were distinguished, starting from low-intensity management, with two light animal-drawn tillage operations per year, to high-intensity management, with at least two passes per year with the moldboard plow and between two and four (shallower) passes with the harrow. Based on this information, key parameters such as vegetation cover, plowing depth, or the duration of periods with bare soil could be determined. Rainfall erosivity was reconstructed from a combination of rain gauge measurements and historical documents. Finally, this input dataset allowed us to run a combined analysis using a water erosion model (based on the Revised Universal Soil Loss Equation or RUSLE) calibrated for olive orchards according to the methodology established by [
29], combined with a tillage erosion model, which was specially designed for this study and applied on three different sites. The model reproduced the temporal patterns in soil erosion rates and showed considerable historical variation.
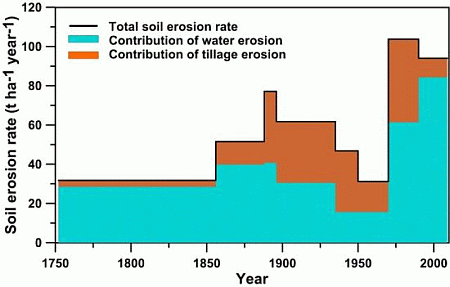
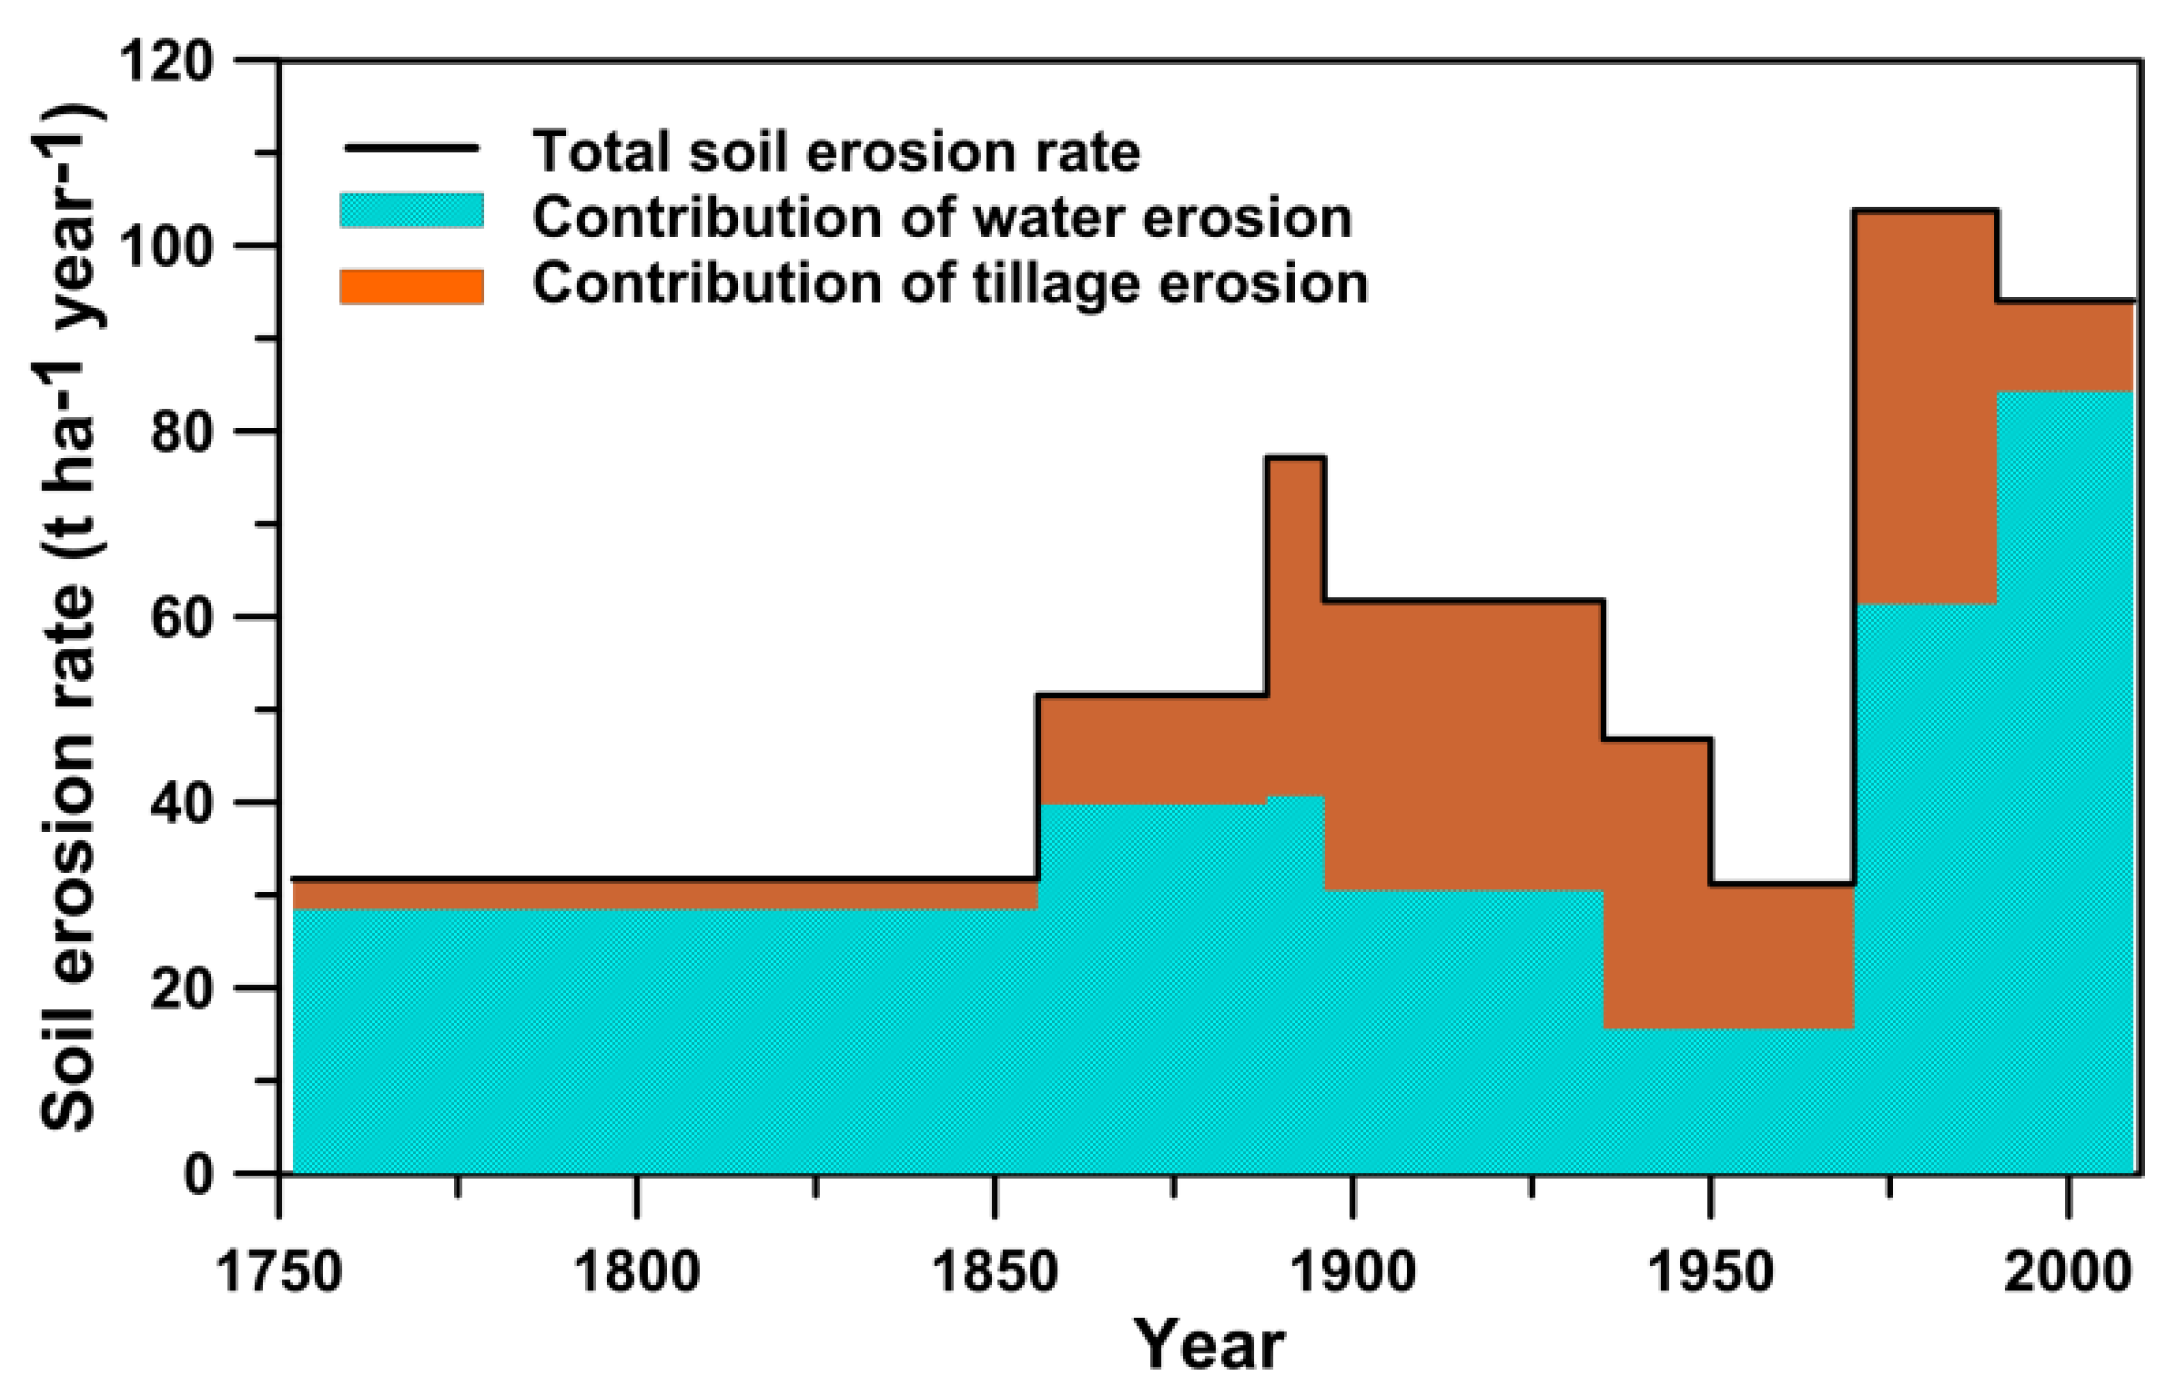
Figure 4 represents the average soil erosion rates of the three sites: between 16 and 84 t ha
−1 year
−1 for water and between 3 and 28 t ha
−1 year
−1 for tillage. The results showed that even before the advent of mechanized agriculture, a period often associated with sustainable land use, soil loss rates were already relatively high: 32 t ha
−1 year
−1. The model also pinpointed a particular period between 1935–1970 with considerably lower soil erosion rates, as cereals were grown among the olive trees due to the autarchic economic regime after the Spanish Civil War. Finally, after the introduction of mechanized agriculture in the 1970s, combined soil erosion (water plus tillage) rates almost tripled. The model results also allowed us to distinguish between the relative significance of water and tillage erosion processes, the former being identified as the most important. It is also important to note that, since the late 2000’s, a combination of agro-environmental regulations coupled with the higher cost of fuel has resulted in a reduction of tillage operations, as well as of the plowing depth, which resulted in a markedly decreased rate of tillage erosion.
Figure 4.
Historical soil loss in Montefrío olive orchards based on the average of three study sites [
22].
Figure 4.
Historical soil loss in Montefrío olive orchards based on the average of three study sites [
22].
There are no indications in traditional sources of extensive erosion damage in olive orchards prior to the expansion of olive cultivation in the mid-18th century [
11]. This can be explained by the low intensity of the tending systems applied and extensive vegetation ground cover permitted by these systems. However, the situation has changed during the last 250 years, in which this crop has rapidly expanded all over the Southern part of Spain. Although soil management intensity was relatively low before the start of mechanized agriculture in the last decades, the intensity of soil erosion has been shown to be unsustainable since as early as the late 18th century. It is clear that there has been an important time-related variability of soil erosion rates over time due to direct feedback between soil management and the intensity of soil erosion. Historical data has clearly shown that during periods of increased soil cover, soil erosion rates are considerably reduced, for example during the 1935–1970 period in the area of Montefrío, which was intercropped with cereals. Especially in the last decades, however, soil erosion under olive cultivation has been especially intense and rates have been shown to have tripled, due to a cultivation system based on the complete elimination of the vegetation ground cover among the olive trees all year round. More quantitative field data and dating will be needed before the results of these case-studies can be extrapolated to broader areas with reasonable certainty. In addition, the contribution to soil loss of processes such as gully erosion, shown to be important in many Mediterranean areas as well as in olive growing areas in Andalusia [
30], is yet unknown on a historical time scale.
4. Appraisal of Current Erosion Rates and Soil Quality in Olive Orchards in Andalusia
There are basically two major approaches to soil management in olive orchards in Andalusia, and broadly speaking, all over the world: those which eliminate the ground cover in the area outside the projection of the olive canopy (which is achieved through plowing, the use of herbicides or a combination of both) and those which provide ground cover, usually achieved using a cover crop (seeded or spontaneous), sometimes combined with a mulch of pruning residues. In the latter case, control of the growth of the cover crop in spring is required to prevent competition for soil water with the trees, which are still mainly rainfed or, when irrigated, are under deficit irrigation. Although there are variations within each of these two main approaches (for instance, the number of times plowing is applied, whether a herbicide is or not used for bare soil management, the extension and type of the cover crop and the date of its control and the method used: either mechanical, animal or chemical), the major differences in soil management and its impact on soil properties are related to the presence or not of ground cover beyond the one provided by the olive tree canopy [
31]. In Andalusia, we have found two kinds of studies measuring erosion rates in olive groves. Some are based on runoff plots and are aimed at comparing the effects of different soil managements on soil losses under the same environmental conditions (rainfall, topography, soil type) at hillslope scale. The other kind of studies are based on measurements taken on a small catchment scale (7 to 12 ha). The latter provide an integrated measurement of the balance between the different erosion processes and the deposition in the lower areas of the catchments, but are not conceived to evaluate the impact of different soil management under controlled conditions.
Table 2 summarizes the results of these experiments. Hillslope-scale, plot-based experiments usually show unsustainable erosion rates when bare soil management (continuous tillage, CT, or no tillage with bare soil, NT) is used, which is in line with the observations of long-term erosion rates based on indicators such as olive mounds [
22] or radionuclide content on eroding profiles [
26]. Although NT and CT are different soil management methods, they result in comparable water erosion rates. It is also apparent from
Table 2 that erosion rates under the same conditions and with the use of a cover crop are greatly reduced, usually below or closer to tolerable erosion rates. Within the context of erosion studies in olive orchards, tolerable erosion rates usually range from 10 to 12 t ha
−1 year
−1 [
32] following the approach recommended for tree crops by the literature. The results shown in
Table 2 on small catchment scales also indicate relatively high erosion rates, with the exception of one experiment, where a combination of cover crops and rocky outcrops (and a notably dryer rainfall regime) within the catchment resulted in low erosion rates. These results are consistent with the concern about high erosion rates and degraded water quality due to offsite contamination (which is indirectly related to high sediment load from the cropping areas) in olive growing areas in Southern Spain [
1].
Table 2.
Measured soil losses by water erosion on hillslope (plots) and catchment scale experiments in olive orchards. NT means bare soil with herbicide use and no tillage, CT bare soil by tillage, CC cover crop soil management. Sources:
1 [
33],
2 [
34],
3 [
35,
36,
37],
4 [
38],
5 [
39],
6 [
40],
7 [
41],
8 [
42].
Table 2.
Measured soil losses by water erosion on hillslope (plots) and catchment scale experiments in olive orchards. NT means bare soil with herbicide use and no tillage, CT bare soil by tillage, CC cover crop soil management. Sources: 1 [33], 2 [34], 3 [35,36,37], 4 [38], 5 [39], 6 [40], 7 [41], 8 [42].
| Experiment | Soil Management | Average Soil Loss t ha−1 Year−1 | Number of Years | Slope Length (m) | Steepness of Slope (%) | Plot Area
(m2) |
|---|
| Conchuela I 1 | NT | 6.9 | 5 | 12 | 13.4 | 72 |
| CT | 2.9 | 5 | 12 | 13.4 | 72 |
| CC | 0.8 | 5 | 12 | 13.4 | 72 |
| Benacazon 2 | CT | 29.6 | 6 | 60 | 11 | 480 |
| CC | 58.9 | 3 | 24 | 13.4 | 288 |
| Conchuela II 3 | CT | 5.6 | 2 | 24 | 13.4 | 288 |
| CC | 5.6 | 2 | 24 | 13.4 | 288 |
| Lanjarón I 4 | NT | 25.6 | 2 | 24 | 30 | 480 |
| CT | 5.7 | 2 | 24 | 30 | 480 |
| CC | 2.1 | 2 | 24 | 30 | 480 |
| Lanjarón II 5 | NT | 25 | 2 | 22.5 | 30.5 | 480 |
| CT | 8.5 | 2 | 22.5 | 30.5 | 480 |
| CC | 6.5 | 2 | 22.5 | 30.5 | 480 |
| Experiment | Soil Management | Average Soil Loss t ha−1 Year−1 | Number of Years | Maximum Flow Length (m) | Average Slope (%) | Catchment Area (m2) |
| Conchuela 6 | CT and CC | 16.1 | 5 | 270 | 9 | 80,000 |
| Setenil 7 | NT and CT | 9.3 | 6 | 340 | 9.5 | 67,000 |
| Puente Genil 8 | CC | 1.8 | 5 | 150 | 15 | 61,000 |
One major question is how to extrapolate these experimental records to the 1.5 Mha of olive groves in the region. This has been done through use of RUSLE [
43] to simulate the different conditions (of slope, soil and climate conditions and soil management) present in olive orchards in the region. Gómez
et al. [
29] proposed a methodology for calibrating the RUSLE factors for different conditions of olive orchards in the region. The prediction capabilities of this approach have been evaluated with long-term erosion rates [
22] with a good level of accuracy. Marín [
44] using most of the experimental data summarized in
Table 2 found good correlation with a RMSE of 4.6 t ha
−1 year
−1 and a model efficiency (Nash and Sutcliffe) equal to 0.82. Using this methodology, Gómez and Giráldez [
32] calibrated RUSLE on the scale of a “comarca” (roughly, the Spanish equivalent of a county) using the rainfall, slope and soil properties available for the K, R, L and S factors of RUSLE.
Figure 5 and
Table 3 summarize the main results of this study, including the definition of those factors.
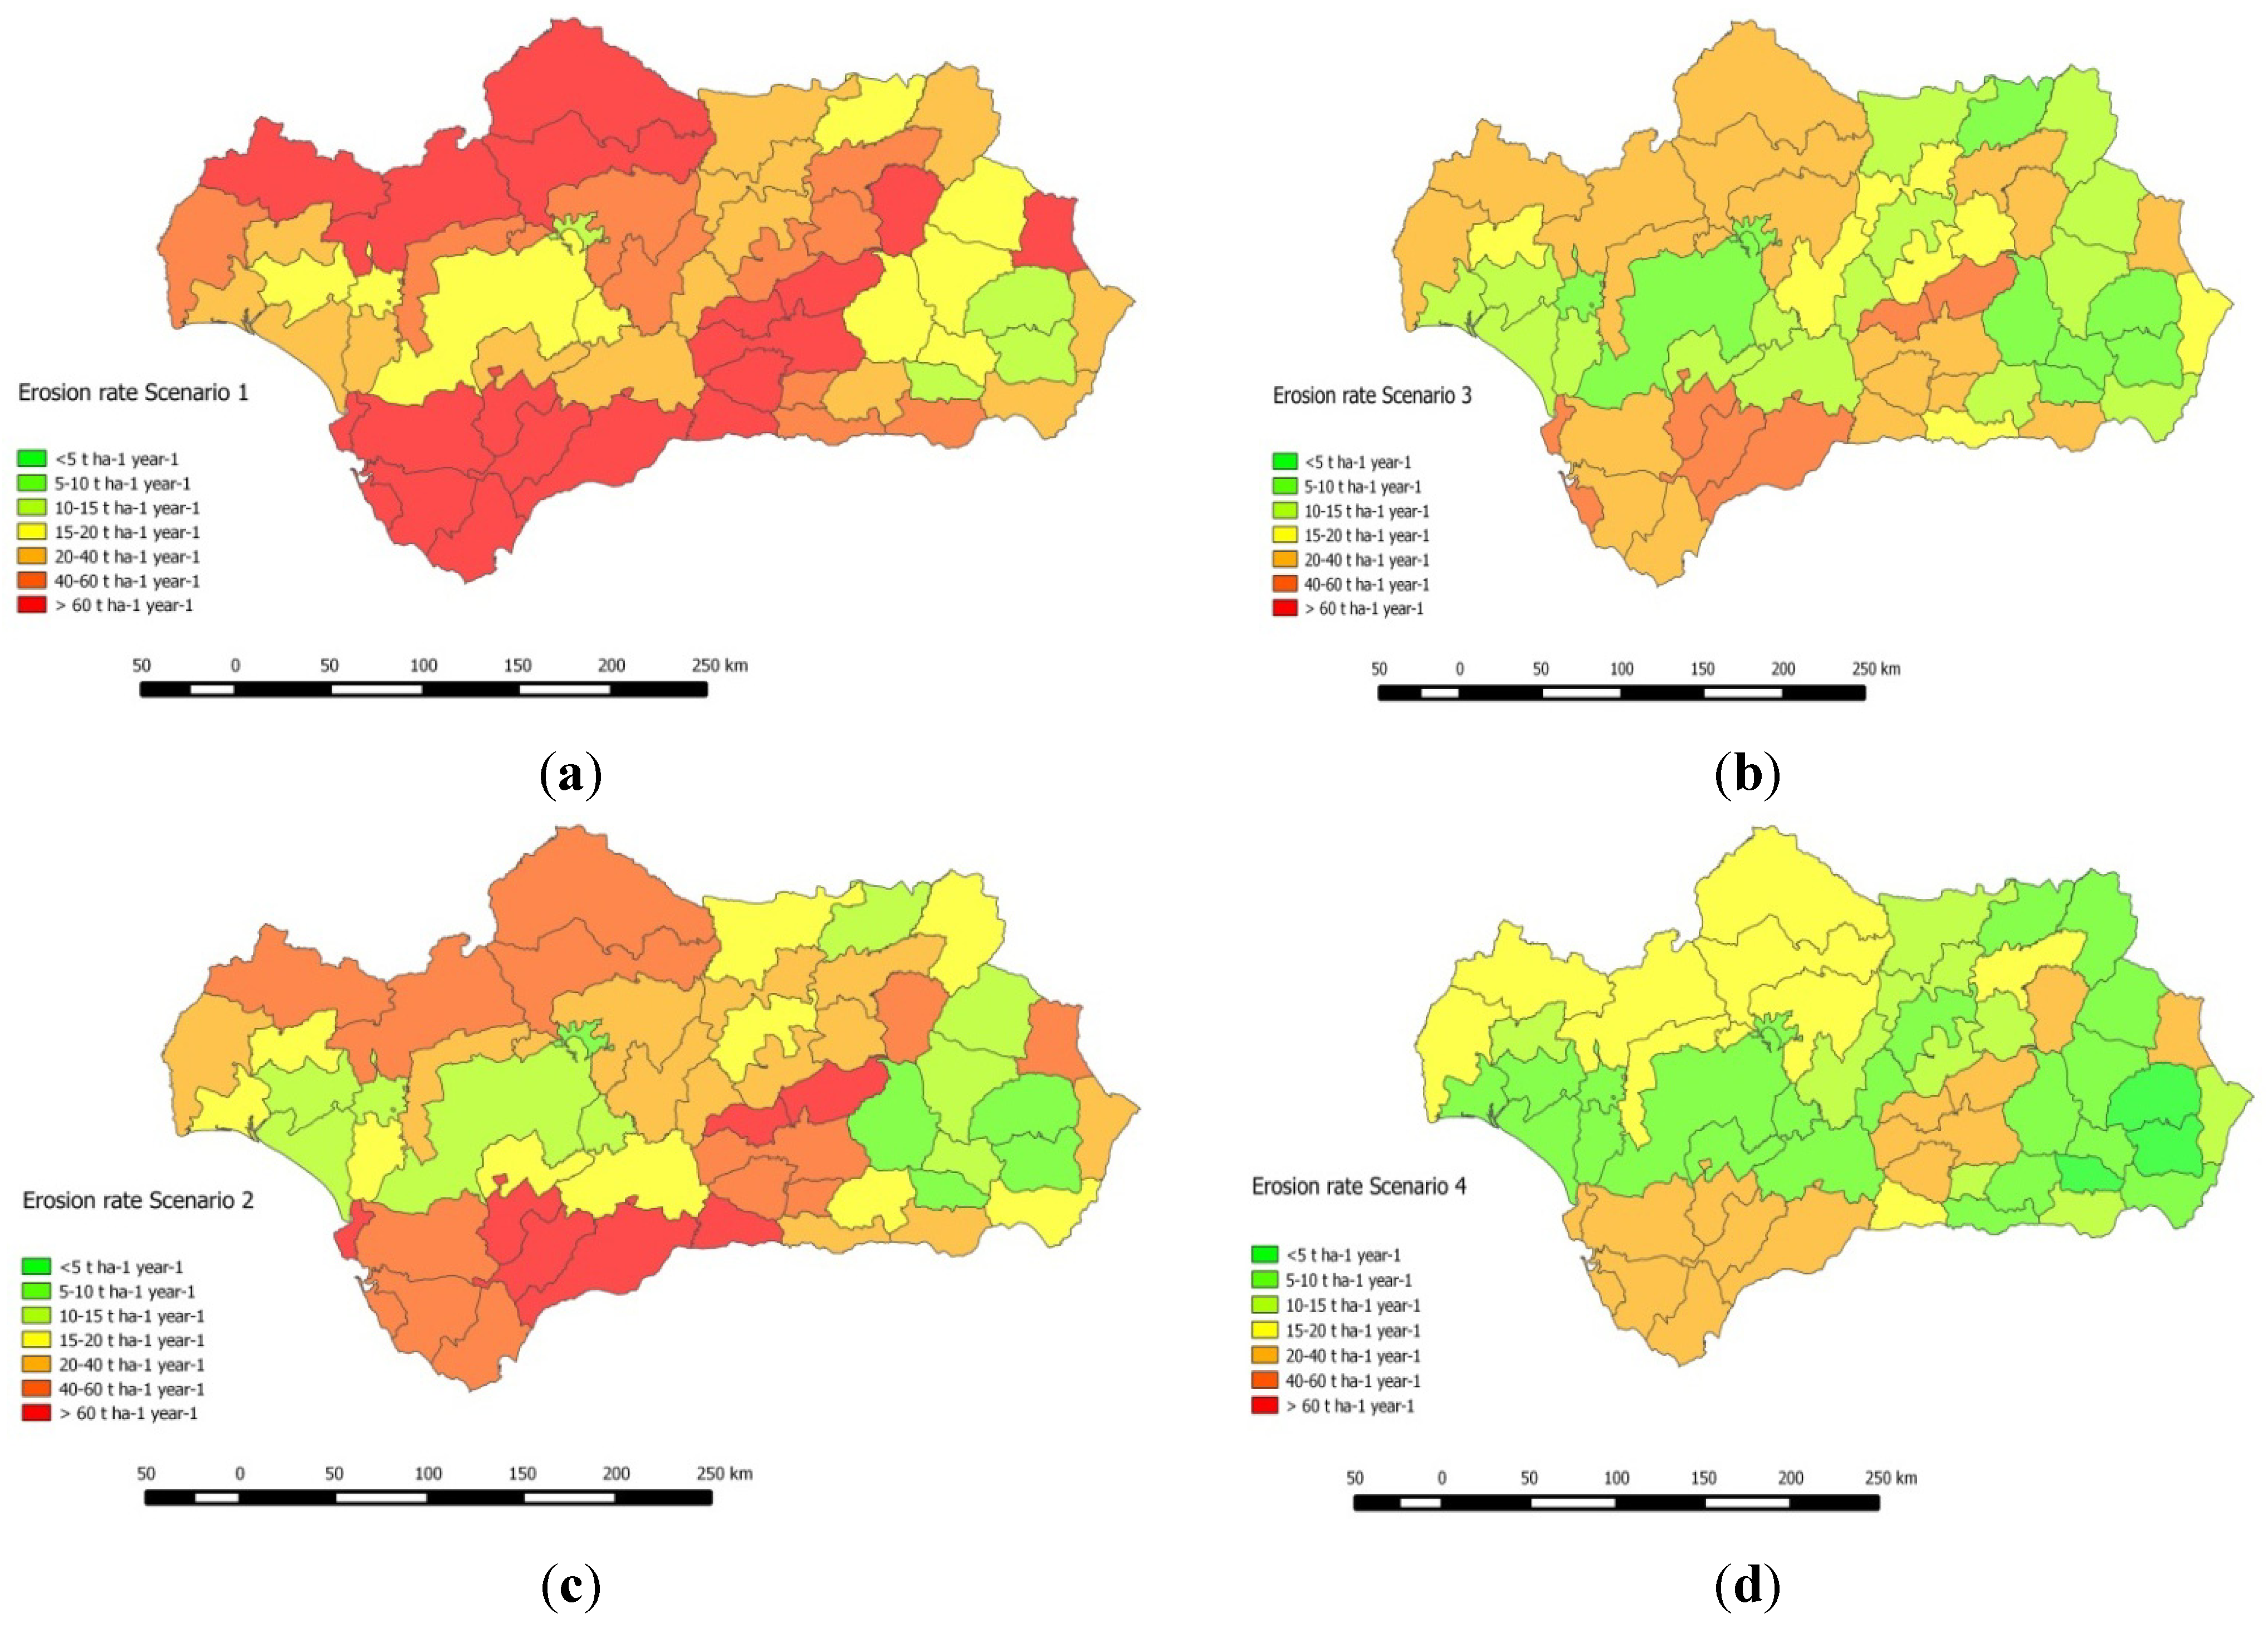
Figure 5 summarizes the erosion losses caused by water on a hillslope scale in the different areas in Andalusia according to different scenarios. Scenario 1 is the scenario which assumes bare soil management, which was the standard situation stemming from the widespread introduction of mechanization and the use of herbicides in the late 1950’s, up until the introduction of agro-environmental regulations (national or European) to prevent soil erosion in the mid 2000’s. Scenario 2 is the present situation according to expert analyses [
32], which points towards a moderate adoption of cover crop use. Scenarios 3 and 4 are hypothetical scenarios considering more appropriate soil management techniques (basically, an expansion of cover crop use), especially in the areas with higher erosion risk, even if this leads to a reduction in yield due to competition for soil water between the olive trees and the cover crops.
Figure 5.
Maps of average erosion rates on the hillslope scale in olive orchards by “comarca” (county) according to Scenarios 1 (
a), 2 (
b), 3 (
c) and 4 (
d) respectively. Scenario 1 assumes bare soil management (C
1); Scenario 2 represents the current situation with a moderate adoption of cover crop use (C
2); Scenarios 3 and 4 (C
3 and C
4) are hypothetical scenarios considering more appropriate soil management techniques, especially in those areas with higher erosion risk. See also
Table 3.
Table 3.
Summary of the determination of RUSLE factors for the erosion maps by county and management scenario. Sources [
29,
43,
45,
46,
47,
48,
49,
50,
51]. C
1 to C
4 refer to management scenarios 1 to 4.
Table 3.
Summary of the determination of RUSLE factors for the erosion maps by county and management scenario. Sources [29,43,45,46,47,48,49,50,51]. C1 to C4 refer to management scenarios 1 to 4.
| Variable | Sources | Methodology |
|---|
| Rainfall erosivity, R | [45] | Interpolated using R values in the stations indicated in [45] averaged by “comarca” |
| Soil erodibility, K | [43,46,47] | Calculated following [43] from the soil properties of the main soil types in each “comarca” (taken from [4]), weighted average by the extension of each soil type within each “comarca” taken from [46]. |
| Slope steepness S | [48] | Calculated as from [43] for each soil class within each “comarca” weighted average according to the extension of each soil class indicated in [48]. |
| Slope length, L | [49,50,51] | Calculated from L = 712.78 S−0.6829, with S slope steepness. Imposing a maximum L value of 240 m based on field observations indicated in [49,50,51]. |
| Cover and management factor, C | [29] | According to [
29], including stone ground cover in each “comarca” and average ground cover of olive trees of 35%.
C1: Bare soil by plowing and/or herbicide.
C2: Orchards above 15% slope using a cover crop covering 25% of the ground, mowed in mid-spring. Below 15% plow following contour lines.
C3: Orchards below 10% slope plowed following contour lines, From 10% to 30% with a cover crop as in C2 but covering 33% of the ground. Above 30% slope as in C2 but covering 50% of the ground.
C4. Orchards below 5% plowed following contour lines. From 5% to 20% slope as in C2 but covering 33% of the ground and following contour lines. From 20% to 30% covering 50% of ground cover and disposed following contour lines. Above 30% slope as in C2 but providing full ground cover |
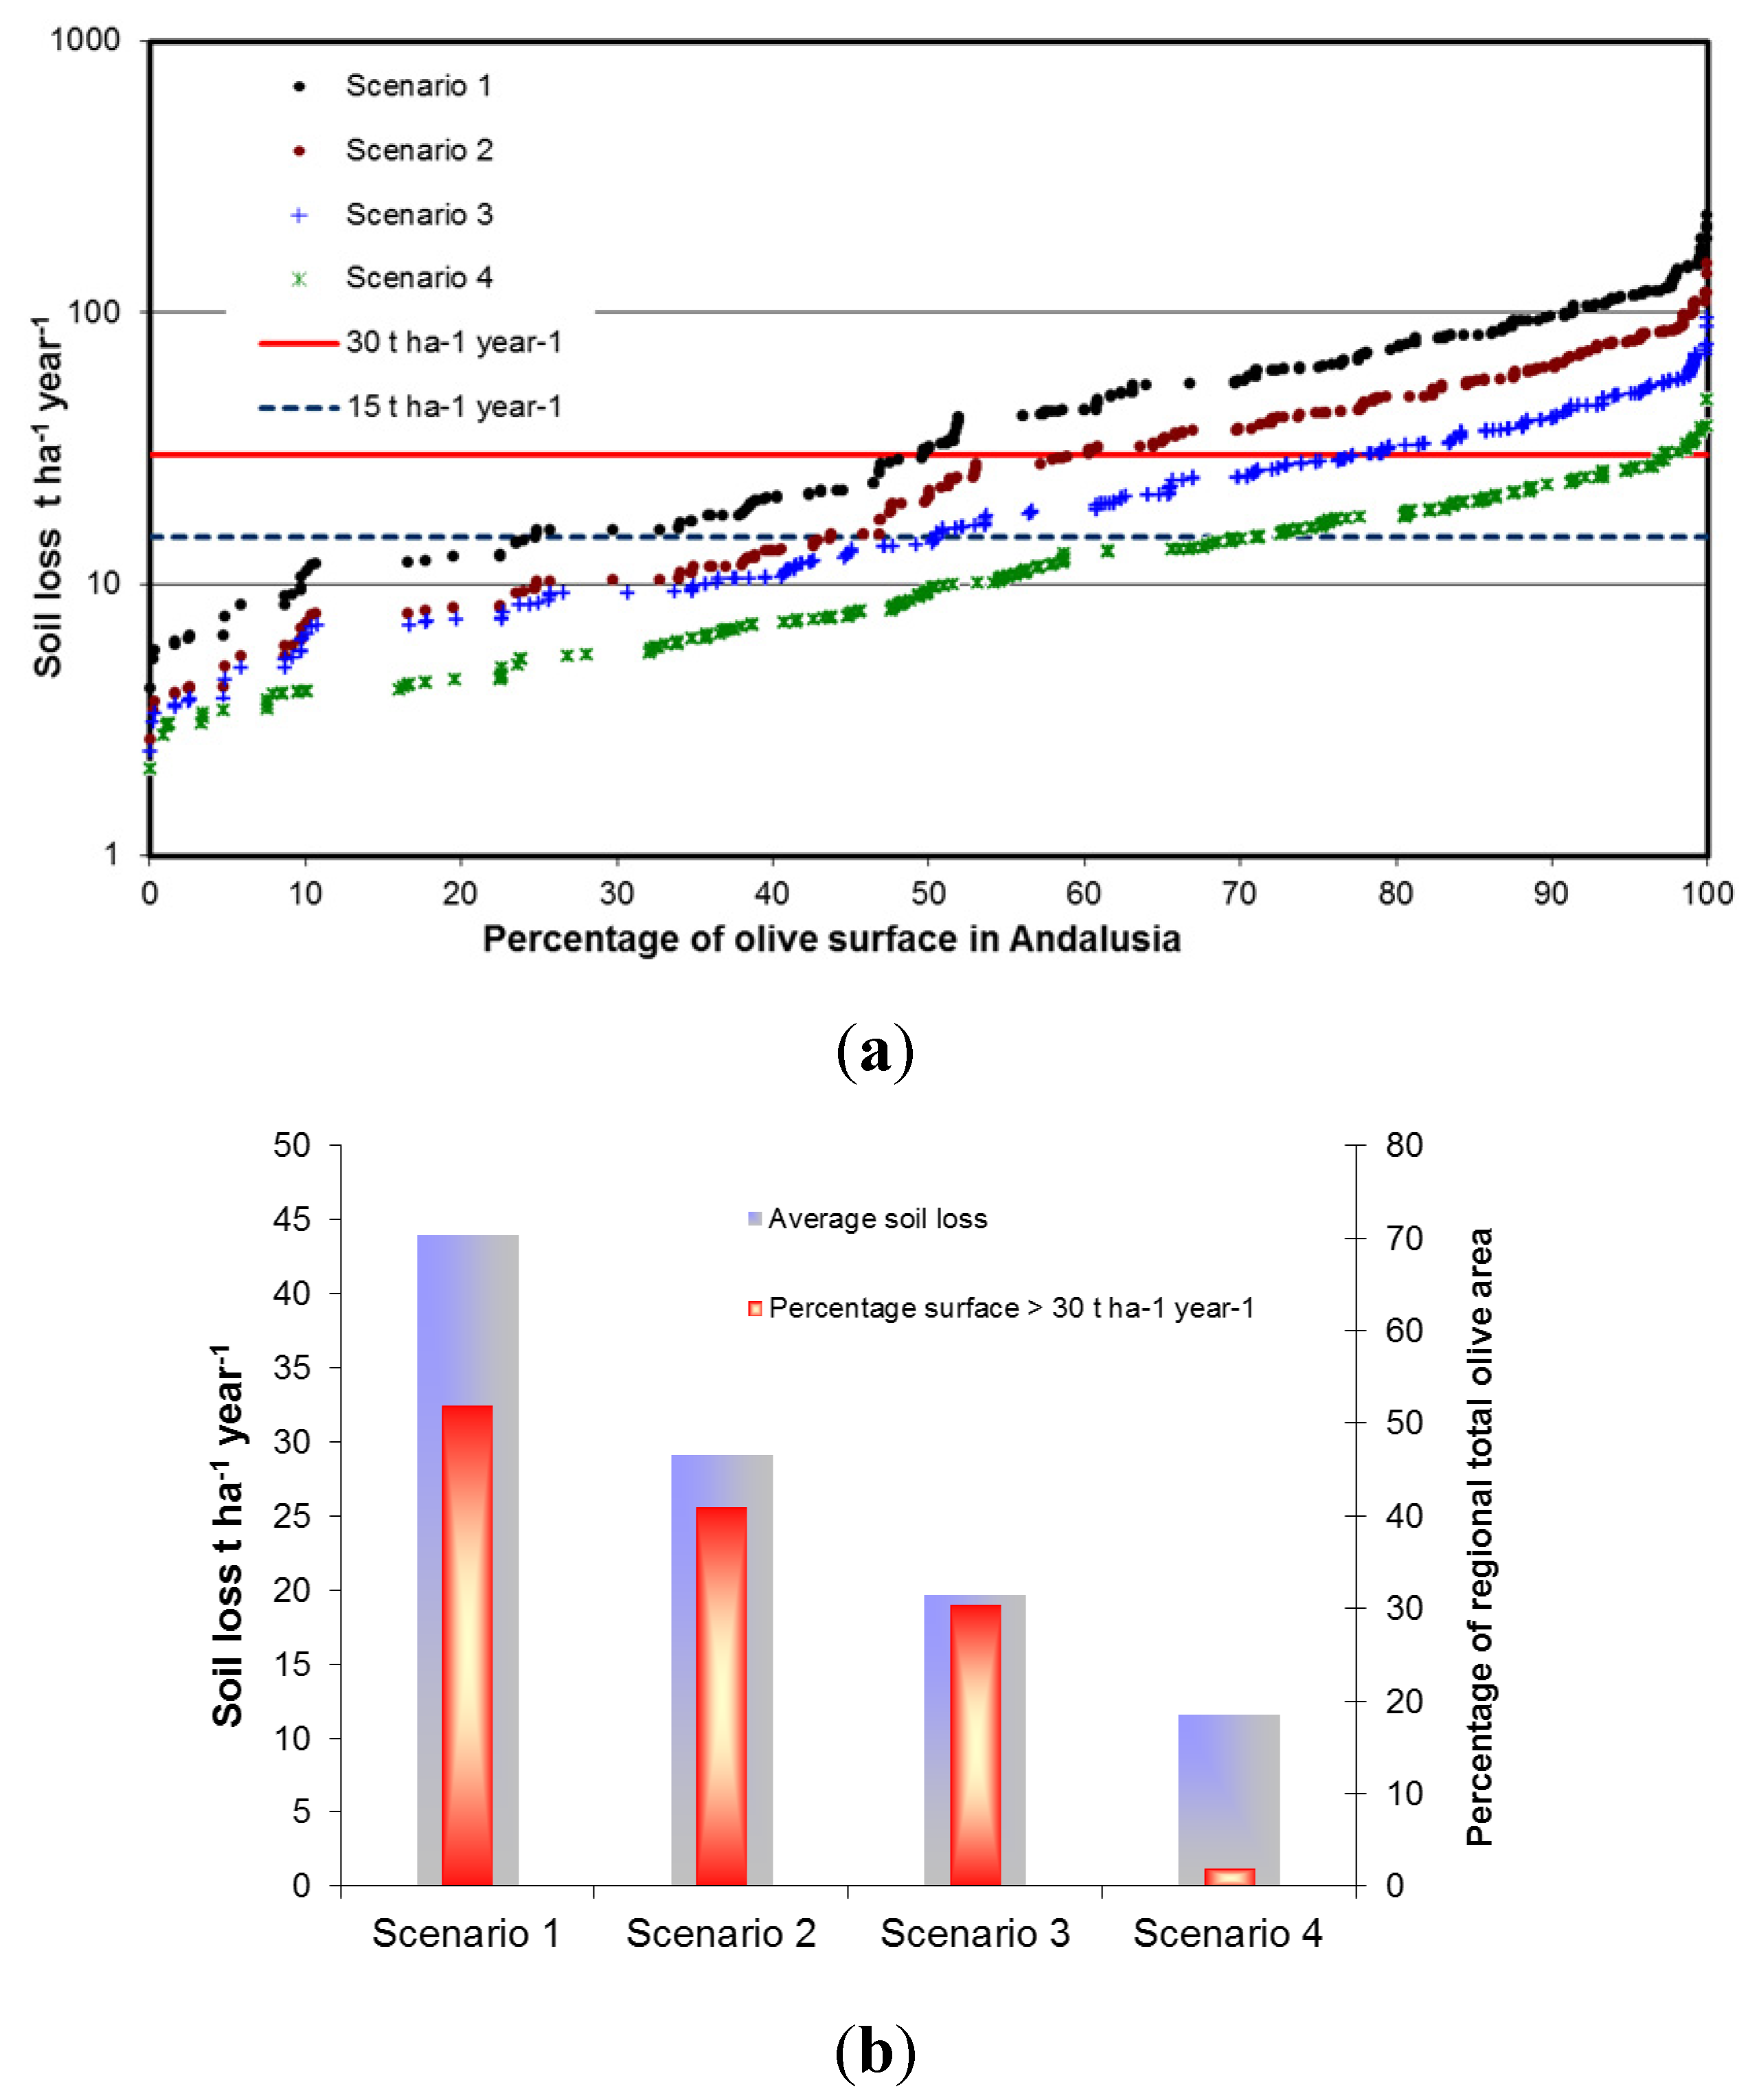
Model predictions depicted in
Figure 5, and summarized in
Figure 6, indicate that unsustainable erosion rates of over 10 t ha
−1 year
−1 are still common in the region. It is worth noting that this may have been a common situation in the region since the late 1950’s due to a combination of cultivation in sloping areas, a relatively high erosivity and unsuitable soil management. Since the situation in the decades prior to the late 1950’s must have resembled an intermediate situation between Scenarios 1 and 2, this model analysis indicates that the unsustainably high erosion rates must have been common in most traditional olive growing areas in the region for a long time. This is consistent with the findings of Infante-Amate and González [
14], which indicate a severe P deficiency in traditional olive groves during the 19th century, which can only be explained by P losses from soil erosion. The same observation of symptoms of unsustainable erosion rates was made by experts during the early 1960s in olive orchards areas in Southern Spain which were still not mechanized [
52]. Finely-tuned soil management techniques specifically oriented to soil conservation, with increased use of cover crops (including their control later in spring), which can even result in a decrease in olive yield [
32], might be necessary to achieve “tolerable” rates (below 10 t ha
−1 year
−1) of erosion. In addition, even in the most sloping (some above 35%) and degraded areas, measures based on the abandonment of olive cultivation to allow natural reversion to Mediterranean forest or other agro-forestry systems [
48] should be promoted (
Figure 6).
Figure 6.
(
a) Cumulative distribution of olive orchard surface in relation to erosion risk according to the four scenarios described in
Table 3; (
b) Average erosion rate and percentage of olive orchards above 30 t ha
−1 year
−1. Scenario 1 assumes bare soil management; Scenario 2 represents the current situation with a moderate adoption of cover crop use; Scenarios 3 and 4 are hypothetical scenarios considering more appropriate soil management techniques, especially in the areas with higher erosion risk. See also
Table 3.
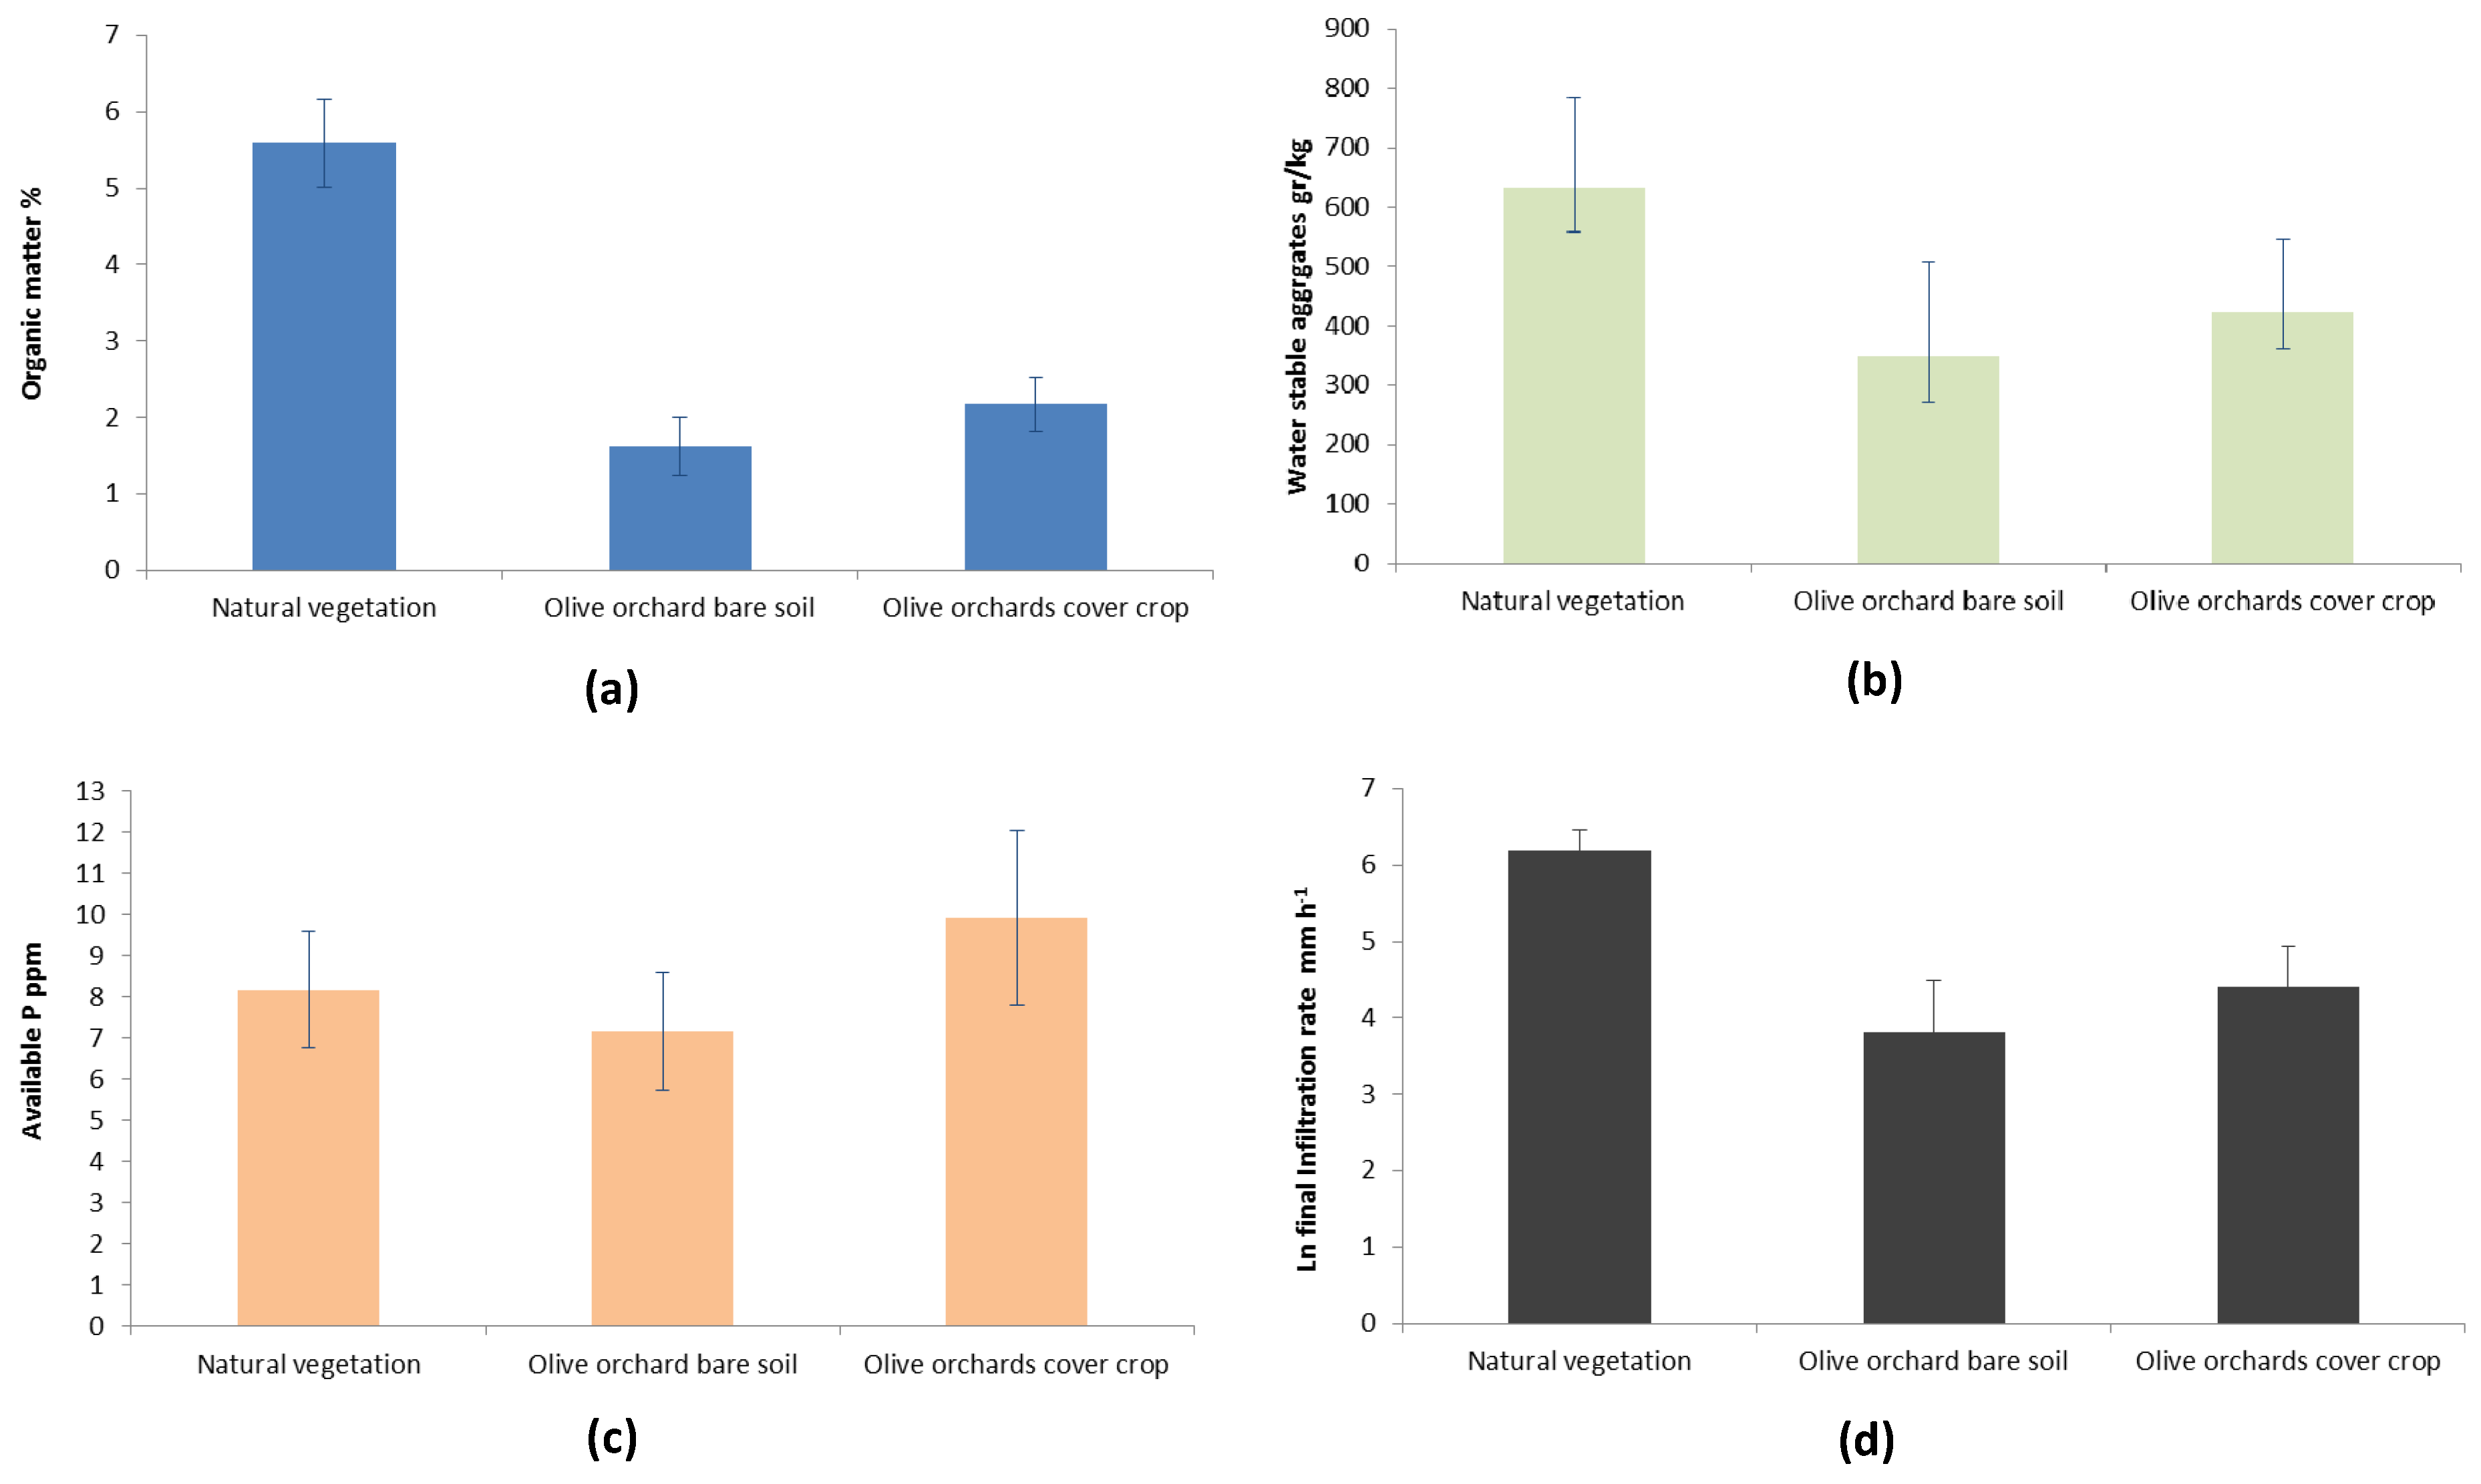
Figure 7 presents a summary of key soil properties of the top 10 cm of soil found in different studies of olive orchards in Andalusia. Although there is a wide variability within each class resulting from the heterogeneity of the soil conditions dealt with by the different studies, a trend towards lower phosphorus and organic matter content and aggregate stability is apparent in olive orchards managed with bare soil, as compared to those with cover crops. In controlled experiments, the correlation between soil management and soil quality indicators is much clearer. For instance, Gómez
et al. [
33] found in a 5 year experiment, a clear correlation between the different erosion rates induced by different soil management techniques (cover crop, bare soil by tillage and bare soil by herbicide) and top soil properties: higher erosion rates and worse soil quality indicators are found as a consequence of bare soil management as compared to those managed with a cover crop, the latter producing the best indicators, and tillage presenting intermediate results. The results in
Figure 7 also indicate a significant decrease in organic matter and aggregate stability of top soil in olive orchards as compared to natural areas.
Figure 7.
Summary of key soil quality indicators in olive orchards, under bare soil or cover crop management, and nearby natural vegetation areas in the top 0–10 cm of the soil. Sources: [
33,
38,
49,
50,
51,
53].
Figure 7.
Summary of key soil quality indicators in olive orchards, under bare soil or cover crop management, and nearby natural vegetation areas in the top 0–10 cm of the soil. Sources: [
33,
38,
49,
50,
51,
53].
5. Soil Water Balance and Olive Yield
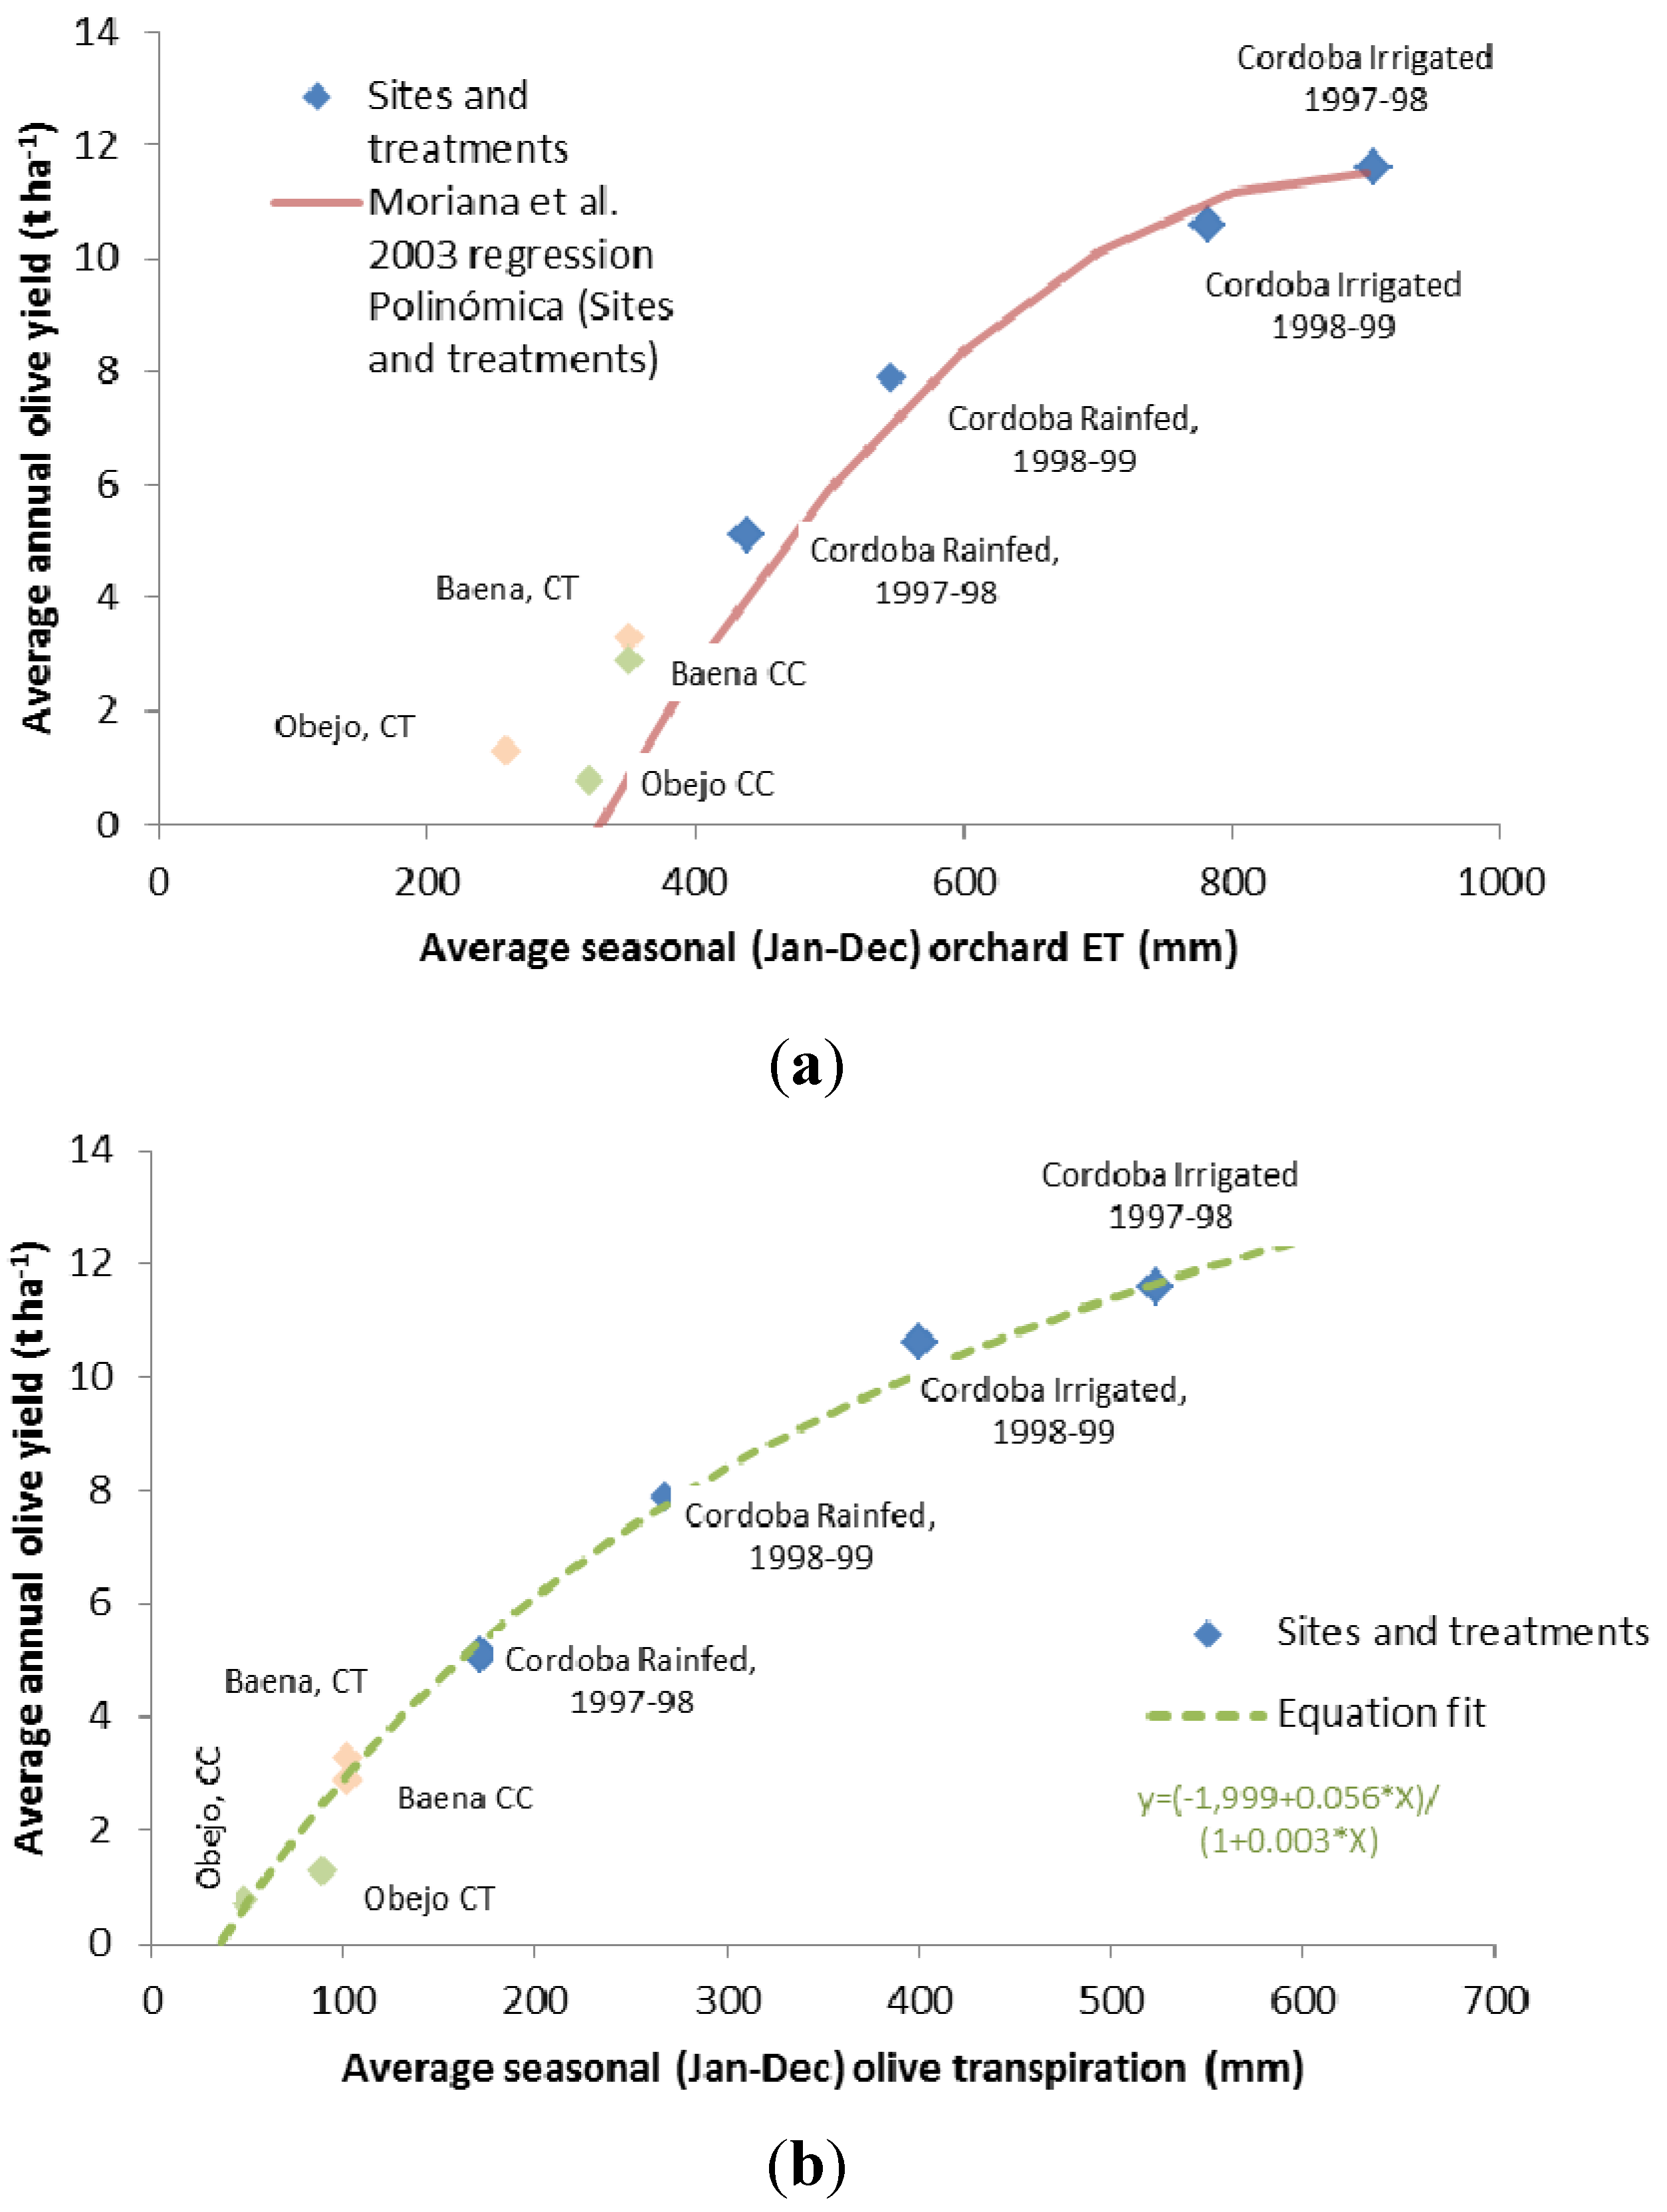
Olive yield, as it is the case of other crops grown in arid and semiarid conditions, responds non-linearly to seasonal evapotranspiration (ET). Moriana
et al. [
54] measured the total ET from soil water content readings using neutron probe measurements. In an adult olive orchard located in Cordoba (Southern Spain) submitted to different irrigation regimes (from fully irrigated to rainfed) they demonstrated that there is a polynomial correlation between seasonal (January to December) olive orchard ET and olive yield, with a diminishing increase in olive yield for higher ET values.
With the objective of determining a robust relationship between current olive tree transpiration and olive yield, we decomposed the two components of ET for the experiments reported by [
54] using a process-based water balance model designed for simulating the components of the hydrologic balance in olive orchards, WABOL [
55]. We did this by simulating the meteorological conditions for the years considered (1996–1999) from daily records, and the three irrigation treatments (fully irrigated, 50% of required irrigation, and rainfed) indicated by [
54], hereafter referred to as Cordoba. To achieve this, WABOL was modified to include specific modules for drip irrigation and evaporation from the soil surface in the area wetted by the dripper. To expand the dataset provided by [
54], we also modeled the components of the hydrological balance for orchards under rainfed conditions in two traditional olive production areas in Andalusia considering those years for which yield records were available. One the sites was an area showing very low yields, close to the town of Obejo, and another one offering medium yields, close to Baena. For these two areas, comprehensive descriptions of the orchards and average yields for three consecutive years were available in [
49] for Obejo and [
50] for Baena. In the Obejo and Baena cases, for which only a three-year record was available, we used the trianual average annual yield, while in the Cordoba experiments we used the biannual average annual yield, orchard evapotranspiration and orchard transpiration data. Due to alternate bearing, the use of biannual averages is standard in agronomic studies of olive yield. In this approximation, we assumed that the model properly determines olive transpiration and soil evaporation, an assumption already made in previous studies [
56] using the same equations implemented in WABOL.
Table 4 provides a summary of the simulations performed as well as some key orchard variables.
Table 4.
Summary of WABOL simulations. ** Irrigated 5 days a week for six hours from 15 April to 10 October using 4 emitters of 8 liter hour−1 per tree.
Table 4.
Summary of WABOL simulations. ** Irrigated 5 days a week for six hours from 15 April to 10 October using 4 emitters of 8 liter hour−1 per tree.
| Place | Management | Tree Density
(Tree ha−1) | Soil Texture,
Depth (cm) | Seasonal Years Simulated |
|---|
| Cordoba | Fully irrigated ** | 278 | Sandy-loam, 220 | 1997–1999 |
| Id. | Rainfed, tilled | 278 | Id. | Id. |
| Obejo | Rainfed, tilled | 150 | Sandy-loam, 80 | 2003–2005 |
| Id. | Rainfed, cover crop | 115 | Id. | Id. |
| Baena | Rainfed, tilled | 100 | Clay-loam, 120 | 2003–2005 |
| Id. | Rainfed, cover crop | 100 | Id. | Id. |
Figure 8a depicts the predicted ET values against the reported yields, indicating in each case the orchard conditions. On the same graph, we have represented the relationship between ET and orchard olive yield proposed by [
54] with a red line (“Moriana
et al., regression”). It is noticeable how the two graphs overlap in the region corresponding to the simulated points for the Cordoba treatments, indicating how the model accurately predicts the ET measured by [
54]. It is also noticeable how the points corresponding to the Obejo and Baena simulated treatments depart slightly from the section of the regression determined by [
54], a section of lower yields for which [
54] there were no experimental records. Nevertheless, the overall dataset follows a similar non-lineal trend of decreasing yield with decreasing ET.
It is apparent in
Figure 8a how there is a very good fit between olive yield and orchard seasonal T,
R2 = 0.98 and RMSE = 0.60 t year
−1, with a diminishing increase for higher T values as observed by [
54] for the aggregated T and E values. This regression can be used to convert the olive transpiration modeled into expected olive yields (assuming that no other environmental or agronomical limitations appear). It will also allow us to evaluate the impact of changing climate or management conditions on yield changes, caused by variations in the water available for olive tree transpiration.
6. Impact of Soil Losses on Olive Productivity
The impact of soil loss on crop productivity mainly occurs in terms of the limited availability of nutrients and water to the crops, but also through physical damage such as root exposure or burial in depositional areas [
57]. Several methods can be used to assess the effect of soil loss on crop productivity, each of which presents specific advantages and limitations. Because of the complexity of the task, the use of simulation models has become very common [
57] in order to reproduce the interactions of different factors, which could compensate or exacerbate the effect of soil losses. In fact, the study on historical erosion rates in Montefrío presented in
Section 3 indicated how yield had increased over the last 200 years due to the improvement of agronomical techniques, while suffering the loss of approximately 40 cm of the original 120 cm estimated original top-soil.
Figure 8.
(
a) Correlation between predicted ET and measured yield for the different simulated conditions (blue [
54], brown [
50] and green [
49] dots indicate sources of the yield data). The red line indicates regression based on field measurements between seasonal ET and olive yield by Moriana
et al. [
54]; (
b) Correlation between predicted T and measured yield for the different simulated conditions (blue dots have the same meaning as the colored dots in
Figure 8a. Also, the fitted regression between seasonal T and olive yield.
It has been recognized that water availability is the major production constraint for olive cultivation [
54]. For a crop which is mostly rainfed, especially in steep areas under arid and semi-arid conditions, the role of soil as a water reservoir for the plant during the dry season is critical, and should play a major role in determining the potential productivity of an olive orchard (assuming that other factors such as nutrient availability or pests and diseases are not limiting productivity). We evaluated the impact of erosion on productivity of rainfed olive orchards using a water balance model, WABOL [
55], and the relationship between olive annual transpiration and annual olive yield presented in
Figure 8b. We considered two examples which were representative of the two different situations of olive orchards summarized in
Table 5.
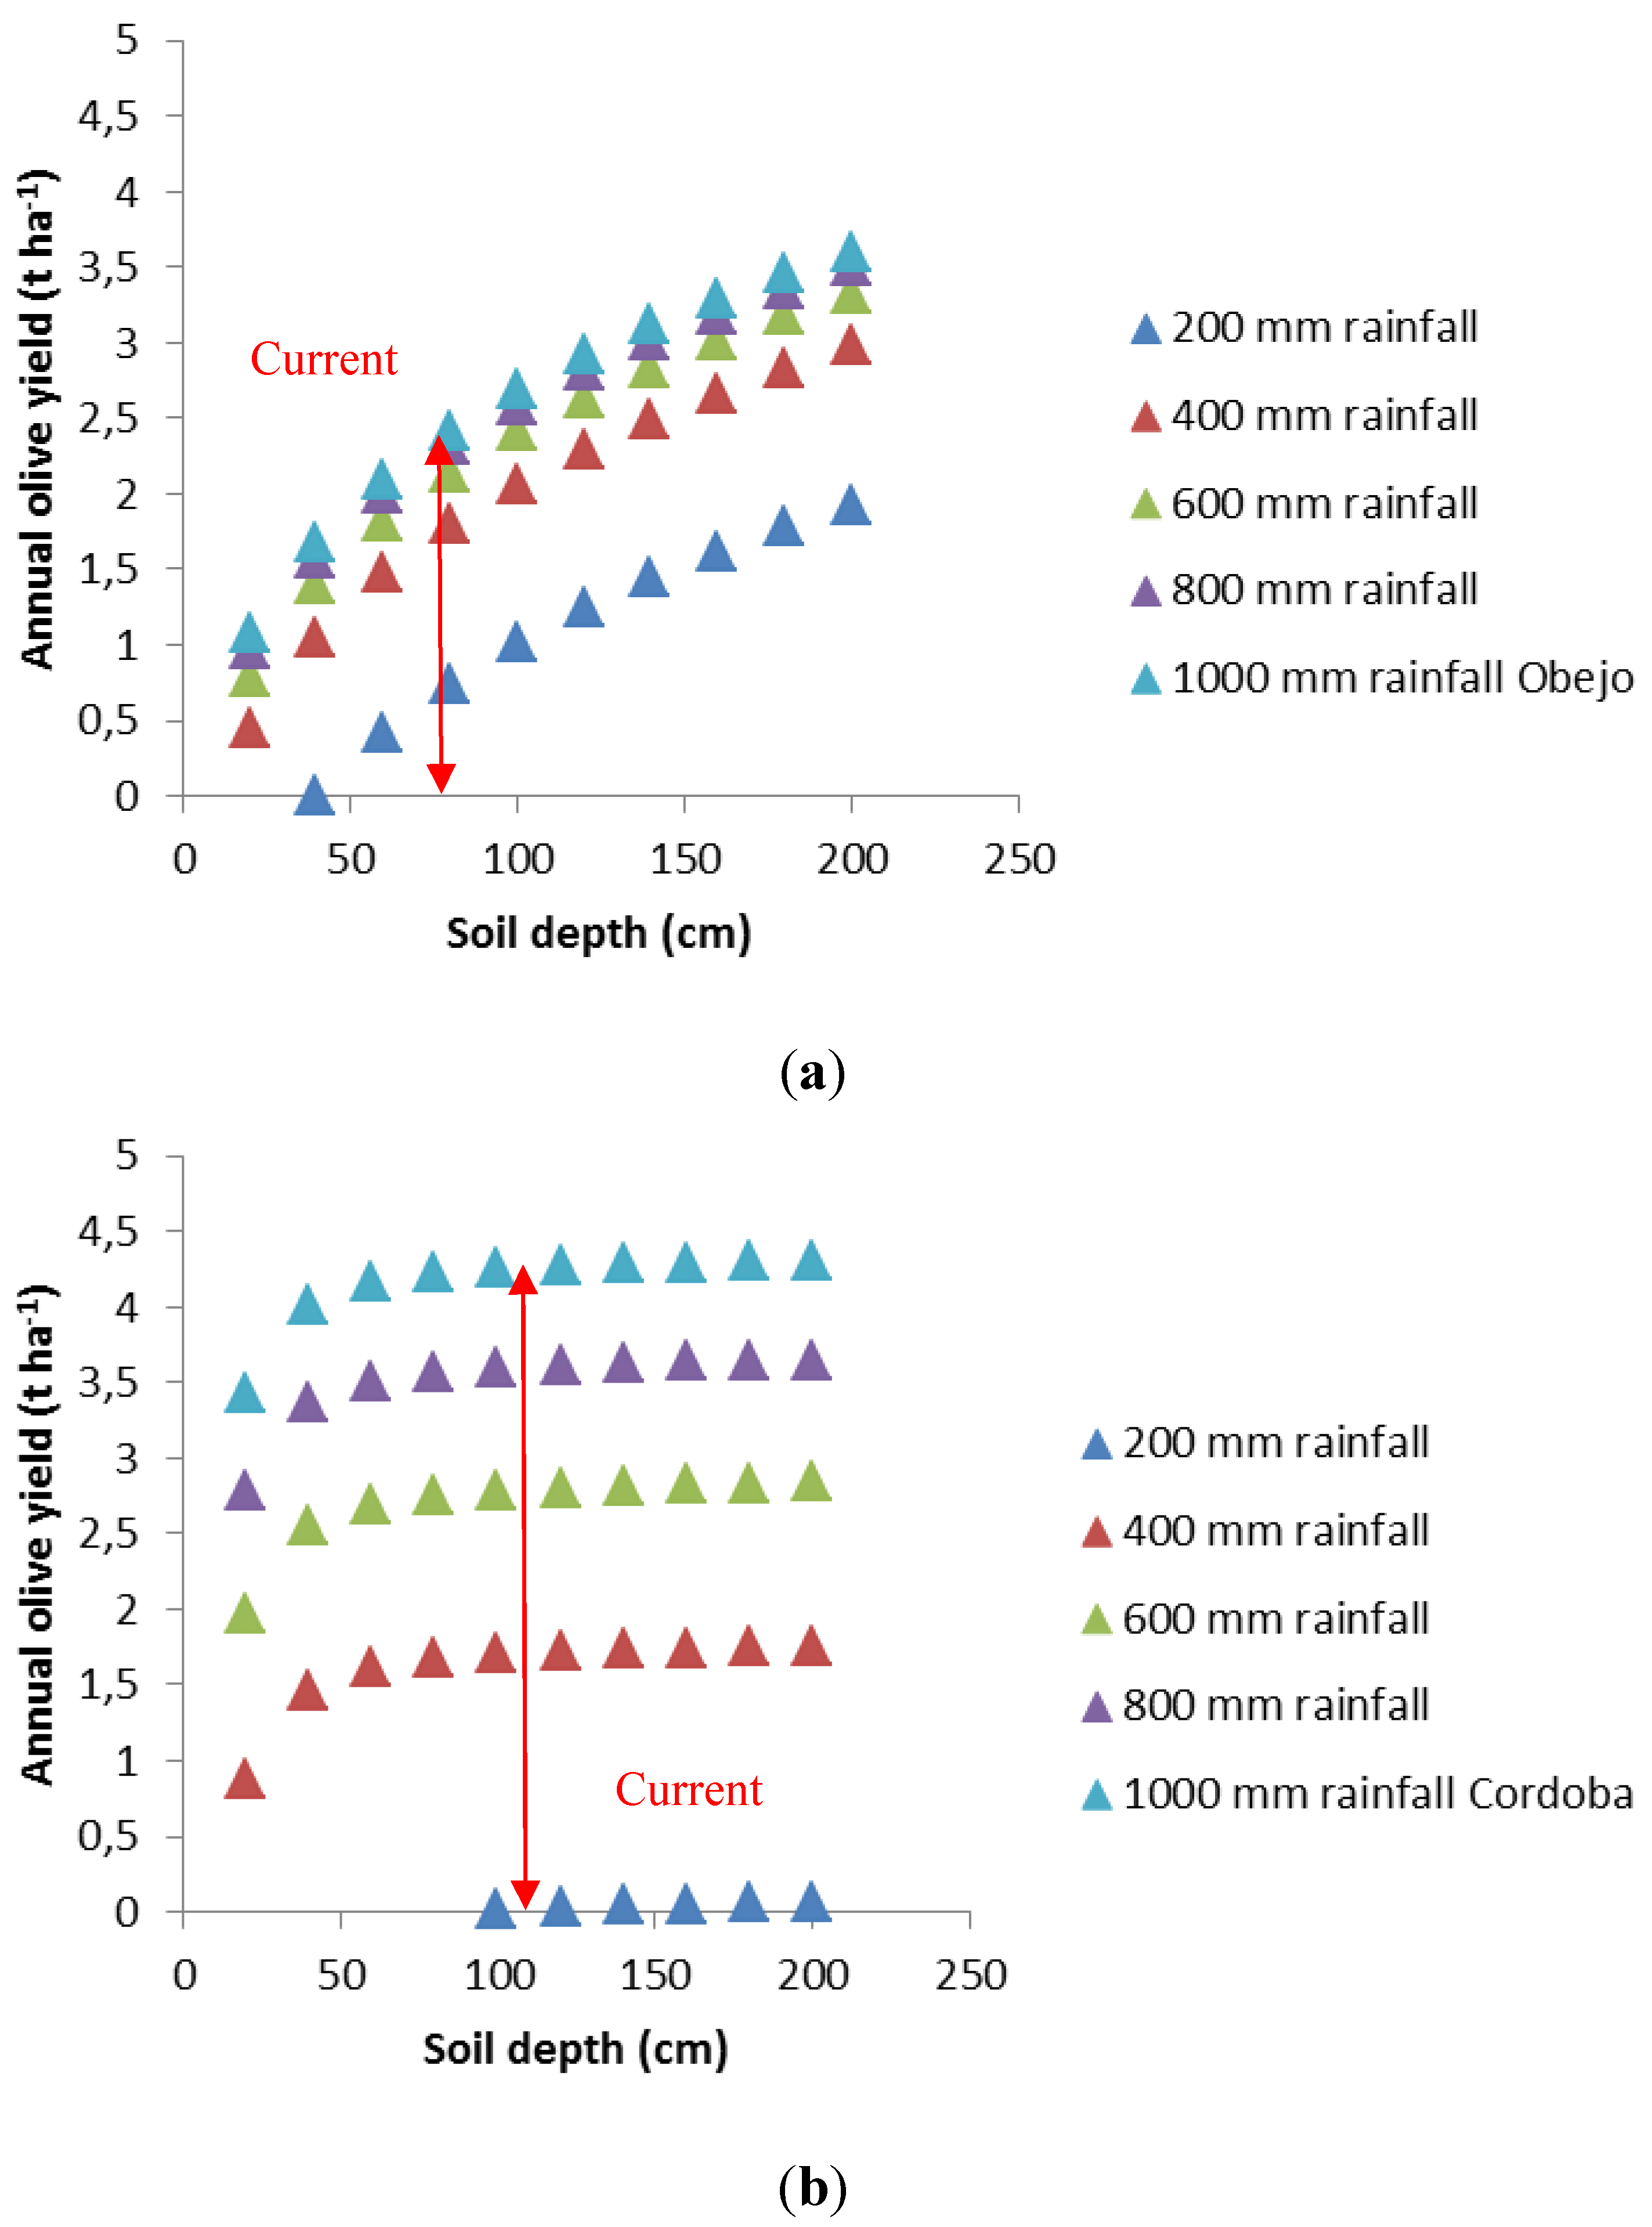
Case study 1, Obejo, is representative of rainfed orchards in very steep areas with shallow soil profiles, coarser textures and high stone content. Case study 2, Cordoba, is representative of olive orchards cultivated in the rolling landscape of the Guadalquivir river valley on deeper soils with finer texture, fewer stones and better water-holding capacity. For each soil depth and case study, 30 years were simulated, the ones corresponding to the 1971–2000 period. The outputs for each simulation were used to generate 3D graphs with soil depth and annual rainfall on the X and Y-axes respectively, and yield (calculated using the expression shown in
Figure 8b) on the Z-axis. These surfaces are represented in
Figure 9. It is apparent from those surfaces that, given the different hydrologic conditions of the orchards, the response of yield to different soil depth and annual rainfall differs, demonstrating different sensitivities to a decrease in soil depth by erosion.
For easier interpretation,
Figure 10 a,b depicts curves corresponding to specific rainfall values of the surfaces shown in
Figure 9. It is apparent that in the orchards represented by the Cordoba scenario case study there is lower yield sensitivity to the decrease of available soil depth, unless these values reach an inflexion point close to 60 cm. We attribute this to the relatively high water holding capacity of the soils simulated in this scenario, which is common in orchards located in the less steep areas of the region. As a result, soil depths of over 60 cm seem to be enough to maintain a water storage capacity for the dry season which is capable of supporting stable yields during most years. The simulations for this typology of olive orchard, based on larger crown canopies for optimum use of the higher water storage capacity of the soil, are extremely sensitive to a reduction of average rainfall values, especially below 400 mm. A contrasting situation occurs for the Obejo case study, which is representative of many traditional olive growing areas in mountainous parts of Andalusia. In the Obejo case, there is a decrease in potential yield productivity due to the reduction of soil depth even when the soil profile is still relatively deep. This rapid response of potential yield to soil depth reduction is a consequence of the low water holding capacity of the soil, which implies that the water front infiltrates deep below the olive root zone into the relatively permeable parent material. Low water holding capacity is a result of a coarser texture and a higher stone content, and can be expected in soils in olive orchards in the mountainous areas of Andalusia. Under the conditions of the Obejo case study, a much deeper soil is required to store most of the infiltrated rainfall for use by the olive tree in the dry season. Simulations predictions show how this kind of olive orchards, which have a relatively small crown canopy and a reduced tree density, have some yield response to low rainfall values, around 200 mm. This low rainfall depth resulted in the collapse of the orchards as simulated by the Cordoba scenario. If we connect the current soil depth in the Obejo case study with the cumulative soil losses in a similar environment such as Montefrío [
22], it is apparent that the orchards have already accumulated a significant loss of potential yield due to losses of soil profile since the time olive cultivation started in the area between the 18th and 19th centuries. It is also interesting to note how the decrease in potential yield in the Obejo case study is gradual, without an apparent collapsing point in which a dramatic decrease in yield might be perceived. On the other hand, for the Cordoba site, the drop in yield once the soil depth falls below 50 cm is much more pronounced, which indicates that, at that depth of soil, there is a significant decrease in water available to the tree.
Table 5.
Summary of simulated conditions with WABOL. Figures of soil depth in black indicates current soil depth. For soil depths above the current one, the θ
Field Capacity was increased by two (0.02) units, and CN numbers decreased by two units to consider better soil quality. For those below the current depth, the θ
Field Capacity was decreased by two (0.02) units and CN numbers increased by two units to consider worsened soil quality conditions. The orchard characteristics were taken from [
49] and [
50].
Table 5.
Summary of simulated conditions with WABOL. Figures of soil depth in black indicates current soil depth. For soil depths above the current one, the θField Capacity was increased by two (0.02) units, and CN numbers decreased by two units to consider better soil quality. For those below the current depth, the θField Capacity was decreased by two (0.02) units and CN numbers increased by two units to consider worsened soil quality conditions. The orchard characteristics were taken from [49] and [50].
| | Soil Depths Simulated (cm) | Textural Class | Stoniness
% | θField Capacity (m3 m−3) | θ Permanent Wilting Point (m3 m−3) | Slope % | Tree Density (Olive ha−1) | Tree Crown Volume (m3) | Plant Leaf Area Density (m2 m−3) | CNI-CNII-CNIII |
|---|
| Obejo | 20, 40, 80, 120, 180 | Sandy-loam | 33 | 0.21 | 0.09 | 30 | 139 | 24 | 1.15 | 65-81-91 |
| Cordoba | 20, 40, 80, 120, 180 | Clay-loam | 3 | 0.40 | 0.20 | 11 | 139 | 31 | 1.45 | 68-84-94 |
Figure 9.
Relationship between potential yield (Z) and annual rainfall and soil depth (X, Y) for the Obejo (a) and Cordoba; (b) case study.
Figure 9.
Relationship between potential yield (Z) and annual rainfall and soil depth (X, Y) for the Obejo (a) and Cordoba; (b) case study.
Figure 10.
Relationship for given annual rainfall between potential yield (Z) and soil depth (X) for the Obejo (a); and Cordoba (b) case study.
Figure 10.
Relationship for given annual rainfall between potential yield (Z) and soil depth (X) for the Obejo (a); and Cordoba (b) case study.
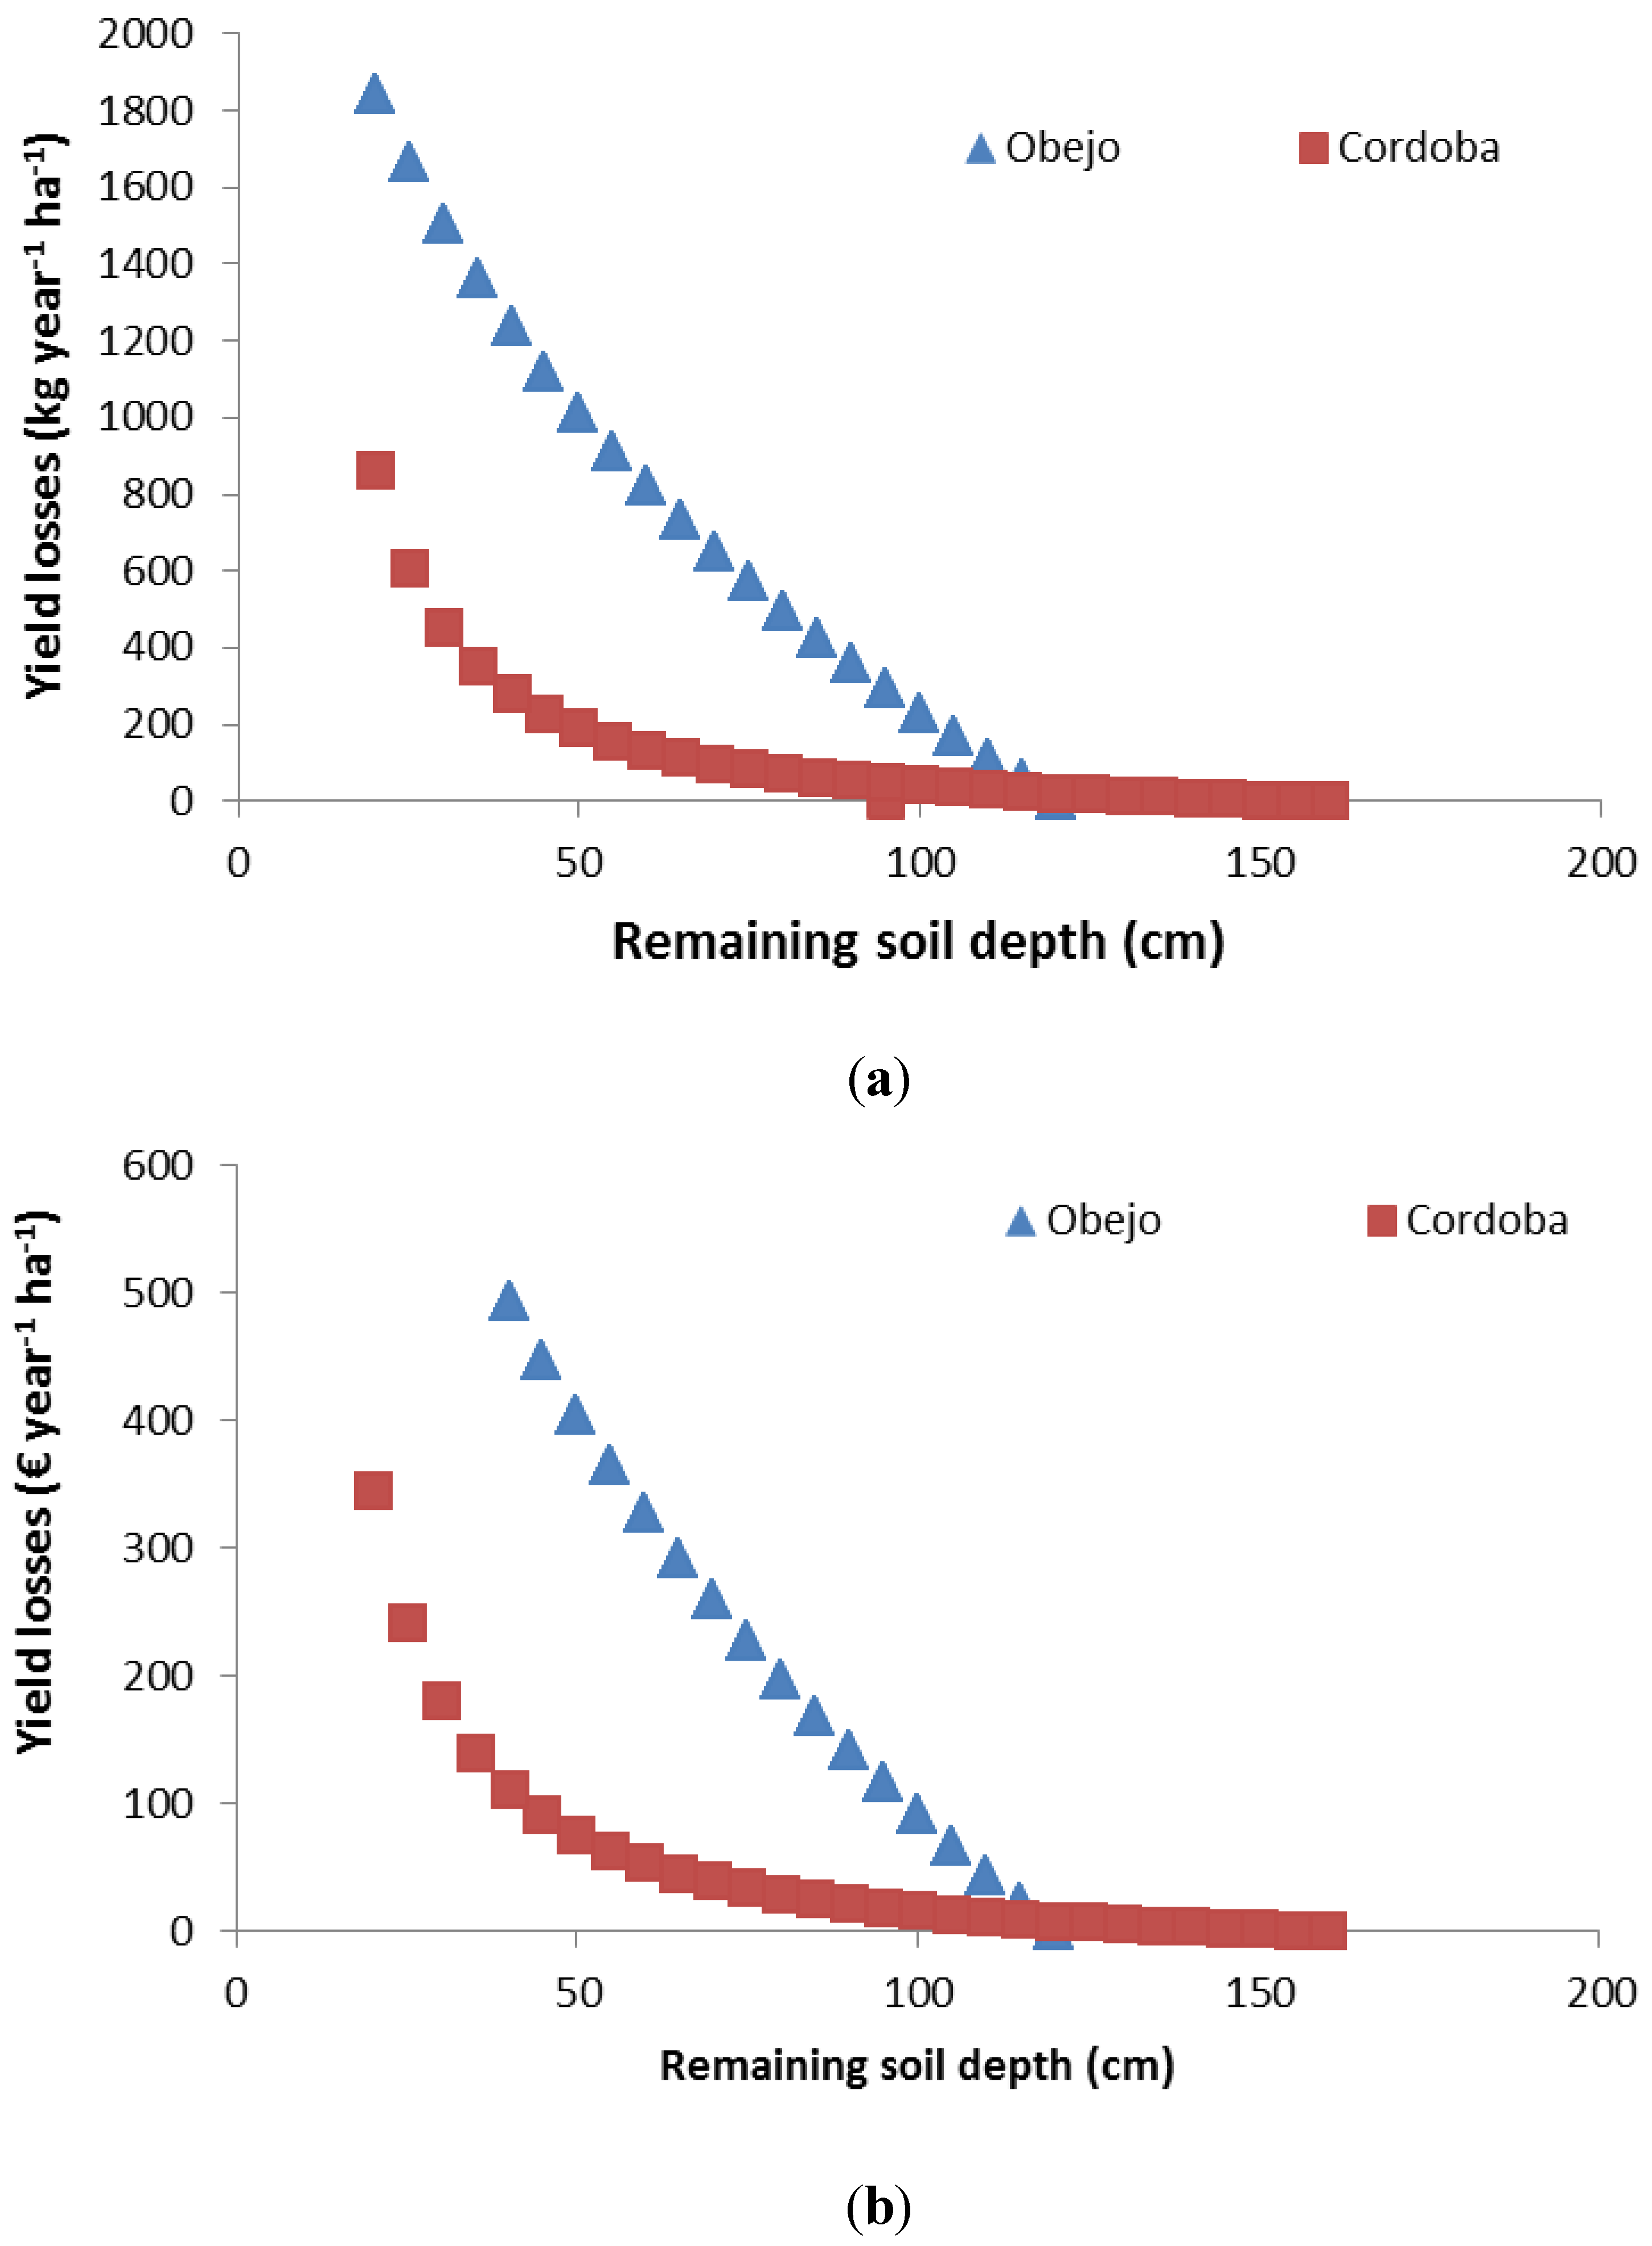
Based on the relationships summarized in
Figure 10a,b, it is possible to convert the cumulative olive yield losses for both examples using current prices (€400 per ton of olives for oil processing), into Euros per hectare.
Figure 11 depicts both relationships. It is apparent how for these examples—which can be representative of two contrasting and common situations in the region—productivity losses by erosion due to the decrease in water availability have already significantly affected the productivity of olive orchards situated in mountainous areas in the regions. The orchards represented by the Obejo case study, which have the lowest productivity rate as well as the highest unit production costs in the region have already suffered from a decrease in productivity due solely to the effect of erosion on soil water storage capacity, as compared to the orchards located in the valley (e.g., the Cordoba case study). Since access to irrigation is not feasible in most sloping areas, continued degradation will only further decrease the potential productivity of the olive trees or any other future land use in these areas (e.g., grazing or forestry uses). It has also diminished its relative competitiveness compared to the olive producing areas in the best conditions, e.g., Cordoba case study.
Figure 11 also provides an approximation to the order of magnitude of economic losses that can be attributed to the decreasing soil depth for both case studies. For the Cordoba example, these losses are, in practical terms, negligible since the current soil depth is still in the non-response plateau. Although other on-site erosion damage, such as reduced accessibility to the fields, are not included in this evaluation, it is an interesting hint that might help to understand the low impact of disseminating soil conservation measures among these farmers. Many of these efforts have highlighted both in documents and technical sessions their impact on the prevention of yield losses, which, as our analysis indicates, can take a long time to have a significant impact in economic terms, even if no agronomic improvements are assumed. The Obejo case study is a contrasting scenario, and there is a significant impact of cumulated loss of soil depth, at an estimated 200 € ha
−1 year
−1. The simulated accumulated soil depth required to achieve that impact, some 40 cm, has been actually documented in a similar area by [
22]. In this area, Montefrío, that loss of 40 cm of soil occurred over a long time span of approximately 200 years as erosion rates, although relevant, were lower than the current ones. This has probably contributed towards dampening the link between reduction of soil depth and productivity. Even at current erosion rates of between 0.5–3 mm year
−1, yearly variations in yield due to decreased productivity can not be perceived. Only by comparing periods with enough time lag, and including model analysis, can we provide indication of this decrease in productivity, isolating the effect of other variables that could mask that relationship (climate, pests and diseases, improvements in management,
etc.)
Current predictions of climate conditions for the next decades in the olive growing areas in Andalusia predict a significant decrease in annual rainfall, as well as an increase in temperature and evapotranspiration (
Table 6). These scenarios will result in an increased pressure on water resources and the need to make optimum use of rainfall water for olive cultivation. For those situated in the mountainous areas in the region, maintaining the current soil depth is critical since it is apparently the only viable alternative to maintaining an already limited productivity. This might require a change in soil management: to provide extensive ground cover during most of the year (Scenarios 3 or 4 in
Figure 5 and
Figure 6). This in turn might have a notable impact on yield but simultaneously have the effect of mitigating the silent decrease in potential yield due to loss of soil water storage capacity, as indicated in
Figure 10. For the orchards located in better soils and less sloping areas, the major impact on potential yield seems to be due to the decrease of rainfall rather than decrease of soil water storage (
Figure 11). This does not mean that there is no need to curb the already high erosion rates in these areas, but that the policy approach should be different in order to have a maximum impact among key stakeholders, especially farmers. One major feature is that the main reason for encouraging soil conservation measures in these areas, represented in a simplified way by the Cordoba case study, should be the limitation of off-site erosion damage (such as offsite contamination or damage to infrastructures). The greater sensitivity of yield to a decrease in rainfall supply as compared to the case of the more mountainous areas,
Figure 9, suggests that these erosion control techniques should be carefully aimed at minimizing the risk for water competition with the tree, due to the to the increase of transpiration by cover crops. For this reason, the selected use of vegetation, such as buffer strips, combined with inert mulches, might provide a compromise between soil conservation and productivity.
Figure 11.
Relationship between cumulative yield (a) economic losses (b) and remaining soil depth for the Obejo and Cordoba scenarios. Zero economic losses correspond to the estimated original soil depth prior cultivation. The arrows in Figure (b) illustrate the different impact on yield and economic return for a similar remaining soil depth.
Current predictions of climate conditions for the next decades in the olive growing areas in Andalusia predict a significant decrease in annual rainfall, as well as an increase in temperature and evapotranspiration (
Table 6). These scenarios will result in an increased pressure on water resources and the need to make optimum use of rainfall water for olive cultivation. For those situated in the mountainous areas in the region, maintaining the current soil depth is critical since it is apparently the only viable alternative to maintaining an already limited productivity. This might require a change in soil management: to provide extensive ground cover during most of the year (Scenarios 3 or 4 in
Figure 5 and
Figure 6). This in turn might have a notable impact on yield but simultaneously have the effect of mitigating the silent decrease in potential yield due to loss of soil water storage capacity, as indicated in
Figure 10. For the orchards located in better soils and less sloping areas, the major impact on potential yield seems to be due to the decrease of rainfall rather than decrease of soil water storage (
Figure 11). This does not mean that there is no need to curb the already high erosion rates in these areas, but that the policy approach should be different in order to have a maximum impact among key stakeholders, especially farmers. One major feature is that the main reason for encouraging soil conservation measures in these areas, represented in a simplified way by the Cordoba case study, should be the limitation of off-site erosion damage (such as offsite contamination or damage to infrastructures). The greater sensitivity of yield to a decrease in rainfall supply as compared to the case of the more mountainous areas,
Figure 9, suggests that these erosion control techniques should be carefully aimed at minimizing the risk for water competition with the tree, due to the to the increase of transpiration by cover crops. For this reason, the selected use of vegetation, such as buffer strips, combined with inert mulches, might provide a compromise between soil conservation and productivity.
Table 6.
Predicted variations in average rainfall, ETo and temperatures from a control period (from 1971 to 2001) compared to a future period (from 2068 to 2098). In brackets, coefficient of variation (0–1). Source [
58].
Table 6.
Predicted variations in average rainfall, ETo and temperatures from a control period (from 1971 to 2001) compared to a future period (from 2068 to 2098). In brackets, coefficient of variation (0–1). Source [58].
| Location | Rainfall (%) | ETo (%) | Tmax (°C) | Tmin (°C) | Tmed (°C) |
|---|
| Archidona | −22.1 (0.2) | 14.5(0.3) | 5.3 (0.38) | 2.3 (0.11) | 3.9 (0.23) |
| Baena | −21.8 (0.2) | 10.8(0.2) | 3.7 (0.20) | 2.1 (0.04) | 3.3 (0.17) |
| Córdoba | −21.0 (0.2) | 9.9(0.2) | 3.6 (0.20) | 2.4 (0.09) | 3.3 (0.18) |
| Mancha Real | −22.0 (0.1) | 15.2(0.4) | 5.4( 0.40) | 2.1 (0.20) | 3.9 (0.24) |
| Average Values | −21.7 | 12.57 | 4.5 | 2.2 | 3.6 |
7. Conclusions
Accelerated soil erosion rates, mostly associated to water erosion are due to a combination of cultivation in sloping areas and to an inappropriate soil management, which has provided limited (or none) ground cover among the olive trees. Although the erosion rates increased with the advent of mechanization of olive cultivation in the early 1960s, our review suggests that they started to be unsustainable since intensification of olive cultivation started in the region during the early 19th century.
Experimental information shows that an appropriate use of cover crops aimed to provide effective ground cover, from fall to early spring, can bring erosion down to tolerable rates, as compared to the effects of bare soil management (CT and NT). Results also indicate an improvement of soil quality when the cover crop soil management is implemented in comparison to CT of NTD.
Erosion model analyses indicate that despite the introduction of cover crop use in the region due to the application of the regulations derived from the EU’s Common Agricultural Policy, its impact in achieving tolerable soil erosion rates is still limited. The establishment of effective ground cover, especially in very steep areas, entails a need for additional investments, or difficulties in terms of management operations. In order to achieve tolerable erosion rates there is the need to incorporate a modulation of the requirements to apply ground cover in sloping areas below the 15% threshold currently used, as well as an increase in the extension covered and the growing season, especially in steeper slopes.
The model analysis of two case studies suggests a contrasting response to the impact of decreasing soil depth on olive yield productivity between the sites located in mountainous areas and those located in the rolling landscape of the valleys. Orchards located in valley areas, with soils with relatively high water retention capacity, can stand a significant reduction in soil depth before presenting a marked reduction in yield. This depth, which our analysis estimates around 60 cm, has not been achieved in many of the orchards in that area. The potential productivity of the orchards located in the mountainous areas on soils of limited water holding capacity showed a decrease in yield for any reduction in the soil depth simulated, which are within the range of the soil depth typical of the region. This contrasting behavior has contributed to widening the gap in productivity between both typologies of olive orchards. The hidden cost of the cumulative productivity lost in the mountainous area has been estimated around 200 € h−1 year−1.
For the more productive orchards, which are the ones located in the valleys, the model analysis also indicates a higher sensitivity to decreasing rainfall as compared to those located in mountainous areas, especially in ranges with low precipitation values (<400 mm). The apparent reason for that is that the current orchard typology in the valleys has been optimized to make the most of infiltrated water. Average annual rainfall values ranging from 400 mm to 500 mm are the expected scenario due to climate change in the region.
The results of this review indicates that more decisive actions should be pursued to curb the high erosion rates in the olive producing areas in the region, with a differentiating motivation and the use of cover crops between the more productive orchards in rolling landscape areas and those located in the mountainous areas.


 ,
, 


