1. Introduction
Crop plants are grown in environments that are subject to constant variation across a day, across a month, across a season, across years, or across decades. In-season environmental variation is inevitable and, from an agricultural perspective, largely considered to be unpredictable. This is, of course, only a generalization since the very existence of agriculture is testimony to the gross reliability of patterns in environmental variation. Spring, summer, fall and winter crops are all well understood. Thus, while broad categories of environmental variation provide the foundation of agriculture, as analysis downscales from year-to-year, season-to-season variation, and within season, the relationship between the environment and the crop becomes increasingly complex.
Some relationships between environment and crop performance are well-understood, but there is a lack of knowledge about the relationships between rain and crop performance on a regional level, particularly in relation to specific crop species.
In many agricultural regions, water is the major abiotic limiter of crop yields, followed perhaps by temperature. The fact that the interaction between the temperature of the plant and that of the air is dependent on the water status of the crop, makes it difficult to separate temperature effects from water effects in the field. Irrigation provides a means for managing the water status of a crop over the growing season, and can, if applied in the right amounts at the right time, offset many of the negative effects of rainfall variability. In regions where rain is generally sufficient to meet the demands of the crop, irrigation is often described as supplemental, with differences between irrigated and non-irrigated production affected by the amount and timing of irrigation over the season.
For under-irrigated cropping in semi-arid and arid regions where in-season rain is significantly less than the water need of the crop, the effects of the amount and timing of irrigation events becomes more complex, though largely manageable. When the water volumes available for irrigation are insufficient to meet the needs of the crop, supplemental irrigation management is greatly affected by the amount and timing of rain events.
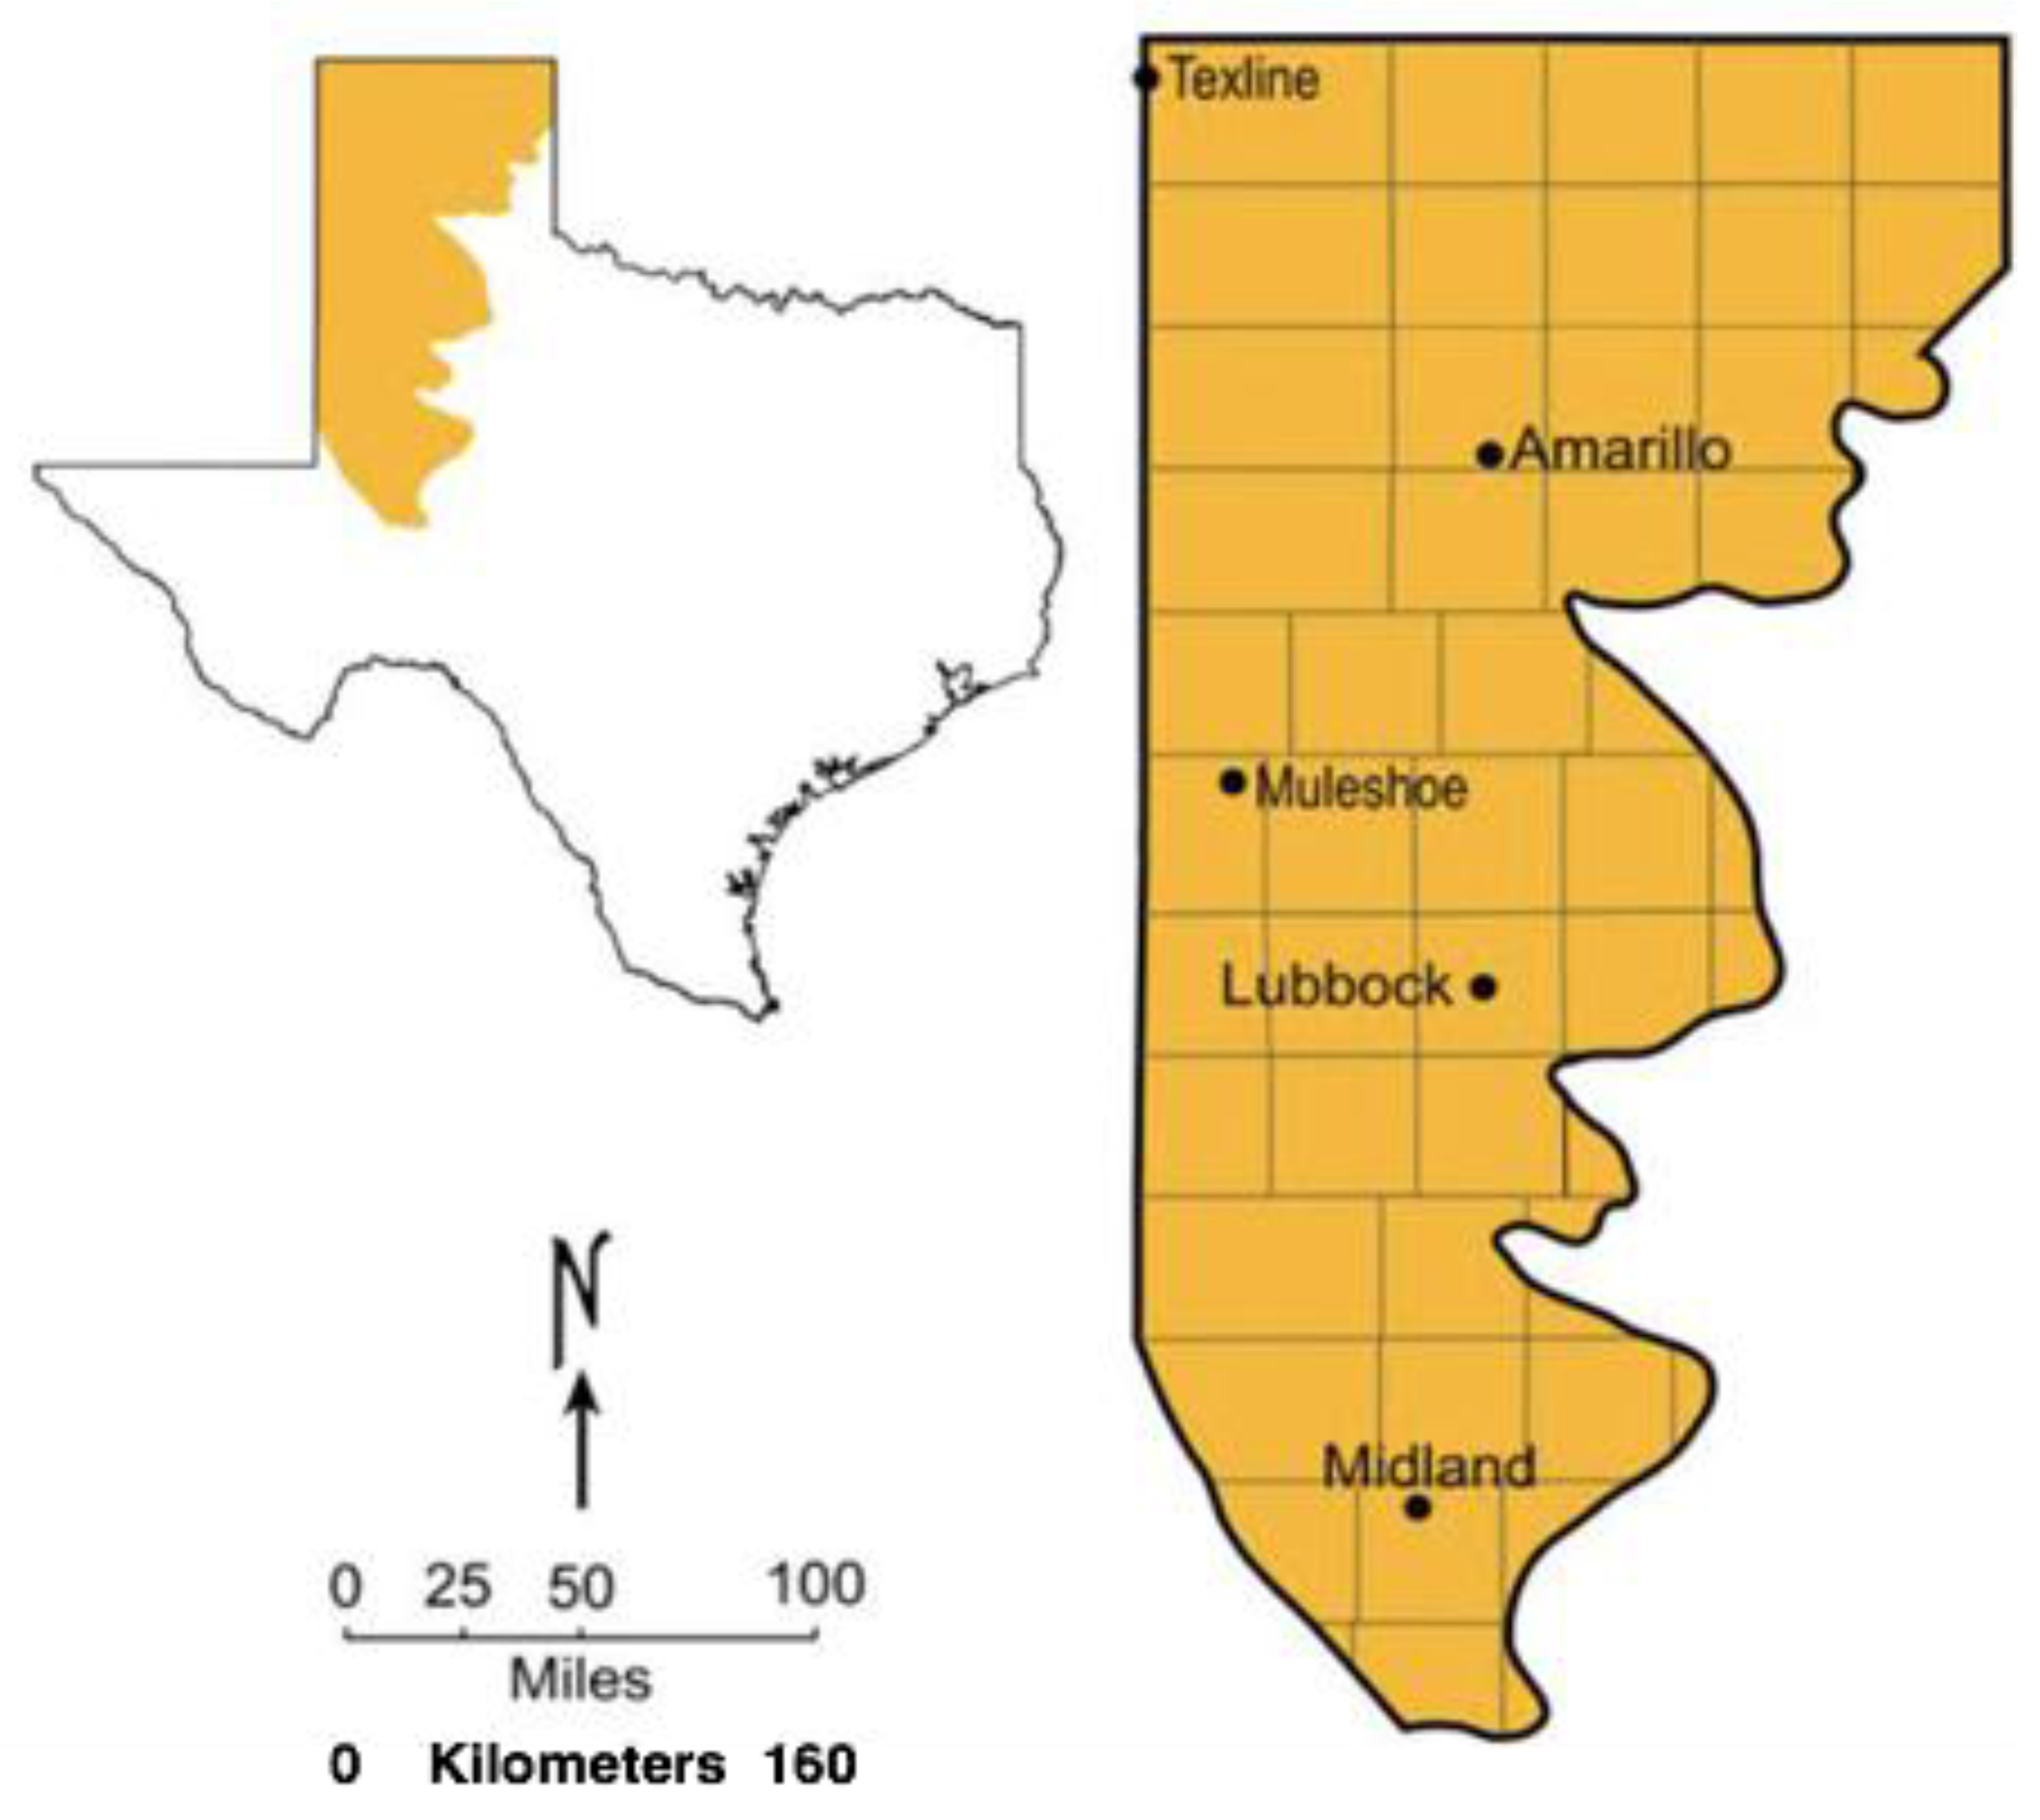
For rainfed cotton production in a semi-arid region like the Southern High Plains of Texas (
Figure 1), where water deficits of various intensity and duration are common, the producer has a limited number of options relating to the plant-water relations of the crop. Management options available to the rainfed cotton producer include: germplasm selection, planting date, planting geometry (row configurations and plant populations), and chemical applications (nutrients, herbicides, growth regulators). With the exception of in-season chemical applications, the available management options are determined at the time of planting, and management interventions are essentially moot.
The effect of the above mentioned management decisions on cotton yield will be mostly dependent on the environment during the crop period. Environmental conditions that will affect crop water status include; soil moisture at planting, the amount and timing of rain events, air temperature, radiation, and humidity. Among environmental conditions, it is expected that the amount and pattern of rain during the crop period will be the major determiner of yield with soil moisture at planting, radiation, air temperature, and humidity of importance, though less so than rain. Within a given season with a given set of environmental conditions, the effects of factors like germplasm, planting date, planting geometry, and chemical applications are most likely influenced by the amounts and timing of rain during the crop season.
Rain is simply a meteorological event, and any connection between rain and plant performance is a function of the amount of rain that ultimately passes through the plant as transpiration. The terms “effective rain” and “ineffective rain” are often useful in agricultural systems to define the contribution of rain to crop production. Water that runs off the soil surface or that drains below the rooting zone, i.e. ineffective rain, would not be expected to contribute to crop yield. The effect of evaporation of rain from the soil surface on yield, while perhaps not well understood, is most probably minimal.
The effect of rain on a crop is clearly a function of the ongoing interactions between the amount, intensity, and timing of rain. With regard to a rainfed agricultural production system, the effects of rain are appropriately analyzed in terms of the effect of the rain on the crop. Such an “agro-centric rain” analysis would seek to understand the amounts and timing of rain events with respect to the water needs of the crop, as determined by its growth and development within a defined management system. An agro-centric rain analysis, carried out for a given region over a series of years might provide insight into the types of crop management systems that will allow producers to optimize the crop production within a given environment [
1,
2].
Cotton production in much of the world is carried out in the interval between lethal low temperatures between the spring and fall. In many cotton growing regions, the length of the frost-free season ultimately constrains the length of the growing season. For a given region, the “typical” planting date is an empirically derived date that is based upon the history of a crop within that region. The planting date for a cotton crop is ultimately determined not only by the environment, but also includes a number of non-environmental considerations that can include: variety, harvest constraints, insurance programs and production constraints. Thus, the typical planting date, and thereby the cropping season, for a cotton crop in a region does not necessarily reflect the environmental optimum for the crop. It is possible that, simply in terms of the ability to grow a crop in a region, other planting dates may be equally acceptable, or even preferable from a physiological point of view.
The effect of planting date on various aspects of cotton production has been the subject of numerous studies [
3,
4,
5,
6,
7]. Generally, such studies have focused on the effects of planting date on yield and quality in terms of temperature and management issues and seldom in terms of rain patterns.
From an historical perspective, cotton can be successfully grown on the Southern High Plains of Texas within a 238-day “cotton growing season” (CGS) between DOY 90 and DOY 328 (early April through late November). This cotton growing season is generally bound by the last freeze at its beginning, and the first freeze at its end. Given that a rainfed cotton crop in the region requires at least 154 days to produce an economic yield, it is probable that a cotton crop planted anytime between DOY 90 and DOY 174 (allowing 154 days for growth) will be productive. Thus, within the 238-day cotton growing season for a given year, there are a number of 154-day “potential cotton crop seasons” (PCCS) that could be capable of producing a crop.
The goal in this study was to investigate the cotton growing season on the Southern High Plains of Texas at Lubbock, TX, USA, in terms of the crop water environment associated with various potential cotton crop seasons across the 10-year period from 2006 to 2015. Rain over this 10-year interval was variable, and included years with record low (2011, 144 mm) and record high (2015, 637 mm) rain totals. The goal of this analysis is to understand the positive and negative outcomes associated with one potential cotton crop season versus another. Relevant questions include: (1) Is there a more favorable rain environment associated with of a given potential cotton crop season relative to another? (2) What is the potential advantage of shifting low temperatures to the beginning of a crop season compared to having them occur later in the season? (3) Is there a variety more suited to one potential cotton crop season compared to another? (4) Are there management limitations associated with some potential cotton crop season that are not limiting for others?
The hypothesis of this study is that the growth and development of a cotton crop in the region will be enhanced under some potential cotton crop seasons and limited in others. While the ultimate goal of this project is to identify potential cotton crop seasons that are associated with enhanced cotton productivity, this initial study is focused on the use of rain and weather data to develop and characterize the range of crop water environments possible over a 10-year interval in a cotton-growing region around Lubbock, TX, USA.
2. Materials and Methods
The procedure utilized in this project can be broadly outlined as:
Assembly of a multiyear dataset of rain and other environmental data.
Definition of potential cotton crop seasons.
Calculation of estimates of crop water environments in terms of reference evapotranspiration (ETo) and crop evapotranspiration (ETc).
Production of daily patterns of rain and crop water use over potential cotton crop seasons.
Comparing and contrasting crop water environments among the potential cotton crop seasons over years to identify crop limitations and advantages associated with various potential cotton crop seasons.
2.1. Definition of the Rainfed Cotton Crop Season for Cotton in the Region
Based on 10 years of observations at the study site and decades of producer observations of rainfed cotton on the Southern High Plains of Texas, cotton can be expected to reach maturity in less than 154 days. Over several years of observation, cotton has been planted and harvested from cotton plots that were planted in Lubbock, TX, USA as early as DOY 90, and as late as DOY 174. The earliest planting date, DOY 90, roughly coincides with the historic date of the last lethal freeze, and the latest planting date, DOY 174, provides a 154-day period for the crop to reach maturity before the first lethal freeze in the fall.
For the region, there is a reasonable expectation of harvestable yield for a cotton crop that is planted at any time within the 84-day interval between early April (DOY 90) and late June (DOY 174). For cotton planted on the last planting date of DOY 174, the 154-day period needed to reach maturity would be complete by DOY 328. Thus the 238-day period from DOY 90, the earliest planting date, to DOY 324, the last maturity date, represents the seasonal interval for cotton production in the region. This 84-day interval between DOY 90, the first planting date, and DOY 174, the last planting date, represents a planting interval over which rained cotton could be expected to reach maturity by the season’s end.
Thus, for rainfed cotton grown within a 238-day cotton crop season and a 154-day period to reach maturity, planting dates could vary over an 84-day period and still provide the time required for the crop to reach maturity. This is the environmental window for cotton production within which germplasm selection, and management options can be assessed for optimality.
Within the 238-day cotton crop season, seven potential cotton crop periods were defined based on sequential plantings on a 2-week interval, with a 154-day crop season for each planting. The resulting seven potential cotton crops would experience varying patterns of rain and weather within a calendar year. This 238-day cotton growing season, while based on limited empirical data (e.g., 154 days required to reach maturity) is used only for analyses. Year to year weather variation would no doubt raise the possibility of complete crop failure, which is not taken into account in this analysis.
2.2. The Agro-Centric Rain Patterns
Based on the above analysis we have analyzed the crop water environment of rainfed cotton in Lubbock, TX, USA over the 10-year period from 2006 to 2015. In each year, seven 154-day potential cotton crop seasons were defined resulting in a total of 70 potential cotton crop seasons in the study.
Seven potential cotton crop seasons (PCCS) were defined for cotton in Lubbock, TX based on planting dates on a 14-day interval. The potential cotton crop seasons, defined in terms of DOY, are: (#1) 90–244, (#2) 104–258, (#3) 118–272, (#4) 132–286, (#5) 146–300, (#6)160–314, (#7) 174–328. Relative to a typical cotton planting date for the region of May 15 (DOY 132), the plantings roughly indicate: DOY 90 = very early, DOY 104 = early, DOY 118 = early normal, DOY 132 = normal, DOY 146 = late normal, DOY160 = late, and DOY 174 = very late.
A dataset of historic weather data was assembled for the 10-year period from 2006 to 2015 was assembled and subdivided to represent weather for each of the seven potential cotton crop seasons. Weather data was collected at the USDA/ARS Plant Stress and Water Conservation meteorological tower at Lubbock, TX, USA. (
https://www.lbk.ars.usda.gov/WEWC/weather-pswc-data.aspx.html 33 35 38.04 N 101 54 03.52 W). In addition to the measured weather parameters (i.e., rain, humidity, windspeed, solar radiation, and air temperature), ETo, and ETc were calculated by the American Society of Civil Engineers, ASCE method [
8] using the ASCE Penman-Monteith (ASCE-PM)) method of ASCE Manual 70 as the basis of the standardized reference ET equation.
The cotton crop coefficient (Kc) for the analysis was calculated based on the values presented by Howell et al [
9] using daily growing degree days (GGD) for the calculation of the values over the season. A 15.5 °C base temperature was used to calculate GGD with no upper temperature limit included. The data was collected and values were calculated on a 5-min time interval.
Data analysis was accomplished using R, R Foundation for Statistical Computing, Vienna, Austria [
10,
11]. Datasets were constructed from annual weather files using R.
The weather dataset resulted in 154 days with 288 measurements per day at a 5-min interval, for a total of 4400 values per variable for each planting date and year combination. For seven planting dates per year over 10 years, this resulted in approximately 1 × 10⁶ values per variable. Considering the seven variables included in the crop water environment calculations; air temperature, humidity, solar radiation, windspeed, ETo, and ETc, the analysis included approximately 7 × 10⁶ values.
2.3. Rain Inclusion and Exclusion
All rain events within each crop interval were included in the analysis. Rain prior to the planting date can affect the subsequent crop water environment by providing soil moisture in excess of that which falls after planting. Pre-season rain has not been included in any of the analyses, and the initial moisture status of the crop system has been set to zero for each period. Though the contribution of end of the season rain events to the growth and development of a cotton crop is not straightforward, all rain events in the study interval have been included. While there is, no doubt, an amount of rain that is too small to have any appreciable effect on the crop, in this analysis we have not excluded any rain events from the analysis. Inclusion of ineffective rain would lead to the underestimation of crop stress.
3. Results
3.1. Three Levels of Data Analysis
The environment over the 10-year period of the study was analyzed in terms of three time periods; (1) the 365-day calendar year; (2) the 238-day cotton growing season (CGS); (3) a total of seventy 154-day potential cotton crop seasons (PCCS). The 365-day year represents the entire environment available for agricultural production in each year. In some locations, much of the season is available for cropping, while in others cropping opportunities are limited to a fraction of the year. The 238-day cotton growing season represents the portion of the year between spring and fall lethal low temperatures, during which cotton could be grown. In this analysis, the cotton growing season was defined as the 238-day period between DOY 90 and DOY 328. Since a rainfed cotton crop in Lubbock TX can be produced in 154 days, the 238-day CGS for a year can be divided into seven 154-day potential cotton crop seasons based on plantings on a 2-week interval between DOY 90 to DOY 174. In the following sections the rain and weather measurements for each year were used to characterize the crop water environment for 10 calendar years, 10 cotton growing seasons, and 70 potential cotton crop seasons.
3.2. Analysis of Rain
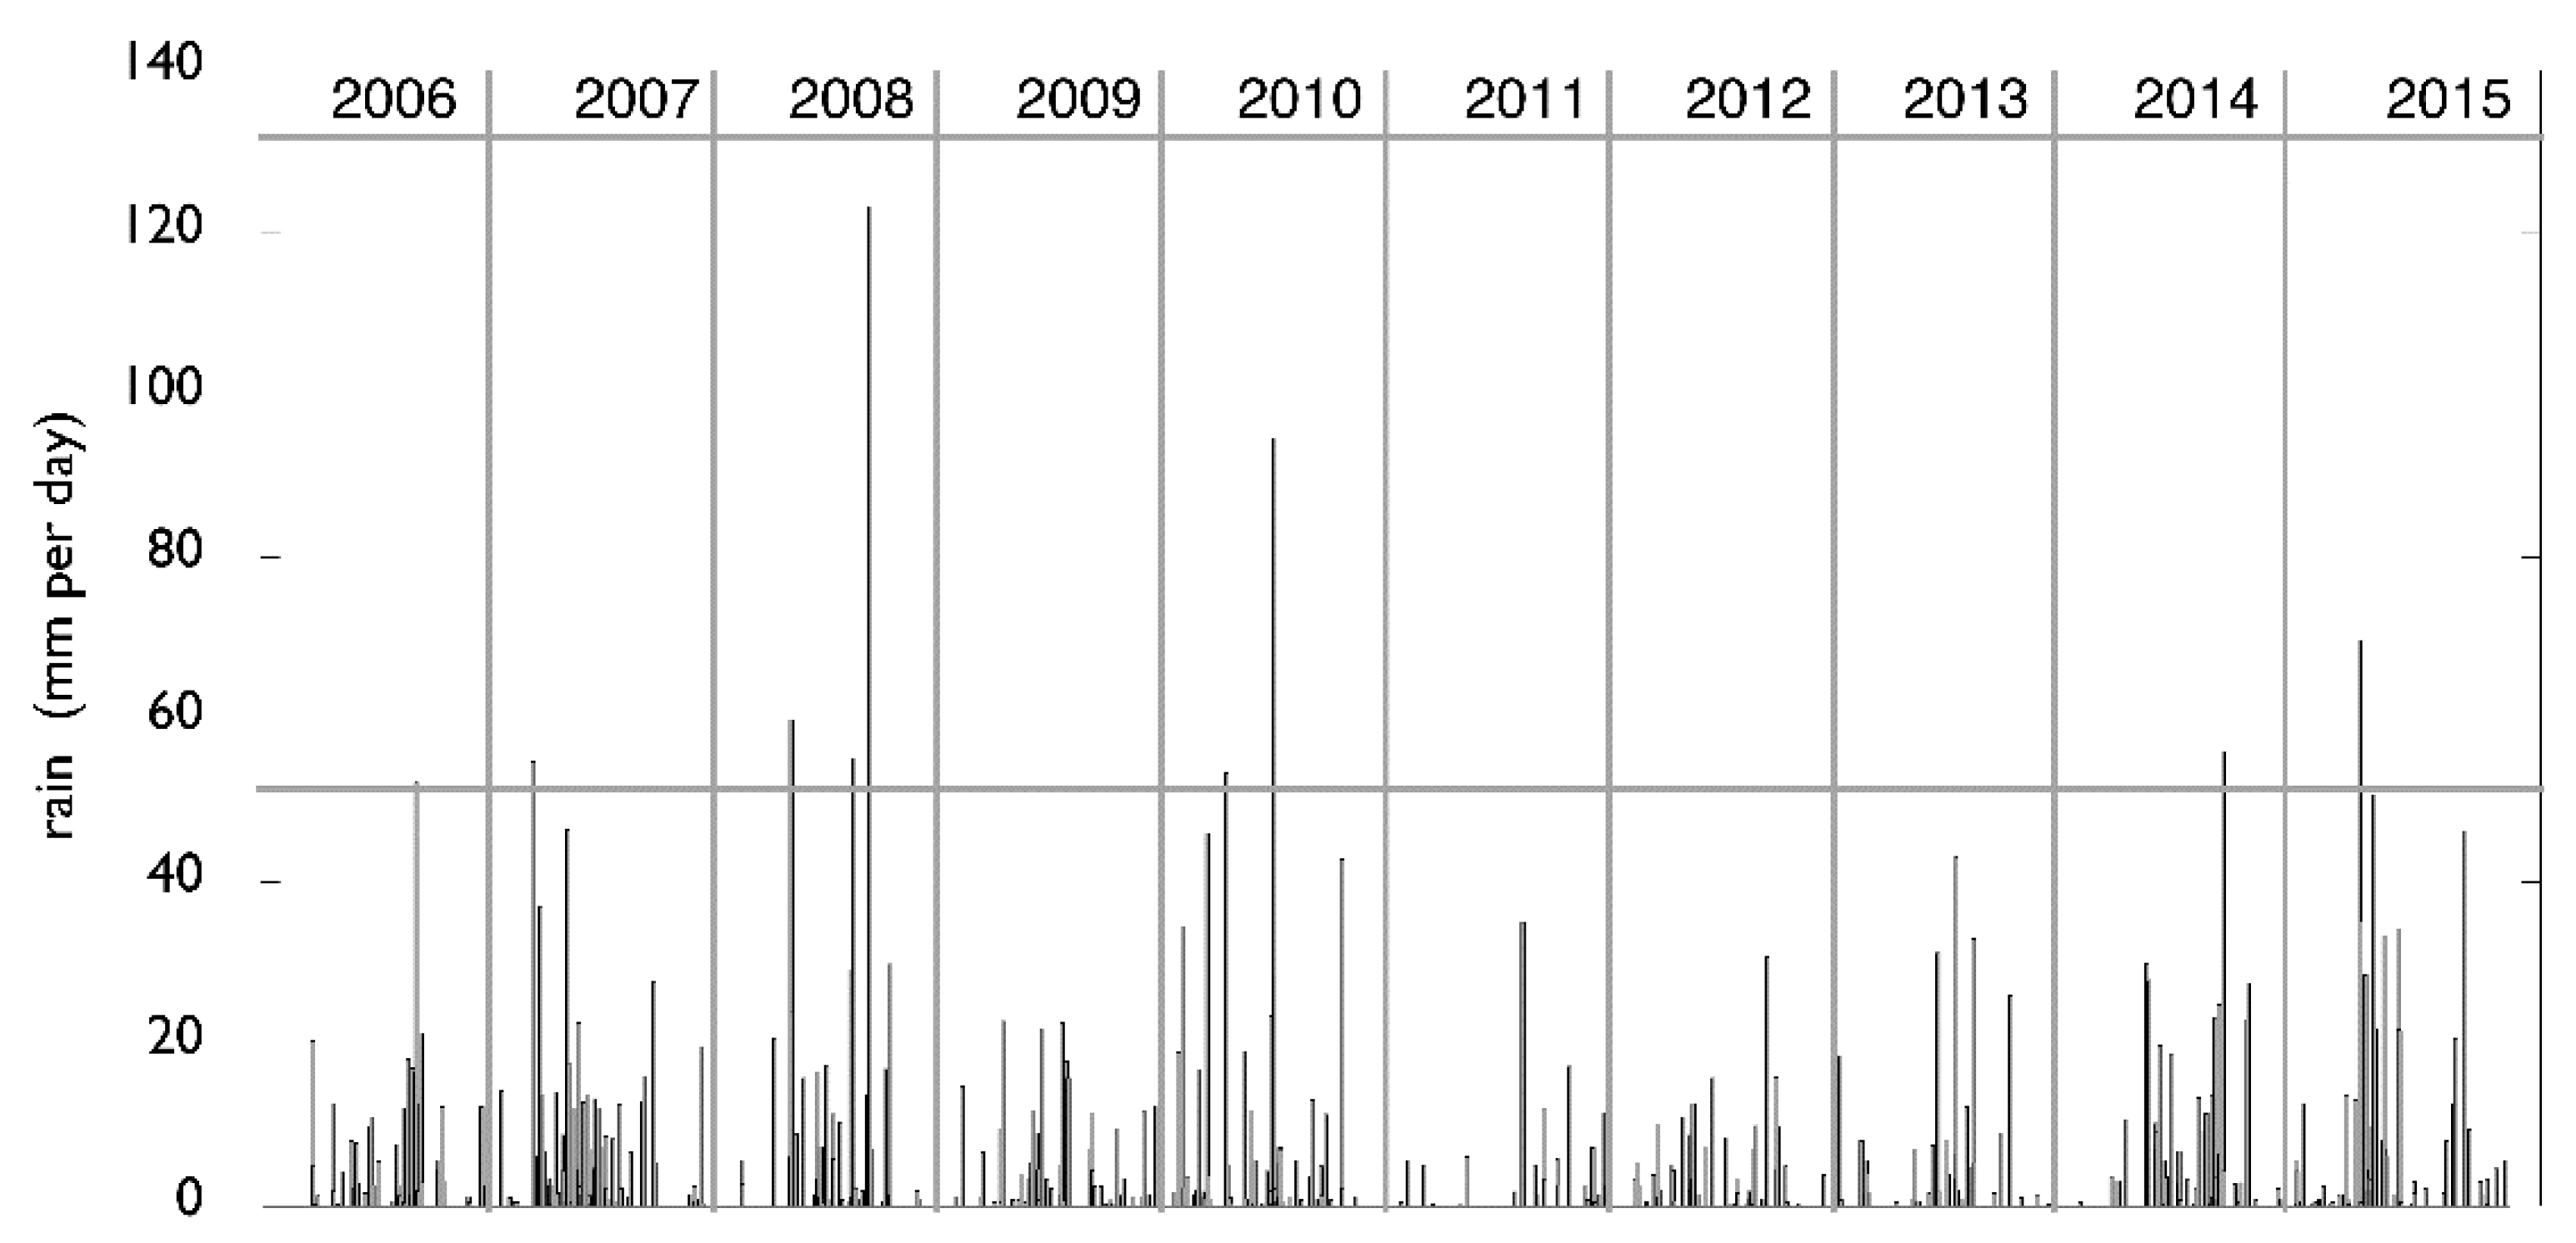
The starting point for the analysis was the rain history of the location over the 10-year study period. Rain amounts were measured on 5-min intervals (288 observations per day) over 365 days for each of the 10 years, resulting in ~1 million values. While 5-min temporal resolution might be of value in understanding rain intensity, for this study, rain values were reduced to daily totals of rain. The pattern of daily rain totals over the 10 years of the study are shown in
Figure 2. The driest year 2011 (144 mm) was evident, while 2015 the wettest year 2015 (637 mm) was less prominent. The pattern of rain was complex. Some years (2006, 2009, 2011–2013) had no daily rain totals greater than 50 mm. Daily rain totals greater than 50 mm occurred in 2007, 2008, 2010, 2014, and 2015.
Total annual rain for each of the 10 years is shown in
Figure 3. This annual rain total is most often associated with a cropping region and it is the crudest representation of the water environment for a crop. The rain total is commonly expressed as, “We get 600 mm of rain a year”.
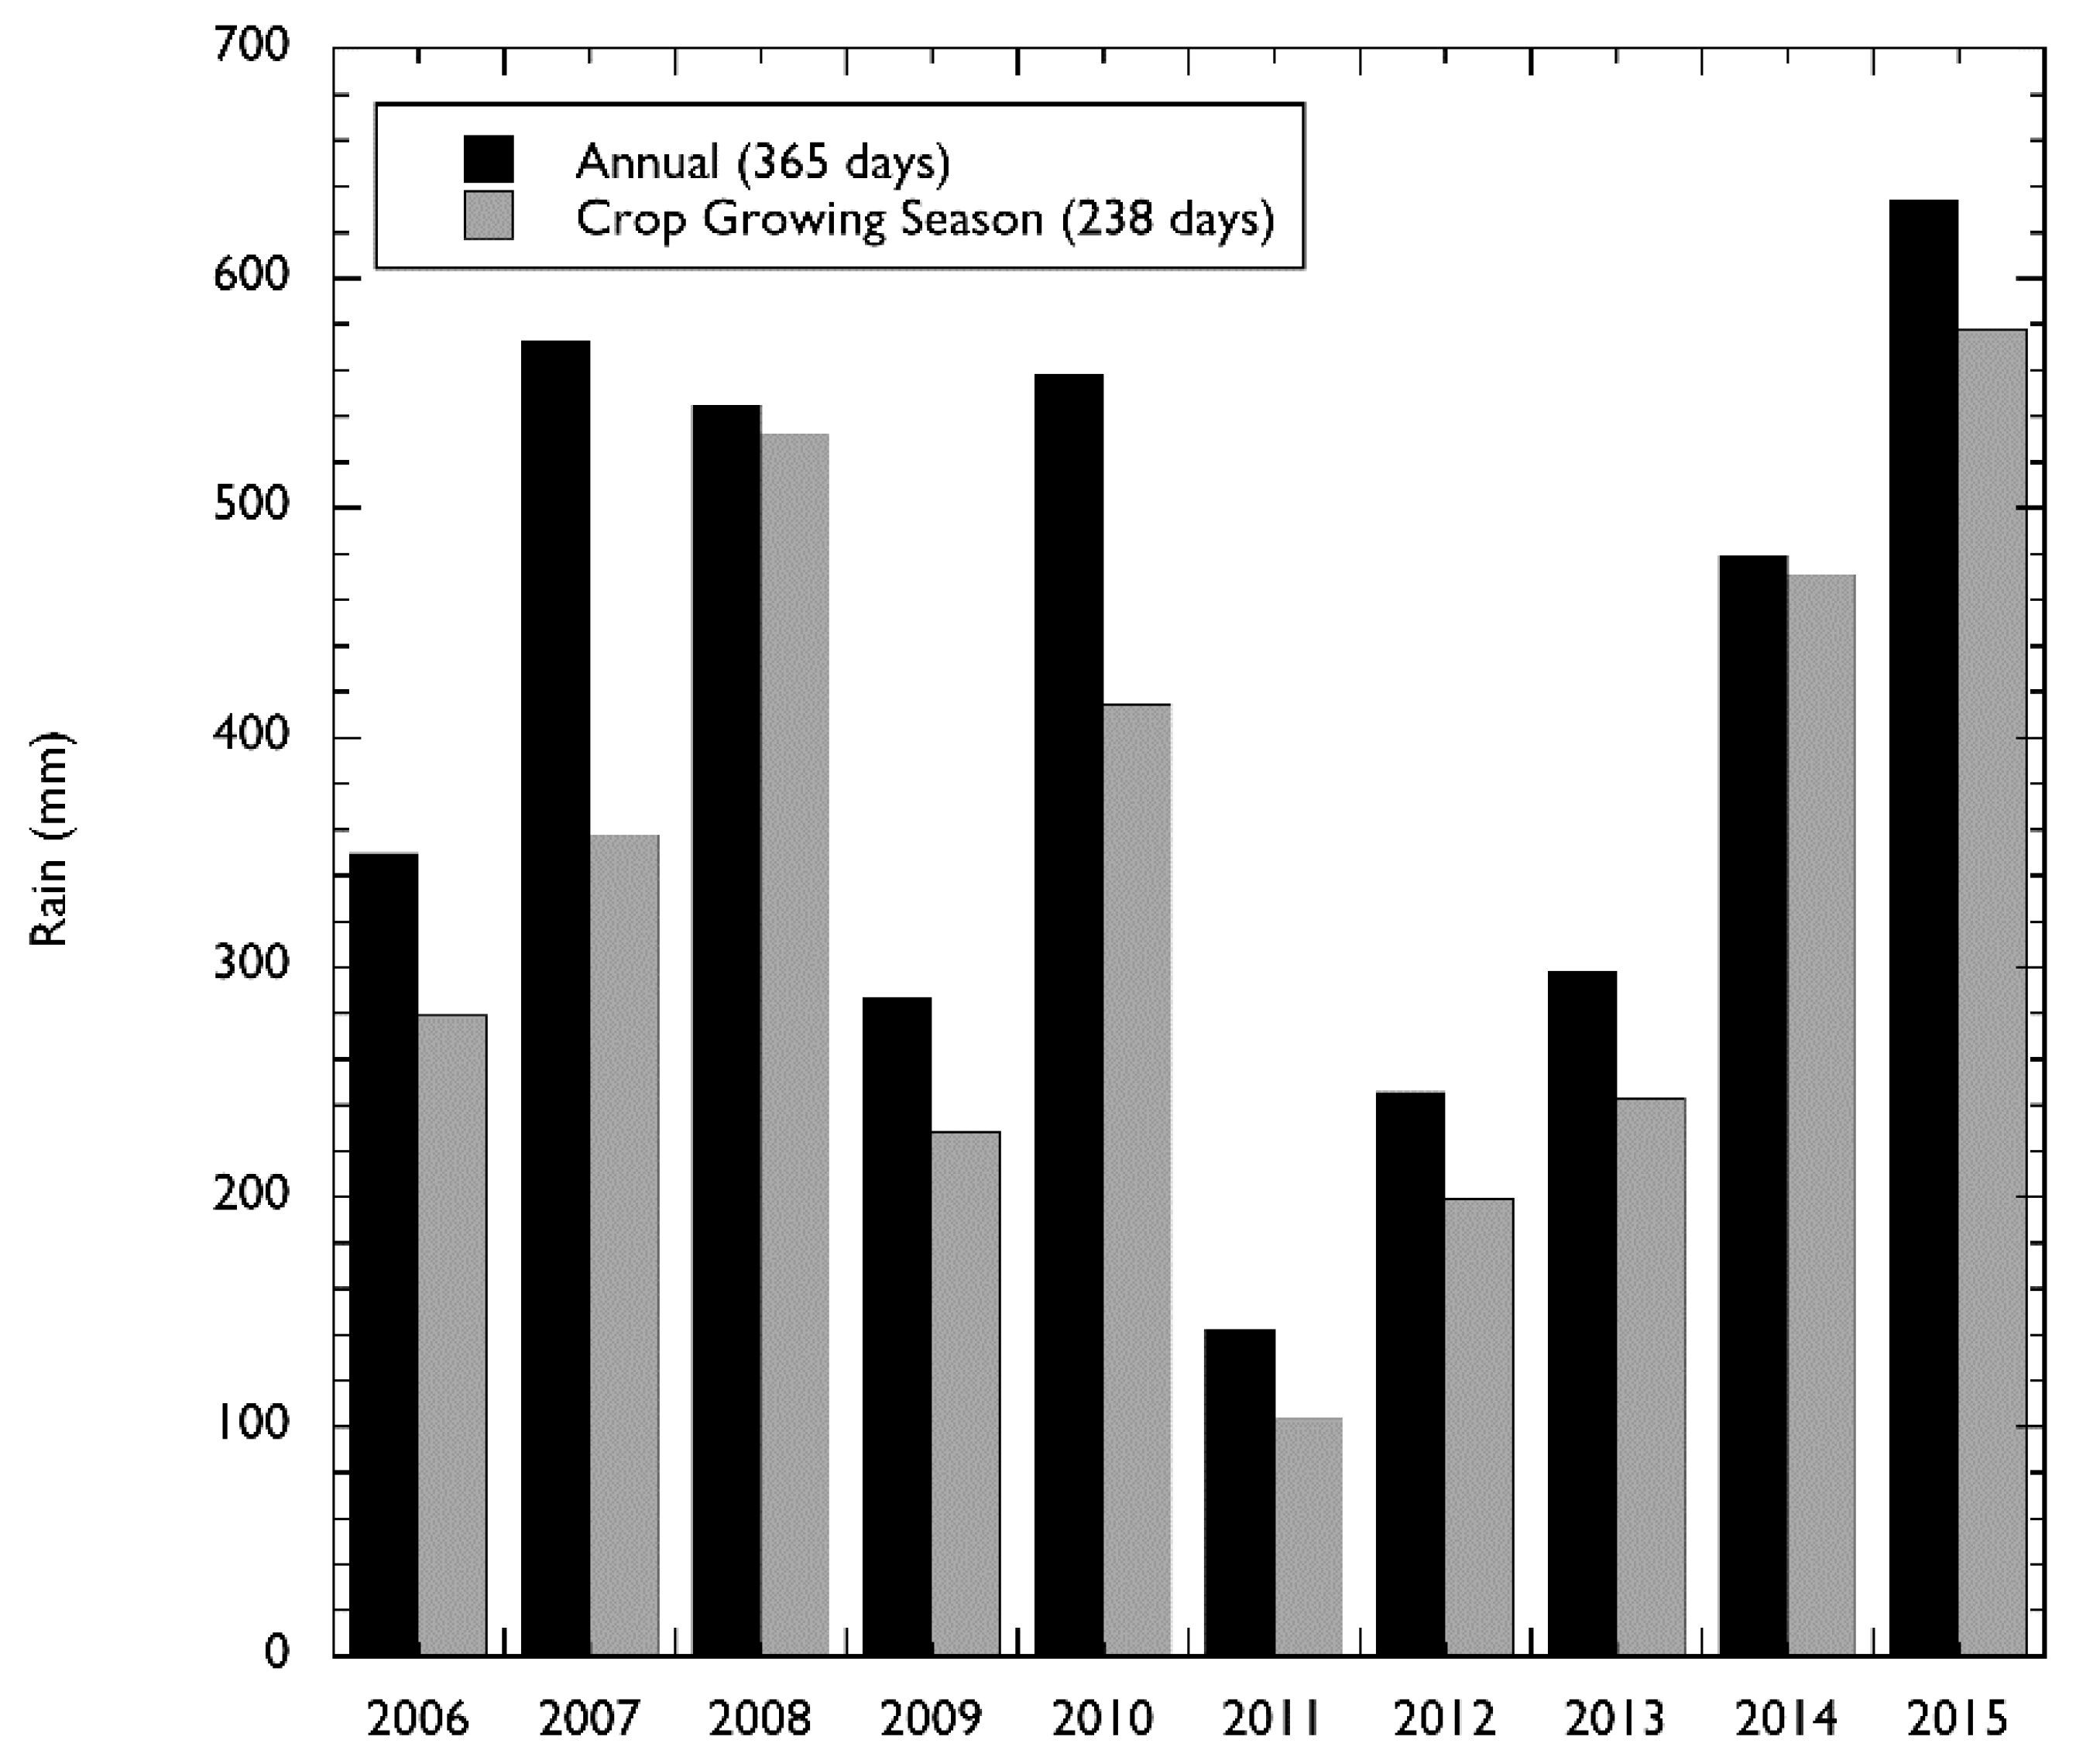
The growing season represents the 238-day period of the year within which a cotton crop would typically be grown in the region and it is the rain pattern during this period that should be most closely associated with crop performance. Total rain during the cotton growing season for each of the 10 years (grey bars) is shown in
Figure 4 in comparison with the annual rain totals (black bars). Often stated as, “We get 600 mm of rain a year with 400 mm in the growing season”. The amount of the annual rain total that was received during the cotton growing season varied across the years, with a minimum difference of 8 mm in 2014 and a maximum difference of 214 mm in 2007. The total rain during the cotton growing season was correlated with the total annual rain, with a
R2 of 0.85. The difference between the annual and cotton growing season rain totals represents the amount of rain that is not directly associated with the crop. The soil moisture status at planting, while important, has not been not included in this analysis for the sake of brevity. It can of course, be included in future analyses.
In order to assess the effect of management, in terms of variation in planting date, the 238-day CGS for each year was divided into seven 154-day potential cotton crop seasons. Since this analysis resulted in 10,780 daily rain values, the data was reduced to totals for each of the 154-day PCCS in the following section.
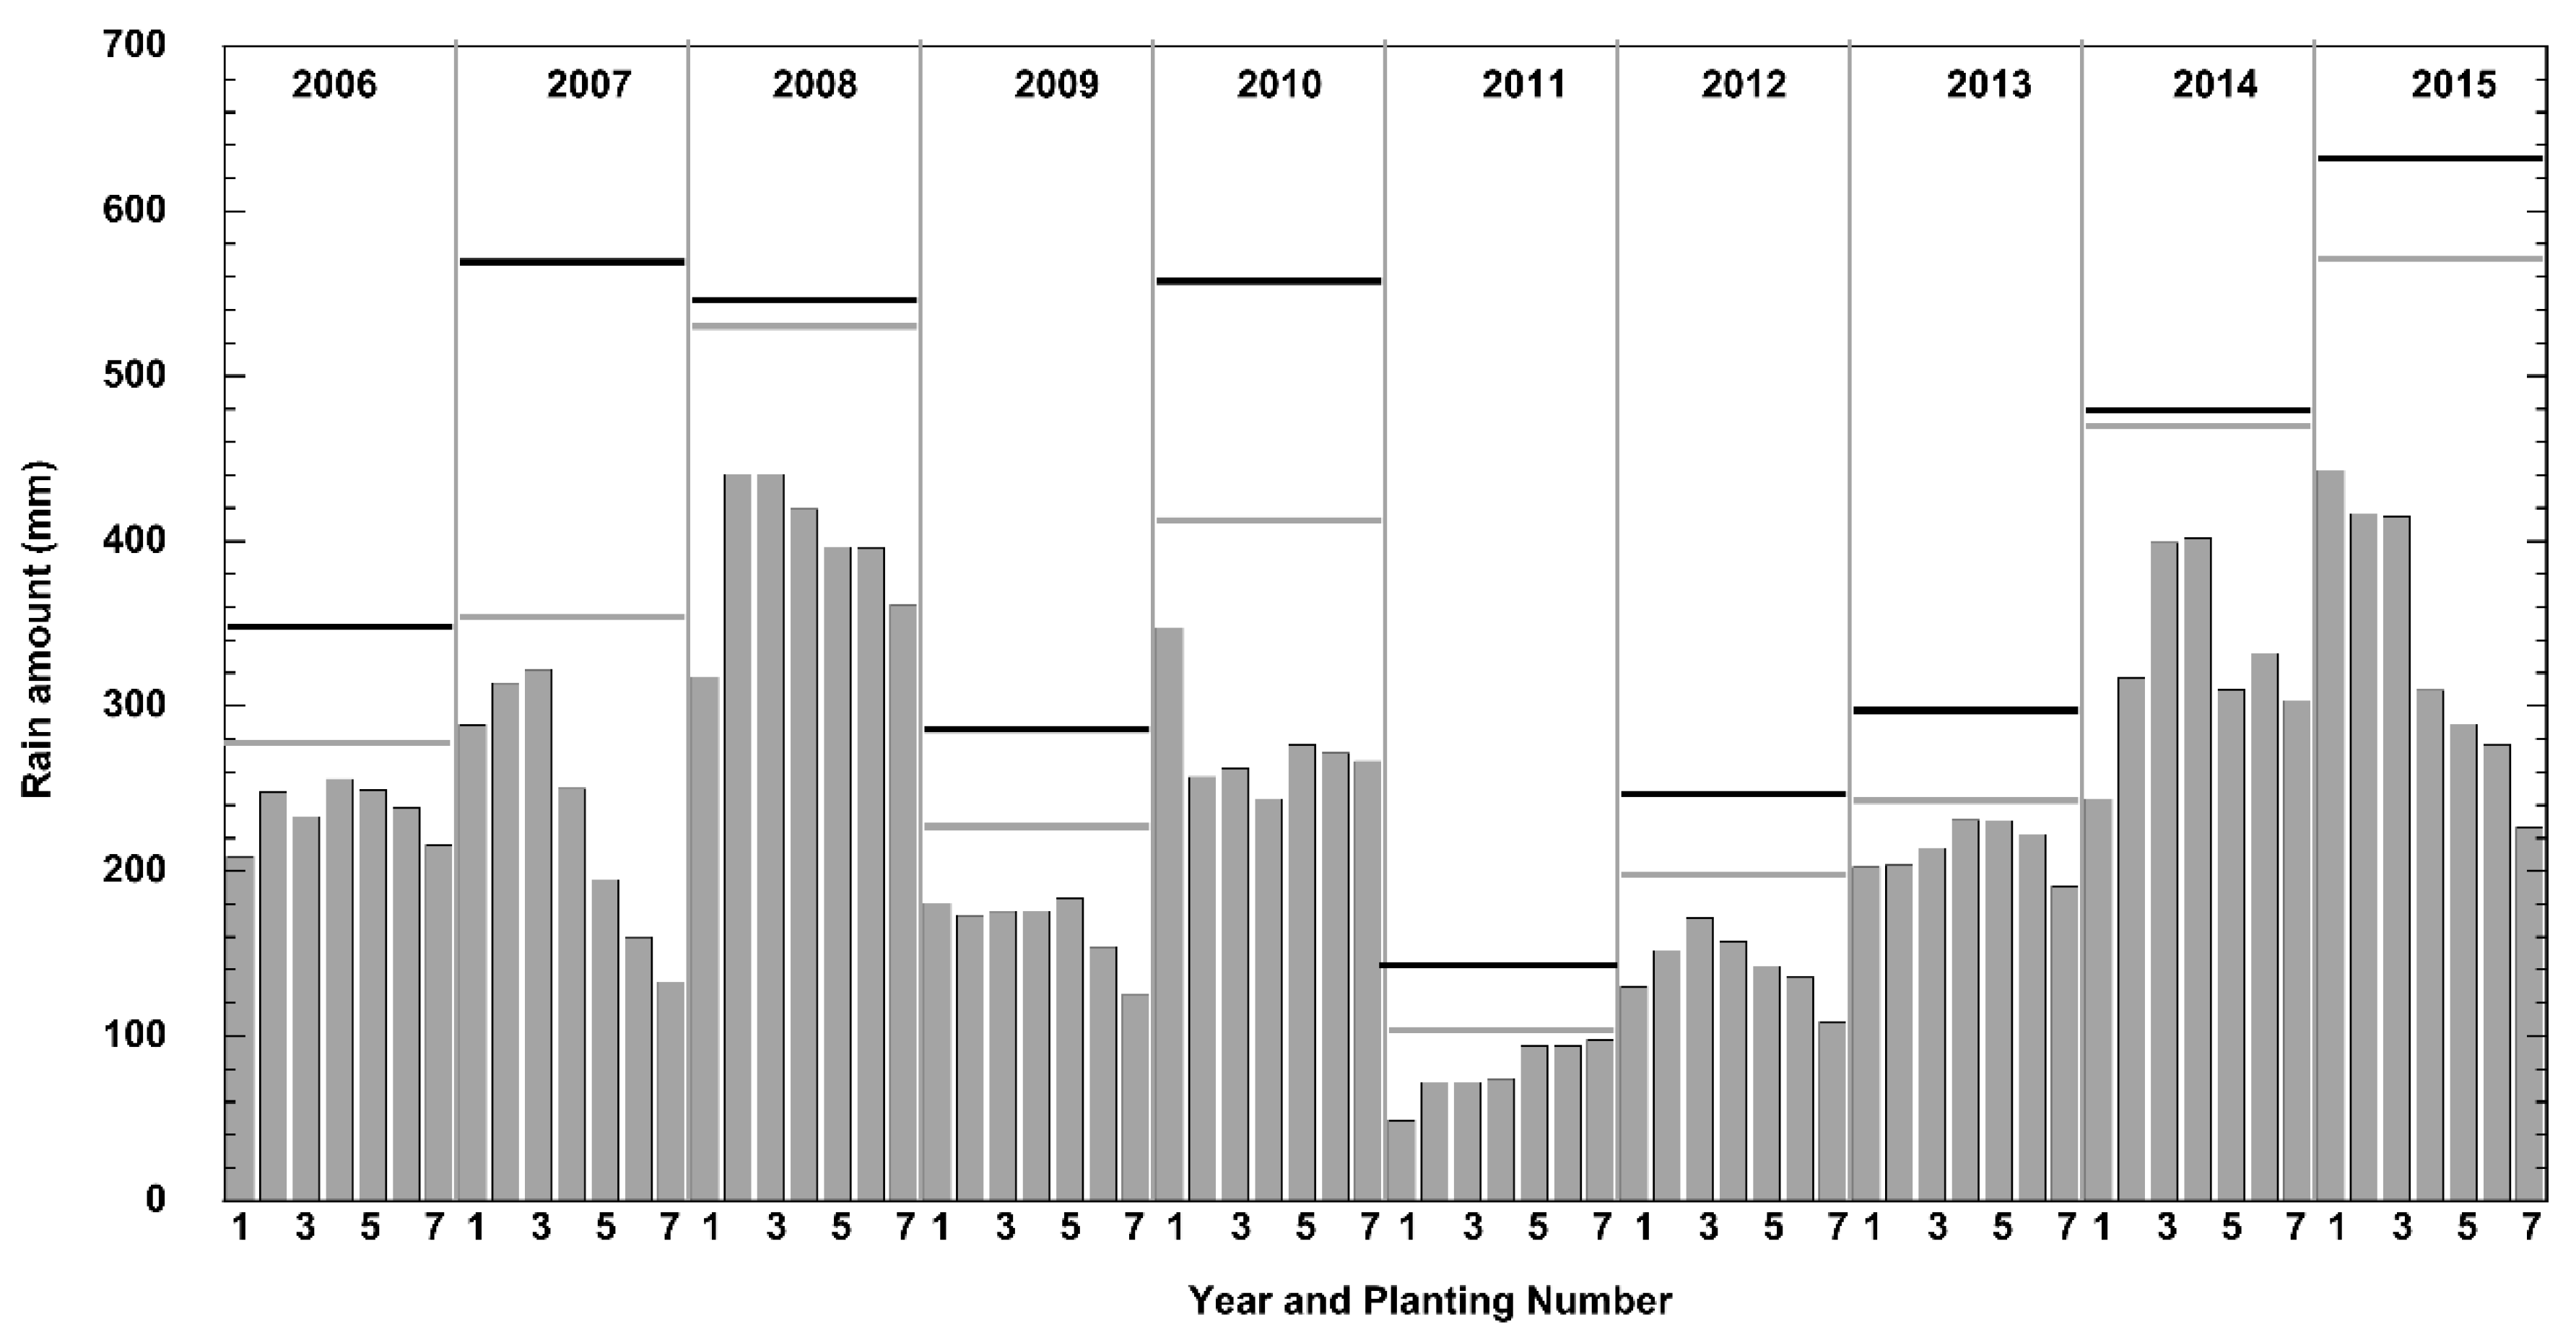
Figure 5 shows the total rain for each of the seven 154-day PCCSs in each of the 10 years of the study period. The horizontal bars in each of the years indicates the total rain for the year (black) and the 238-day cotton growing season (grey). In some years, the rain amount was relatively stable across the seven planting dates, and in others it varied more widely. For example, in 2006 and 2013, rain variation was 46mm (209 mm to 255 mm) and 38 mm (230 mm to 192 mm) respectively. In 2007 and 2015 rain variation was 189 mm (321 mm to 132 mm) and 218 mm (444 mm to 226 mm).
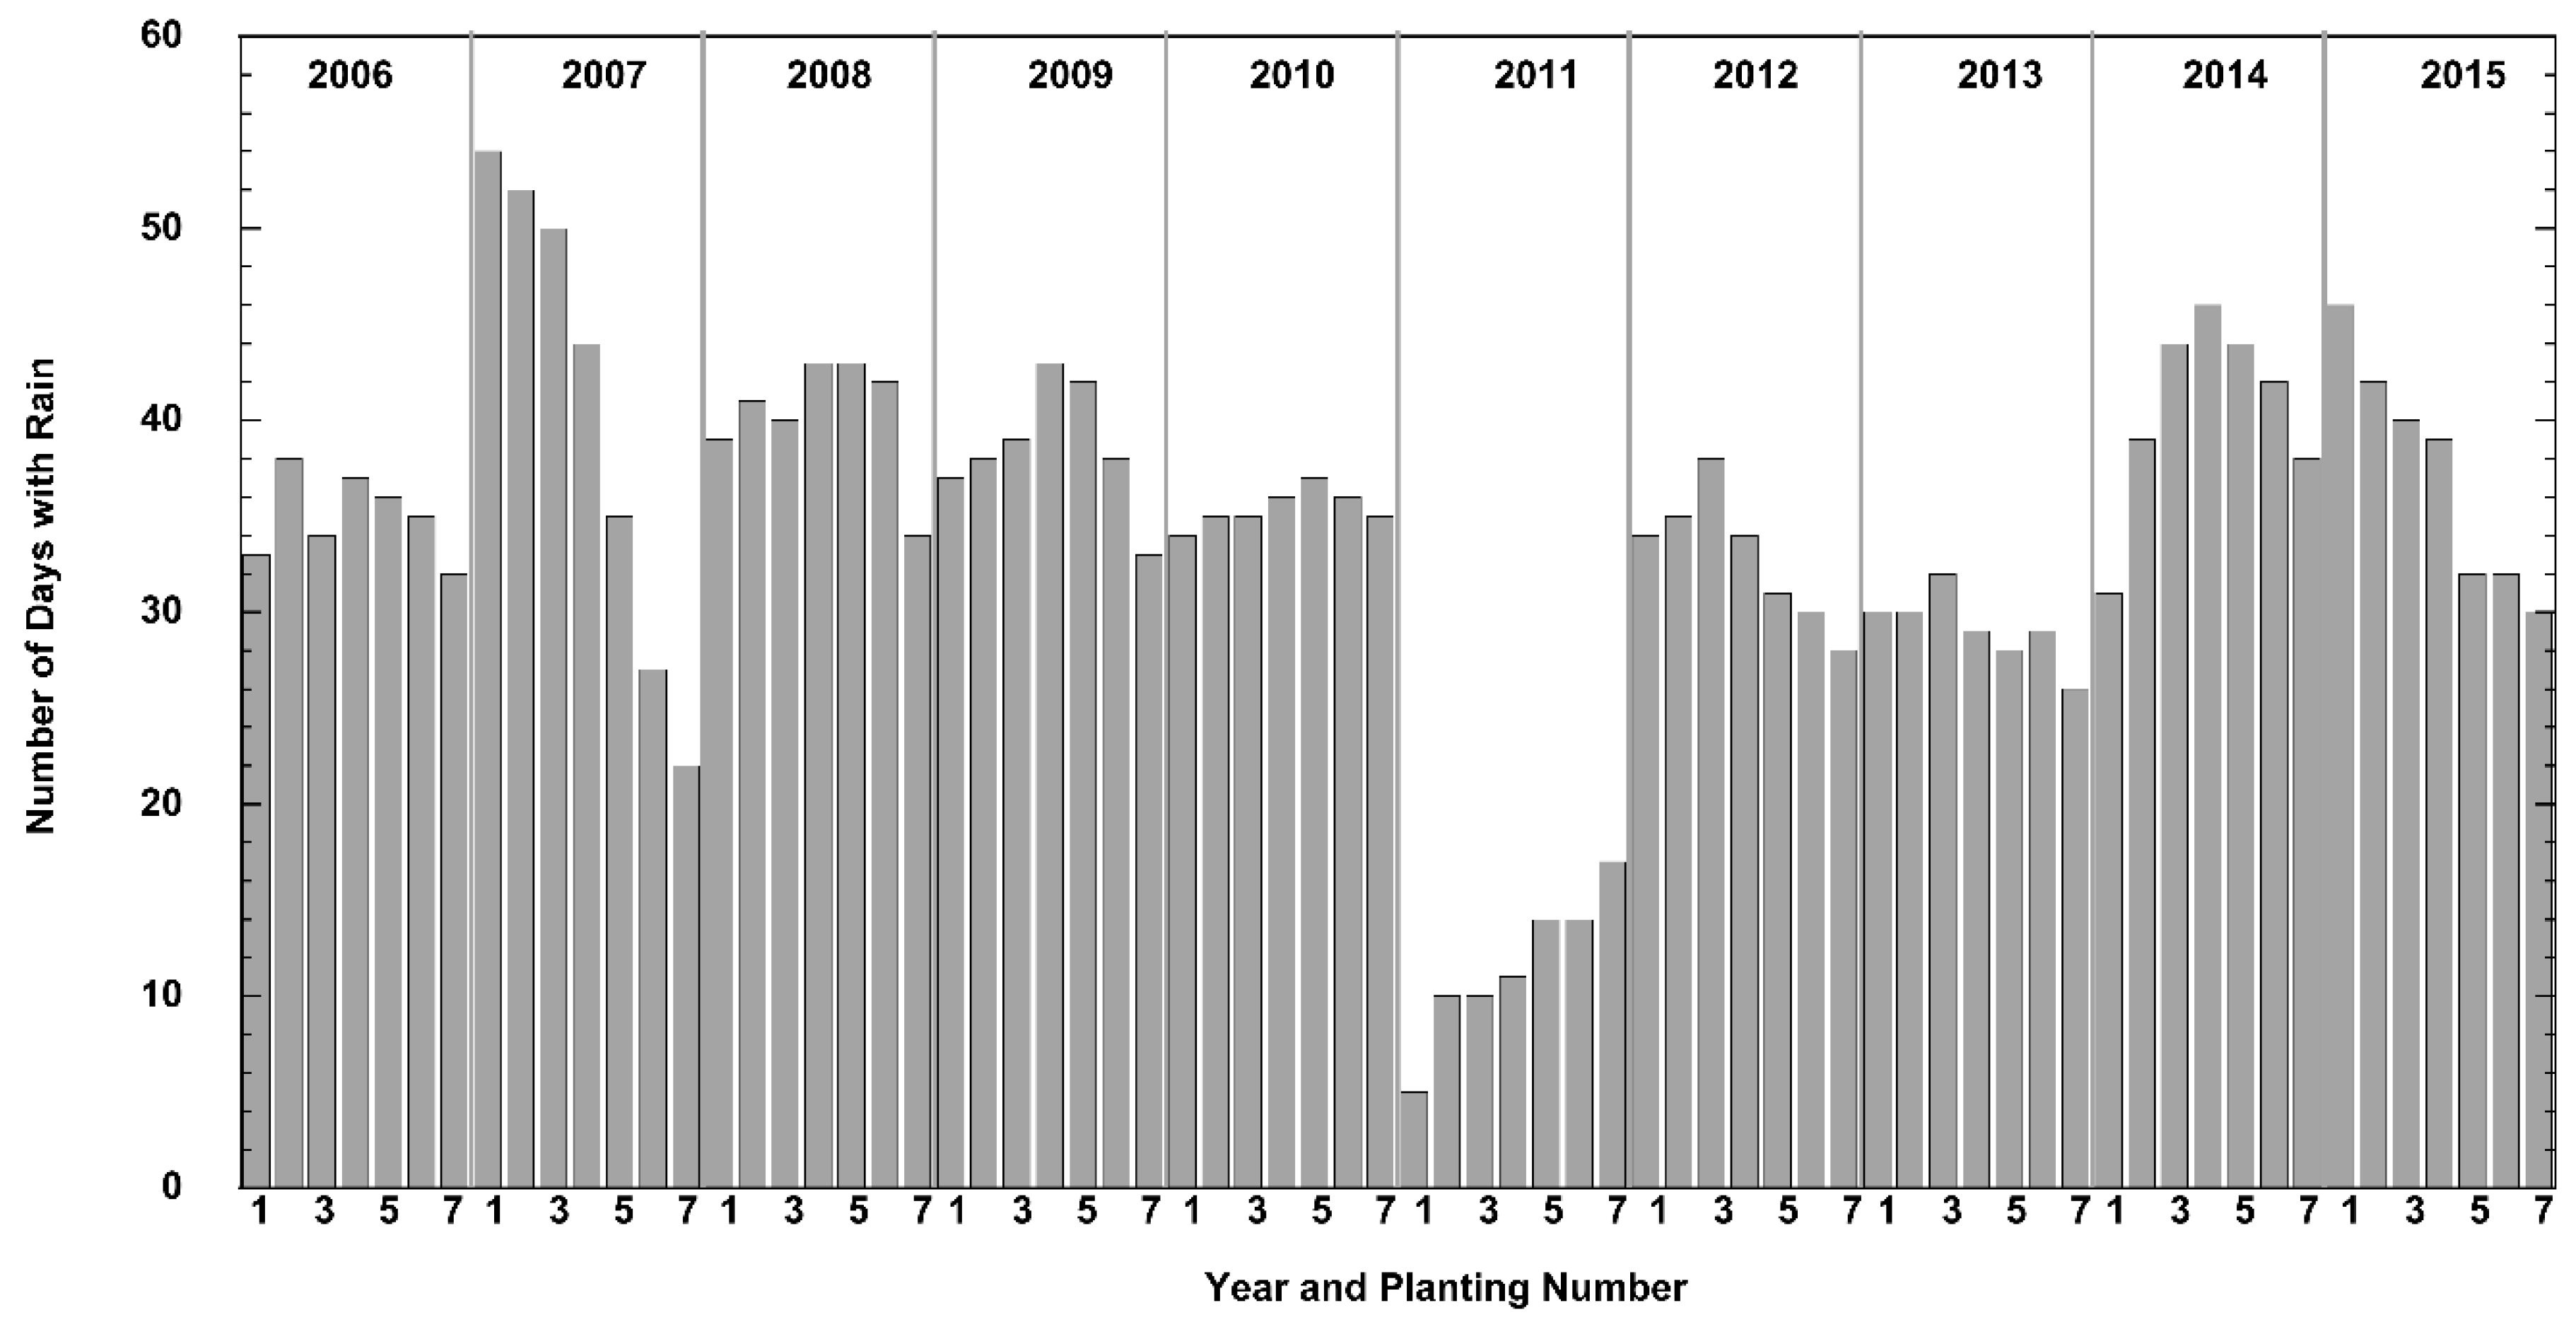
Figure 6 shows the number of days with rain events in each potential cotton crop season over the 10-year study period. The highest number of days with rain occurred in planting #1 in 2007, with rain on 54 days of the 154-day period, while there were only five days with rain in planting #1 of 2011. Over the 10-year period, 14 of the 70 potential cotton crop seasons had fewer than 30 rain events in the 154-day PCCS. Over the 10-year study period across the 70 potential cotton crop seasons, the number of days with rain was only moderately correlated with rain totals (
R2 = 0.52).
3.3. Analysis of Crop Evapotranspiration
The amount of rain over any period established the upper limit of water available for the crop. The seasonal crop water environment is a result of the interaction between the amount of rain and the amount of water consumed by the crop. Crop water as evapotranspiration can either be measured directly, or estimated on the basis of plant and environmental information. The effect of rain and other environmental factors (e.g., air temperature, solar radiation, windspeed, humidity) on the water needs of a crop can be estimated by calculating the “environmental demand” in terms of ETc. The ETc, which is adjusted over the season as the crop grows and develops, provides an estimate of the amount of water that could be used by the crop.
Figure 7 shows the cumulative ETc for each of seven 154-day PCCS over the 10-year study period. There was a consistent pattern across the years of lower ETc for the earliest and latest planting dates, and the highest values associated with the middle planting dates within each year. Over the 10-year study period, across the 70 potential cotton crop seasons, the ETc was not well-correlated with rain totals, with an
R2 value of 0.21.
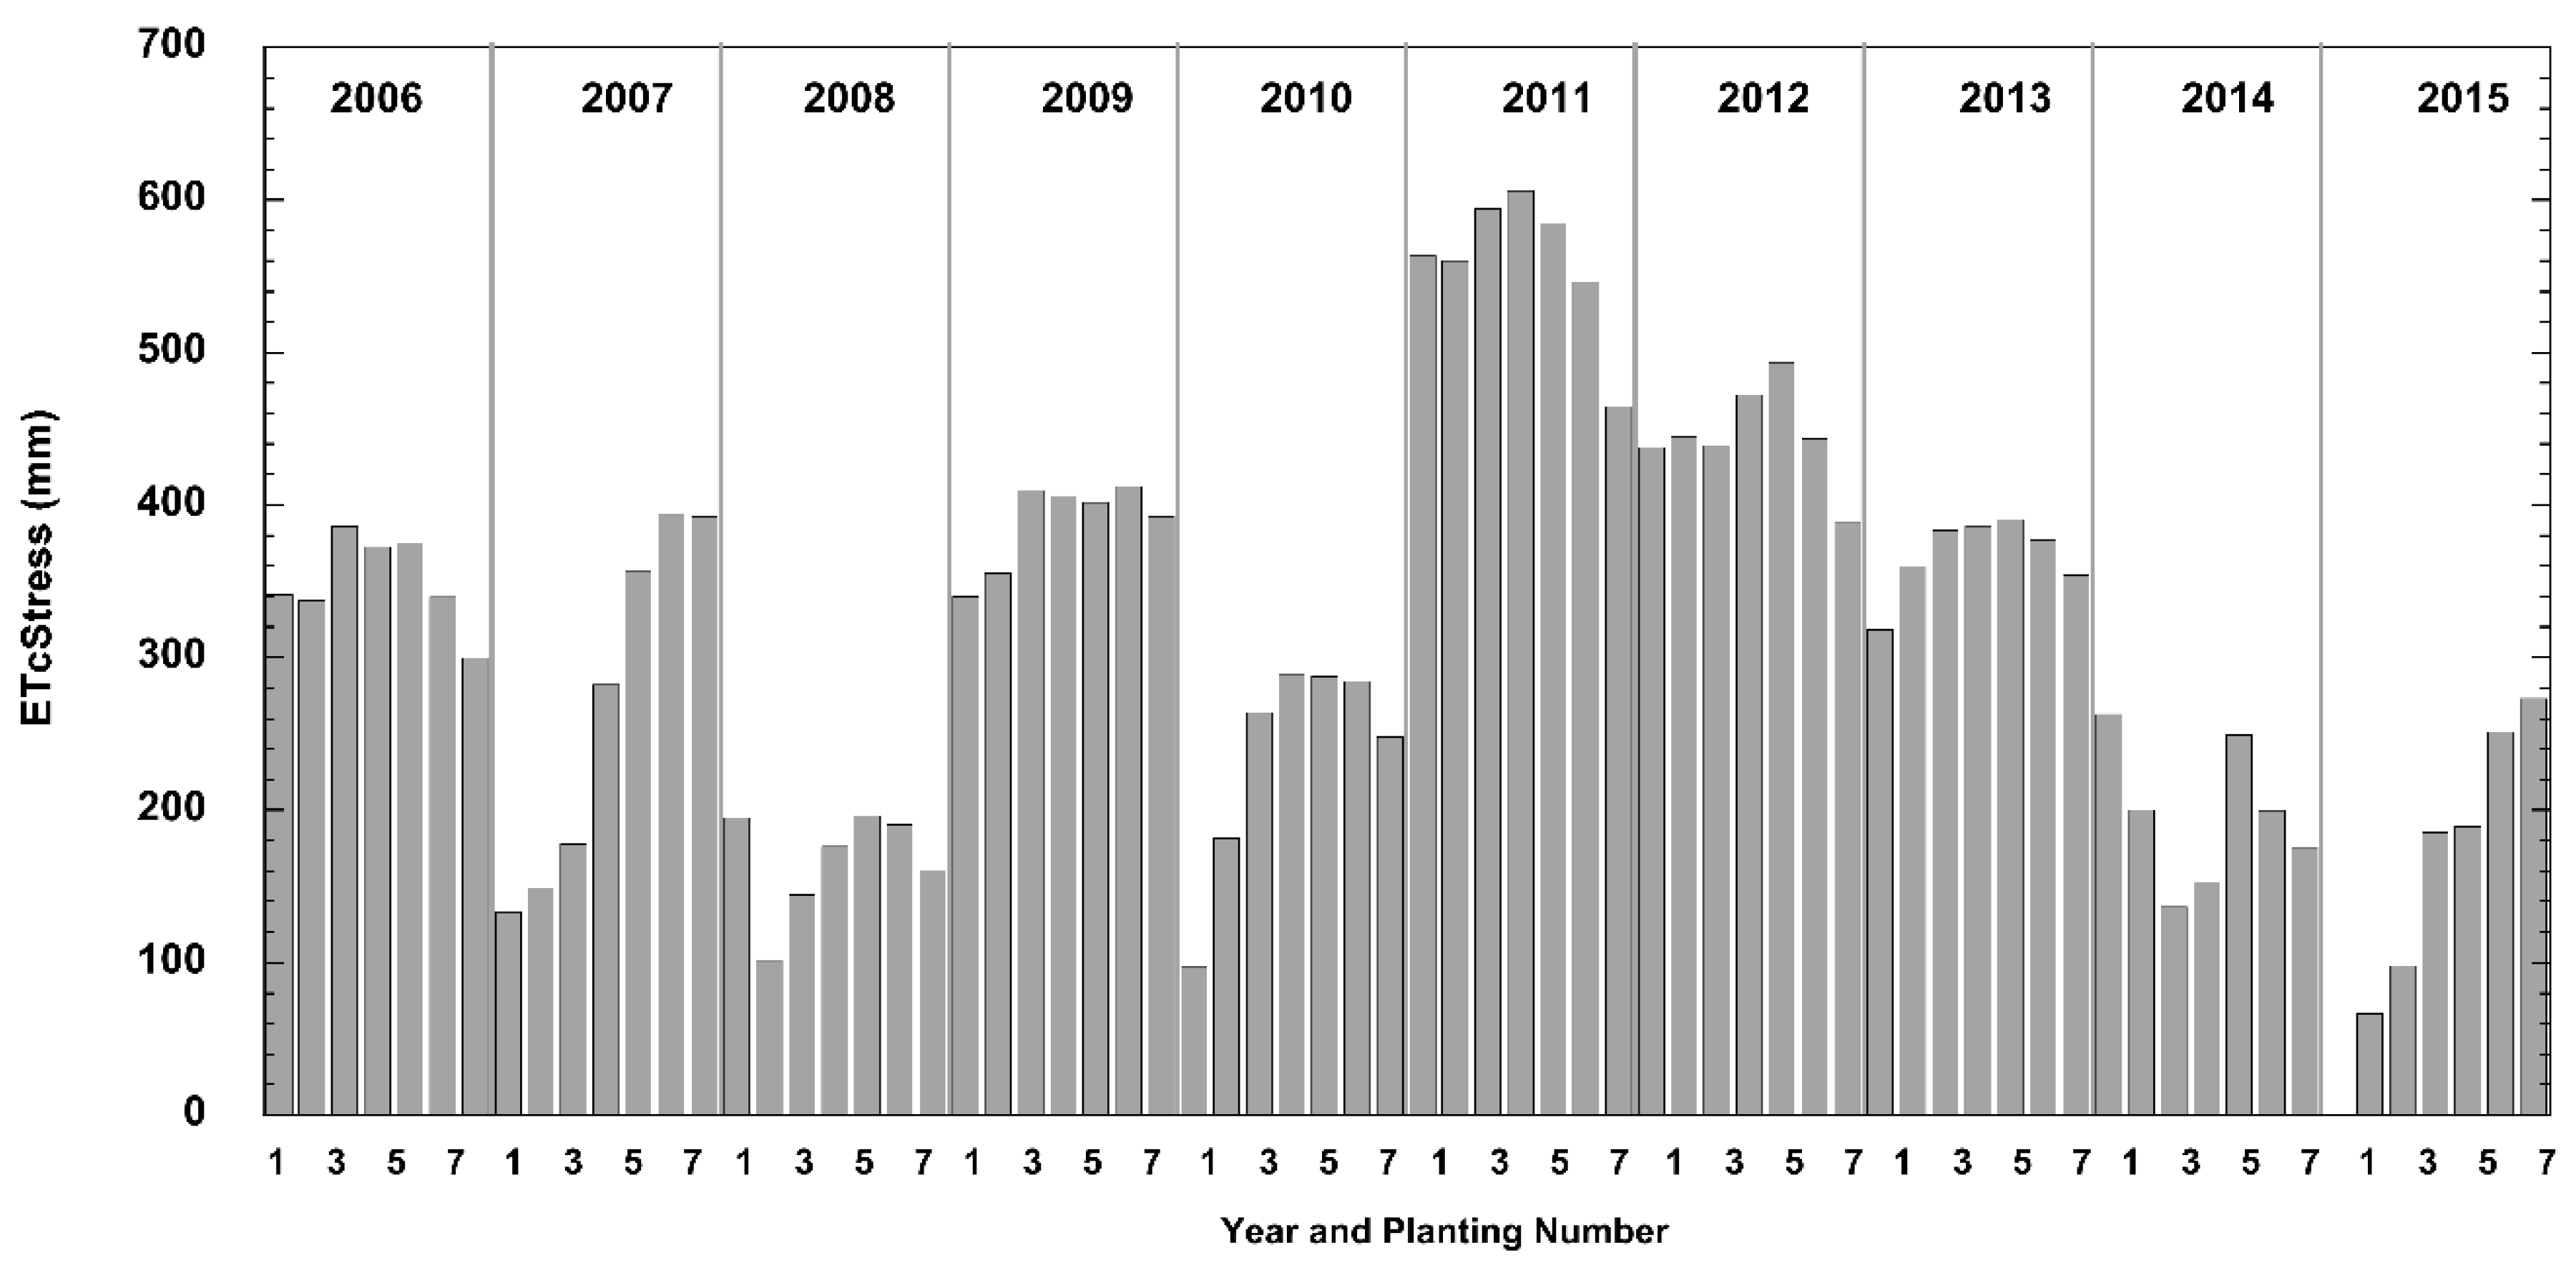
The water status of the crop can be approximated in terms of ETc-based stress (ETcStess), calculated as the difference between rain and ETc (ETcStress = rain-ETc) over the potential cotton crop seasons. This variable, ETcStress, indicates the extent to which the crop demand (ETc) was greater or less than the rain during a period. Putative crop stress increased with increasing values of ETcStress. Positive values of ETcStress indicated that ETc has exceeded rain, and that the crop may be stressed. Negative ETcStress indicate that rain has exceeded ETc and the plant is probably not under water stress.
Figure 8 shows the cumulative ETcStress for each of seven 154-day PCCS over the 10-year study period. The pattern was similar to that of the rain totals over the periods (
Figure 5). Over the 10-year study period across the 70 potential cotton crop seasons, the ETcStress was negatively correlated with rain totals, with an
R2 value of 0.86.
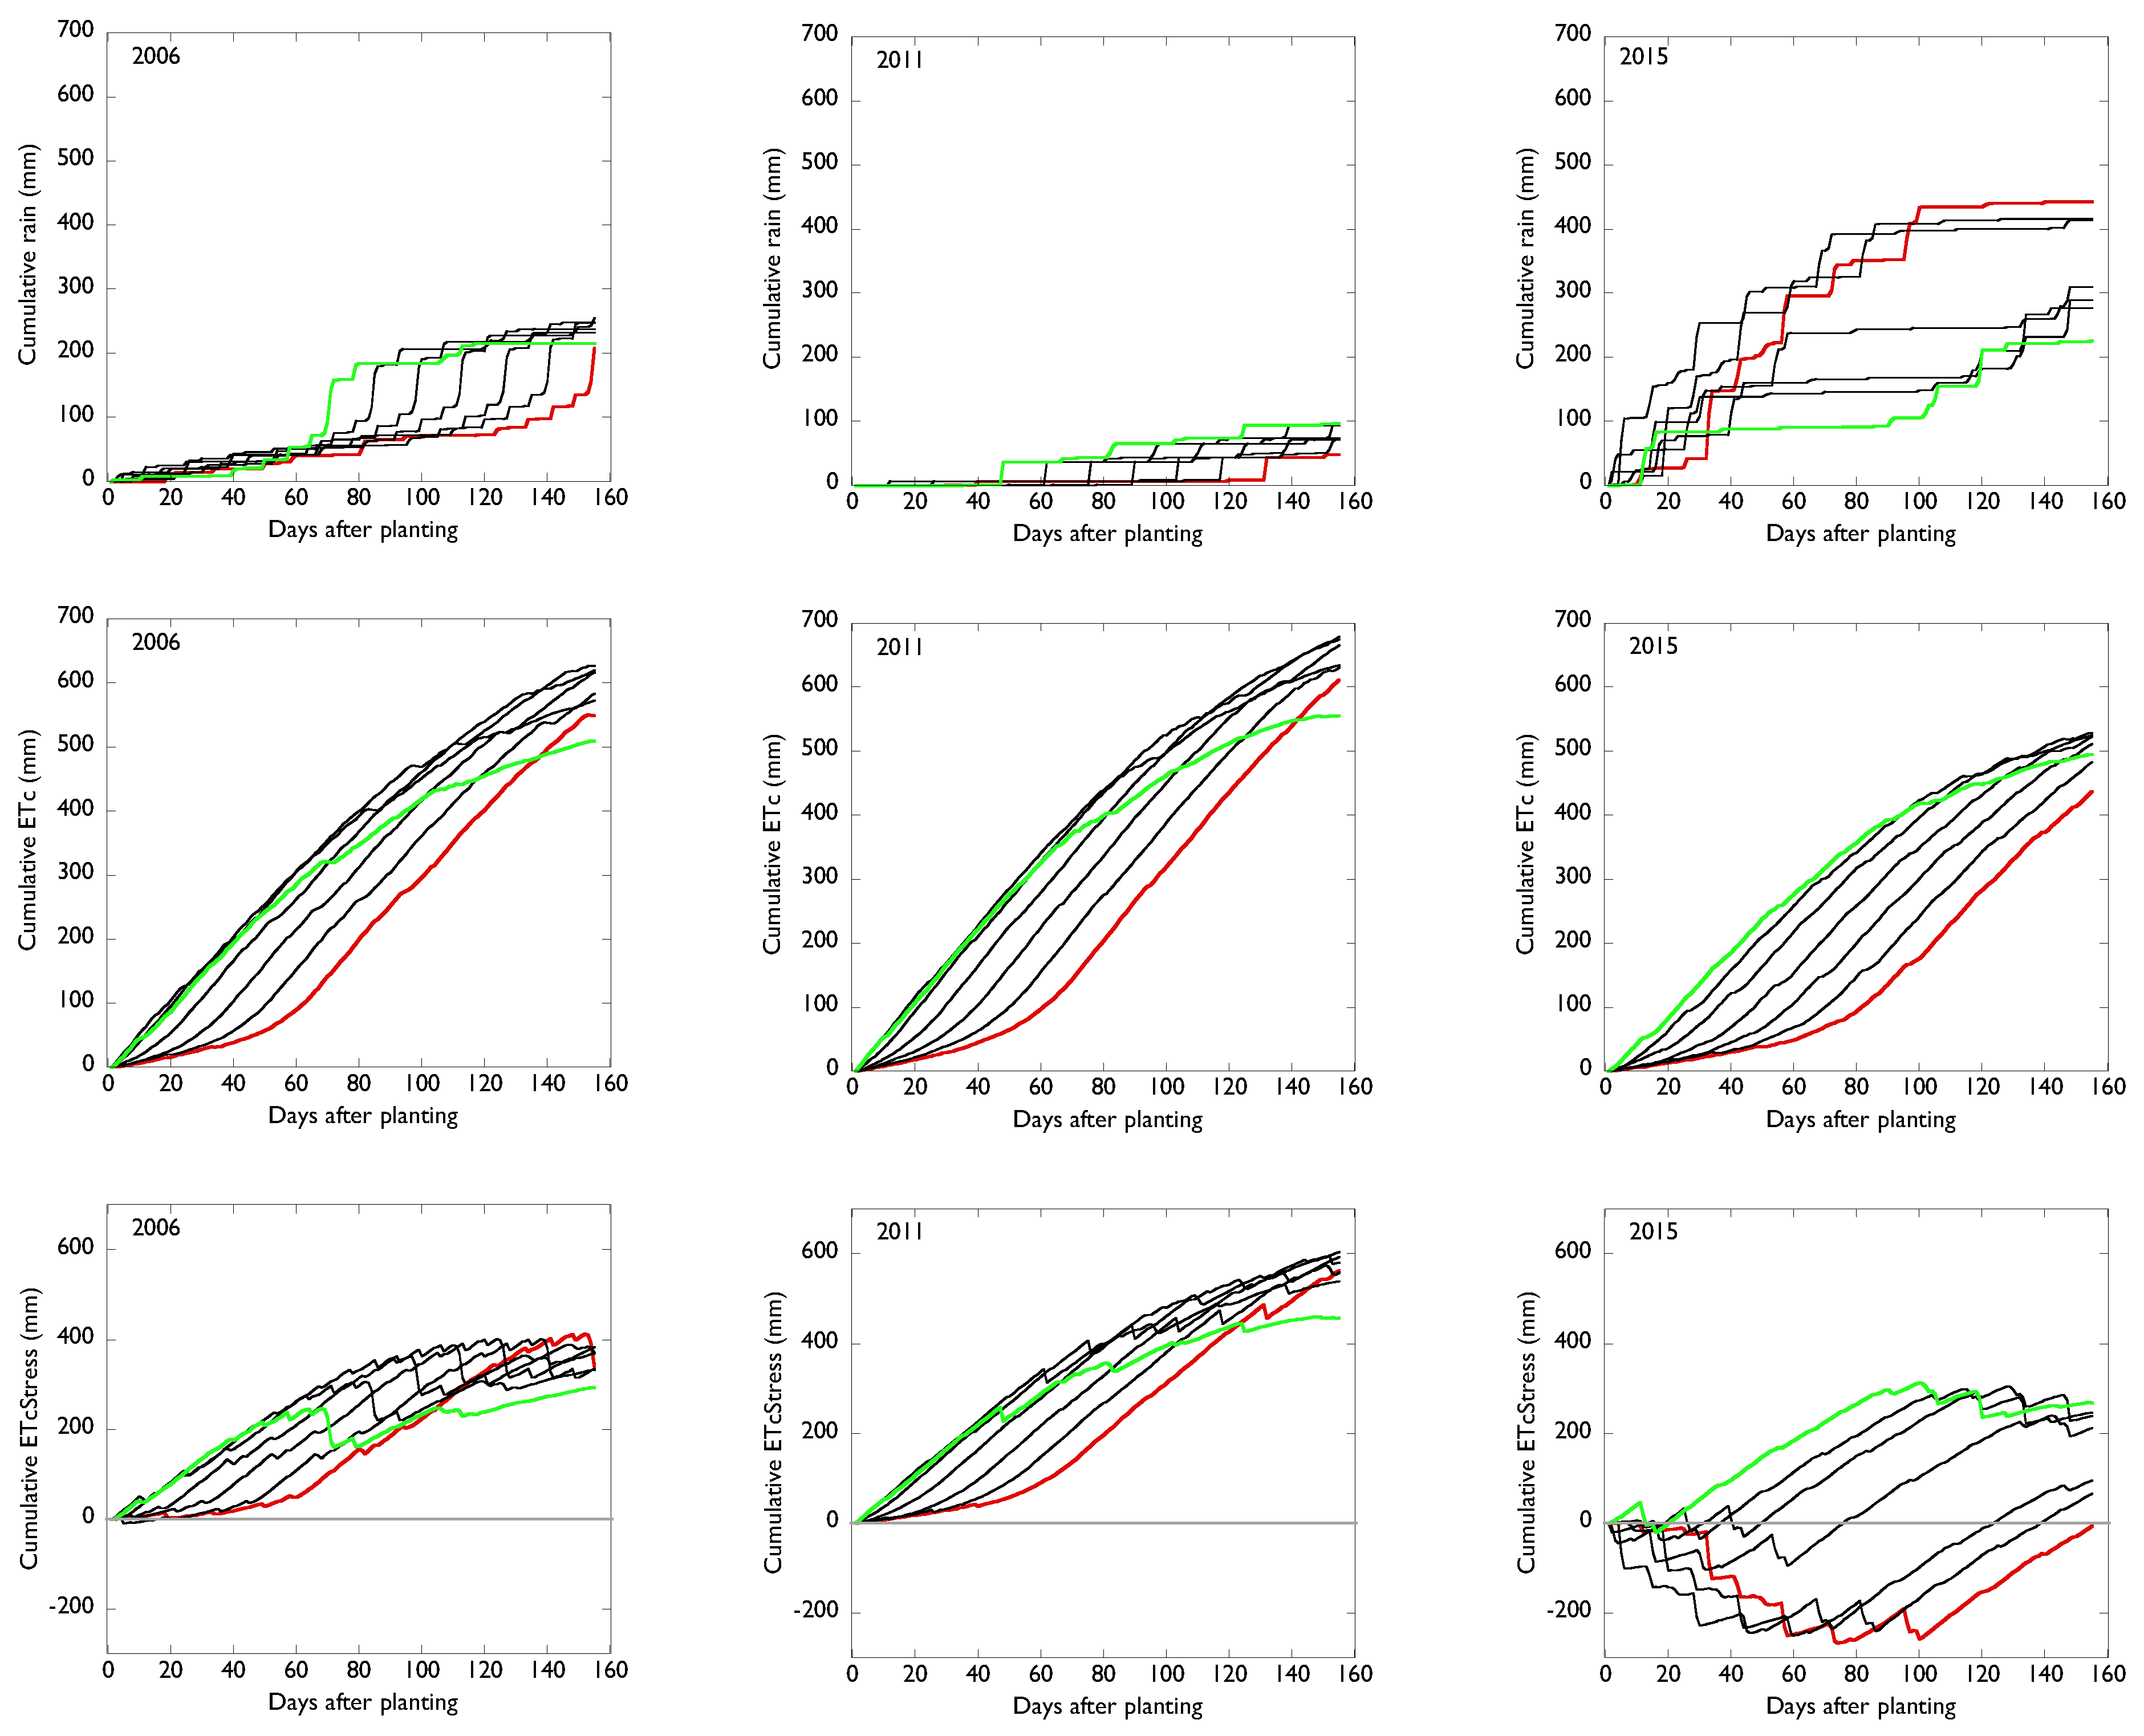
In the preceding analysis the variables; rain, rain events, ETc, and ETcStress, have been reported as 154-day totals for each of 70 potential cotton crop seasons resulting in ~10,000 daily values. A detailed analysis of the daily value patterns is beyond the scope of this analysis however, three of the 10 years have been chosen for a more detailed analysis; (1) 2011, the driest year; (2) 2006, a moderate year; (3) 2015, the wettest year (
Figure 9). In each panel, the red line indicates planting #1 and the blue line indicates planting #7.
The upper panels show cumulative daily rain over the seven plantings in each year. In each instance, the rain patterns in plantings #1 and #7 roughly bracketed the other five plantings. In the 2011 and 2006, the drier years, planting #7 accumulated rain at the highest rates in the early portion of the potential cotton crop seasons, and planting #7 accumulated at a slower rate at the end of the potential cotton crop season.
The middle panels show the daily accumulation of ETc over the plantings in each year. The pattern across plantings was generally similar, with planting #7 accumulating ETc at a higher rate than #1.
The lower panels show the daily accumulation of EtcStress over the plantings in each year. The ETcStress (ETc-Rain) indicated the interaction between the rain and ETc over each potential cotton crop season, and could be considered a rough indicator of crop water status over the potential cotton crop season. Both the magnitude and slope of the lines are indicative of water stress in that when the slope is positive and the magnitude is positive, stress is present and increasing. This was the case in 2011 and 2006, when the accumulated EtcStress was generally greater than 0, and the slope was generally positive, indicating that Etc was accumulating faster than rain, resulting in a continuous water deficit for all plantings in those two years. In planting #1 of 2015 (the wettest year) the accumulated ETcStress was never positive, and thus for that potential cotton crop season, stress was perhaps minimal. The slope of the ETcStress accumulation ranged from negative to positive over the season. When the slope and magnitude were both less than zero, the crop could be considered non-stressed, while later in the potential cotton crop season, when the slope was positive, the crop was depleting water faster than it was replaced by rain. Under such conditions, the crop was probably experiencing stress, but to a lower extent than if both slope and magnitude were positive.
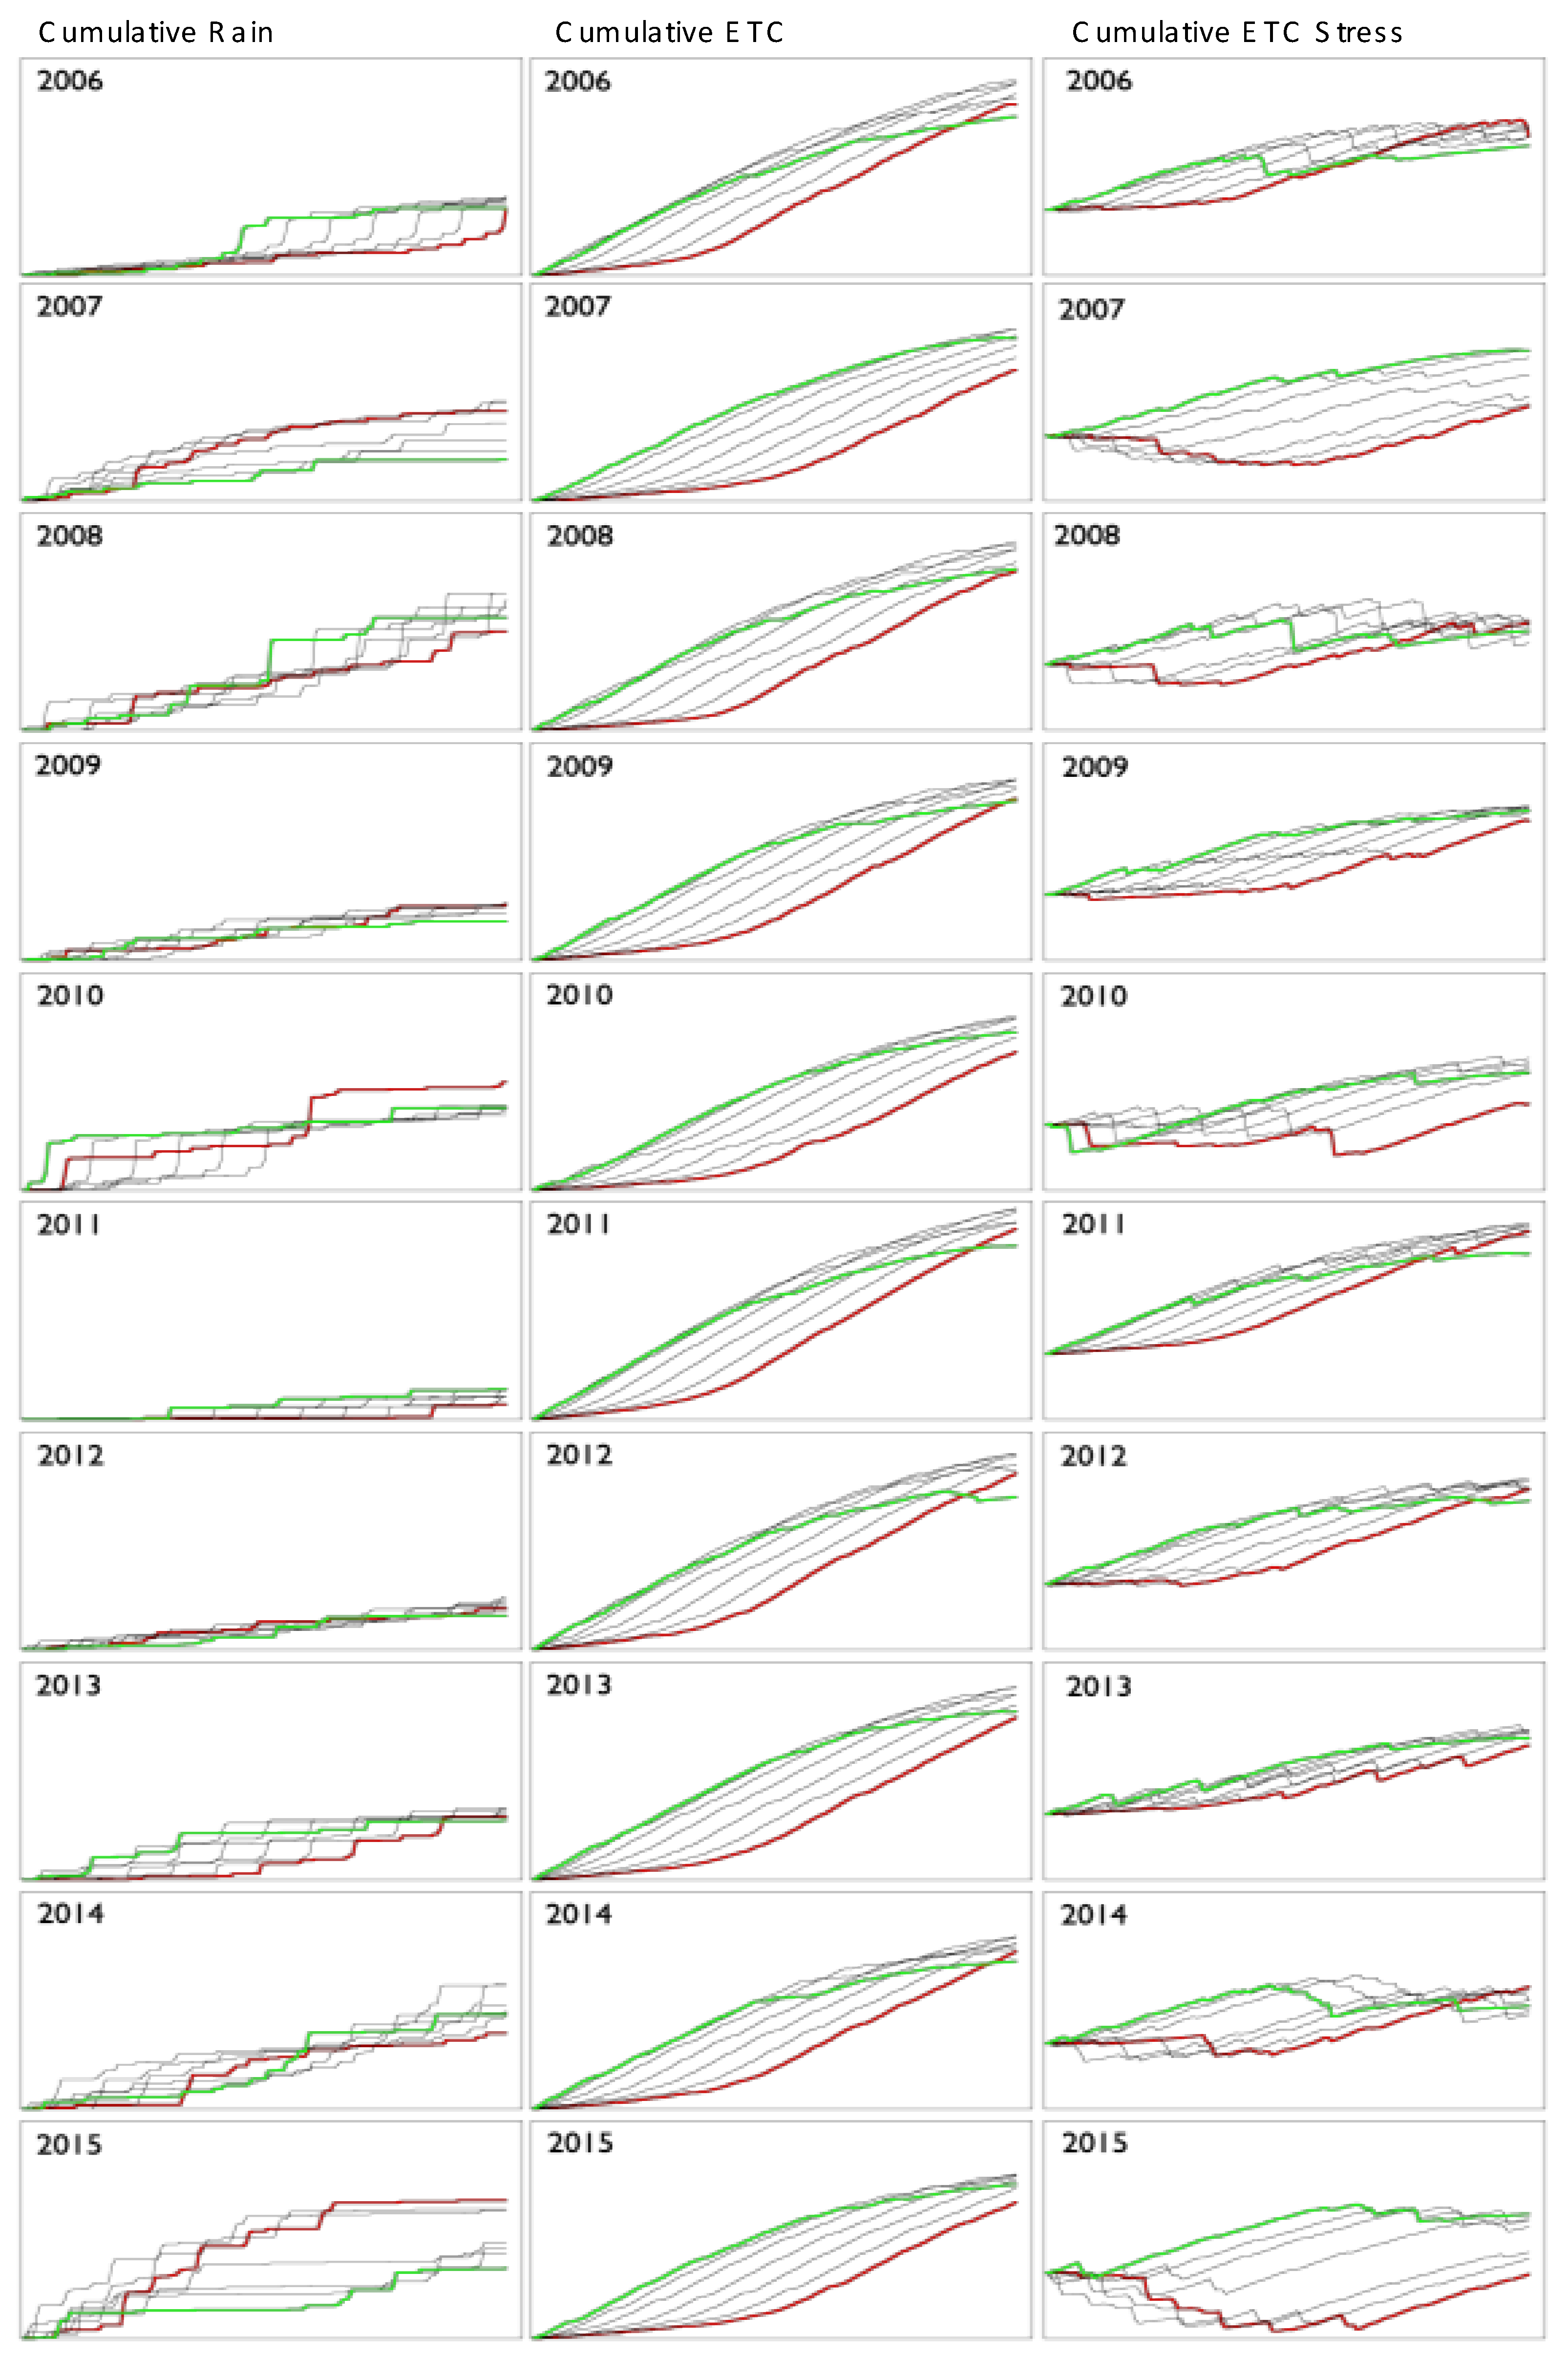
Figure 10 provides a qualitative visualization of the daily 154-day data patterns for accumulated rain, ETc and ETcStress for each of the seven potential cotton crop seasons over the 10-year study period. This image is intended to be a qualitative demonstration of the variability in the crop water environments. In each image, the axes are the same, with planting #1 indicated by the bold red line, planting #7 indicated by the bold green line and plantings #2 to #6 indicated by black lines.
The panel on the left shows rain accumulation over the 70 potential cotton crop seasons grouped by year. In 2006, 2011, and 2013m planting #7 accumulated rain at a higher rate than planting #1 across the entire 154-day PCCS. In 2007 and 2015, planting #1 accumulated rain at a higher rate and had a higher total rain amount than planting #7 across the 154-day PCCS. In the other years there was no clear pattern evident in the differences between planting #1 and planting #7.
The center panel shows ETc accumulation over the 70 potential cotton crop seasons grouped by year. There was a clear pattern, with planting #1 having the lowest rate of ETc accumulation at the beginning of the 154-day PCCS, and increasing over time. The rate of ETc accumulation in planting #7 was highest early in the season, and lowest at the end of the 154-day PCCS. The ETc accumulation for plantings #2 to #6 were generally intermediate between plantings #1 and #7.
The panel on the right shows accumulation of ETcStress over the 70 potential cotton crop seasons grouped by year. In all years, planting #1 appeared at the bottom of the patterns, indicating a reduced rate of ETcStress accumulation, particularly in comparison to planting #7 that generally accumulated ETcStress at higher rates. Negative values of accumulation indicated periods when the rain received exceeded ETc, and 2007, 2008, 2010, 2014, and 2015 had substantial periods of negative ETcStress accumulation. The other years had positive accumulation rates across the entire 154-day PCCS.
The seven plantings dates resulted in potential cotton crop seasons with different patterns in rain, Etc and EtcStress in each of the years.
Figure 10 shows the total ETcStress for each of the 70 potential cotton crop seasons of the study. It is apparent that there was a general trend, with a narrower range of ETcStress in plantings #6 and #7.
3.4. Compare and Contrast
The hypothesis of this study is that the growth and development of a cotton crop in the region is enhanced under some potential cotton crop seasons and limited in others. The results of this analysis indicate that the crop water environments of various potential cotton crop seasons, associated with different planting dates, vary both within and across years.
Figure 11 shows a comparison of total rain, total ETc and total ETcStress of the crop water environments for the 10 years of the 238-day CGSs and the 154-day PCCSs. Over the period, the rain totals of the cotton growing seasons varied by 473 mm, and those of the potential cotton crop seasons varied by 394 mm. The ETc totals over the 10 years varied by 180 mm for the cotton growing seasons, and the ETc totals of the potential cotton crop seasons varied by 257 mm. The ETcStress totals varied for the cotton growing seasons over the 10 years by 645 mm, with the ETcStress of the potential cotton crop seasons varying by 611 mm. These results indicate that the potential cotton crop season approach resulted in variation in crop water environments that is similar to that in the crop growing seasons analysis, and suggests that further definition of the relationship between planting dates and seasonal crop water environments might be productive.
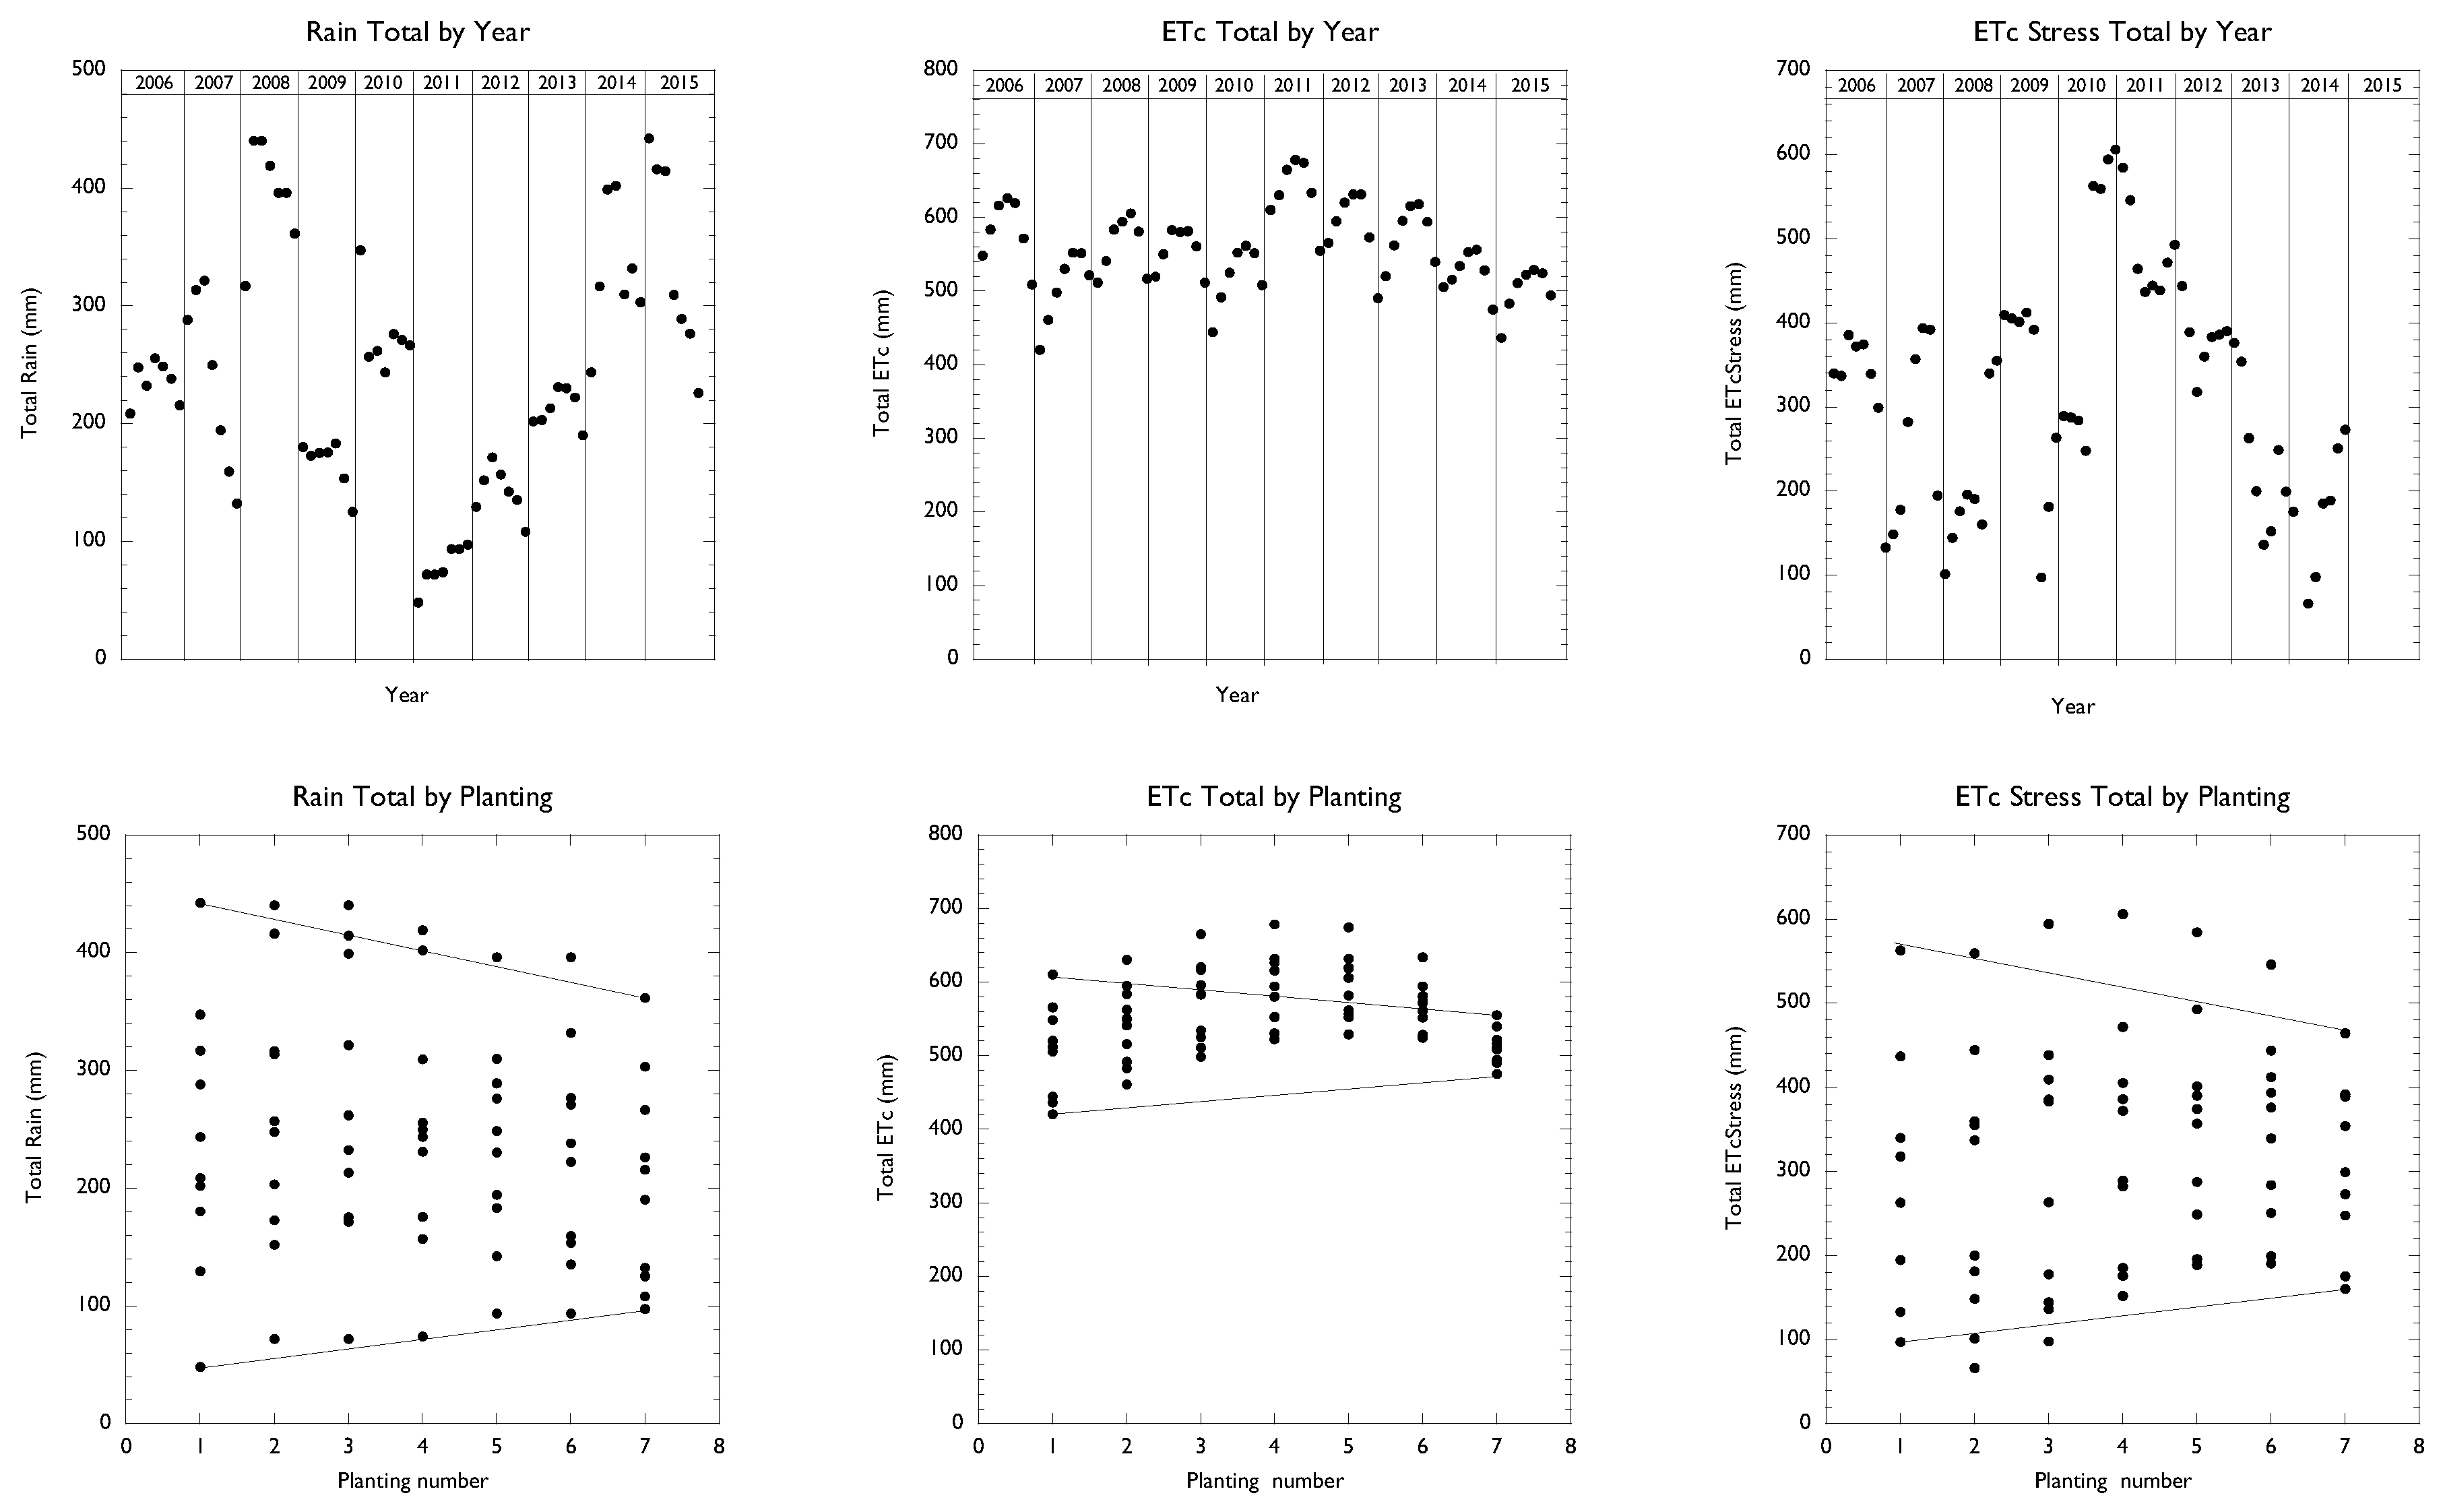
Figure 12 shows the total rain and total ETcStress for the 70 potential cotton crop seasons over the 10 years of the study. The panels, from left to right show the rain, ETc, and ETcStress totals as a function of the year. No patterns are evident in the rain or ETcStress, while a strong seasonal pattern is evident in the ETc variable previously seen in
Figure 7. The panels, from left to right, show rain, ETc and ETcStress totals as a function of the seven potential cotton crop seasons for the 10 years. The lines on the figures are simply guides for comparisons within and among patterns. In all three variables, there was a trend of decreasing variability between the planting #1 and planting #7. In terms of the rain totals, the effect of planting date was relatively consistent, while the relationships for ETc and ETcStress planting date had a curved relationship. The curvature was most pronounced in the ETc, and less so in ETcStress.
Table 1 compares the maximum values for rain, ETc, and ETcStress for plantings #1 and #7, as shown in
Figure 12. Total rain varied between plantings with #1 having the larger difference in rain amount (393 mm versus 262 mm). The maximum to minimum rain amount varied by 89% in planting #1 versus 63% in planting #7. Total ETc varied between plantings, with #1 having the larger difference in ETc amount (198 mm versus 286 mm). The maximum to minimum ETc amount varied by 32% in planting #1, versus 16% in planting #7. Total ETcStress varied between plantings, with #1 having the larger difference in ETcStress amount (466 mm versus 301 mm). The maximum-to-minimum ETc amount varied by 83% in planting #1 versus 65% in planting #7.
The daily patterns of rain, ETc, and ETcStress shown in the
Figure 10 coupled with seasonal trends shown in
Figure 12 suggest interactions between rain and ETc that can alter the seasonal crop water environment. In the
Figure 10 it was observed that the rate of rain, ETc, and ETcStress accumulation varied with planting date. The earliest plantings accumulated stress more slowly at the beginning of the season, with higher rates of accumulation later in the season. For later plantings, the opposite pattern was present, with the rate of stress accumulation occurring highest early in the season, and declining later in the season.
Figure 12 shows a trend of decreasing rain and ETc in the latest plantings over the years, coupled with decreasing ETcStress. This apparently contradictory pattern; decreasing rain resulting in decreasing water deficits (ETcStress), suggests that the interactions between rain and crop water requirements (ETc) are an important aspect of understanding seasonal crop water environments. The distribution of apparently stochastic rain events relative to the seasonal pattern of ETc can alter the crop water environment (ETcStress) in a manner that might provide a means of optimizing the performance of a rainfed cotton crop in the region.


