Smallholder-Based Oil Palm and Rubber Production in the Forest Region of Guinea: An Exploratory Analysis of Household Food Security Outcomes

 and
and
Abstract
:1. Introduction
2. Methodology
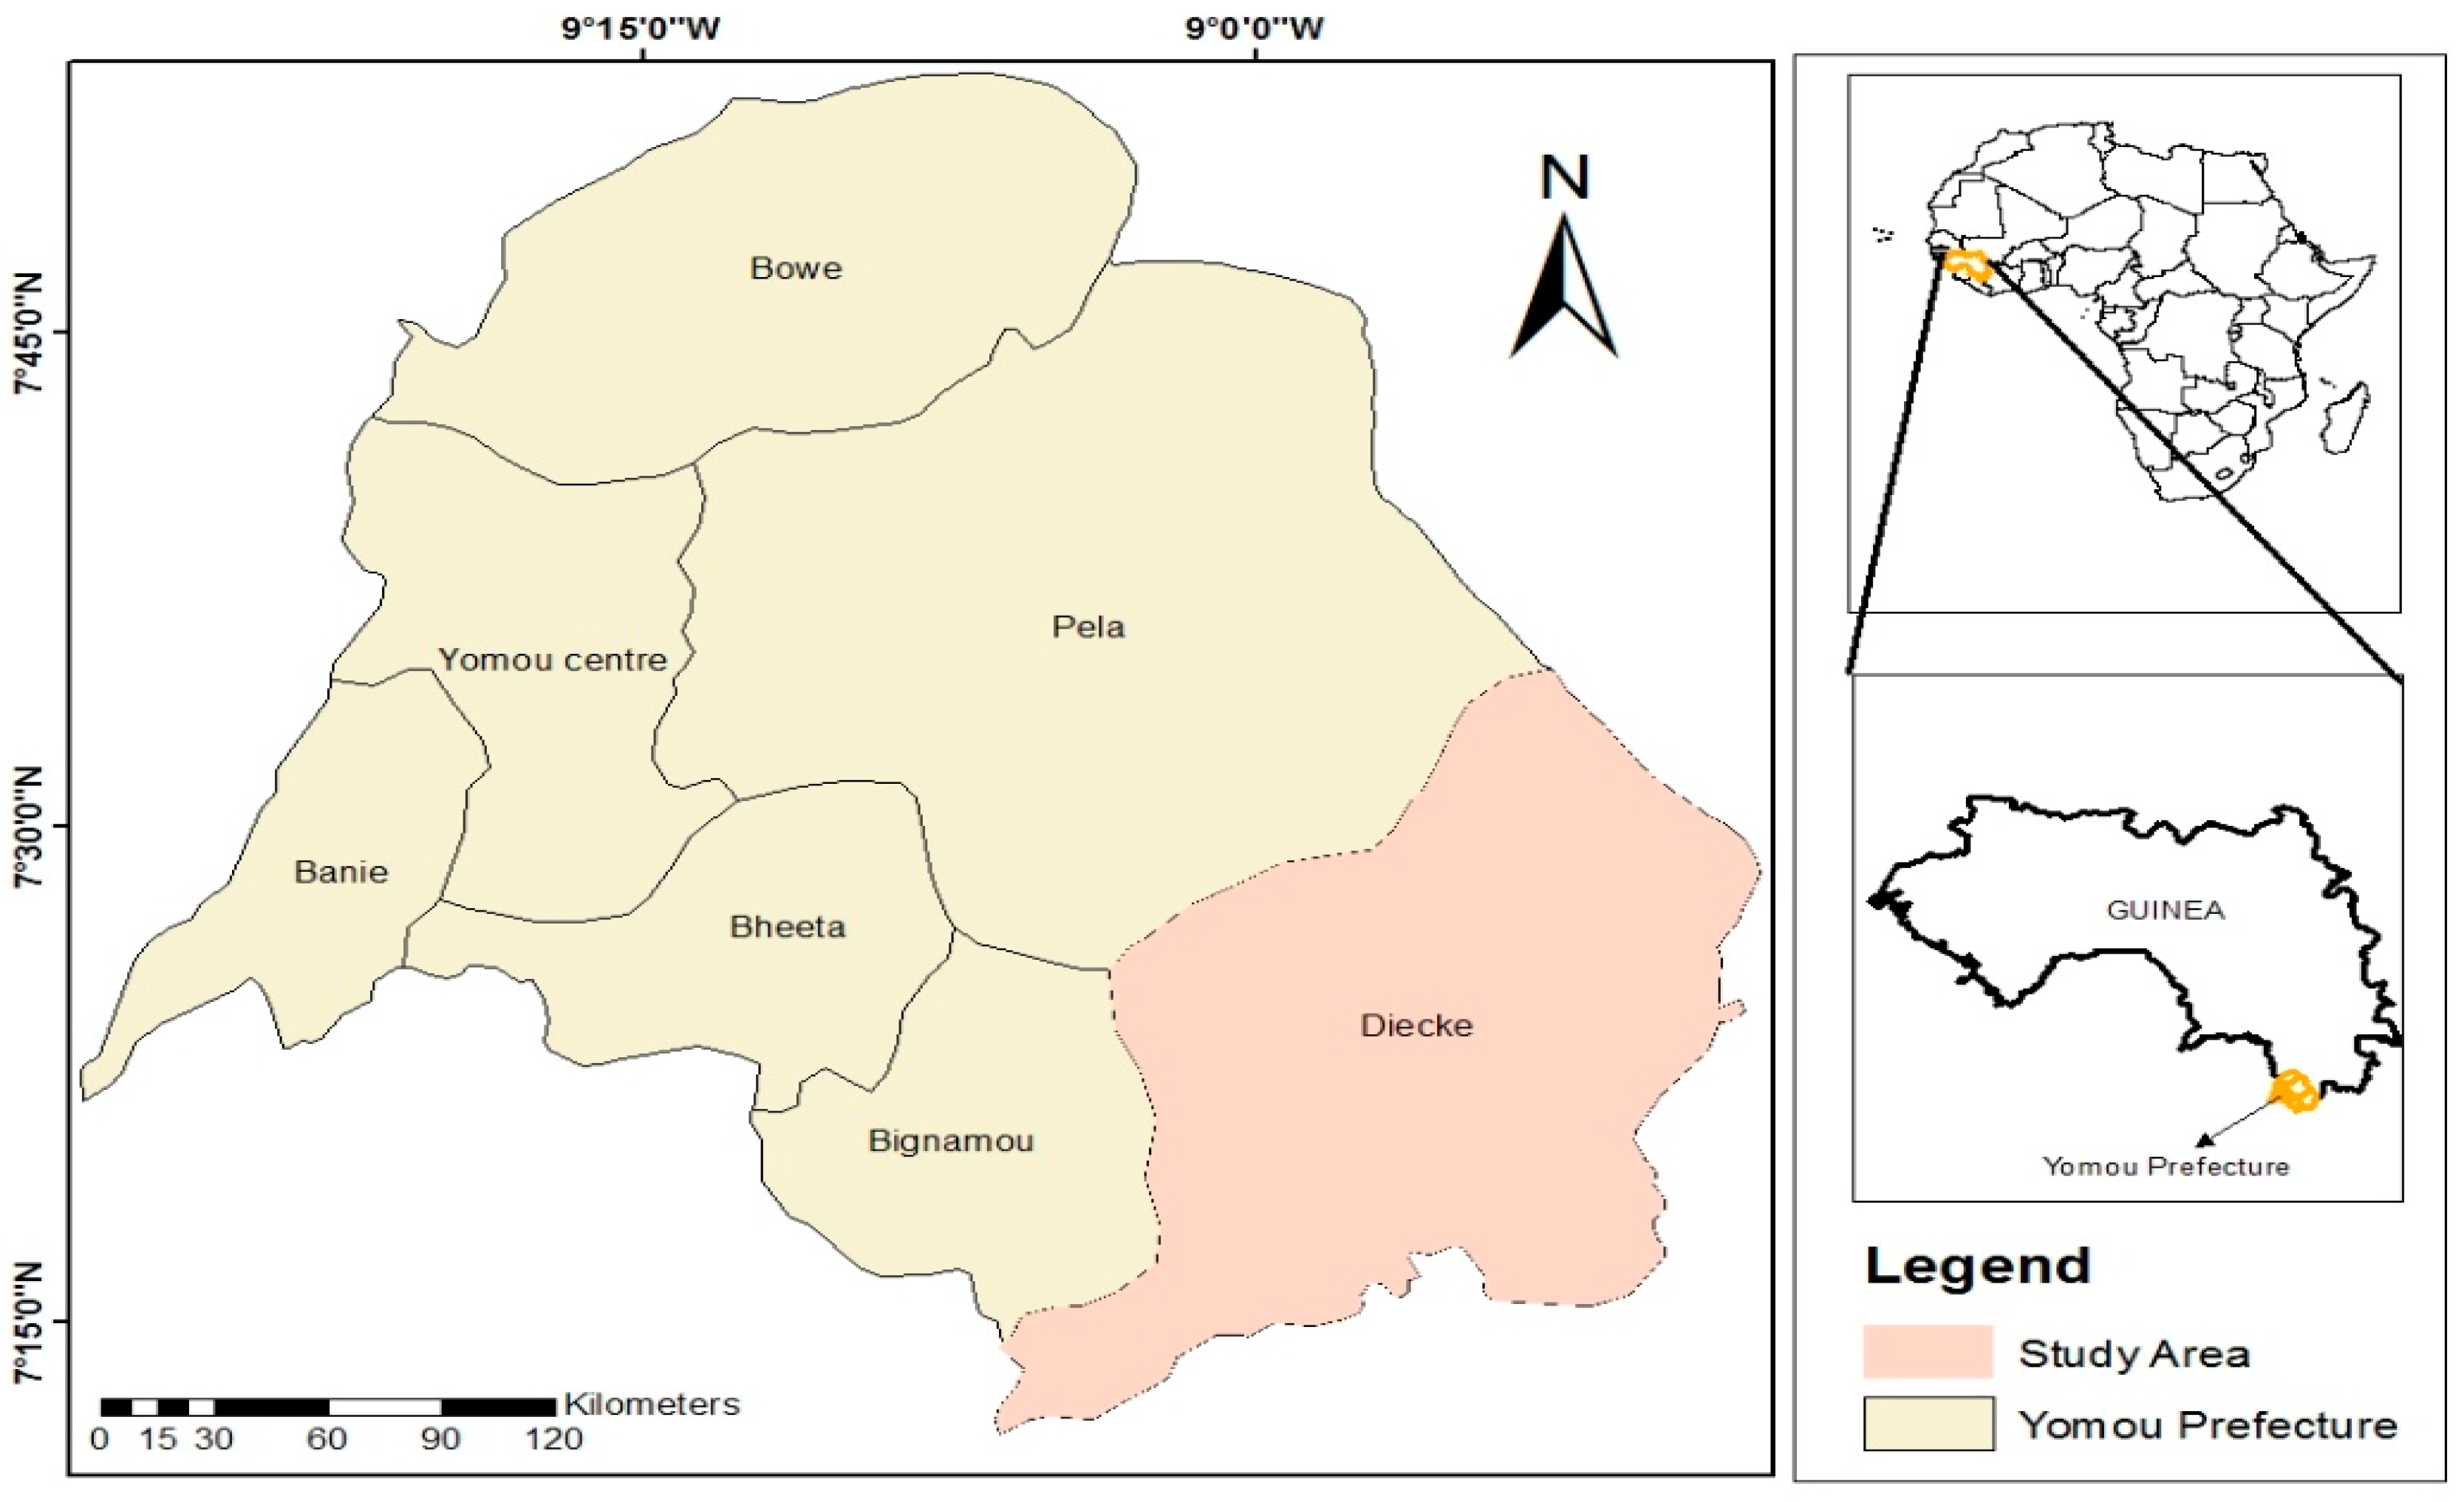
2.1. Study Site
2.2. Data Collection
2.3. Data Analysis
2.4. Ethical Considerations
3. Results
3.1. Household Characteristicss
3.2. Food Security Status
3.3. Food Security Outcomes of Involvement in Industrial Crop Production
3.3.1. Propensity Score Matching
3.3.2. Endogenous Treatment Regression Model
4. Discussion
5. Conclusions
Supplementary Materials
Author Contributions
Funding
Acknowledgments
Conflicts of Interest
References
- Wiggins, S.; Henley, G.; Keats, S. Competitive or Complementary? Industrial Crops and Food Security in Sub-Saharan Africa; Research Reports and Studies; Overseas Development Institute (ODI): London, UK, 2015. [Google Scholar]
- Gasparatos, A.; von Maltitz, G.; Johnson, F.X.; Lee, L.; Mathai, M.; Puppim de Oliveira, J.; Willis, K. Biofuels in Africa: Drivers, impacts and priority policy areas. Renew. Sustain. Energy Rev. 2015, 45, 879–901. [Google Scholar] [CrossRef]
- Boafo, Y.A.; Balde, B.S.; Saito, O.; Gasparatos, A.; Lam, R.D.; Ouedraogo, N.; Chamba, E.; Moussa, Z.P. Stakeholder perceptions of the outcomes of reforms on the performance and sustainability of the cotton sector in Ghana and Burkina Faso: A tale of two countries. Cogent Food Agric. 2018, 4, 1477541. [Google Scholar] [CrossRef]
- Jones, S.; Gibbon, P. Developing agricultural markets in Sub-Saharan Africa: Organic cocoa in rural Uganda. J. Dev. Stud. 2011, 47, 1595–1618. [Google Scholar] [CrossRef]
- Schoneveld, G.C. The geographic and sectoral patterns of large-scale farmland investments in sub-Saharan Africa. Food Policy 2014, 48, 34–50. [Google Scholar] [CrossRef] [Green Version]
- Yengoh, G.T.; Armah, F.A. Effects of large-scale acquisition on food insecurity in Sierra Leone. Sustainability 2015, 7, 9505–9539. [Google Scholar] [CrossRef]
- Yaro, J.A.; Teye, J.K.; Torvikey, G.D. Agricultural commercialisation models, agrarian dynamics and local development in Ghana. J. Peasant Stud. 2017, 44, 538–554. [Google Scholar] [CrossRef]
- Lam, R.D.; Boafo, Y.A.; Degefa, S.; Gasparatos, A.; Saito, O. Assessing the food security outcomes of industrial crop expansion in smallholder settings: Insights from cotton production in Northern Ghana and sugarcane production in Central Ethiopia. Sustain. Sci. 2017, 12, 677–693. [Google Scholar] [CrossRef]
- Herrmann, R.; Jumbe, C.; Bruentrup, M.; Osabuohien, E. Competition between biofuel feedstock and food production: Empirical evidence from sugarcane outgrower settings in Malawi. Biomass Bioenergy 2018, 114, 100–111. [Google Scholar] [CrossRef]
- Mudombi, S.; von Maltitz, G.P.; Gasparatos, A.; Romeu-Dalmau, C.; Johnson, F.X.; Jumbe, C.; Ochieng, C.; Luhanga, D.; Lopes, P.; Balde, B.S.; et al. Multi-dimensional poverty effects around operational biofuel projects in Malawi, Mozambique and Swaziland. Biomass Bioenergy 2018, 114, 41–54. [Google Scholar] [CrossRef]
- White, B.; Borras, S.M.; Hall, R.; Scoones, I.; Wolford, W. The new enclosures: Critical perspectives on corporate land deals. J. Peasant Stud. 2012, 39, 619–647. [Google Scholar] [CrossRef]
- Hall, R.; Scoones, I.; Tsikata, D. Plantations, outgrowers and commercial farming in Africa: Agricultural commercialisation and implications for agrarian change. J. Peasant Stud. 2017, 44, 515–537. [Google Scholar] [CrossRef]
- World Rainforest Movement (WRM). Oil Palm and Rubber Plantations in Western and Central Africa: An Overview; World Rainforest Movement (WRM): Montevideo, Uruguay, 2008. [Google Scholar]
- Romeu-Dalmau, C.; Gasparatos, A.; von Maltitz, G.; Graham, A.; Almagro-Garcia, J.; Wilebore, B.; Willis, K.J. Impacts of land use change due to biofuel crops on climate regulation services: Five case studies in Malawi, Mozambique and Swaziland. Biomass Bioenergy 2018, 114, 30–40. [Google Scholar] [CrossRef]
- Ahmed, A.; Kuusaana, E.D.; Gasparatos, A. The role of chiefs in the political economy of large-scale land acquisitions in Ghana: Insights from the jatropha sector. Land Use Policy 2018, 75, 570–582. [Google Scholar] [CrossRef]
- Ndjimbi, F. Étude sur l’impact des plantations agro-industrielles de palmiers à huile et d’hévéas sur les populations du Gabon; World Rainforest Movement (WRM): Montevideo, Uruguay, 2013. [Google Scholar]
- Achterbosch, T.; Van Berkum, S.; Meijerink, G. Cash Crops and Food Security: Contributions to Income, Livelihood Risk and Agricultural Innovation; LEI Wageningen UR: Wageningen, The Netherlands, 2014. [Google Scholar]
- Negash, M.; Swinnen, J.F.M. Biofuels and Food Security: Micro-evidence from Ethiopia. Energy Policy 2013, 61, 963–976. [Google Scholar] [CrossRef]
- German, L.; Schoneveld, G.C.; Pacheco, P. The social and environmental impacts of biofuel feedstock cultivation: Evidence from multi-site research in the forest frontier. Ecol. Soc. 2011, 16, 24. [Google Scholar] [CrossRef]
- Chinsinga, B. The Green Belt Initiative, Politics and Sugar Production in Malawi. J. South. Afr. Stud. 2017, 43, 501–515. [Google Scholar] [CrossRef]
- Matenga, C.R.; Hichaambwa, M. Impacts of land and agricultural commercialisation on local livelihoods in Zambia: Evidence from three models. J. Peasant Stud. 2017, 44, 574–593. [Google Scholar] [CrossRef]
- Madelaine, C.; Malezieux, E.; Sibelet, N.; Manlay, R.J. Semi-wild pal groves reveal agricultural change in the forest region of Guinea. Agrofor. Syst. 2008, 73, 189–204. [Google Scholar] [CrossRef]
- Black, R.; Sessay, M. Forced migration, land-use change and political economy in the Forest Region of Guinea. Afr. Aff. 1997, 96, 587–605. [Google Scholar] [CrossRef]
- Delarue, J.; Cochet, H. Systemic Impact Evaluation: A Methodology for Complex Agricultural Development Projects. The Case of a Contract Farming Project in Guinea. Eur. J. Dev. Res. 2013, 25, 778–796. [Google Scholar] [CrossRef]
- Carrere, R. Oil Palm in Africa: Past, Present and Future Scenarios; World Rainforest Movement (WRM): Montevideo, Uruguay, 2010. [Google Scholar]
- Sy, M.A. Étude sur la filière artisanale de l’huile de palme en Guinée; MAE/BCEPA—PASAL: Conakry, Guinea, 2002. [Google Scholar]
- Agence Française de Développement (AFD). Developing Smallholder Rubber Production: Lessons from AFD’s Experience; Agence Française de Développement (AFD): Paris, France, 2008. [Google Scholar]
- Carletto, C.; Zezza, A.; Banerjee, R. Towards better measurement of household food security: Harmonizing Indicators and the role of household surveys. Glob. Food Secur. 2013, 2, 30–40. [Google Scholar] [CrossRef]
- Jones, A.D.; Ngure, F.M.; Pelto, G.; Young, S.L. What are we assessing when we measure food security? A compendium and review of current metrics. Adv. Nutr. 2013, 4, 481–505. [Google Scholar] [CrossRef] [PubMed]
- Maxwell, D.; Vaitla, B.; Coates, J. How do indicators of household food insecurity measure up? An empirical comparison from Ethiopia. Food Policy 2014, 47, 107–116. [Google Scholar] [CrossRef]
- Vaitla, B.; Coates, J.; Glaeser, L.; Hillbruner, C.; Biswal, P.; Maxwell, D. The measurement of household food security: Correlation and latent variable analysis of alternative indicators in a large multi-country dataset. Food Policy 2017, 68, 193–205. [Google Scholar] [CrossRef]
- Johnson, F.X.; Nyambane, A.; von Maltitz, G.; Luhanga, D.; Jarzebski, M.; Balde, B.S.; Gasparatos, A. Impacts of Biofuel Crop Production in Southern Africa: Land Use Change, Ecosystem Services, Poverty Alleviation and Food Security; Ecosystem Services for Poverty Alleviation (ESPA): Edinburg, UK, 2018. [Google Scholar]
- Thornhill, S.; Vargyas, E.; Fitzgerald, T.; Chisholm, N. Household food security and biofuel feedstock production in rural Mozambique and Tanzania. Food Secur. 2016, 8, 953–971. [Google Scholar] [CrossRef]
- Anderman, T.L.; Remans, R.; Wood, S.A.; DeRosa, K.; DeFries, R.S. Synergies and tradeoffs between cash crop production and food security: A case study in rural Ghana. Food Secur. 2014, 6, 541–554. [Google Scholar] [CrossRef]
- Hassen, K.; Zinab, B.; Belachew, T. Gender and education as predictors of food insecurity among coffee farming households of the Jimma zone, Southwest of Ethiopia. BMC Nutr. 2016, 2, 75. [Google Scholar] [CrossRef]
- Von Maltitz, G.; Gasparatos, A.; Fabricius, C.; Morris, A.; Willis, K.J. Jatropha cultivation in Malawi and Mozambique: Impact on ecosystem services, local human wellbeing and poverty alleviation. Ecol. Soc. 2016, 21, 3. [Google Scholar] [CrossRef]
- De Cock, N.; D’Haese, M.; Vink, N.; van Rooyen, C.J.; Staelens, L.; Schonfeldt, H.C.; D’Haese, L. Food security in rural areas of Limpopo province, South Africa. Food Secur. 2013, 5, 269–282. [Google Scholar] [CrossRef] [Green Version]
- Baiyegunhi, L.J.S.; Oppong, B.B.; Senyolo, G.M. Mopane worn (Imbrasia belina) and rural household food security in Limpopo province, South Africa. Food Secur. 2016, 8, 153–165. [Google Scholar] [CrossRef]
- Kissoly, L.; Fabe, A.; Grote, U. The integration of smallholders in agricultural value chain activities and food security: Evidence from rural Tanzania. Food Secur. 2017, 9, 1219–1235. [Google Scholar] [CrossRef]
- World Food Programme (WFP). Comprehensive Food Security and Vulnerability Analysis Guidelines; World Food Programme (WFP): Rome, Italy, 2009. [Google Scholar]
- World Food Programme (WFP). Food Consumption Analysis: Calculation and Use of the Food Consumption Score in Food Consumption and Food Security Analysis; World Food Programme (WFP): Rome, Italy, 2007. [Google Scholar]
- Dietchler, M.; Ballard, T.; Swindale, A.; Coates, J. Validation of a Measure of Household Hunger for Cross Cultural Use; United States Agency for International Development (USAID): Washington, DC, USA, 2010.
- Coates, J.; Swindale, A.; Bilinsk, P. Household Food Insecurity Access Scale (HFIAS) for Measurement of Food Access: Indicator Guide; United States Agency for International Development (USAID): Washington, DC, USA, 2007.
- Maxwell, D.; Caldwell, R. The Coping Strategies Index: Field Methods Manual, 3rd ed.; United States Agency for International Development (USAID): Washington, DC, USA, 2008.
- Maxwell, D.; Watkins, B.; Wheeler, R.; Collins, G. The Coping Strategies Index: Field Methods Manual, 1st ed.; United States Agency for International Development (USAID): Washington, DC, USA, 2003.
- Swindale, A.; Bilinsky, P. Months of Adequate Household Food Provisioning (MAHFP) for Measurement of Household Food Access; United States Agency for International Development (USAID): Washington, DC, USA, 2007.
- Rosenbaum, P.R.; Rubin, D.B. The central role of the propensity score in observational studies for causal effects. Biometrika 1983, 70, 41–55. [Google Scholar] [CrossRef] [Green Version]
- Chiputwa, B.; Spielman, D.J.; Qaim, M. Food Standards, Certification and Poverty among Coffee Farmers in Uganda. World Dev. 2015, 66, 400–412. [Google Scholar] [CrossRef]
- Mwangi, J.K.; Crewett, W. The impact of irrigation on small-scale African indigenous vegetable Growers’ market access in peri-urban Kenya. Agric. Water Manag. 2019, 212, 295–305. [Google Scholar] [CrossRef]
- Gitonga, Z.M.; De Groote, H.; Kassie, M.; Tefera, T. Impact of metal silos on households’ maize storage, storage losses and food security: An application of a propensity score matching. Food Policy 2013, 43, 44–55. [Google Scholar] [CrossRef]
- Mitiku, F.; de Mey, Y.; Nyssen, J.; Maertens, M. Do Private Sustainability Standards Contribute to Income Growth and Poverty Alleviation? A Comparison of Different Coffee Certification Schemes in Ethiopia. Sustainability 2017, 9, 246. [Google Scholar] [CrossRef]
- Awotide, B.A.; Alene, A.D.; Abdoulaye, T.; Manyong, V.M. Impact of agricultural technology adoption on asset ownership: The case of improved cassava varieties in Nigeria. Food Secur. 2015, 7, 1239–1258. [Google Scholar] [CrossRef]
- Caliendo, M.; Kopeinig, S. Some practical guidance for the implementation of propensity score matching. J. Econ. Surv. 2008, 22, 31–72. [Google Scholar] [CrossRef]
- Rosenbaum, P.R.; Rubin, D.B. Constructing a control group using multivariate matched sampling methods that incorporate the propensity score. Am. Stat. 1985, 39, 33–38. [Google Scholar]
- Mathiassen, A.; Hollema, S. What is the effect of physical activity level on food consumption, energy deficiency and dietary diversity? Food Nutr. Bull. 2014, 35, 351–360. [Google Scholar] [CrossRef]
- Feleke, S.; Kilmer, R.L.; Gladwin, C. Determinants of food security in Southern Ethiopia. Agric. Econ. 2005, 33, 351–363. [Google Scholar] [CrossRef]
- Kaloi, E.; Tayebwa, B.; Bashaasha, B. Food security status of households in Mwingi district, Kenya. Afr. Crop Sci. Conf. Proc. 2005, 7, 867–873. [Google Scholar]
- Turyahabwe, N.; Kakuru, W.; Tweheyo, M.; Tumusiime, D.M. Contribution of wetland resources to household food security in Uganda. Agric. Food Secur. 2013, 2, 5. [Google Scholar] [CrossRef] [Green Version]
- Silvestri, S.; Sabine, D.; Patti, K.; Wiebke, F.; Maren, R.; Ianetta, M.; Carlos, Q.F.; Mario, H.; Anthony, N.; Nicolas, N.; et al. Households and food security: Lessons from food secure households in East Africa. Agric. Food Secur. 2015, 4, 23. [Google Scholar] [CrossRef]
- Famine Early Warning Systems Network (FEWS NET). Guinea. Food Security Outlook: October 2016 through May 2017; Famine Early Warning Systems Network (FEWS NET): Washington, DC, USA, 2017. [Google Scholar]
- Famine Early Warning Systems Network (FEWS NET). Guinea Food Security Outlook: February through September 2017; Famine Early Warning Systems Network (FEWS NET): Washington, DC, USA, 2017. [Google Scholar]
- Famine Early Warning Systems Network (FEWS NET). Liberia Food Security Outlook: February to September 2016; Famine Early Warning Systems Network (FEWS NET): Washington, DC, USA, 2017. [Google Scholar]
- Manda, J.; Gardebroek, C.; Khonje, M.G.; Alene, A.D.; Mutenje, M.; Kassie, M. Determinants of child nutritional status in the eastern province of Zambia: The role of improved maize varieties. Food Secur. 2016, 8, 239–253. [Google Scholar] [CrossRef]


| Variables | Definition and Measurement |
|---|---|
| Household Food Security Indicators | |
| Food consumption score (FCS) | Composite measure of diet diversity. Includes questions about the different food groups (and their nutritional value) consumed by the household in the 7 days prior to the survey [40,41]. |
| Household food insecurity access scale (HFIAS) | Composite measure of perceptions of hunger. Includes questions about the prevalence, acceptability and anxiety over insecure access to food in the four weeks prior to the survey [30,42,43]. |
| Household hunger scale (HHS) | Composite measure of perceptions of hunger. It comprises the final three questions of the HFIAS, all of which pertain to the consequences of severe food insecurity [29]. |
| Coping strategy index (CSI) | Composite measure of coping attitudes during periods of food insecurity. It contains questions about the frequency and severity of behaviors in which households engage when not having enough food or enough money to buy food [44,45]. |
| Reduced coping strategy index (rCSI) | Composite measure of coping attitudes during periods of food insecurity. It aggregates the five (pre-weighted) coping strategies employed in response to food shortages [44]. |
| Months of inadequate household food provisioning (MIHFP) | Number of months in the past year that a household was not able to provide itself with enough food [46]. |
| Household Characteristics | |
| Household size | Number of persons living in the household |
| Gender of household head | 1 = female-headed household, 0 = otherwise |
| Origin of respondent | 1 = born in the community, 0 = otherwise |
| Dependency ratio | Percentage: Ratio of dependent household members (i.e., members younger than 15 or older than 65) to household members of working age (i.e., 15–65 years) |
| Off-farm income | USD: Income related to off-farm activities, such as casual work or selling woodland products |
| Child mortality ratio | Percentage: Ratio of children deceased, to the total number of deceased members in the household |
| Livestock ownership | Tropical Livestock Unit (TLU): Aggregate measure of livestock ownership calculated based on the number of livestock species using conversion factors for livestock in Sub-Sahara Africa countries. |
| Total household income | USD: includes off-farm and farm income |
| Monthly food expenditure | USD |
| Amount borrowed to purchase food | USD |
| Agricultural Characteristics | |
| Ratio of land given to SOGUIPAH to current land (%) | Percentage: Ratio of the household cultivated land that was given to SOGUIPAH to the current cultivated land |
| Size of cultivated land | ha |
| Size of natural palm groves | ha |
| Household Characteristics | Rubber Growers (Group 1) | Oil Palm Growers (Group 2) | Subsistence Farmers (Group 3) | Group 1 vs. Group 2 | Group 2 vs. Group 3 | Group 1 vs. Group 2 |
|---|---|---|---|---|---|---|
| Mean score (Standard deviation) | (Mean difference) p-value | |||||
| Household size (number) | 8.20 (5.96) | 10.84 (8.39) | 6.34 (4.30) | (1.85) 0.037 ** | (4.49) 0.000 *** | (−2.64) 0.057 * |
| Dependency ratio (%) | 7.80 (22.09) | 12.01 (24.09) | 16.68 (55.64) | (−8.88) 0.202 | (−4.67) 0.629 | (−4.21) 0.358 |
| Off-farm income (USD) | 64.95 (165.63) | 75.13 (201.6) | 28.07 (62.45) | (36.88) 0.088 * | (47.06) 0.080 * | (−10.18) 0.776 |
| Adult mortality (number) | 2.28 (1.76) | 1.82 (1.29) | 2.68 (1.91) | (−0.40) 0.211 | (−0.86) 0.022 ** | (0.46) 0.176 |
| Child mortality (number) | 0.65 (0.87) | 0.58 (0.85) | 1.12 (1.24) | (−0.46) 0.019 ** | (−0.54) 0.037 ** | (0.07) 0.706 |
| Child mortality ratio (%) | 22.96 (34.92) | 30.45 (58.23) | 23.83 (31.84) | (−0.87) 0.877 | (6.62) 0.455 | (−7.49) 0.396 |
| Cultivated land (ha) | 7.17 (12.11) | 7.51 (7.84) | 5.07 (6.94) | (2.10) 0.213 | (2.43) 0.105 * | (−0.33) 0.879 |
| Land given to SOGUIPAH (ha) | 17.50 (39.63) | 28.95 (97.66) | 23.79 (44.26) | (−6.29) 0.371 | (5.15) 0.712 | (−11.45) 0.378 |
| Ratio of land given to SOGUIPAH to current land (%) | 446 (1378) | 732.6 (2469) | 1262 (2557) | (−815.67) 0.017 ** | (−529) 0.309 | (−286.4) 0.430 |
| Home garden area (ha) | 3.25 (6.98) | 4.56 (9.48) | 3.31 (3.48) | (−0.05) 0.957 | (1.25) 0.332 | (−1.31) 0.410 |
| Natural palm grove area (ha) | 2.53 (3.10) | 1.45 (2.01) | 0.81 (1.74) | (1.72) 0.000 *** | (0.64) 0.092 * | (1.08) 0.056 * |
| Livestock (TLU) | 1.16 (5.85) | 0.28 (0.88) | 0.65 (1.56) | (0.513) 0.488 | (−0.37) 0.189 | (0.88) 0.365 |
| Income (USD) | 754.30 (1075) | 1406 (1429) | 421.58 (1156) | (332.7) 0.077 * | (984.55) 0.000 *** | (−651.8) 0.008 *** |
| Monthly food expenditure (USD) | 69.39 (112.10) | 68.56 (111.8) | 38.22 (54.95) | (31.17) 0.041 ** | (30.34) 0.066 * | (0.83) 0.971 |
| Amount borrowed for food (USD) | 52.33 (90.54) | 34.16 (76.44) | 66.68 (155.19) | (−14.35) 0.495 | (32.51) 0.235) | (18.16) 0.296 |
| Metrics | Rubber Growers (Group 1) | Oil Palm Growers (Group 2) | Subsistence Farmers (Group 3) | Group 1 vs. Group 2 | Group 2 vs. Group 3 | Group 1 vs. Group 2 |
|---|---|---|---|---|---|---|
| Mean score (Standard deviation) | (Mean difference) p-value | |||||
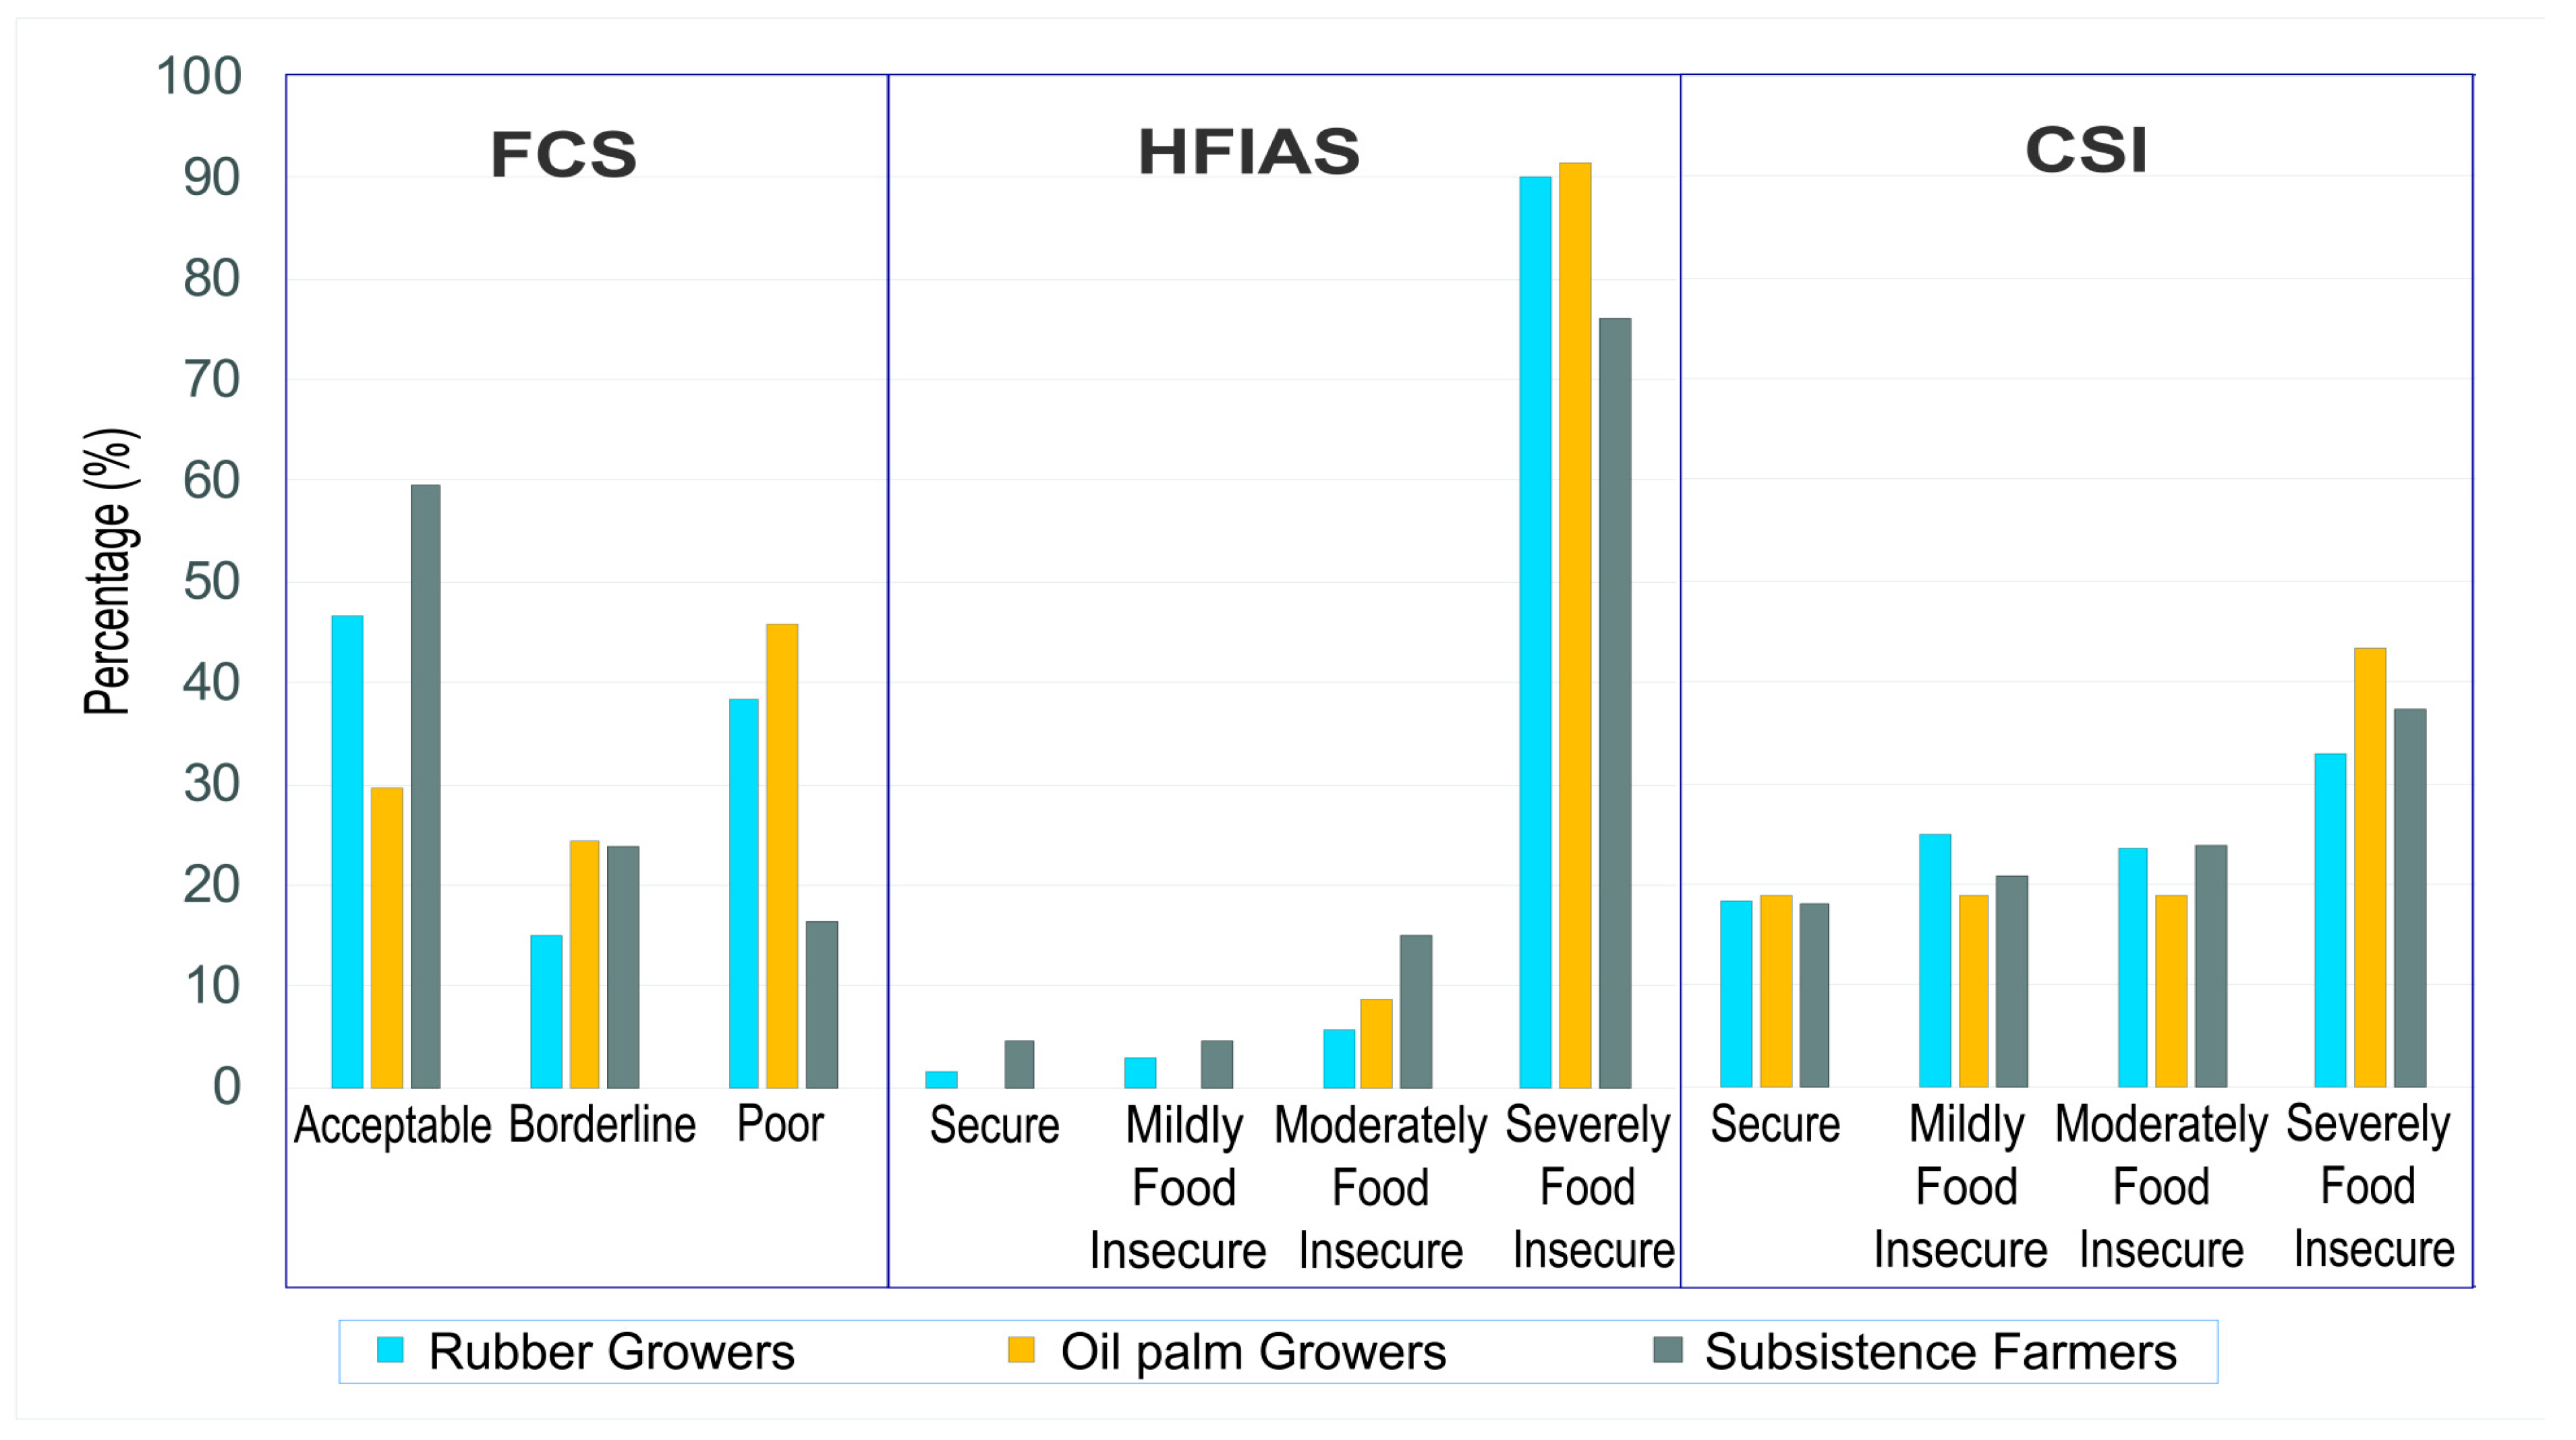
| FCS | 35.03 (21.42) | 34.43 (22.51) | 45.18 (19.83) | (−10.15) 0.004 *** | (−10.75) 0.013 *** | (0.59) 0.892 |
| HFIAS | 10.53 (6.68) | 7.78 (5.61) | 11.37 (6.02) | (−0.85) 0.430 | (−3.59) 0.004 *** | (2.74) 0.033 ** |
| CSI | 30.53 (33.12) | 40.51 (38.07) | 32.75 (32.18) | (−2.22) 0.686 | (7.77) 0.273 | (−9.99) 0.115 |
| MIHFP | 2.64 (2.51) | 3.30 (2.63) | 2.24 (1.83) | (0.41) 0.277 | (1.06) 0.018 ** | (−0.65) 0.204 |
| Rubber Growers vs. Subsistence Farmers | Oil Palm Growers vs. Subsistence Farmers | |||||||
|---|---|---|---|---|---|---|---|---|
| Parameters | Treated | Untreated | Difference (S.E) | T-stat | Treated | Untreated | Difference (S.E) | T-stat |
| NNM | ||||||||
| Unmatched | 35.03 | 45.18 | −10.15 (3.47) | −2.93 | 34.43 | 45.18 | −10.75 (4.26) | −2.52 |
| ATT | 35.03 | 19.22 | 15.80 (14.41) | 1.10 | 34.43 | 12.95 | 21.49 (13.48) | 1.59 * |
| CBM | ||||||||
| Unmatched | 35.03 | 45.18 | −10.15 (3.47) | −2.93 | 34.43 | 45.18 | −10.75 (4.26) | −2.52 |
| ATT | 33.68 | 52.80 | −19.13 (8.07) | −2.37 ** | 22.80 | 30.40 | −7.60 (14.95) | −0.51 |
| KBM | ||||||||
| Unmatched | 35.03 | 45.18 | −10.15 (3.47) | −2.93 | 34.43 | 45.18 | −10.75 (4.26) | −2.52 |
| ATT | 32.78 | 39.77 | −6.99 (5.98) | −1.17 | 37.19 | 9.37 | 27.82 (17.43) | 1.60 * |
| HFIAS NNM | ||||||||
| Unmatched | 10.53 | 11.37 | −0.85 (1.07) | −0.79 | 7.78 | 11.37 | −3.59 (1.20) | −2.98 |
| ATT | 10.53 | 16.54 | −6.01 (4.15) | −1.45 * | 7.78 | 16.62 | −8.84 (4.39) | −2.01 ** |
| CBM | ||||||||
| Unmatched | 10.53 | 11.37 | −0.85 (1.07) | −0.79 | 7.78 | 11.37 | −3.59 (1.20) | −2.98 |
| ATT | 10.40 | 11.35 | −0.95 (2.27) | −0.42 | 4.60 | 11.60 | −7.00 (3.14) | −2.23 ** |
| KBM | ||||||||
| Unmatched | 10.53 | 11.37 | −0.85 (1.07) | −0.79 | 7.78 | 11.37 | −3.59 (1.20) | −2.98 |
| ATT | 10.25 | 12.53 | −2.28 (1.70) | −1.34 * | 8.32 | 17.52 | −9.20 (5.24) | −1.75 ** |
| CSI NNM | ||||||||
| Unmatched | 30.53 | 32.75 | −2.22 (5.48) | −0.41 | 40.51 | 32.75 | 7.77 (7.04) | 1.10 |
| ATT | 30.53 | 59.38 | −28.86 (18.14) | −1.59 * | 40.51 | 60.73 | −20.22 (29.42) | −0.69 |
| CBM | ||||||||
| Unmatched | 30.53 | 32.75 | −2.22 (5.48) | −0.41 | 40.51 | 32.75 | 7.77 (7.04) | 1.10 |
| ATT | 28.00 | 25.60 | 2.40 (10.16) | 0.24 | 56.00 | 32.60 | 23.40 (30.50) | 0.77 |
| KBM | ||||||||
| Unmatched | 30.53 | 32.75 | −2.22 (5.48) | −0.41 | 40.51 | 32.75 | 7.77 (7.04) | 1.10 |
| ATT | 27.72 | 33.11 | −5.39 (9.38) | −0.57 | 39.68 | 69.42 | −29.74 (28.31) | −1.05 |
| Outcome Equation | FCS | HFIAS | CSI |
|---|---|---|---|
| Coefficient (Standard Error) | |||
| Household size | 0.99 *** (0.30) | 0.21 ** (0.10) | −0.46 (0.53) |
| Dependency ratio | −0.09 ** (0.04) | 0.02 * (0.01) | −0.07 (0.06) |
| Ratio of land given to SOGUIPAH to current land | 0.0002 (0.001) | 7E-05 (0.0003) | −0.002 (0.001) |
| Home garden area | 0.09 (0.27) | 0.08 (0.09) | −0.05 (0.47) |
| Natural palm grove area | 2.70 *** (0.61) | 0.28 (0.20) | 1.73 * (1.03) |
| Livestock | −0.29 (0.34) | −0.04 (0.11) | 1.11 * (0.59) |
| Monthly food expenditure | 0.004 (0.02) | −0.002 (0.006) | 0.05 * (0.03) |
| Annual food expenditure | 0.003 ** (0.002) | 0.0001 (0.001) | 0.001 (0.003) |
| Amount borrowed for food | −0.02 (0.01) | 0.01 **(0.004) | −0.01 (0.02) |
| Origin of respondent | −0.24 (5.09) | −0.03 (1.89) | 10.50 (9.82) |
| Gender of household head | 2.64 (3.76) | −0.03 (1.40) | 1.40 (7.27) |
| Participation in industrial crop production (1 = Rubber, 0 = Subsistence) | −32.97 *** (9.18) | −9.61 *** (3.50) | −52.65 *** (11.87) |
| Constant | 44.73 *** (6.07) | 13.03 *** (2.29) | 49.14 *** (10.59) |
| Treatment Equation | |||
| Off-farm income | 0.002 (0.001) | 0.002 * (0.001) | 0.003 ** (0.001) |
| MIHFP | 0.09 ** (0.05) | 0.06 (0.04) | 0.07 (0.04) |
| Income | 0.0002 **(9E-05) | 0.0002 *** (8E-05) | 0.0002 *** (8E-05) |
| Origin of respondent | 0.50 (0.33) | 0.47 (0.32) | 0.49 (0.31) |
| Gender of household head | 0.02 (0.25) | 0.06 (0.25) | −0.03 (0.24) |
| Constant | −0.81 ** (0.35) | −0.73 ** (0.34) | −0.71 ** (0.33) |
| /athrho | 0.59 * (0.33) | 1.01 ** (0.44) | 0.995 *** (0.27) |
| /lnsigma | 2.96 *** (0.11) | 1.98 (0.15) | 3.63 *** (0.11) |
| rho | 0.53 (0.24) | 0.77 (0.18) | 0.76 (0.12) |
| sigma | 19.35 (2.12) | 7.27 (1.09) | 37.83 (4.04) |
| lambda | 10.23 (5.59) | 5.58 (2.11) | 28.74 (7.13) |
| Number of observations | 143 | 143 | 143 |
| Wald chi2(12) | 55.73 *** | 31.67 *** | 30.48 *** |
| Log likelihood | −706.41 | −784.44 | |
| Outcome Equation | FCS | HFIAS | CSI |
|---|---|---|---|
| Coefficient (Standard Error) | |||
| Household size | 0.17 (0.34) | 0.05 (0.09) | −1.45 *** (0.55) |
| Dependency ratio | −0.07 * (0.04) | 0.02 (0.01) | −0.02 (0.06) |
| Ratio of land given to SOGUIPAH to current land | −0.0002 (0.001) | −6E-05 (0.0002) | −0.001 (0.001) |
| Home garden area | 0.53 * (0.31) | 0.33 *** (0.09) | 1.43 *** (0.52) |
| Natural palm grove area | 3.62 *** (1.03) | 0.39 (0.29) | 2.58 (1.71) |
| Livestock | −2.12 (1.39) | −0.24 (0.41) | −0.97 (2.29) |
| Monthly food expenditure | −0.04 (0.02) | −0.004 (0.007) | 0.04 (0.04) |
| Annual food expenditure | −0.0005 (0.002) | −0.001 ** (0.0006) | −0.002 (0.003) |
| Amount borrowed for food | −0.02 (0.02) | 0.01 ** (0.004) | −0.02 (0.03) |
| Origin of respondent | 12.27 ** (5.60) | 3.49 ** (1.74) | −1.47 (9.16) |
| Gender of household head | −6.59 (4.32) | −0.87 (1.35) | 8.82 (7.11) |
| Participation in industrial crop production (1 = oil palm, 0 = subsistence) | −22.04 *** (8.16) | −9.77 *** (2.74) | −0.95 (11.94) |
| Constant | 38.84 *** (6.43) | 8.84 *** (2.02) | 40.51 *** (10.40) |
| Treatment Equation | |||
| Off-farm income | 0.002 (0.002) | 0.003 * (0.002) | 0.002 (0.002) |
| MIHFP | 0.22 *** (0.06) | 0.21 *** (0.06) | 0.19 *** (0.07) |
| Income | 0.0004 *** (0.0001) | 0.0003 *** (0.0001) | 0.0004 ***(0.0001) |
| Origin of respondent | 0.94 ** (0.45) | 0.64 (0.45) | 0.91 ** (0.46) |
| Gender of household head | −0.002 (0.32) | −0.03 (0.31) | −0.04 (0.31) |
| Constant | −2.16 *** (0.53) | −1.95 *** (0.55) | −2.08 *** (0.55) |
| /athrho | 0.26 (0.32) | 0.88 * (0.46) | 0.23 (0.26) |
| /lnsigma | 2.91 *** (0.08) | 1.75 *** (0.13) | 3.41 *** (0.07) |
| rho | 0.25 (0.30) | 0.70 (0.23) | 0.22 (0.25) |
| sigma | 18.44 (1.43) | 5.78 (0.74) | 30.35 (2.25) |
| lambda | 4.63 (5.65) | 4.07 (1.79) | 6.81 (7.69) |
| Number of observations | 104 | 104 | 104 |
| Wald chi2(12) | 34.69 *** | 41.49 *** | 29.99 *** |
| Log likelihood | −503.57 | −369.88 | −555.67 |
| Analysis | Metric/Test | Rubber Grower vs. Subsistence Farmers | Oil palm Growers vs. Subsistence Farmers | ||
| Effect on Metric | Comment | Effect on Metric | Comment | ||
| PSM | FCS | ||||
| NNM (ATT) | 15.80 (14.41) | Positive effect on food security (not significant) | 21.49 * (13.48) | Positive effect on food security (low significance) | |
| CBM (ATT) | −19.13 ** (8.07) | Negative effect on food security (significant) | −7.60 (14.95) | Negative effect on food security (not significant) | |
| KBM (ATT) | −6.99 (5.98) | Negative effect on food security (not significant) | 27.82 * (17.43) | Positive effect on food security (low significance) | |
| HFIAS | |||||
| NNM (ATT) | −6.01 * (4.15) | Positive effect on food security (low significance) | −8.84 ** (4.39) | Positive effect on food security (significant) | |
| CBM (ATT) | −0.95 (2.27) | Positive effect on food security (not significant) | −7.00 ** (3.14) | Positive effect on food security (significant) | |
| KBM (ATT) | −2.28 * (1.70) | Positive effect on food security (low significance) | −9.20 ** (5.24) | Positive effect on food security (significant) | |
| CSI | |||||
| NNM (ATT) | −28.86 * (18.14) | Positive effect on food security (low significance) | −20.22 (29.42) | Positive effect on food security (not significant) | |
| CBM (ATT) | 2.40 (10.16) | Negative effect on food security (not significant) | 23.40 (30.50) | Negative effect on food security (not significant) | |
| KBM (ATT) | −5.39 (9.38) | Positive effect on food security (not significant) | −29.74 (28.31) | Positive effect on food security (not significant) | |
| ETER | FCS | ||||
| ATE | −32.97 ***(9.18) | Negative effect on food security (significant) | −22.04 *** (8.16) | Negative effect on food security (significant) | |
| HFIAS | |||||
| ATE | −9.61 *** (3.50) | Positive effect on food security (significant) | −9.77 *** (2.74) | Positive effect on food security (significant) | |
| CSI | |||||
| ATE | −52.65 *** (11.87) | Positive effect on food security (significant) | −0.95 (11.94) | Positive effect on food security (not significant) | |
© 2019 by the authors. Licensee MDPI, Basel, Switzerland. This article is an open access article distributed under the terms and conditions of the Creative Commons Attribution (CC BY) license (http://creativecommons.org/licenses/by/4.0/).
Share and Cite
Balde, B.S.; Diawara, M.; Rossignoli, C.M.; Gasparatos, A. Smallholder-Based Oil Palm and Rubber Production in the Forest Region of Guinea: An Exploratory Analysis of Household Food Security Outcomes. Agriculture 2019, 9, 41. https://doi.org/10.3390/agriculture9020041
Balde BS, Diawara M, Rossignoli CM, Gasparatos A. Smallholder-Based Oil Palm and Rubber Production in the Forest Region of Guinea: An Exploratory Analysis of Household Food Security Outcomes. Agriculture. 2019; 9(2):41. https://doi.org/10.3390/agriculture9020041
Chicago/Turabian StyleBalde, Boubacar Siddighi, Mamady Diawara, Cristiano M. Rossignoli, and Alexandros Gasparatos. 2019. "Smallholder-Based Oil Palm and Rubber Production in the Forest Region of Guinea: An Exploratory Analysis of Household Food Security Outcomes" Agriculture 9, no. 2: 41. https://doi.org/10.3390/agriculture9020041
APA StyleBalde, B. S., Diawara, M., Rossignoli, C. M., & Gasparatos, A. (2019). Smallholder-Based Oil Palm and Rubber Production in the Forest Region of Guinea: An Exploratory Analysis of Household Food Security Outcomes. Agriculture, 9(2), 41. https://doi.org/10.3390/agriculture9020041