1. Introduction
Functionally graded materials (FGMs), with a continuous distribution or function which is originally used for elimination of thermal stresses [
1,
2] have widely expanded their application in designing electronic, biological and optical devices. These materials can present unique properties such as insulators in thin film transistors [
3], thermoelectric conversion [
4], optical spacers or electron/hole blocking/transporting layer in photovoltaic systems [
5,
6] biomaterial manufacturing [
7], and aerospace technologies [
8]. Out-of-plane composition gradient, as well as coherent epitaxy films, namely epitaxial composition graded (ECG) films as a category of FGMs, have been studied recently since their physical properties can be significantly modified by lattice strain [
9]. Examples of previous research on strain-induced physical properties of thin films include enhancement of the electron mobility in relaxed Si-Ge films [
10], increase of superconducting critical temperature in La
1.85Sr
0.15CuO
4 on LaSrAlO
4 substrates [
11], and transformation temperature from ferromagnetic metal La
1−xSr
xMnO
3 (0.3 ≤
x ≤ 0.5) into an antiferromagnetic insulator [
12].
Among these research fields, strain effects on transition temperature of La
1−xSr
xMnO
3 (LSMO) have attracted significant attention, since it is found that the epitaxial strain of LSMO would highly depress
TC compared to its bulk counterpart [
13,
14,
15]. Ahn and Millis concluded that a biaxial strain could strengthen the Jahn-Teller distortion, further increase the splitting of the
eg electron band and thereby reinforce the tendency of the electrons to become localized [
16]. Based on this model, the dependence of
TC on the biaxial strain can be expressed as:
where ε
B is the bulk strain, ε
bi is the biaxial strain, α = (1/
TC)d
TC/dε
B is related to the unit volume cell variations under strain and β accounts for the Jahn-Teller energy splitting. According to Equation (1), as soon as the biaxial strain exists, it always leads to a reduction in
TC. Thus, a process to relax the strain in doped manganite thin films would be the key to increasing of
TC and ECG thin film is expected as a promising candidate in strain modification. This may produce “new” materials with the properties that are not available in the individual component phases, which might also open up various new possibilities of designing new nanoscale structures with unusual cross coupled properties [
17,
18,
19,
20]. However, the main challenges of ECG thin films are mainly concerning the massive production and characterization in nanoscale.
Several thin film techniques have been reported to fabricate ECG thin films, such as pulsed laser deposition (PLD), sputtering, chemical vapor deposition (CVD), atomic layer deposition (ALD), laser ablation and sol-gel process [
21,
22,
23,
24,
25]. Among these fabrication methods, PLD and sputtering with dual-beam have been proposed as useful techniques due to their capability to synthesize high-quality thin films. Hussey and Gupta [
26] reported a dual-beam, dual-target PLD method by using YBa
2O
δ and CuO targets simultaneously for obtaining superconducting YBaCuO
7−δ films. On the other hand, by using deposition by RF power co-sputtering, Kawakubo
et al. [
27] achieved ECG Ba
xSr
1−xTiO
3 thin films with both SrTiO
3 and BaTiO
3 targets sputtered in various plasma power ratios. Compared to PLD, magnetron co-sputtering can provide a cost-effective, high-throughput and relatively low temperature process with large area scalability and co-sputtering capability and thus, it can be attractive for industry applications [
20]. However, obtaining thin films with both high-quality coherent epitaxy and low defect density is a major challenge for the co-sputtering technique. Additionally, characterization of the ECG structure especially at the nanoscale is another difficult task.
Very recently, we reported on a novel method to fabricate Sr-doped composition gradient epitaxial LSMO thin films via magnetron co-sputtering [
28]. The initial θ–2θ X-ray diffraction (XRD) results suggested that the gradient composition provides a strain relaxation mechanism in the film. In this paper, we conducted an in depth microstructural study of the composition gradient LSMO film in order to explore the strain relaxation process. For comparison purposes, pure LaMnO
3 (LMO) and La
0.67Sr
0.33MnO
3 thin films were also included in the study. The characterization of the minute variations in the lattice parameter due to composition gradient in ECG thin films (normally in the Å scale) is a major challenge. It is hard to visually display this small variation even by using high-resolution transmission electron microscopy (HRTEM). In this article, a series of low angle XRD patterns were obtained by varying the incident angle in order to characterize the graded structure of the ECG LSMO thin film. This approach actually offers a relatively easy, fast, and non-destructive way to study the graded structure directly. Moreover, HRTEM measurements and selected-area electron diffraction (SAED) patterns were taken from the ECG LSMO film cross sections to determine lattice parameter variations along the film thickness. Finally, the above studies were complemented with Energy-dispersive X-ray Spectroscopy (EDS) measurements along the film cross-section and (001) pole figure pattern analysis.
2. Experimental Section
Epitaxial LMO, La
0.67Sr
0.33MnO
3 and ECG LSMO thin films were synthesized on 10 mm × 10 mm (001) LaAlO
3 (LAO) single crystal substrates by utilizing a home-built three-gun magnetron sputtering vacuum system with both DC and RF power capability. The system was pumped down to a base vacuum of 5.0 × 10
−8 Torr by a cryo pump. High purity Ar (99.999%) was flown into the chamber at a flow rate of 30 sccm and the chamber pressure was maintained at 10 mTorr during deposition. The composition uniform LMO and LSMO thin films were both deposited using 30 W RF power at a substrate temperature of 750 °C for 2 h. The ECG sample, however, was fabricated by using a co-sputtering deposition process. Both LMO and La
0.67Sr
0.33MnO
3 targets were utilized in the deposition.
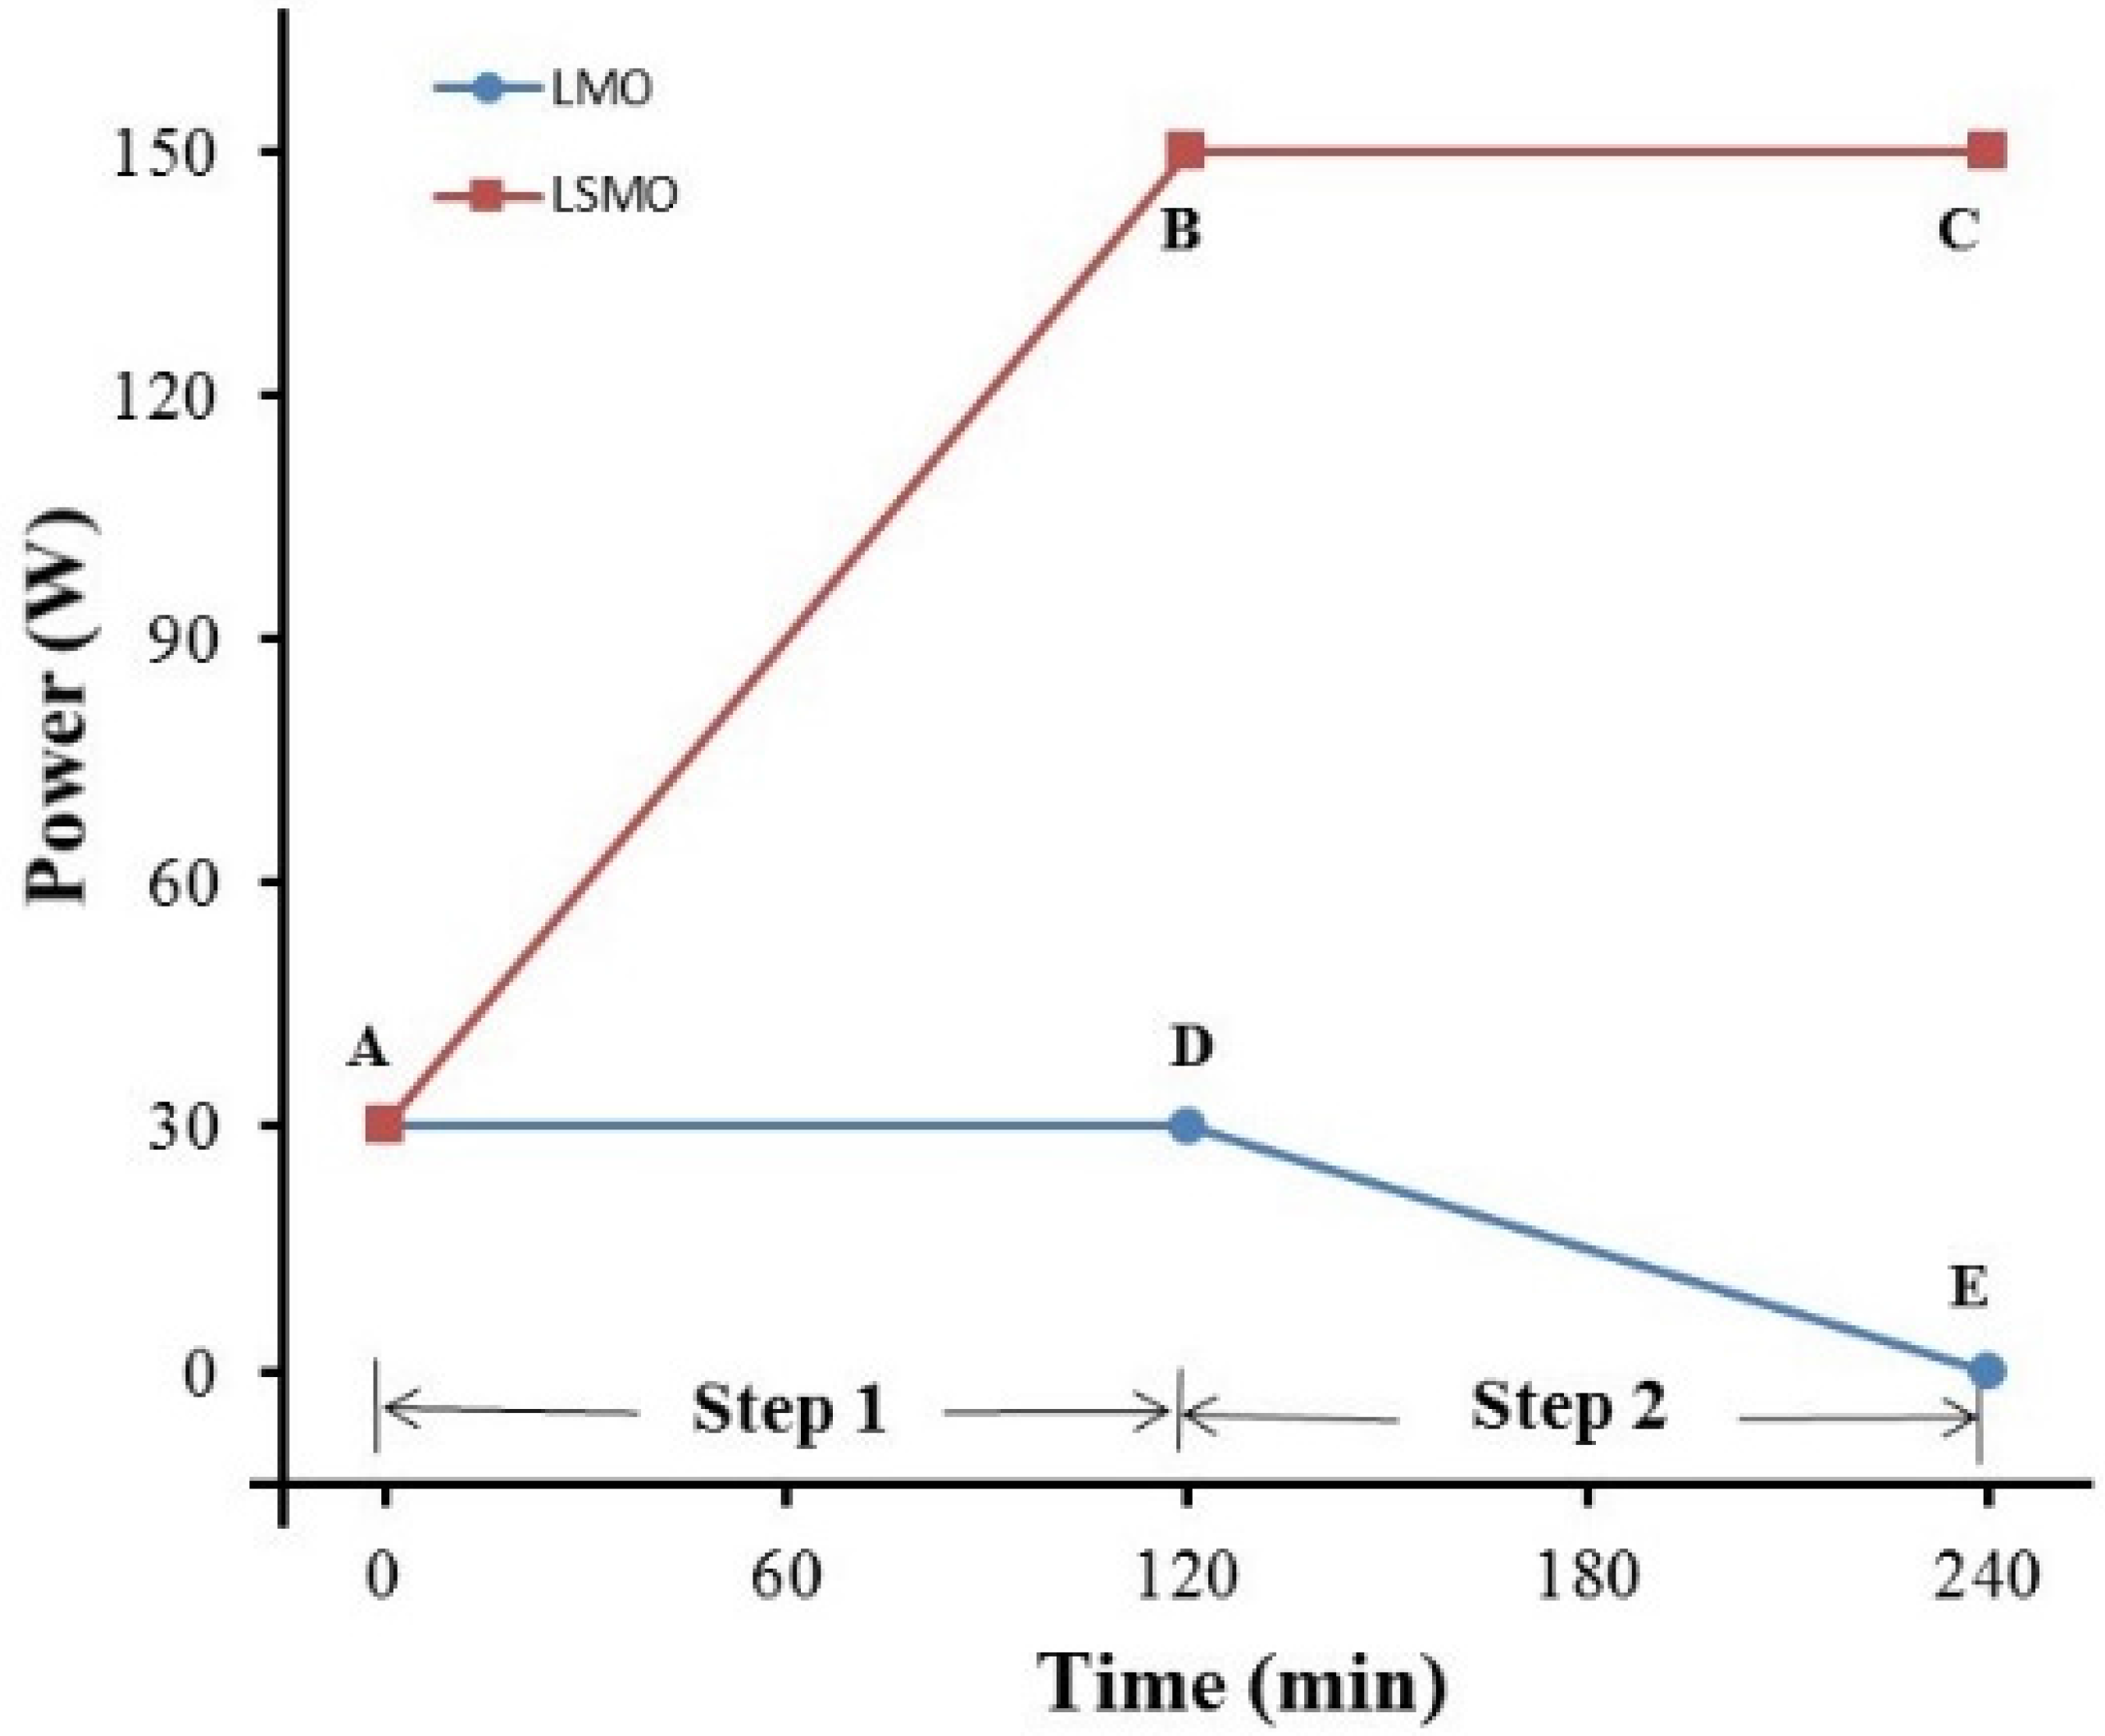
Figure 1 shows the steps for the deposition procedure of the ECG LSMO thin film. Initially, the power applied to both targets was rapidly increased from 0 to 30 W in 10 s. Then, the power to the LMO target was maintained at 30 W while the power to the LSMO target was constantly rising up to 150 W in 2 h (step 1). Subsequently, the power to the LMO target was gradually lowered down to 0 W while keeping the power to the LSMO target at 150 W (step 2). All power applied to the guns was controlled automatically providing a continuous variation of power and deposition rate.
It is noted that the bulk value of the lattice parameter of LSMO and LMO is 3.84 Å and 3.95 Å, respectively, which is larger than that of LAO pseudo cubic unit cell (3.79 Å). This gives rise to the generation of in-plane compressive strain and out-of-plane tensile strain in the film. The deposition rates of individual LMO and LSMO on LAO at 30 W RF power calculated from our previous study [
20] are 0.39 nm/min and 0.11 nm/min, respectively. Thus, it is expected that a LMO-rich part with a large strain forms first at the substrate followed by a LSMO-rich part with lower strain due to gradually increased Sr doping in the growth direction.
Figure 1.
Schematic illustration of the specific deposition procedure of epitaxial composition graded (ECG) La1−xSrxMnO3 (LSMO) thin film. Steps 1 and 2 show the variation of power ratio of LaMnO3 (LMO) and LSMO targets during the deposition.
Figure 1.
Schematic illustration of the specific deposition procedure of epitaxial composition graded (ECG) La1−xSrxMnO3 (LSMO) thin film. Steps 1 and 2 show the variation of power ratio of LaMnO3 (LMO) and LSMO targets during the deposition.
XRD (D8 Advanced Diffractometer, Bruker AXS GmbH, Karlsruhe, Germany) analysis was performed utilizing Cu Kα radiation to study the crystalline structure and substrate/film orientation relationship. Out-of-plane lattice parameters were measured by using θ–2θ geometry. Low angle XRD analysis by varying the incident angle was performed in order to further characterize the graded structure of the ECG LSMO thin film. The detector rotated from 20° to 24° in each scan while the incident beam was locked at a certain angle. The incident beam angle was then increased from 10.2° to 11.5° by a step of 0.1°. The very small increment angle was utilized to find out the subtle changes in the lattice parameter. The microstructure of the films was studied by HRTEM. EDS, SAED and HRTEM images were recorded in a Hitachi H-9500 electron microscope operated at 300 kV with a point-to-point resolution of 0.18 nm. Cross-section TEM specimens were prepared by the procedure of mechanical grinding, polishing and dimpling followed by Ar-ion milling using a Gatan model 691 precise ion polishing system (PIPS).
3. Results
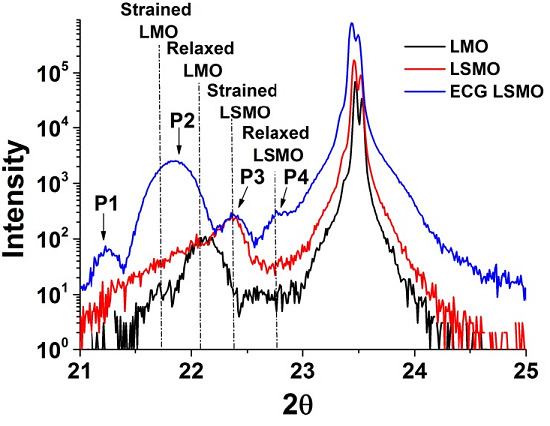
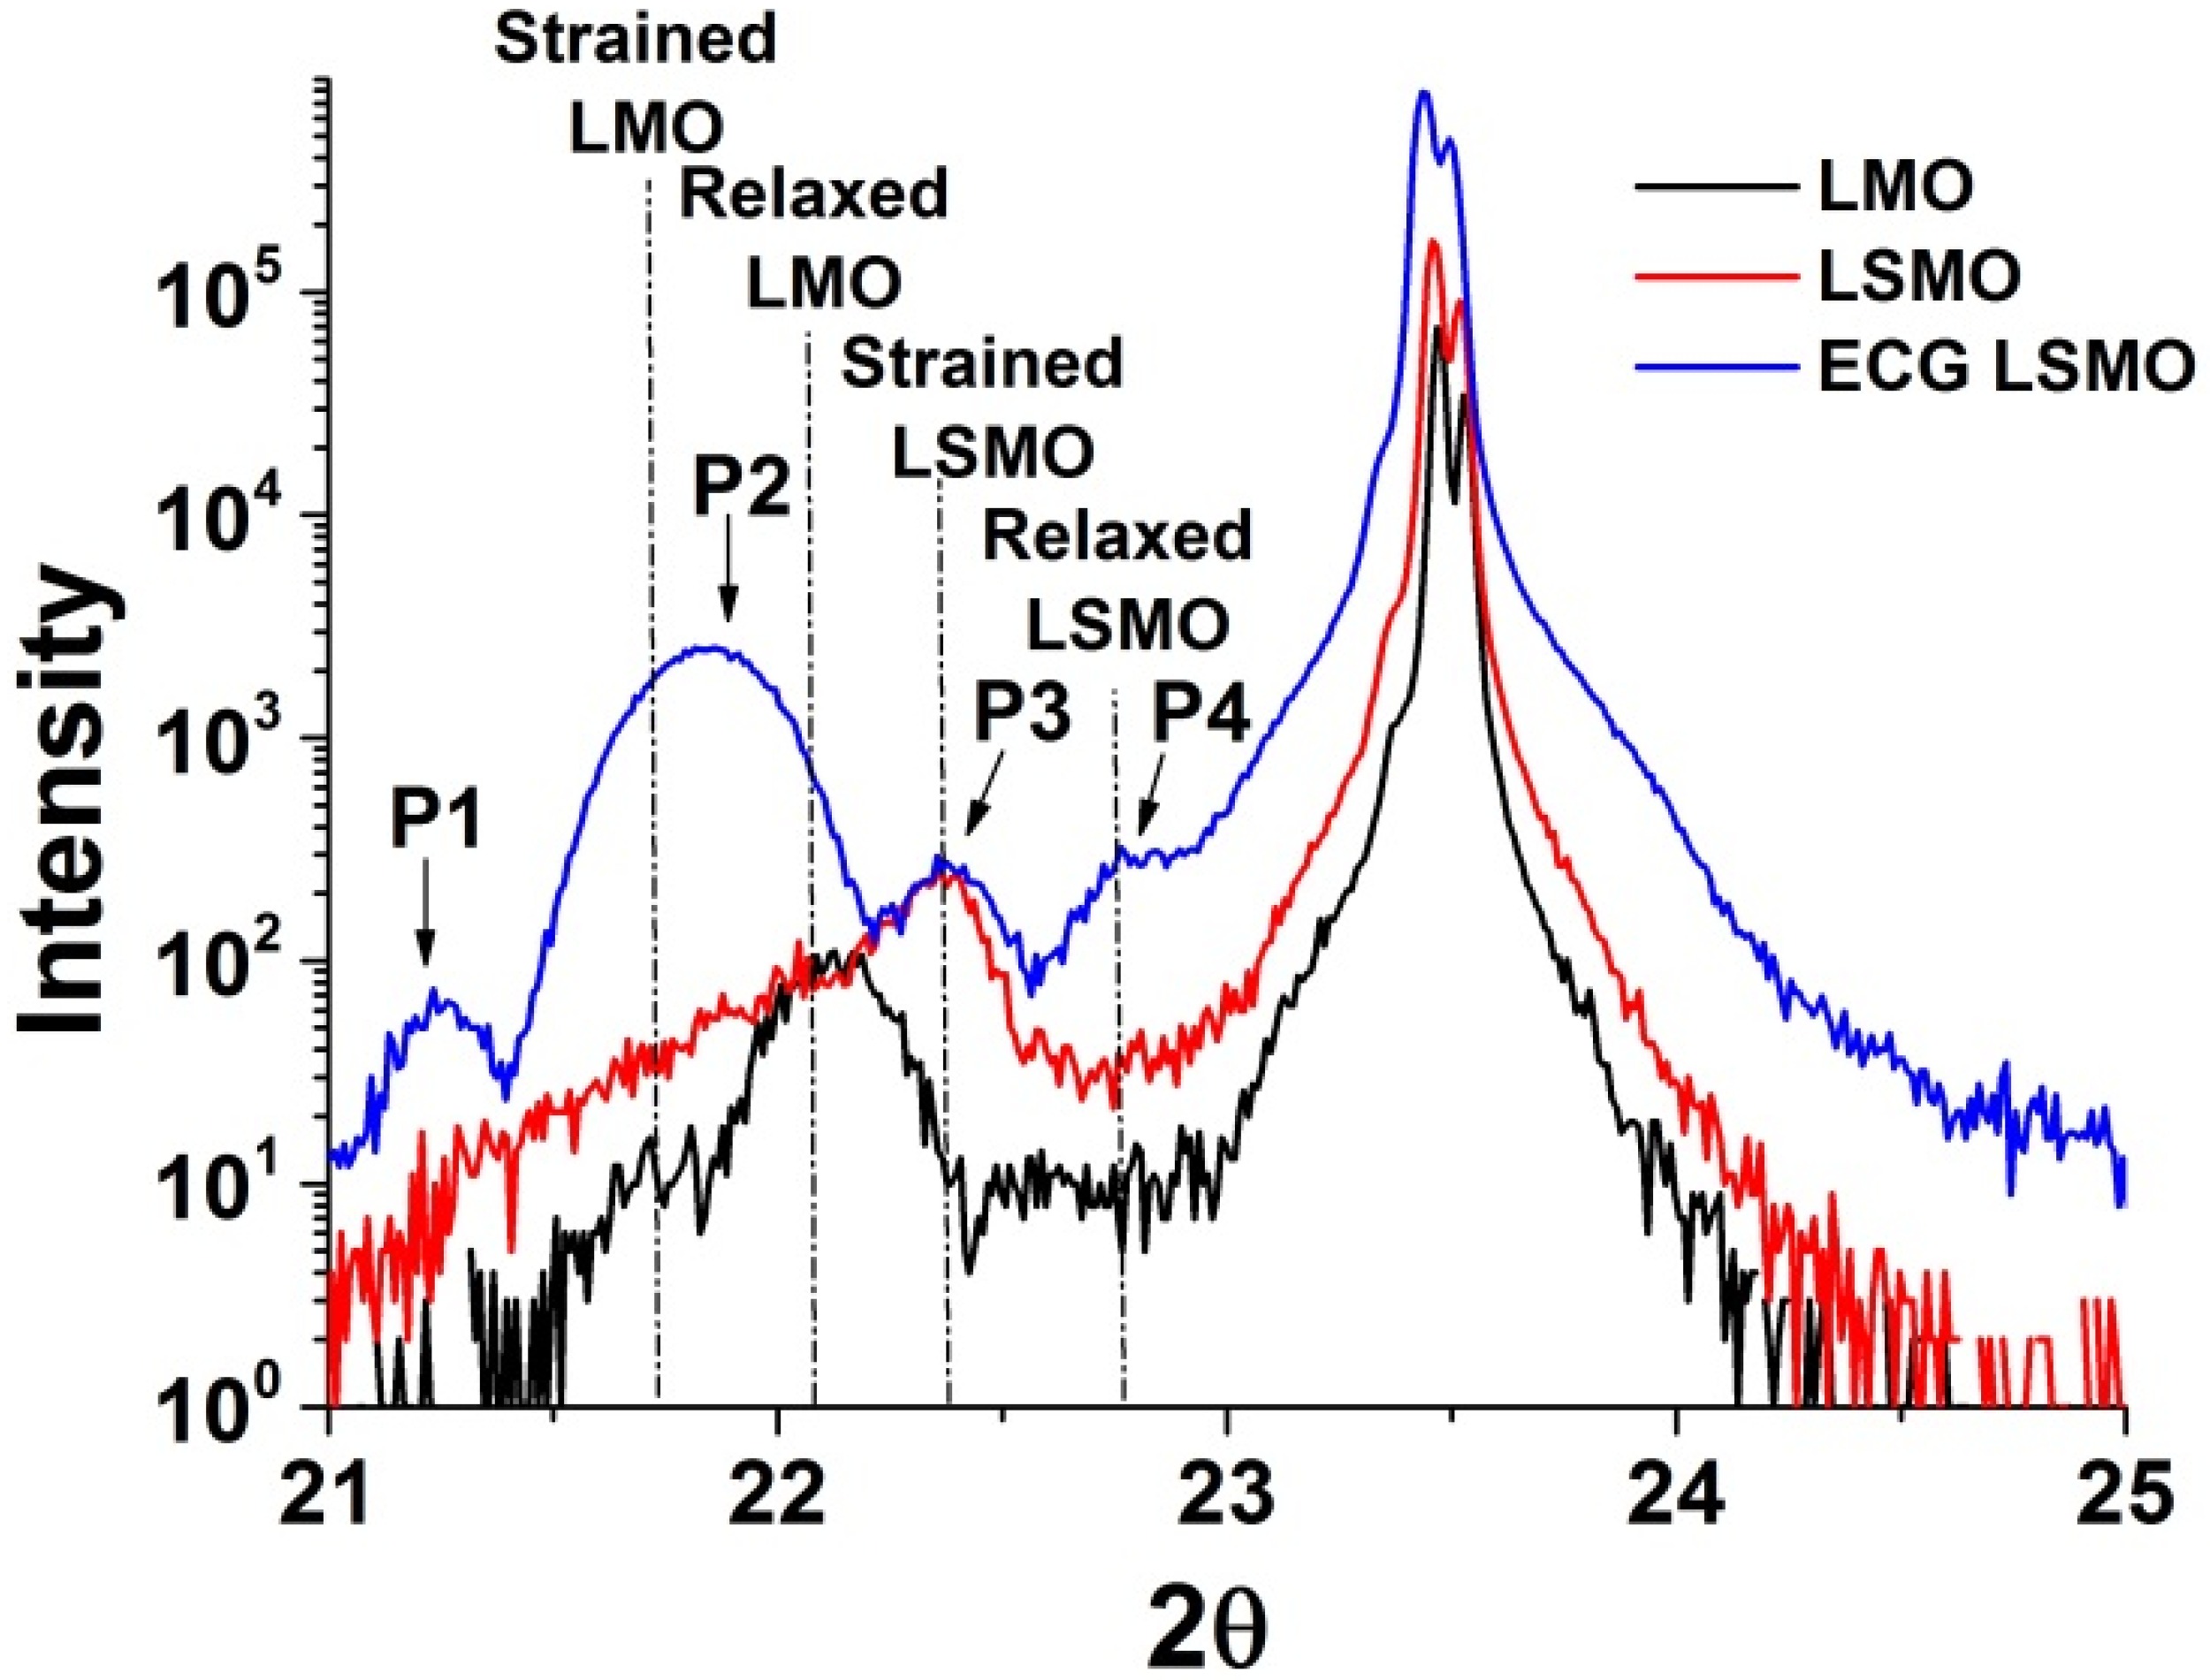
The θ–2θ XRD patterns in a narrow range around (001) reflection of the as-deposited films are shown in
Figure 2. Only (001) reflections are present, indicating that all three films have a cubic-on-cubic epitaxial structure in the
z direction. The pure LMO film contains two separated peaks. The left reflection is contributed to a fully strained LMO layer of which the out-of-plane lattice parameter
c is 4.089 Å, while the second reflection corresponds to a partially relaxed LMO layer with a smaller lattice parameter
c (4.014 Å). The reason for the split reflections in pure LMO epitaxial thin film is the generation of dislocations when the film thickness is larger than the critical thickness value. Many previous publications have demonstrated the effect of the critical thickness value on strain relaxation in epitaxial LSMO thin films. The critical thickness value of epitaxial LSMO thin film on LAO substrate has been reported to be about 300 Å [
29,
30,
31]. The XRD pattern of the pure LSMO film contains only a single peak which corresponds to fully strained LSMO layer and the out-of-plane lattice parameter
c is 3.969 Å. This
c value is similar to those reported for films deposited by pulsed laser deposition (3.945 Å) [
2] and molecular-beam epitaxy (3.974 Å) [
32].
Figure 2.
θ–2θ symmetric diffraction patterns of pure LMO, pure LSMO and ECG LSMO films grown on LAO substrate; Arrows indicate the positions of the peaks assigned to the (001) reflection of graded LSMO film. The four dotted lines correspond to the value of out-of-plane lattice parameters of strained LMO, relaxed LMO, strained LSMO and relaxed LSMO.
Four split peaks are identified around the (001) reflection in the XRD pattern of the ECG film labeled as P1, P2, P3 and P4. The broad reflection P2 covers almost both peaks in the pure LMO diffraction pattern. This indicates the presence of a continuous variation of the out-of-plane lattice parameter for the range of the two separated peaks shown by the pure LMO film. The broad peak P2 can be considered as a result of the gradual increase of the Sr doping concentration along the growth direction in the ECG LSMO thin film. It should also be noted that peak P3 is almost identical to the reflection in pure LSMO diffraction pattern suggesting a similar
c value as the Sr doping further increased. The value of lattice parameter
c in P4 (3.907 Å) is close to the bulk value of La
0.67Sr
0.33MnO
3 (3.87 Å) indicating that a partial strain relaxation occurs in the ECG LSMO thin film. Since the thickness of the ECG film is smaller than the critical thickness, the mechanism of this strain relaxation should be attributed to the graded structure due to the compositional gradient. The abnormal peak P1 with a very large out-of-plane lattice parameter (4.183 Å) may be attributed to (110) with orthorhombic structure [
17,
18,
19].
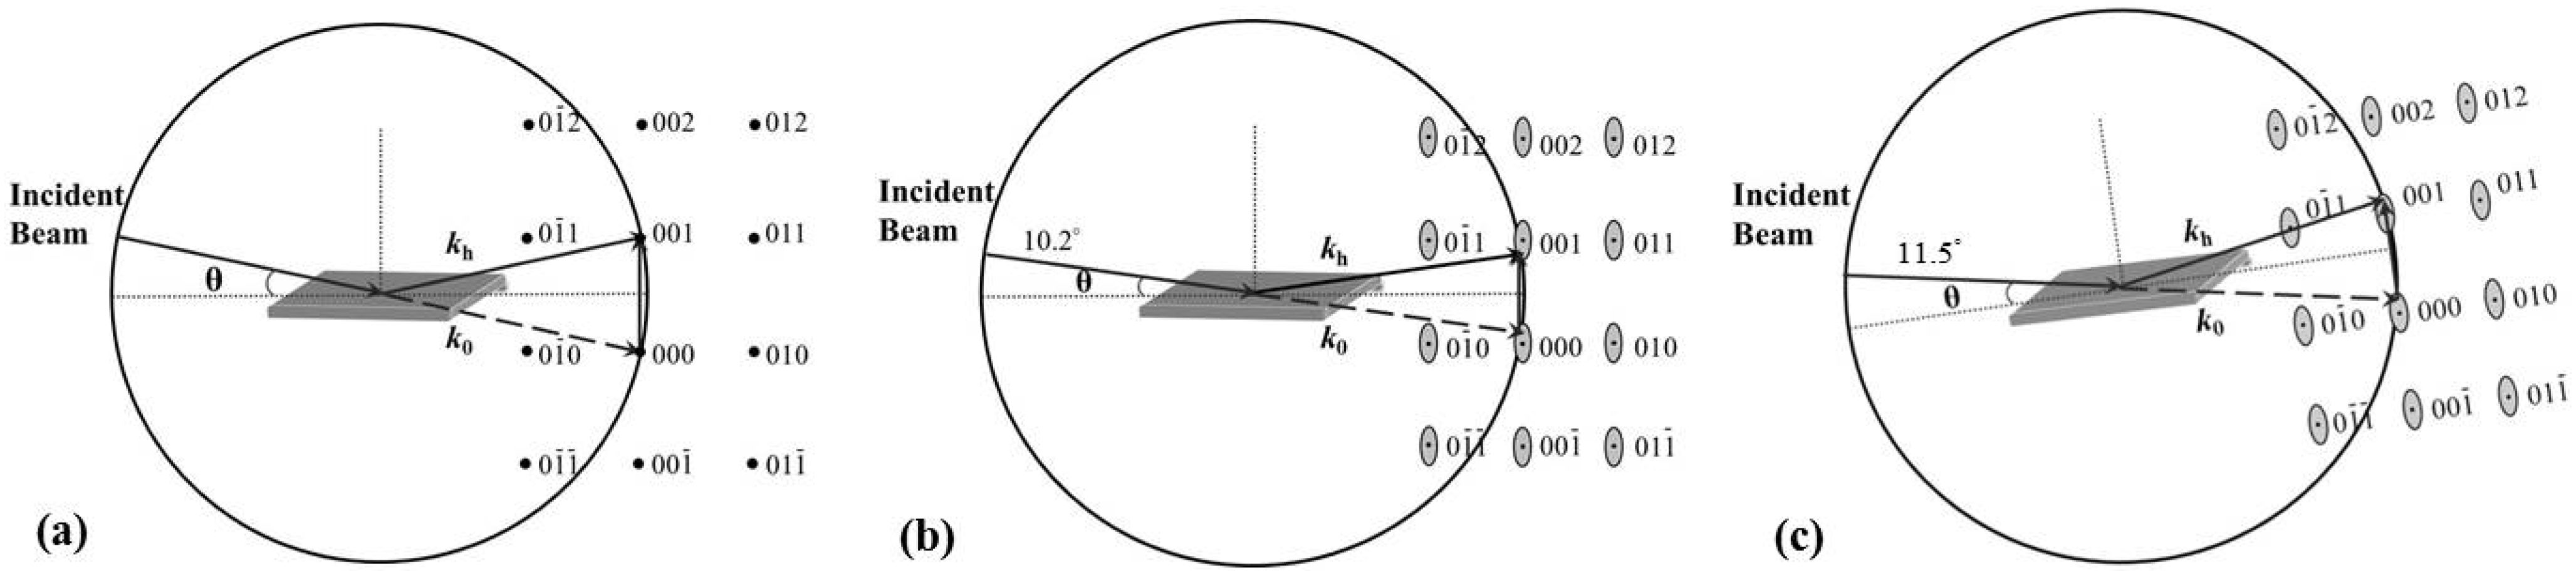
A set of low angle XRD results with the angle of incident beam varying from 10.2° to 11.5° are shown in
Figure 3. Four areas were identified, corresponding to four peaks labeled in
Figure 2. The very small increase of the incident beam angle is designed for identifying subtle changes of the lattice parameter. It is observed that different diffractions are revealed as the incident angle increased. These successive emerging peaks may be due to different
d-spacing values caused by gradually increasing the Sr doping. The Ewald’s sphere model can be used here to illustrate vividly the nature of these changes. For a uniform single crystal, shown in
Figure 4a where
k0 is the incident wave vector and
kh is the diffracted wave vector, the reciprocal lattice points are perfect dots and lie on the sphere. When the incident angle is changed slightly, the scattering vector Δ
k = kh −
k0 will not lie on the surface of the sphere. However, for the ECG thin film, the shape of the reciprocal lattice points would be elongated due to the non-uniform strain caused by the graded structure shown in
Figure 4b. The edge of deformed reciprocal lattice points is still tangent to the sphere when the incident beam angle varies within a small range in
Figure 4b. Thus, different peaks appear in the diffraction pattern as the incident angle increased,
Figure 4c. It further details and confirms the gradual changing of the out-of-plane lattice parameters in the ECG thin film. This unique low angle XRD approach can be used in mapping out the variation of strain and lattice parameters in the ECG thin film.
Figure 3.
Low angle diffraction patterns of ECG LSMO thin film on LAO with different incident angles from (
a) 10.2° to 10.8°; and (
b) 10.9° to 11.5°. The four shaded areas correspond to four peaks in
Figure 2. Bulk values of the lattice parameter of LMO, LSMO and substrate (marked by an asterisk) are labeled as dotted lines.
Figure 4.
Ewald’s sphere construction for (a) uniform (001) single crystal; and a non-uniform (001) single crystal with an incident beam angle of (b) 10.2°; and (c) 11.5°.
Figure 4.
Ewald’s sphere construction for (a) uniform (001) single crystal; and a non-uniform (001) single crystal with an incident beam angle of (b) 10.2°; and (c) 11.5°.
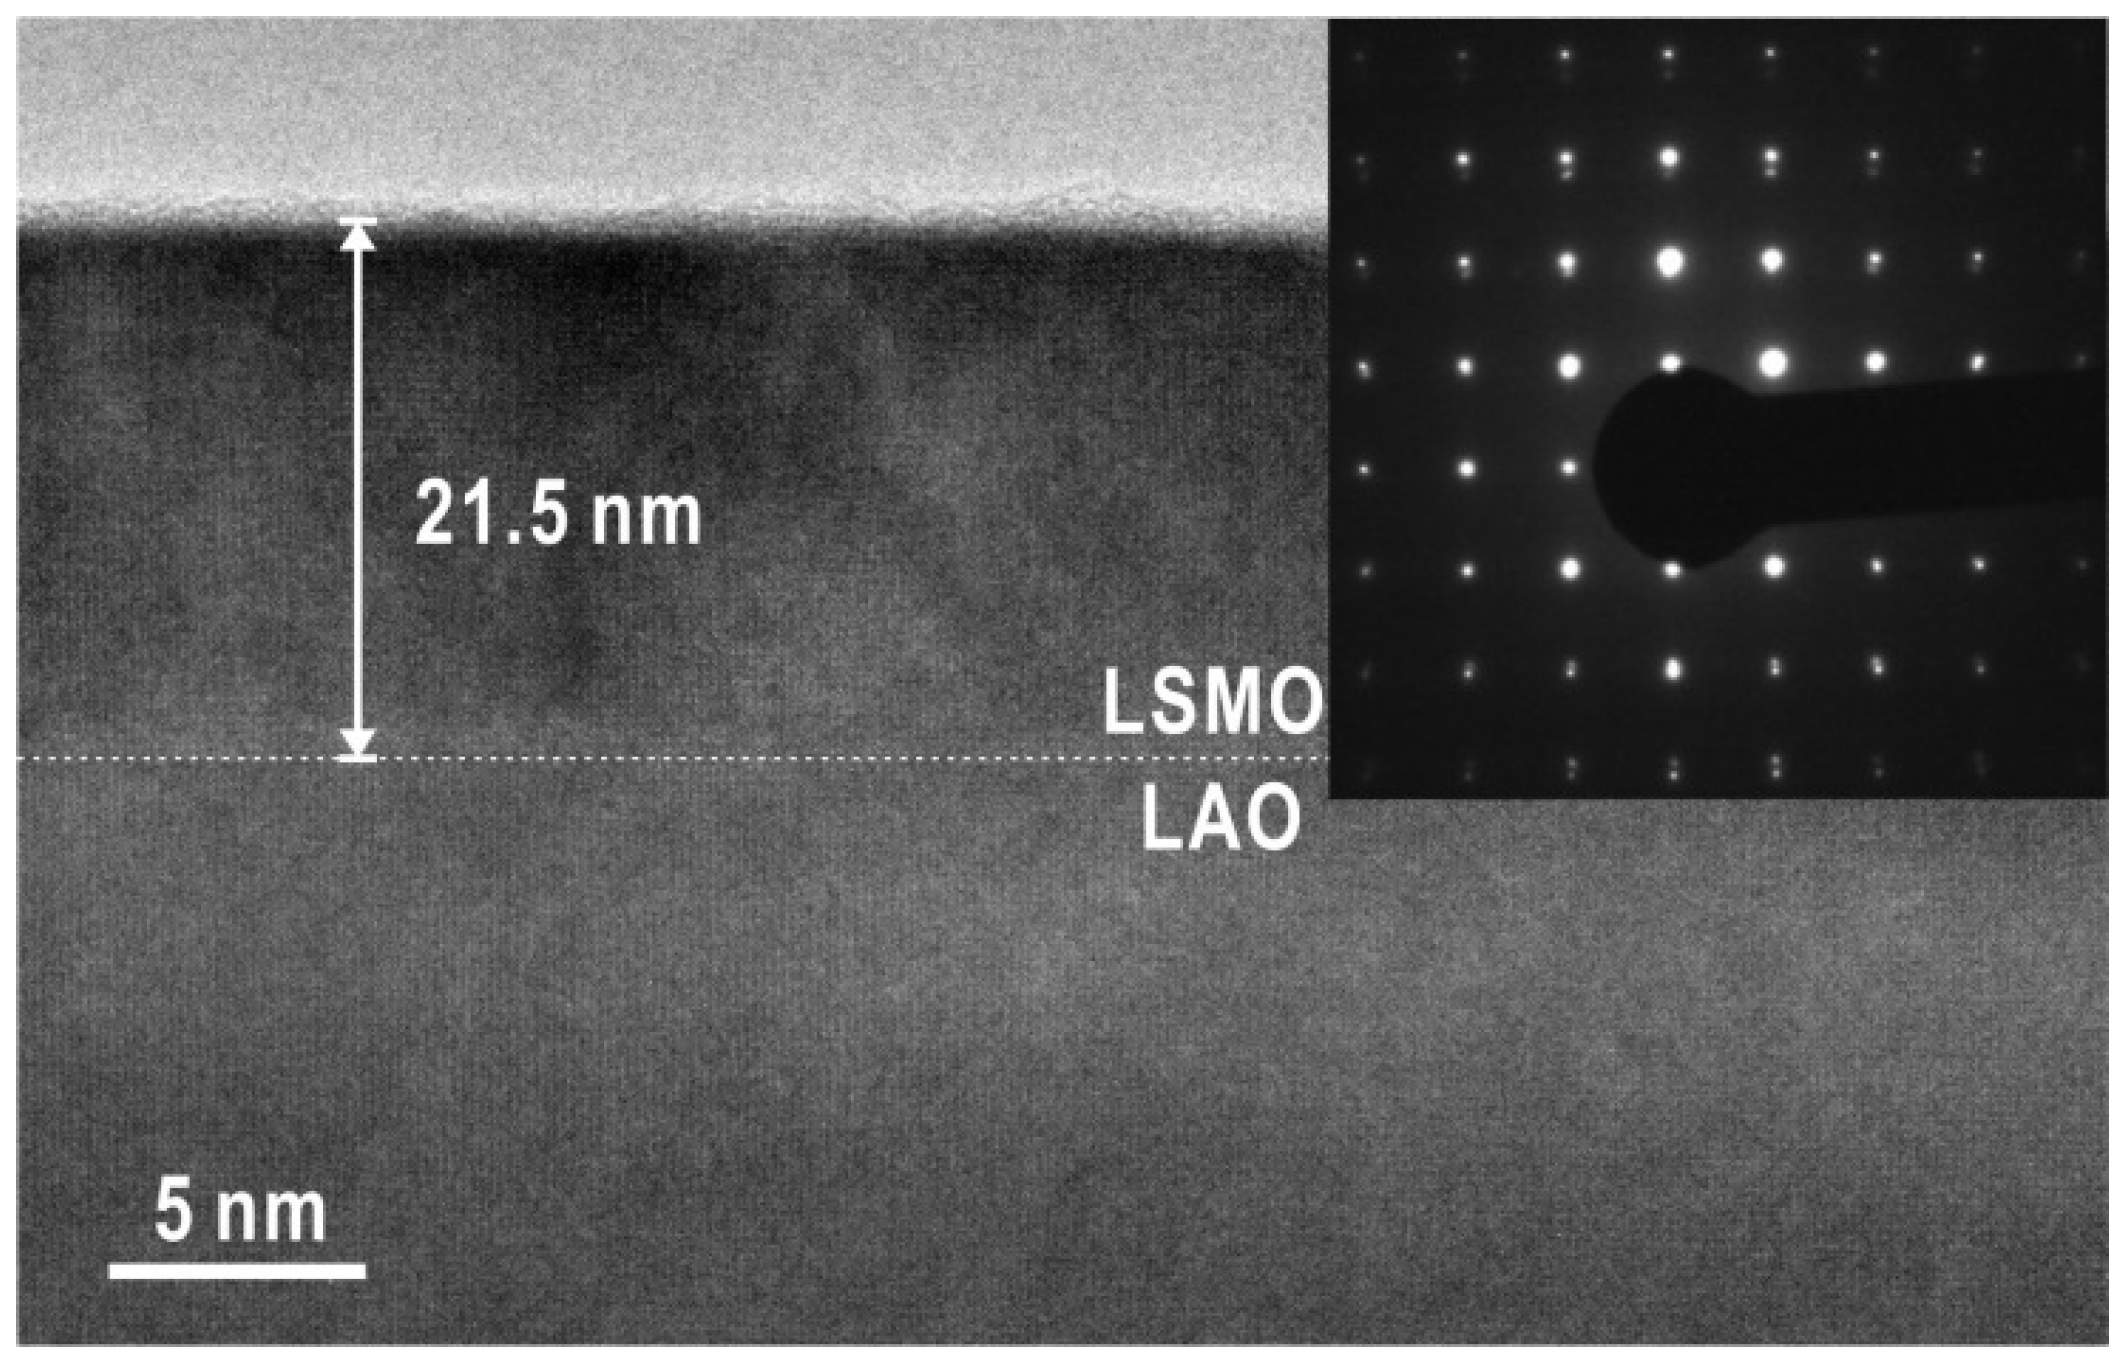
To further understand the crystalline quality of the ECG LSMO thin film, low magnification cross-section TEM investigations were performed,
Figure 5. The thickness of the film as measured from the image is about 21.5 nm and thus, under the critical thickness. The corresponding SAED pattern along the [001]
LAO direction taken from an area covering both the film and the substrate is shown as an inset in
Figure 5. The observed sharp electron diffraction spots without any satellites indicate a pseudo-cubic single crystal structure with the orientation relationship of <100>
LSMO // <100>
LAO.
Figure 5.
Low magnification of cross-section TEM image and SAED pattern covering both film and substrate.
Figure 5.
Low magnification of cross-section TEM image and SAED pattern covering both film and substrate.
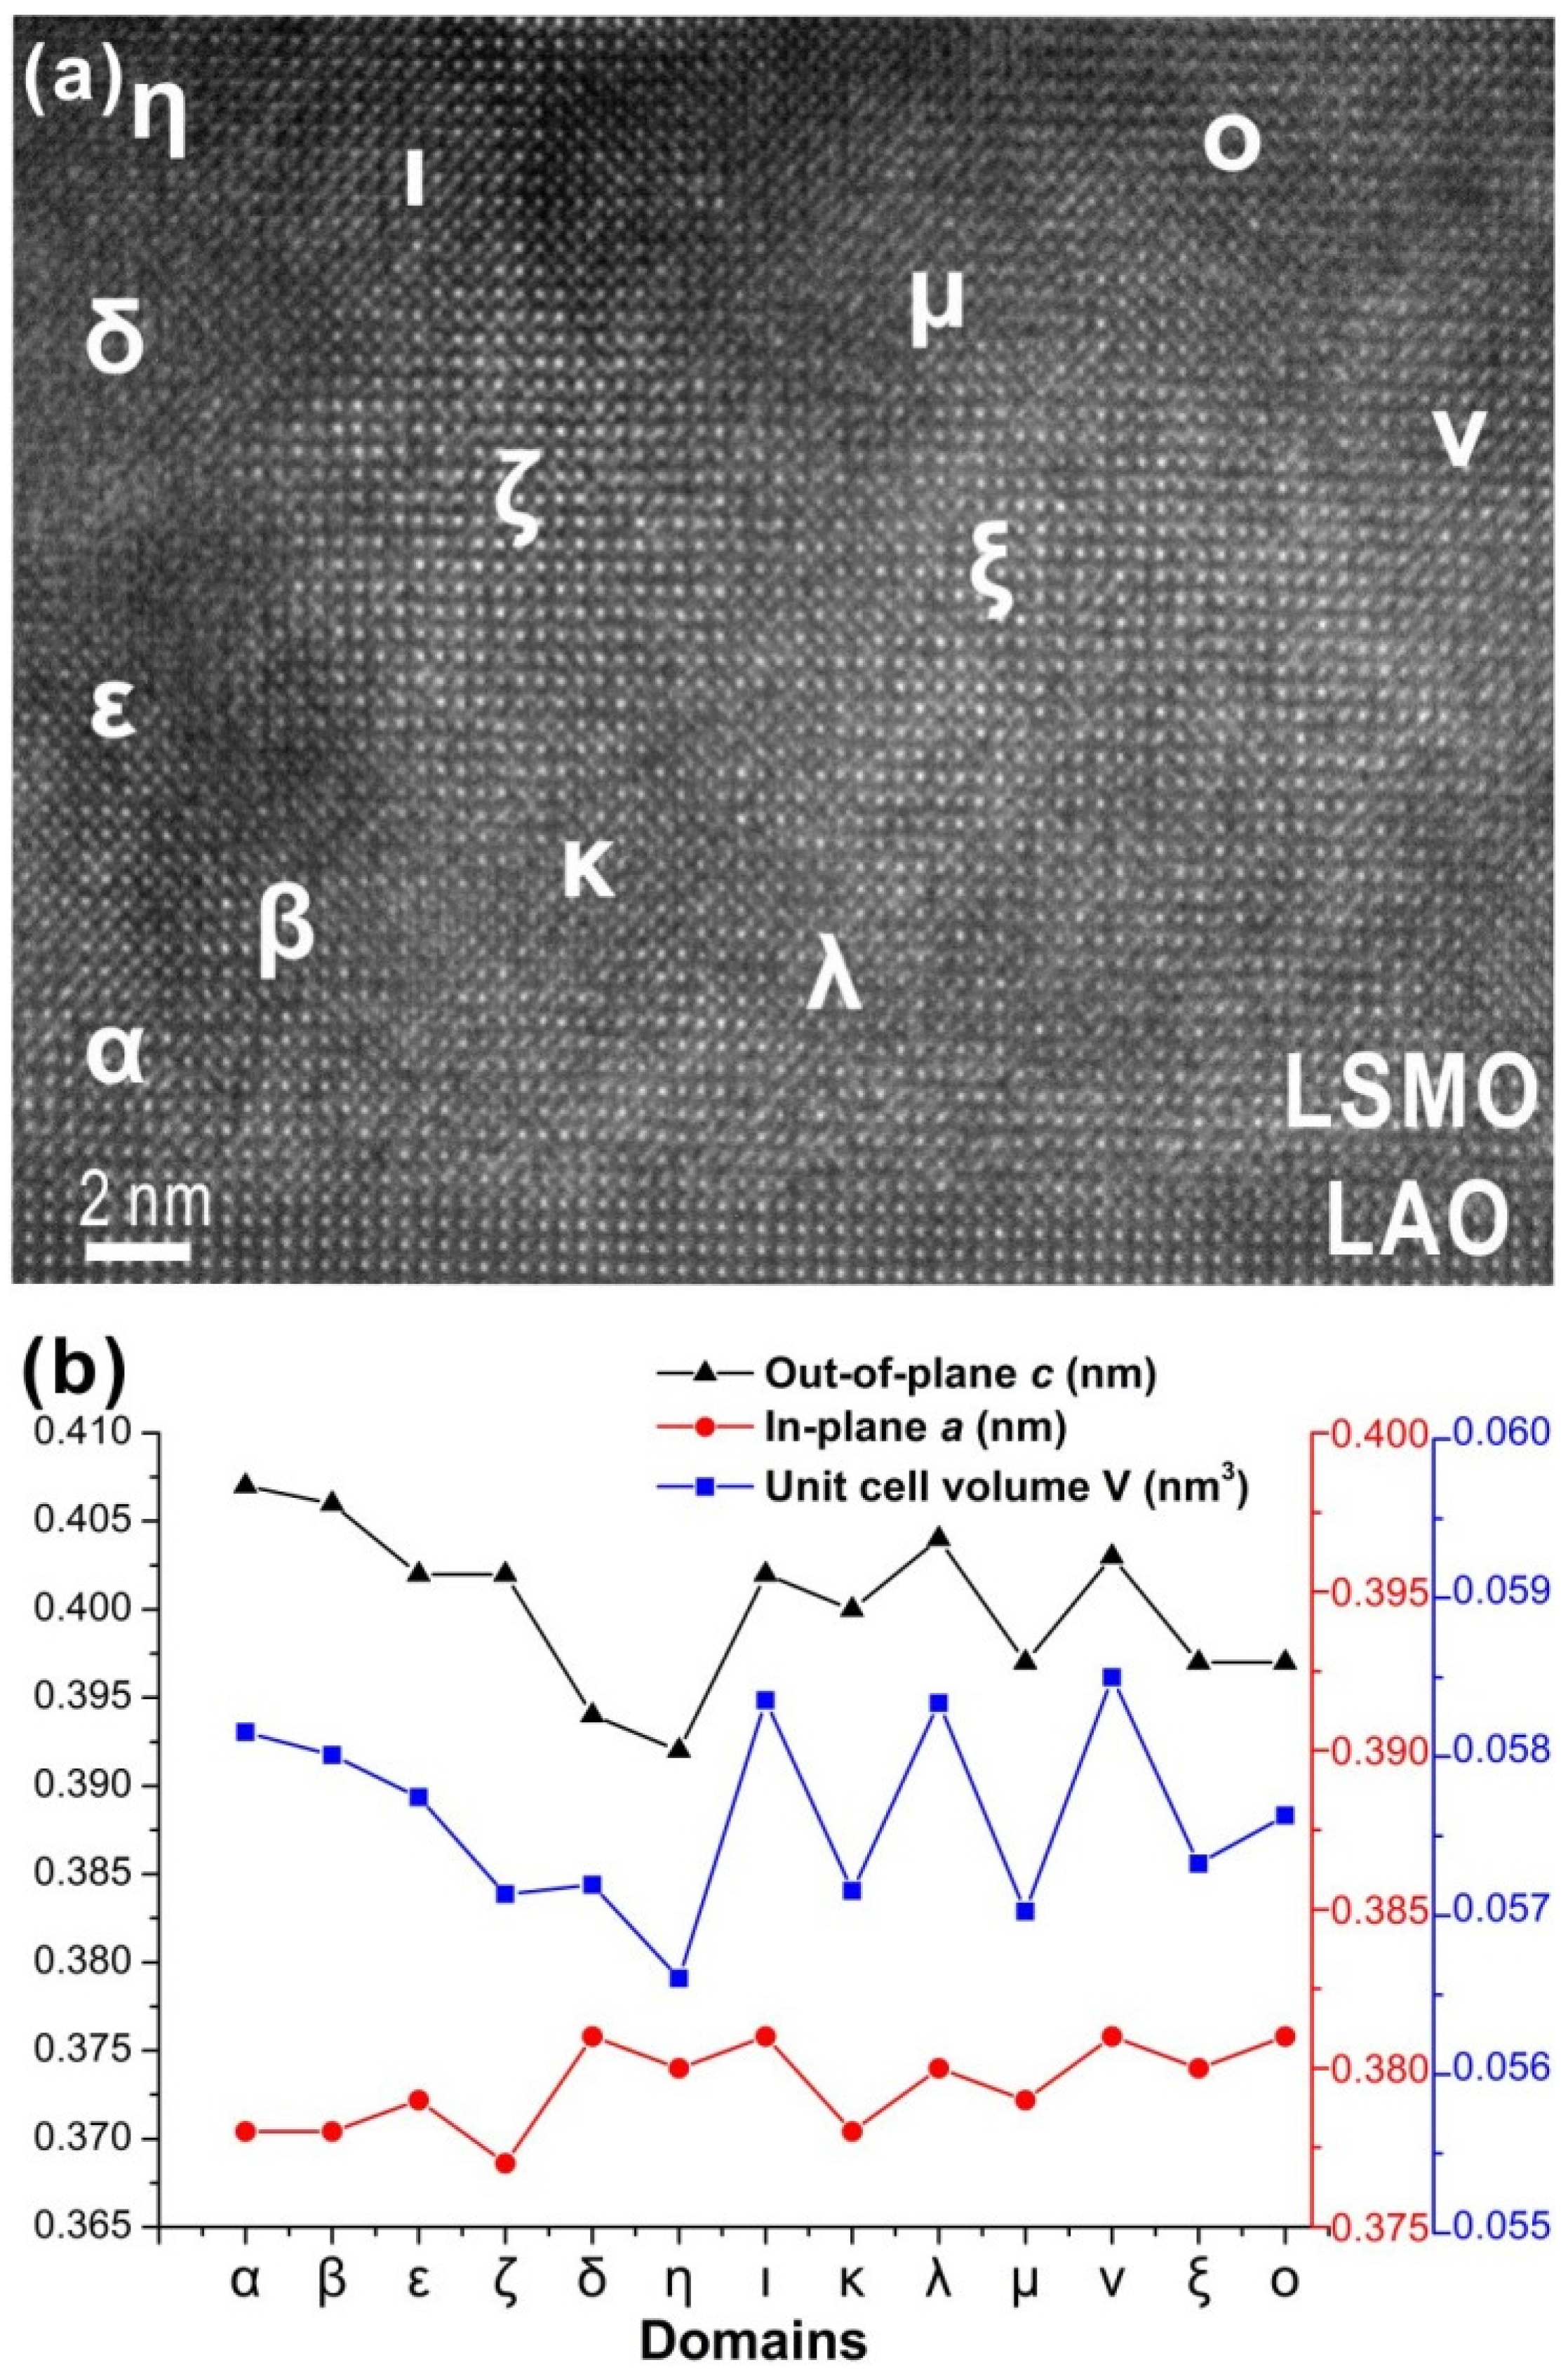
Figure 6a shows a high magnification of a cross-section HRTEM image at the film/substrate interface. A clear and flat interface with the absence of any dislocations was observed, indicating that a high quality crystalline epitaxial thin film was fabricated with coherent bonding between the film and substrate. In-plane and out-of-plane lattice parameters from different sites were measured and are listed in
Figure 6b. It is found that the out-of-plane lattice parameter varied from the interface to surface as shown in the first six measurements. On the contrary, the in-plane lattice parameter shows a very small variation and remains around 3.79 Å, which is the bulk value of the substrate lattice parameter. This variation of the unit cell volume reflects a composition change in the film. It also indicates that the strain relaxation caused by the ECG structure took place mainly along the out-of-plane direction while an integral coherent epitaxy was maintained at the in-plane direction. Some domains with different lattice parameters were also detected. It should be noted that each domain with different unit cell volume contains different Sr doping concentration. In view of this observation, it is interesting to note that there is an oscillation in the unit cell volume between areas η and
ο indicating that the Sr composition variation is randomly not distributed in the film. Larger unit cells are adjacent to smaller unit cells resulting in a local reduction of the strain. The presence of domains with various Sr content can be attributed to Sr diffusion taking place during the long deposition time which is considered as an additional annealing process during deposition.
Figure 6.
(a) High magnitude of cross-section HRTEM image of the interface between the ECG thin film and the substrate; (b) Out-of-plane, in-plane lattice parameters and corresponding unit cell volume measured from the different sites in (a).
Figure 6.
(a) High magnitude of cross-section HRTEM image of the interface between the ECG thin film and the substrate; (b) Out-of-plane, in-plane lattice parameters and corresponding unit cell volume measured from the different sites in (a).
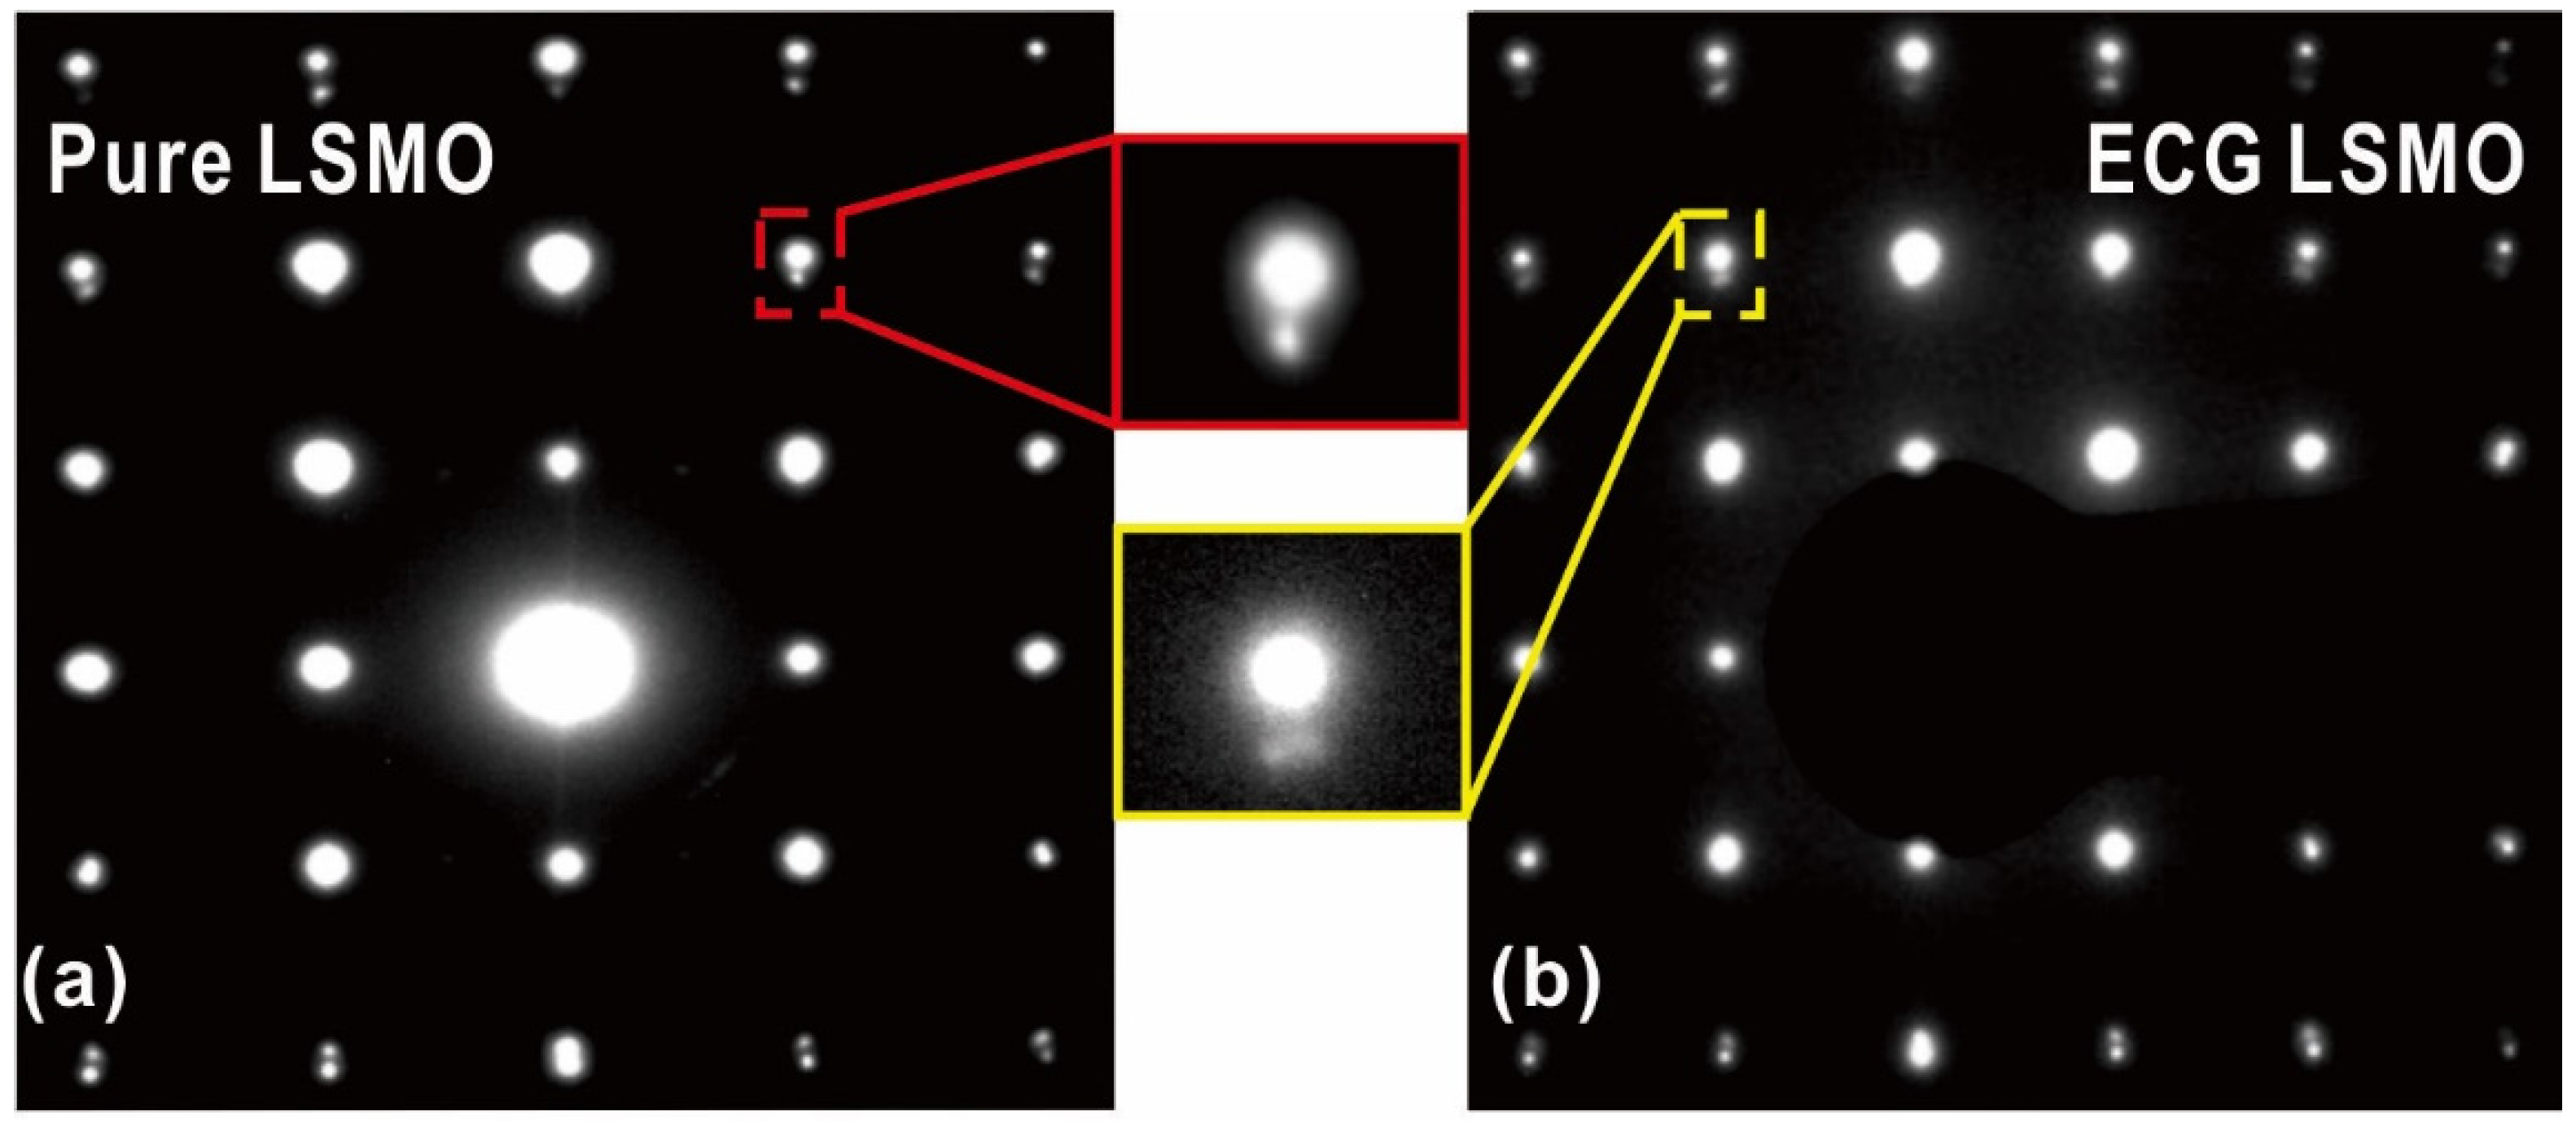
Figure 7a,b presents SAED patterns of pure LSMO and ECG LSMO thin films on LAO, respectively. It is evident that the electron diffraction spots are present as dots in the former and elongated with a rod-like shape in the latter. This can be attributed to the graded structure as the out-of-plane lattice parameter increased due to higher Sr involvement. These results are in agreement with our recent pole figure pattern around the (001) peak that shows the presence of a rod-like region [
28]. Both the SAED and pole figure results further confirm the formation of an ECG structure in the LSMO thin film. It should be noted that this graded structure was obtained for the particular power rate applied in step 1 (1 W/min). As we have shown previously [
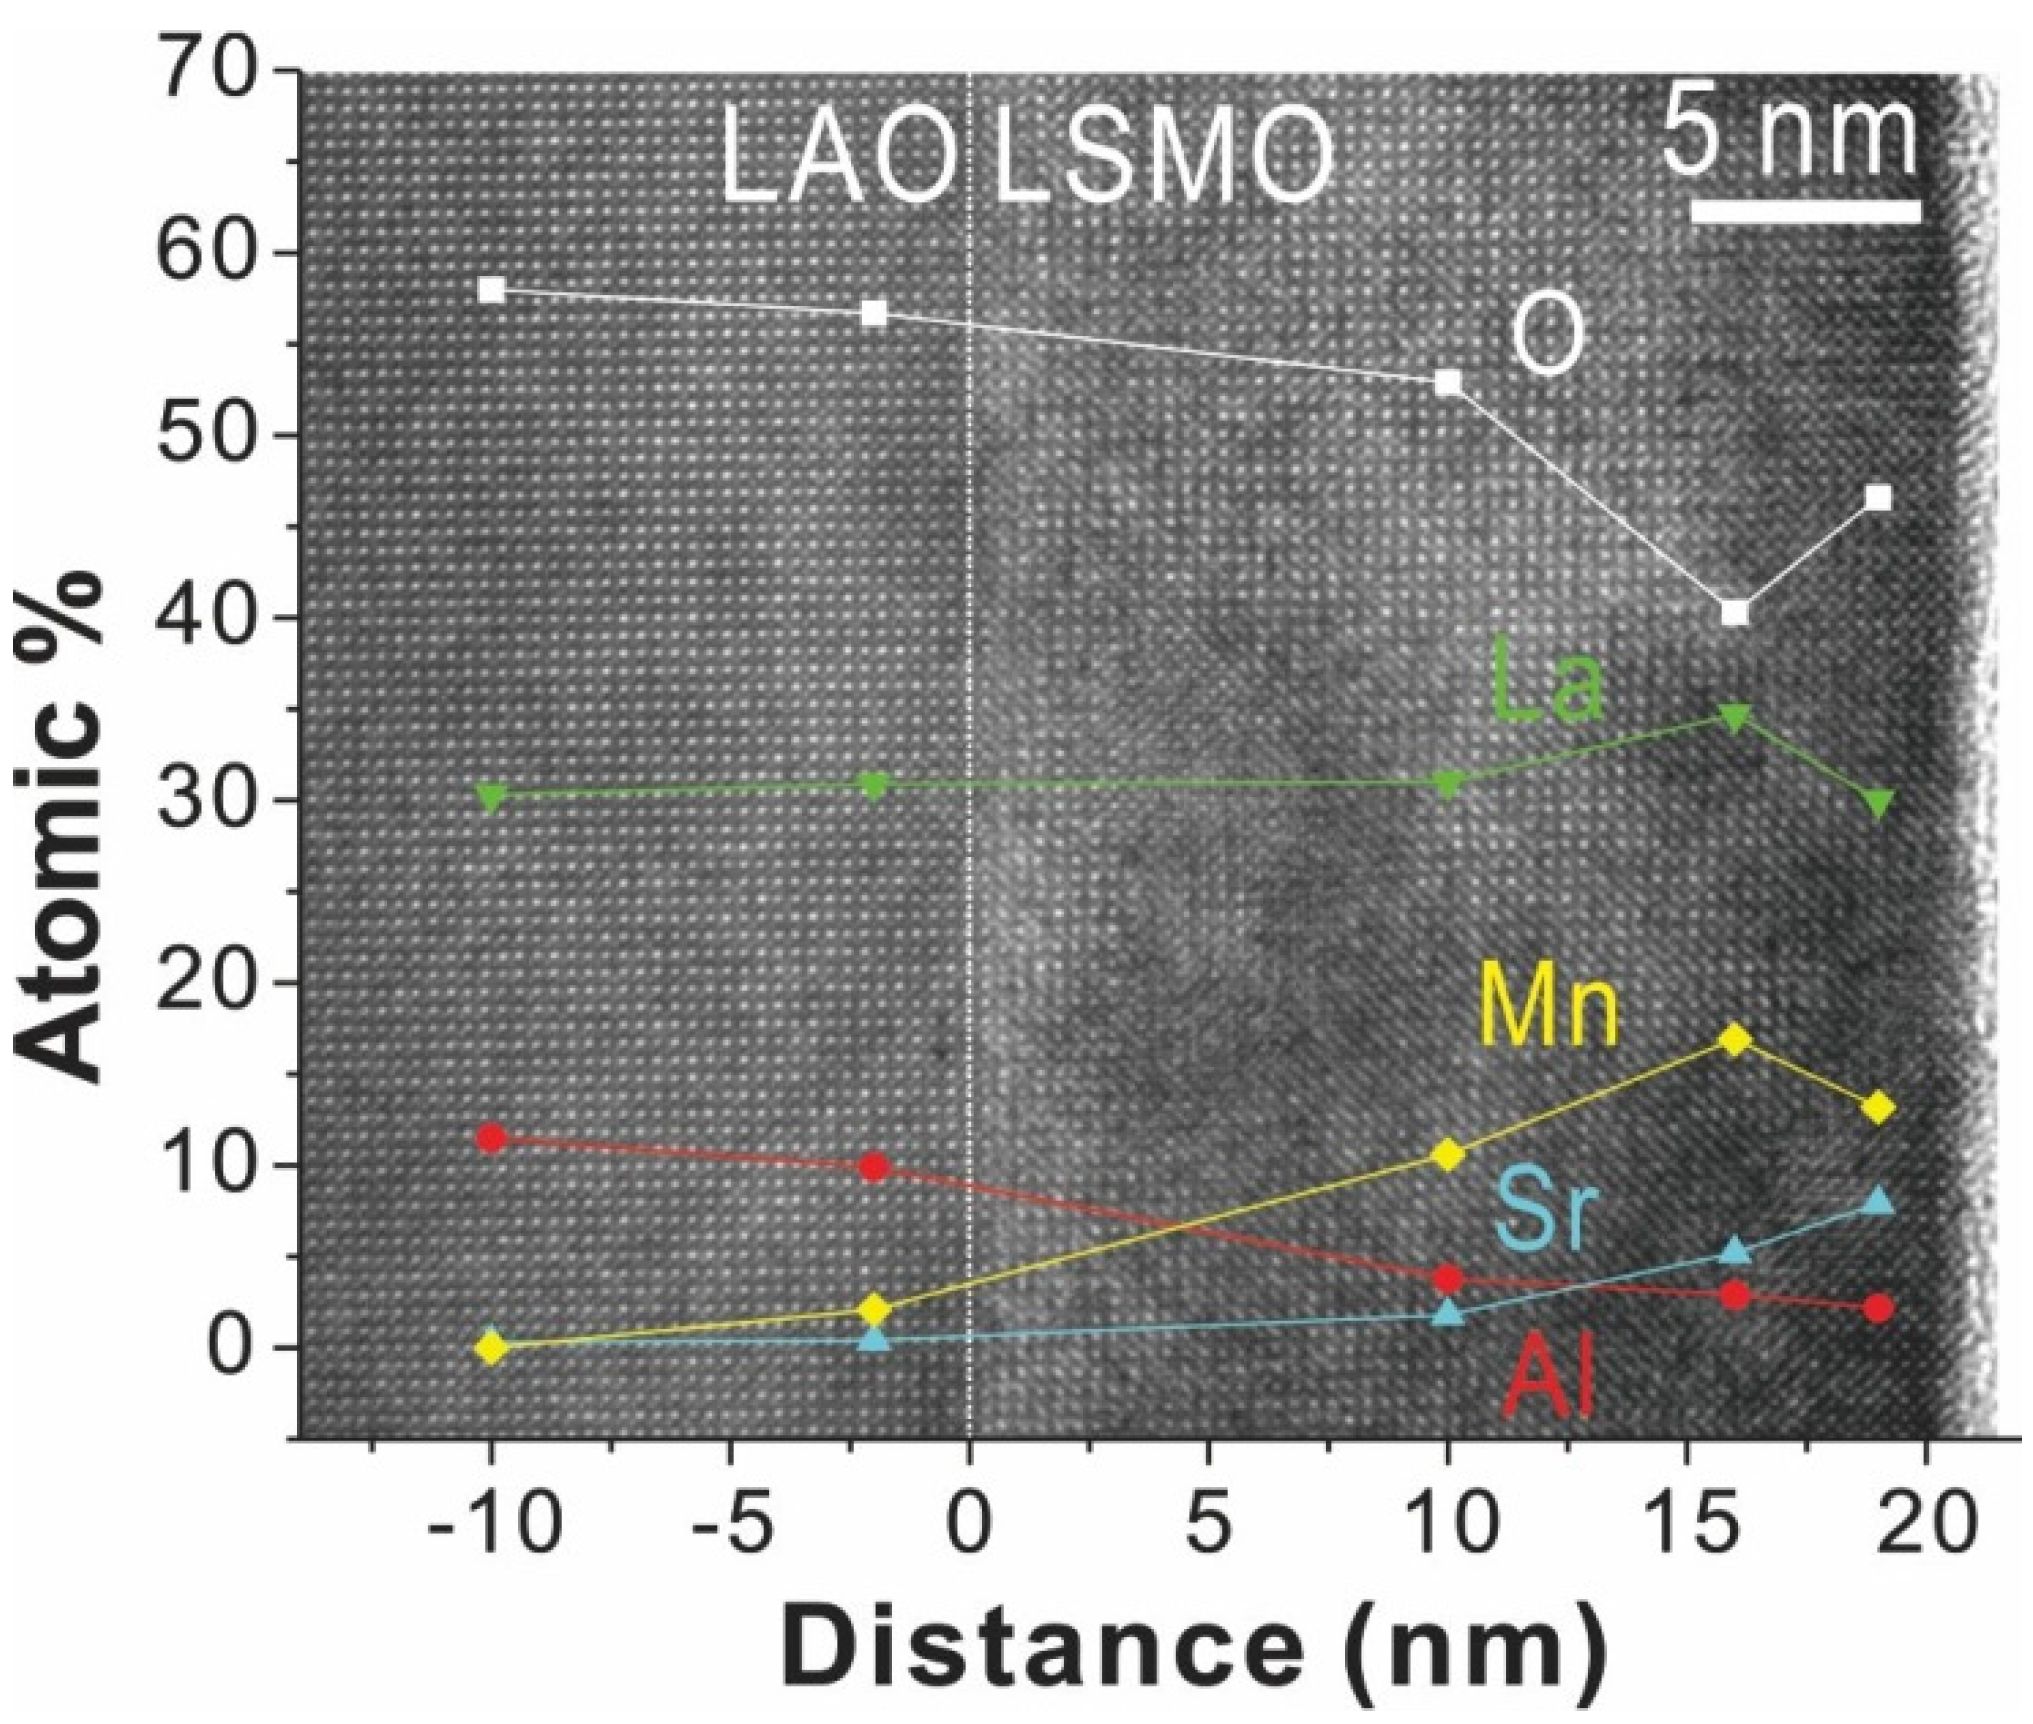
28], a higher power rate (2 W/min) results in a continuous layer with degraded crystallinity, emphasizing the importance of the power rate. Finally, EDS measurements were obtained along the cross section of the ECG LSMO thin film in order to characterize its composition,
Figure 8. For these measurements, the electron beam was gradually moved from within the substrate to the top of the film. However, considering the beam size utilized (~10 nm) and the corresponding excitation volume, these measurements should be considered only as qualitative. A gradual increase in the Sr content was evident and further confirms the composition gradient structure of the thin film.
Figure 7.
SAED patterns (a) pure LSMO; and (b) ECG LSMO covering both substrate and film along [001]LAO direction.
Figure 7.
SAED patterns (a) pure LSMO; and (b) ECG LSMO covering both substrate and film along [001]LAO direction.
Figure 8.
EDS results along the cross section from substrate to the surface of the ECG LSMO thin film.
Figure 8.
EDS results along the cross section from substrate to the surface of the ECG LSMO thin film.
4. Discussion
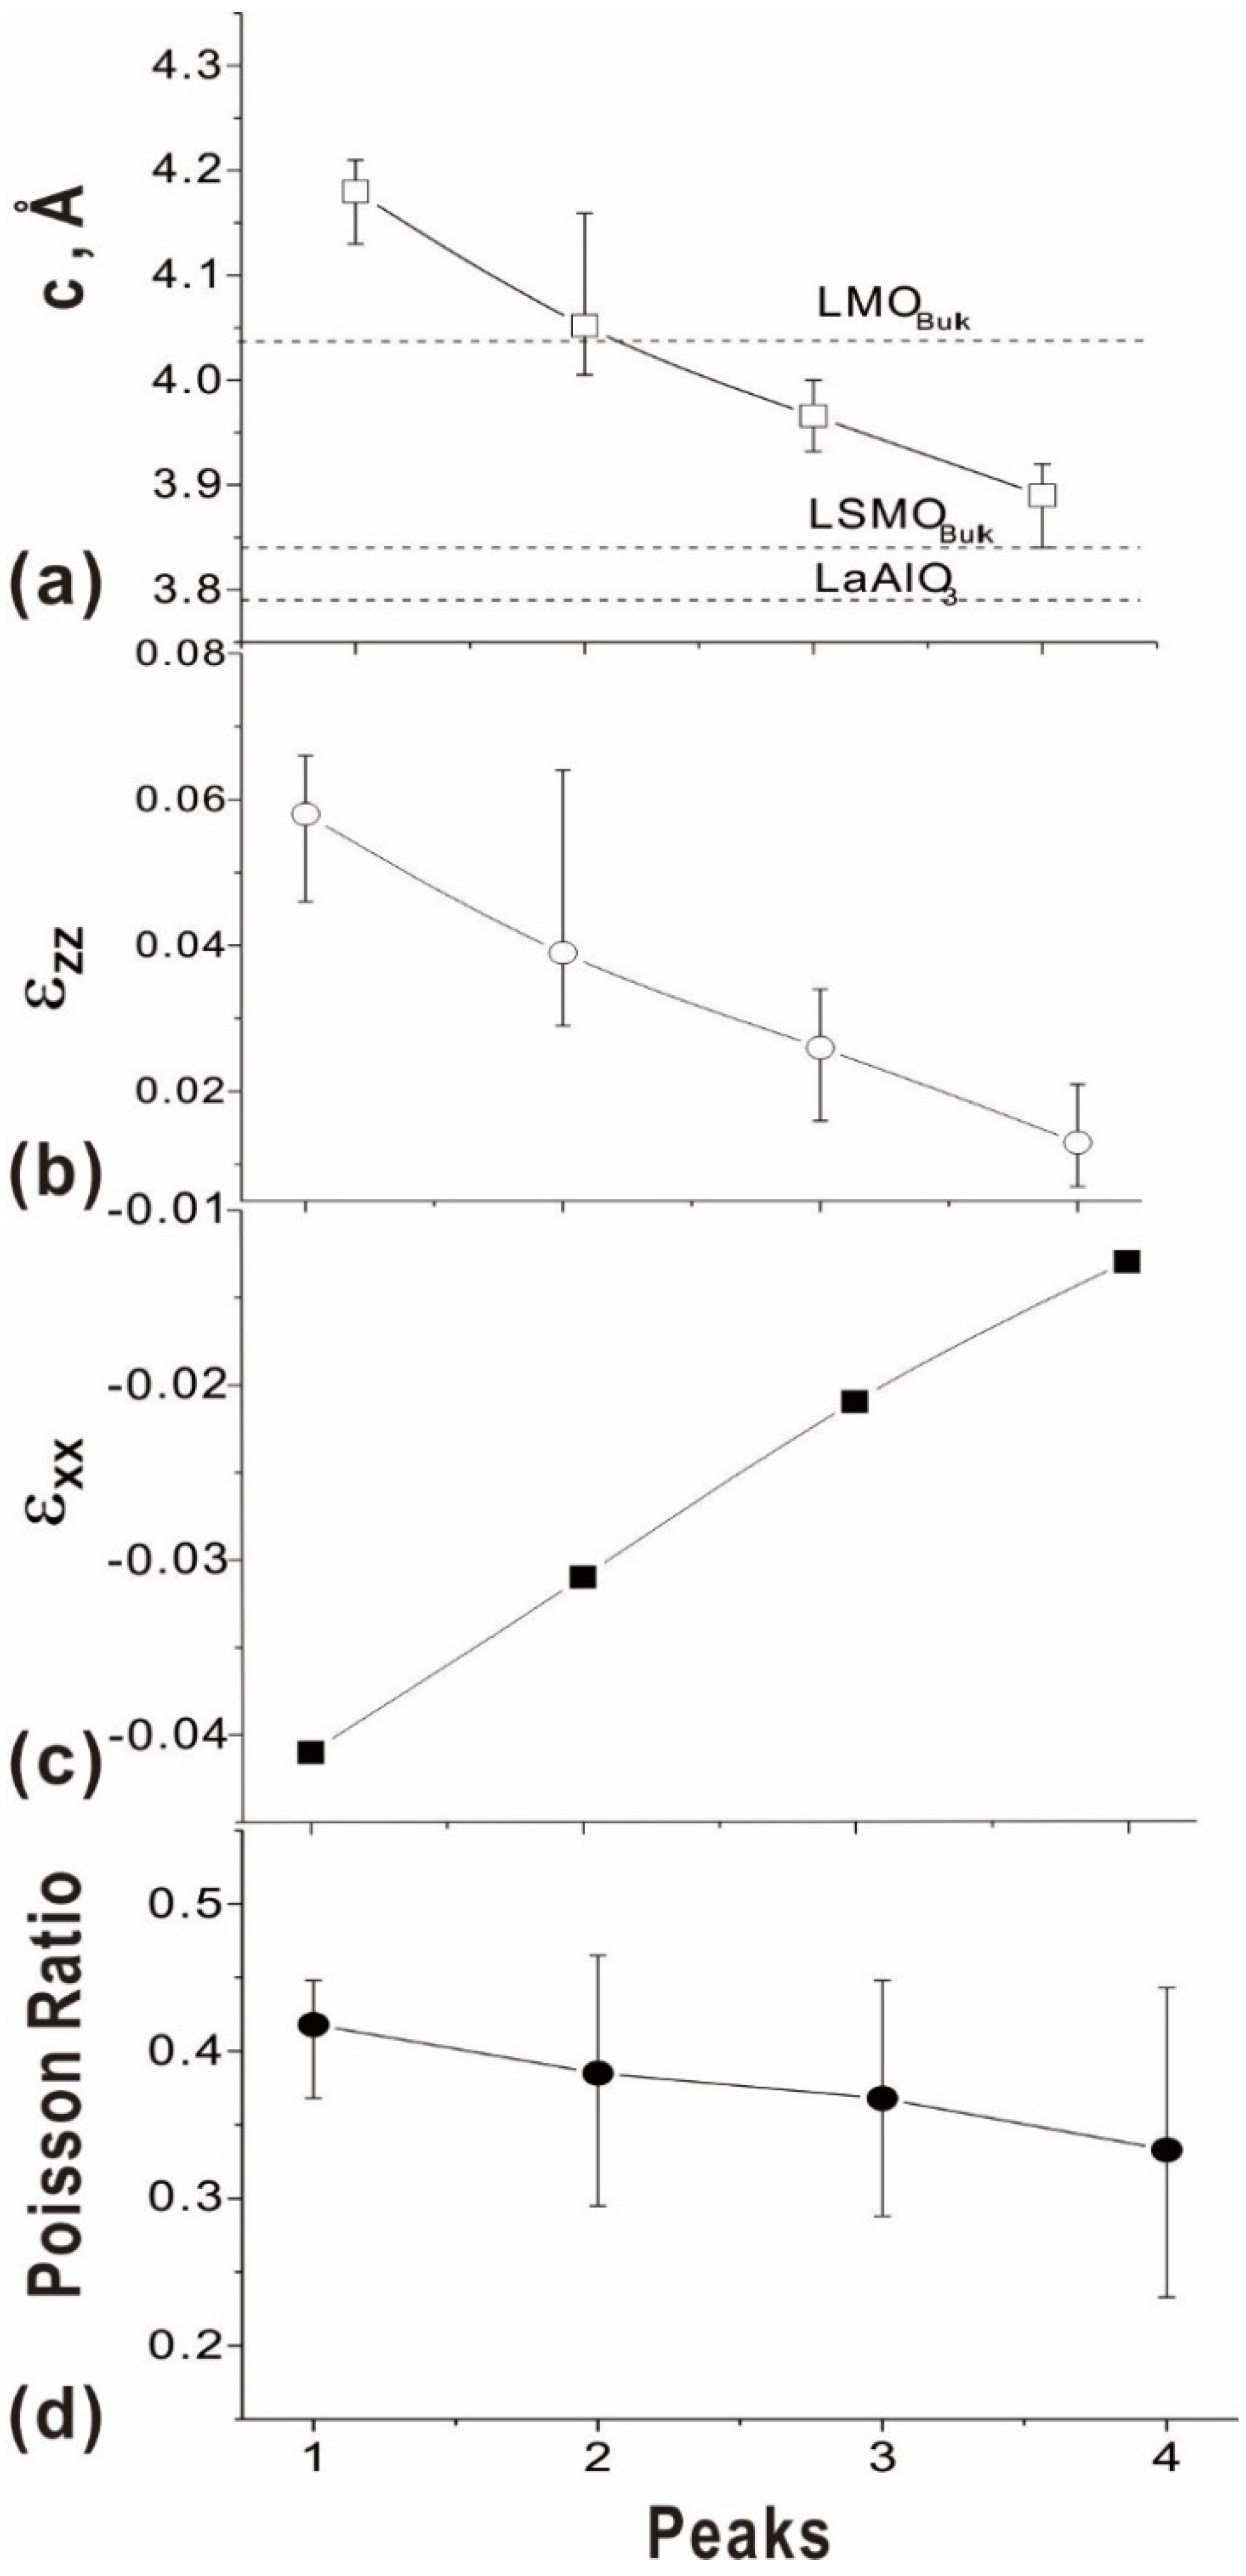
The out-of-plane lattice parameter of the ECG thin film for the various low angle XRD peaks shown in
Figure 3 was calculated and presented in
Figure 9a. It is found that the
c value is gradually decreased and finally approached that of the bulk La
0.67Sr
0.33MnO
3, indicating that the strain is also gradually relieved. The measured successively reduced
c lattice parameter value can be used to deduce Poisson’s ratio
ν for the ECG LSMO thin film. In a cubic system, the measured deformation ε
zz = (
cFilm –
cBulk)/
cBulk, where
cBulk is the bulk value of the film lattice parameter and is related to the imposed in-plane strain by the expression:
where
is the in-plane strain. Therefore,
Figure 9.
Variation of (a) c lattice parameter, (b) the corresponding out-of-plane strain, (c) in-plane strain and (d) Poisson’s ratio calculated from low angle XRD results.
Figure 9.
Variation of (a) c lattice parameter, (b) the corresponding out-of-plane strain, (c) in-plane strain and (d) Poisson’s ratio calculated from low angle XRD results.
In this case, the bulk value of the LMO lattice parameter (3.95 Å) is used to calculate the Poisson’s ratio deduced from P1, while the bulk La
0.67Sr
0.33MnO
3 lattice parameter (3.84 Å) is used to calculate P4’s Poisson’s ratio. Due to the gradual increase of the Sr doping, it is reasonable to modify
cBulk and
aBulk as 3.91 Å in calculating the Poisson’s ratio for P2 and as 3.87 Å for P3. The variation of the out-of-plane and in-plane strain of the ECG LSMO thin film are presented in
Figure 9b,c, respectively. It is evident that a gradual decrease of both in-plane and out-of-plane strain (almost down to zero) was achieved in the ECG LSMO thin film. This type of strain relaxation is attributed to compositional gradient effect and is entirely different from the general strain relaxation mechanism in composition uniform epitaxial thin films. As noted earlier, the latter mechanism involves the generation of periodic dislocations to relax the misfit strain when the film is over a critical thickness. It is also noted that as the concentration of Sr doping increased, the volume of the unit cell decreased. With the in-plane coherency maintained, the continuous reduction in the in-plane lattice parameter would certainly assist the relief of the compressive strain. Moreover, this in-plane relaxation combined with the reduction of the out-of-plane lattice parameter would further lower the out-of-plane strain. Thus, this continuous unit cell size reduction in the ECG LSMO thin film could actually simultaneously relieve the biaxial strain.
The corresponding Poisson’s ratios of the ECG LSMO thin film were deduced from Equation (3) and presented in
Figure 9d. The distribution of the Poisson’s ratio ranged from 0.468 to 0.231. This is in agreement with previously reported values for Sr doped La manganite [
29,
31,
33,
34,
35] which are 0.28 for La
0.88Sr
0.12MnO
3 obtained by Hazama
et al. [
33] and 0.41 for La
0.835Sr
0.165MnO
3 by Darling
et al. [
34]. The range of the Poisson’s ratio for ECG LSMO thin film over 0.41 (the largest Poisson ratio value reported) is due to the presence of the LMO-rich phase with larger misfit. A Poisson’s ratio lower than 0.28 was also obtained suggesting a more effective strain relaxation process in the ECG LSMO thin film compared to relaxation in composition uniform films. Thus, it is demonstrated that the out-of-plane strain of epitaxial LSMO thin films under the critical thickness can be relieved through a composition gradient effect. At the same time, the in-plane coherency can be maintained avoiding the generation of periodic dislocations in the film. This could be used as a buffer layer in order to fabricate dislocation free, epitaxial LSMO thin films with relaxed strain. Furthermore, the coexistence of domains with a composition variance in the same film, opens up new possibilities of designing new nanoscale structures with unusual cross coupled properties.


