1. Introduction
In the field of electrical power systems, topological reconfiguration plays a crucial role in ensuring reliability and efficiency in the distribution of electrical energy. These systems are constantly exposed to faults caused by disruptive events [
1]. Authors discuss the vulnerability of power systems, exposing this issue and its effects. They are also consistently exposed to natural phenomena, as shown in [
2], cyber-attacks, or the mismanagement of resources by the network operator, leading to load shedding and significant economic losses. This article proposes the implementation of a genetic algorithm for topological reconfiguration, achieved through the strategic addition of transmission lines and distributed generation as discussed in [
3,
4]. The authors in these references highlight the potential benefits of distributed generation (DG) implementation.
Additionally, an economic dispatch is carried out using discontinuous nonlinear programming (DNLP) to reduce energy generation costs, minimizing load shedding and economic losses in accordance with the budget limitations of the network operator.
With the proposed methodology, which optimally allocates resources (lines and distributed generation), an efficient response to contingencies is achieved, thereby improving the resilience and operability of the system. This methodology is divided into three phases: in the first phase, the network is selected, and a load flow analysis is performed to determine the system’s behavior under initial conditions. Damages are simulated by taking lines and generators out of operation. The disruptive event causing the most damage to the system is determined, and a network analysis is conducted specifying the load shedding, obtaining load flow analyses before and after the fault. These results provide estimates of the incurred damages.
In the second phase, the genetic algorithm (GA) is executed, and variables such as population size, mutation rate, and the number of generators, among others, are initialized. A population of potential solutions is generated, and through generations, crosses and mutations are performed. The best individual is obtained based on each improved population. The term ’best individual’ refers to the topological reconfiguration of the system that restores electrical service to the maximum load in the system while respecting the network operator’s budget and nominal system constraints.
In the third phase, the system selected from the GA results undergoes mathematical analysis, optimizing the model presented in
Section 4.3, a modification of what the authors proposed in [
5,
6]. This optimization is achieved through nonlinear programming with discontinuous derivatives using GAMS to determine an optimal energy dispatch.
The rest of this article is organized as follows: First,
Section 2 provides a literature review addressing optimization problems in electrical power systems in various contexts, focusing on classifying optimization techniques and analyzing commonly used strategies. Mathematical optimization is discussed, and methods are outlined.
Section 3 describes the methodology used in this study, while
Section 4 presents the mathematical model analyzed for energy dispatch optimization and the mathematical model representing network reconfiguration.
Section 5 details the analysis of the IEEE 9 and 30-node test systems. Finally, in
Section 6, conclusions and final results are presented.
In summary, this article integrates the following components to achieve the following objectives:
A reduction in costs due to unsupplied electrical energy through topological reconfiguration.
A reduction in load shedding through the topological reconfiguration of the network, improving service provision.
The development and implementation of a genetic algorithm to fulfill the two aforementioned objectives.
Cost reduction through the implementation of nonlinear programming with discontinuous derivatives to perform optimal energy dispatch in GAMS.
2. Literature Review
The reconfiguration of distribution networks (DSR) is a problem whose main focus is to improve undesirable phenomena intrinsic to the network, with energy losses being the most studied. However, the study of DSR has expanded to new relevant challenges such as reliability, load balancing, voltage profile improvement, uncertainty, the implementation of renewable energy generators, and load capacity, among others. The objective of this research is to perform a topological reconfiguration to minimize load loss and economic impacts resulting from disruptive events in distribution networks. This is based on the research conducted in [
5], which describes and classifies the most used techniques to solve combinatorial problems related to the mentioned aspects. For a more in-depth exploration of techniques and other research related to the topic, you can refer to [
7], which provides a study of various works of research and studies related to power system reconfiguration.
In [
8], an innovative approach is proposed for the location and sizing of distributed generation (DG) in active distribution networks (ADN). Unlike traditional methods, it integrates DG location and sizing problems with network reconfiguration to minimize total costs during the planning period. The model, solved with GUROBI, is validated on a modified 33-bus IEEE system.
In [
9], the authors present a systematic approach for obtaining an optimal long-term reconfiguration program in energy distribution systems. An innovative and adaptive parallel genetic algorithm (GA) based on fuzzy logic is introduced, using parallel computing to identify the optimal network configuration. This approach aims to address NP-hard combinatorial optimization problems in distribution systems, highlighting the efficiency of a parallel GA in solving the problem.
In [
10], a multiperiod network reconfiguration is performed to meet the hourly hosting capacity requirement under a minimum required number of switching operations. The study was conducted on two IEEE 123-bus power systems and a 1001-node system.
In [
11], traditional feeder reconfiguration methods in distribution networks are improved by considering reverse power flows, controllable loads, and multiphase representations of the network. A compensation technique for switch exchange is proposed, offering an exact solution without matrix refactoring. The approach accelerates the reconfiguration method, being three times faster than conventional methods by using a positive sequence network model.
In [
12], the reconfiguration problem is addressed from three key perspectives: a comprehensive analysis of the search space and its importance for the efficient development of metaheuristics, the relevance of exact optimization models in the current optimization context, and a detailed review of the main operators for metaheuristics applied to this problem. Optimal solutions from systems analyzed in the literature are presented, concluding the need to establish a new database with larger and more complex systems as a reference for future optimization proposals for the reconfiguration problem, with the intention of providing guidance for the development of efficient algorithms focused on network reconfiguration.
In [
13], the issue of voltage fluctuations is addressed, and a topological reconfiguration with a different approach is proposed, aiming to minimize network power loss and restrict voltage volatility indices through the coordination of switched capacitor banks.
In [
14], an algorithm for network reconfiguration is presented, which could assist in the operation and expansion planning of three-phase distribution systems. Considering power losses, similarly in [
15], the goal is to reduce losses in stressed power systems where common techniques are not convenient. This is conducted through an efficient two-stage algorithm. In the first stage, an efficient reconfiguration plan is obtained based on the minimization of reactive power losses. Using the heuristics from this solution, employees in the second stage improved the harmony search algorithm for reconfiguration with load capacity enhancement.
In [
16], a combined approach of network reconfiguration and Volt-VAR control devices is proposed for energy savings in networks with distributed generation. This is achieved through the coordination of traditional VVC devices, distribution network reconfiguration (DNR), and an intelligent photovoltaic inverter (PVSI) for energy savings.
In [
17], the network reconfiguration approach is proposed, comprehensively considering N–1 security and network loss.
2.1. Mathematical Optimization Methods
This method refers to a systematic approach based on mathematical principles and techniques for solving optimization problems, focusing on finding the optimal values of variables within a set of constraints, with the objective of maximizing or minimizing an objective function.
In [
18], the authors propose a Mixed-Integer Programming model for Transmission Network Expansion Planning with Battery Energy Storage Systems (BESSs).
In [
19], the method of Mixed-Integer Second-Order Conic Programming (MISOCP) is presented to solve the reconfiguration problem in electrical distribution systems.
In [
20], the authors propose reducing losses in the electrical distribution network through system reconfiguration (DSR). This process adjusts switches to minimize losses, ensuring a radial configuration and meeting voltage limits and load demands. An efficient mathematical model is presented that considers voltage profile, demonstrating its effectiveness in test systems and real networks.
In [
21], the authors propose a two-stage robust optimization model to determine the network configuration with minimal losses. In the first stage, a radiality constraint is applied before knowing the actual loads and renewable generation, while in the second stage, energy flows are calculated considering the worst operational conditions.
In [
22], an optimization strategy based on the exhaustive enumeration of all feasible configurations in an electrical distribution network is proposed. It focuses on annual reconfiguration planning, taking into account the limited durability of switches. The optimization seeks to determine the optimal switch configurations and their reconfiguration periods.
In [
23], the novel technique of an efficient algorithm based on graph theory is used for the topological reconfiguration of the network.
Although the mathematical methods presented offer optimal solutions for network reconfiguration problems, they require a high level of computational effort and intensive processing capabilities. In the field of mathematical optimization, two fundamental aspects must be considered: the speed of convergence and the demand for computational processing capacity. The fastest methods in processing to find a solution may not provide the best possible solution, while slower methods that require more processing capacity give us the global optimal solution, that is, the global minimum.
2.2. Heuristic Optimization Methods
A heuristic optimization method refers to a technique used to address complex optimization problems and find approximate solutions. Unlike exact optimization methods that search for the global optimal solution, heuristic approaches focus on finding acceptable solutions in a reasonable time, without guaranteeing the best possible solution.
These methods rely on heuristic principles, rules of thumb, or strategies inspired by experience or expert knowledge to guide the search toward promising solutions. They are especially useful in problems where the search space is too large or complex to be exhaustively explored in a reasonable time.
In [
24], the authors present a heuristic approach for addressing the problem of power systems with time-varying loads and distributed generation, without the need to perform exhaustive power flow calculations.
The method proposed by the authors of [
25] introduces an innovative approach to power system analysis by replacing traditional power flow calculations with the use of current and resistance vectors. This approach represents a significant advance in the field as it eliminates the need for complex power calculations, which can simplify and streamline system analysis.
By using current and resistance vectors instead of power, the proposed method allows for obtaining relevant results without the need to calculate voltage and power values at each point in the system. This can be especially beneficial in large, complex power systems, where traditional power flow calculations can be computationally intensive.
2.3. Metaheuristic Optimization Methods
These methods are inspired by natural processes or abstract concepts to guide the search for optimal or near-optimal solutions. They use techniques such as global exploration of the search space, the use of adaptive evaluation functions, the use of random moves, and iterating over multiple solutions to escape local optima and find potentially better solutions.
Some examples of metaheuristic optimization methods are simulated annealing (SA), tabu search, genetic algorithms, particle swarm optimization, ant colony, and harmony search algorithms. These methods have been widely used in various fields, such as engineering, computing, economics, logistics and artificial intelligence, among others. They offer a powerful and versatile alternative for addressing complex optimization problems where traditional methods may be limited.
In [
26], the authors present the development of a chaotic stochastic fractal search algorithm (CSFSA) as an improvement of the SFSA algorithm (stochastic fractal search algorithm) to address the problem of loss minimization and to improve voltage profiles in electrical distribution systems.
The CSFSA algorithm is based on the use of sequences of chaotic and fractal numbers to explore the search space and find optimal or close to optimal solutions. This technique combines features of stochastic search and fractal search, taking advantage of the global and local exploration capabilities of both approaches.
In [
27], the authors compare the results obtained using a genetic algorithm (GA) and a particle swarm algorithm (PSO) to address network reconfiguration problems in power distribution systems. The main objective is to improve system reliability and reduce energy losses through network topology optimization.
The results that we presented when it was implemented in the 33-bus IEEE electrical network shown in
Figure 1 were an improvement in the voltage and current profiles. The comparison of these two methods shows that the PSO approach is more efficient than the GA, since this found the best configuration like the GA but in much less time.
2.4. Genetic Algorithms Used to Solve Optimization Problems
The goal is to minimize system power loss. A load flow method is employed, and enhancements are made to the genetic algorithm to prevent premature convergence. This approach is tested on distribution networks, and the study results are presented. In [
28], the authors propose an approach for assessing the resilience of electrical distribution networks in the face of natural disasters, aiming to restore service in affected areas efficiently and at minimal cost.
The use of genetic algorithms with an elitism mechanism is suggested to optimize the total cost function, considering the construction of interconnection lines, reliability, and resilience. The proposed method is applied to a test network feeder, demonstrating its superiority compared to other evolutionary methods used in the study, such as particle swarm optimization and the mixed leap-frog algorithm.
In [
29], the genetic algorithm stands out in the optimized design of computer networks in electrical systems. The article analyzes the specific application of the genetic algorithm in this context, describes its fundamental characteristics, and presents an optimization model for the interaction of computers in energy systems.
In [
30], a comprehensive review of the genetic algorithm and its application in electrical power systems engineering is presented.
In [
31], dynamic programming and genetic algorithms are used to enhance resilience in a system that encompasses both gas and electrical energy.
In [
32], reactive power optimization is performed for an intelligent system using a genetic algorithm, with the component of reconfiguration being carried out in real time.
In [
33], the challenges associated with significant uncertainties in wind power generation are addressed, proposing a Reactive Power Dispatch (ORPD) strategy using a heuristic search algorithm that combines the elitist nondominated sorting genetic algorithm with inheritance (i-NSGA-II) and a roulette wheel selection.
Finally, in [
34], the contributions of genetic algorithms are analyzed, and a comparison with the particle swarm optimization (PSO) method is provided.
3. Methodology
The proposed methodology in this research comprises three main parts, which are outlined below.
The first part involves selecting a network for analysis and conducting a load flow analysis to determine the network’s behavior under normal operating conditions, establishing a comparative reference. Subsequently, simulated damages to the system, such as taking generators and lines out of service, are performed. The disruptive event causing the most damage to the system is identified, and a network analysis is conducted to determine load shedding. Finally, load flow analysis is performed for the network before and after the damage, and these results are used for a comparison and analysis of the effects of the disruptive event on the network.
In the second part, the genetic algorithm (GA) is executed. Algorithm variables, such as population size, mutation rate, and the number of generations, among others, are initialized. With these parameters, the GA process begins by generating an initial population of potential solutions. Subsequently, individuals with the best genetics in the population are selected. During the reproduction phase, crossover is performed with the best individuals, generating an improved new population. The mutation process iterates over individuals in the improved population, making changes based on the defined mutation rate to add dynamism to the solutions and avoid local maxima. Depending on the number of generations and each improved population, a good individual is obtained, representing a new topological reconfiguration of the network with strategically placed lines and distributed generation to minimize unsupplied electrical energy, leading to a decrease in costs associated with unsupplied electrical energy. However, it is important to note that the primary goal of the GA is to minimize load shedding, which is why the cost variable is not part of the initial GA variables.
In the third phase, the result generated by the genetic algorithm (GA) selects the power system for mathematical analysis. The intention is to optimize the model presented in
Section 4.3 using discontinuous derivative nonlinear programming through GAMS with the aim of determining an optimal energy dispatch for each generator in the system. The GA and GAMS are not integrated because the reconfiguration generated by the GA focuses strictly on reducing load shedding at a moment of maximum load, representing the peak in the load curve. However, power fluctuations are a widely studied phenomenon; therefore, this energy dispatch analysis is implemented to efficiently supply loads throughout the day, reducing costs associated with energy generation and power losses in the lines.
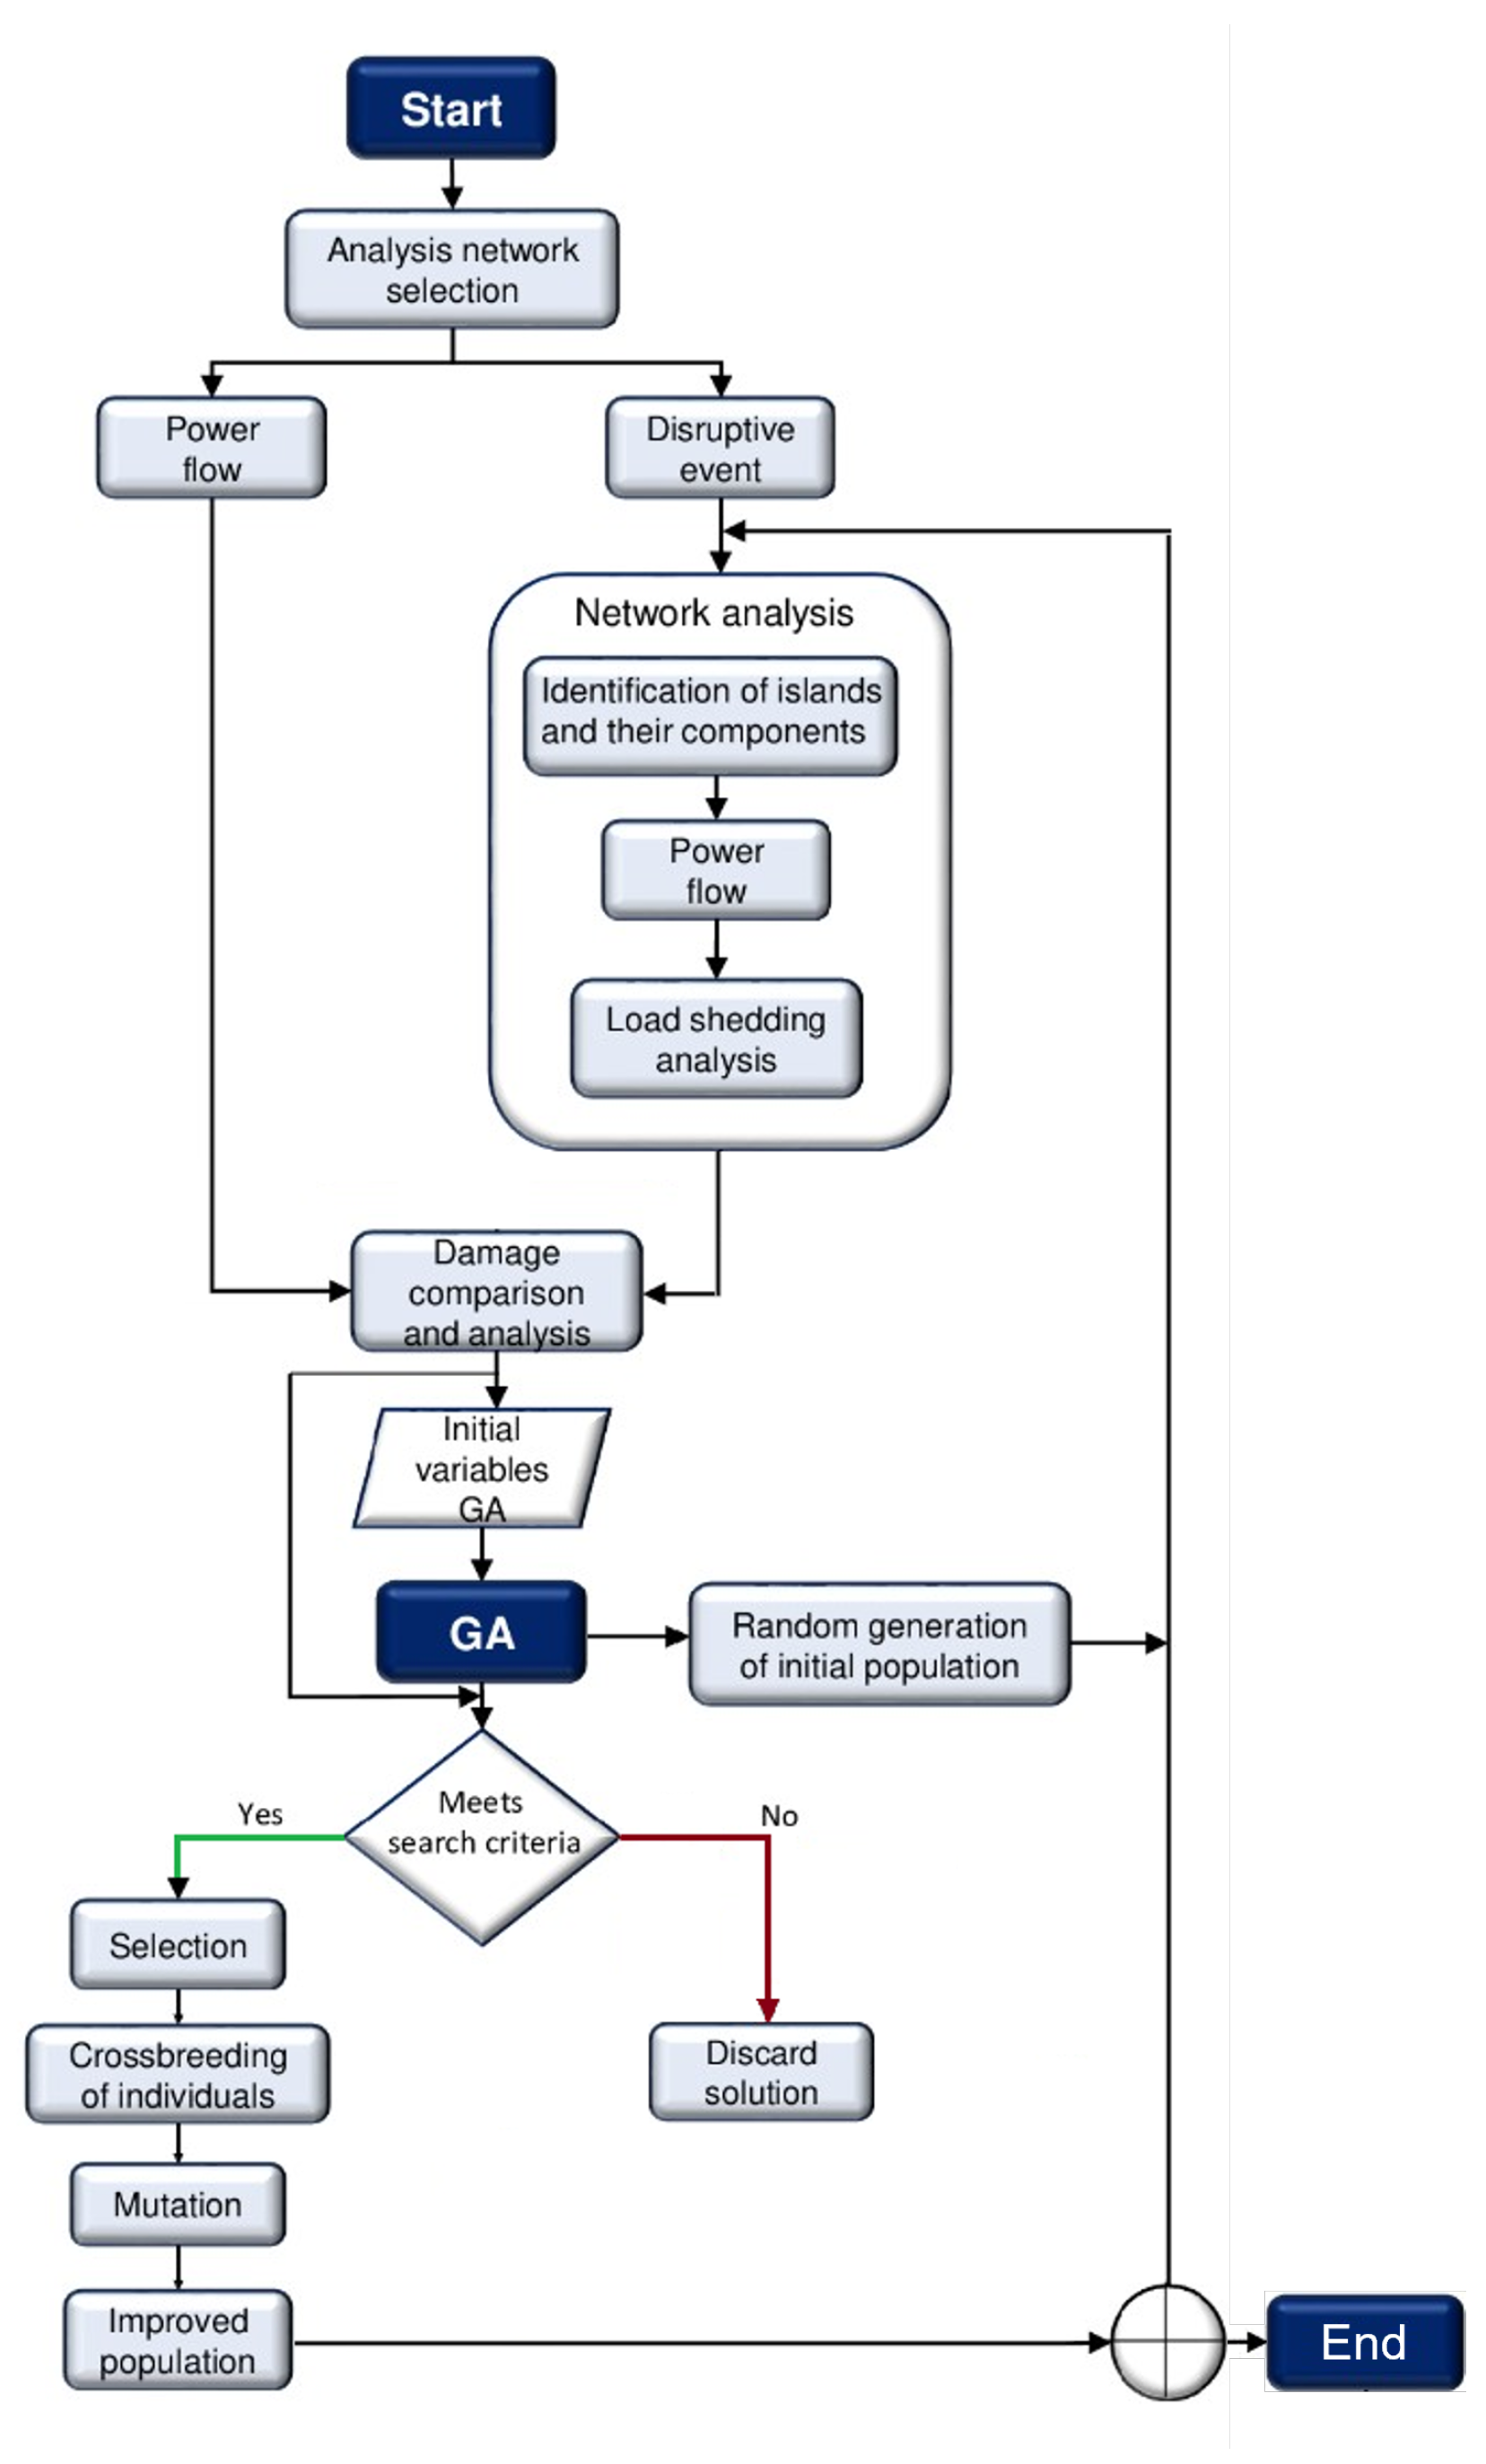
The described methodology is depicted in the flow chart shown in
Figure 1, and the pseudocode used in the software execution is described in
Table 1. Line 1 defines the class responsible for defining the algorithm, and the process begins with obtaining the initial population in line 3. From line 5 to line 12, iterations are performed based on the defined number of generations, calling functions to execute each step of the genetic algorithm from line 13 to line 24. Finally, the program is executed with the initial GA parameters in lines 25 to 27.
4. Mathematical Models for Network Analysis
The following mathematical models are proposed for the study and understanding of the reconfiguration of power systems, including the objective functions and constraints of the power systems.
Equations (
2) and (
3) express the nodal active and reactive power balances (Kirchhoff’s current law, KCL). Equation (
4) describes the net summation of voltage drops across all branches in a planar loop, ensuring it equals zero (Kirchhoff’s voltage law, KVL). In this equation,
is constrained to be zero.
Equation (
6) delineates the relationship between the complex power of each branch and its active and reactive components. Additionally, (
6) expresses complex power in terms of nodal voltages and branch currents. Constraints (
9) and (
8) impose limits on the voltage and current, respectively. It is noteworthy that (
9) ensures an acceptable voltage level for network buses to compensate for voltage drop
subject to:
where:
: set of branches.
n: number of buses (nodes).
: active power losses on branch .
: reactive power losses on branch .
: complex power on branch .
: active power on branch .
: reactive power on branch .
: magnitude of voltage at bus i.
: minimum voltage limit.
: maximum voltage limit.
: active power from the substation at bus i.
: reactive power from the substation at bus i.
: active power demand at bus i.
: reactive power demand at bus i.
: magnitude of current flow on branch .
: maximum current on branch .
: resistance of branch .
: reactance of branch .
: variable to represent Kirchhoff Voltage Law (KVL) in the loop formed by branch .
4.1. Multi-Objective Mathematical Formulation for the Optimization of Operation Costs with Distributed Generation
A well-known phenomenon that increases network operation costs is power losses. Therefore, an objective function is formulated to minimize power losses to the maximum extent possible. This is achieved by summing the reductions in power loss resulting from both reconfiguration and DG connection. The reconfiguration is subject to voltage, current, and power flow constraints.
where:
is total real power loss reduction due to reconfiguration.
is total real power loss reduction due to the connection of DG.
4.2. Power Loss through Network Reconfiguration
The purpose of employing reconfiguration in a distribution network is to identify an optimal configuration that minimizes power loss without violating operational constraints. These constraints encompass voltage limits and the current capacity of the feeder supplying each bus. The power loss in a line section connecting buses between i and i + 1, following the network reconfiguration, is calculated as follows:
Thus, the total power loss is represented as:
where
i represents the
i-th node of the system and n the total number of nodes in the system.
Power Loss Using DG
The integration of distributed generation units at optimal locations in a distribution system offers various benefits, such as the mitigation of line losses, the improvement of voltage profiles, a reduction in peak demand, and the alleviation of overloads in distribution lines. The calculation of the energy loss resulting from the installation of a distributed generation unit at an arbitrary location in the network is performed as follows:
Net power loss reduction,
, is the difference in power loss before connecting a DG unit.
DG penetration level limitation.
where
represents the penetration level of distributed generation, ranging between 1 and 0. Adhering to this constraint, the cumulative installed capacity of distributed generation must not exceed the aggregate active load demand.
4.3. Mathematical Model of Dispatch Costs
In the present study, the General Algebraic Modeling System (GAMS) language will be used for the analysis and optimization of mathematical models. The nonlinear programming with discontinuous derivatives (DNLP) optimization technique will be applied in GAMS, which is suitable for addressing economic energy dispatch problems.
The main objective is to achieve the optimal dispatch of electrical energy that minimizes power generation costs to cover demand, taking into account multiple factors such as the operating costs of power-generating plants and power flow restrictions. Additionally, dynamic variables will be considered, such as energy demand in different time periods, implying the analysis of load curves.
The proposed approach is based on mathematical models previously introduced by the authors in [
35,
36]. These models enable the formulation of constraints and objectives for the electrical system in a precise and representative manner.
The DNLP technique in GAMS is especially relevant for this type of problem, as it allows for handling nonlinear functions and discontinuities in derivatives, which are common characteristics in modeling the economic dispatch of electrical energy. This capability enables the derivation of optimal solutions, considering all the specific restrictions and conditions of the system, contributing to efficient and profitable operation.
Objective function
The objective function is a quadratic function that defines the cost of energy generation
where
is the active power of the i-th generator,
N is the total number of generators, and
,
,
are the cost coefficients of the i-th generator.
The objective is to minimize the equation respecting the restrictions described below.
Power balance restriction
The power balance entails maintaining equality between the power generated and the power consumed within an electrical system, accounting for losses in the transmission lines. It is a critical aspect in the planning and operation of electrical systems, aimed at optimizing generation while minimizing losses.
where
is the power generated at the i-th
node,
is the power demand at the i-th load node
, and
is the power loss in the transmission lines.
The
term in the equation is defined as shown in the following equation:
where
is the total number of nodes.
In the optimization model, these equations act as restrictions for solving the problem.
Restriction of minimum and maximum powers
The inequality constraints are determined via the maximum and minimum limits of active power generation, as depicted in the equation
where
is the total number of generators.
In summary, optimal economic dispatch in a power system is an optimization problem aiming to find the optimal combination of power generation to satisfy electrical demand at the lowest possible cost. Addressing this challenge involves using mathematical models incorporating an objective function that seeks to minimize generation costs and constraints, ensuring power balance and adhering to generation limits for each generator.
Furthermore, the analysis of economic dispatch builds upon the approaches outlined in [
36], where the equations representing power balance and constraints on minimum and maximum powers are defined.
In conclusion, optimal economic dispatch is a fundamental task in the planning and efficient operation of power systems. Resolving this task requires employing mathematical models and optimization algorithms to minimize generation costs, maintain power balance, and adhere to the generation limits of the generators.
The load curve is a graphical representation of the variation in electrical energy demand over time. It is a fundamental tool in the planning and management of electrical systems, enabling the visualization and understanding of energy consumption patterns.
The load curve illustrates how electricity demand fluctuates throughout the day, week, month, or even the year. Generally, it exhibits a characteristic shape with periods of high demand during peak hours and periods of lower demand during off-peak hours.
This information is crucial for operators of the electrical system, enabling them to make informed decisions regarding energy generation and distribution. With a clear understanding of the load curve, generation resources can be adjusted to efficiently meet demand, minimizing costs and optimizing system capacity.
Moreover, the load curve serves as a valuable tool for identifying consumption patterns in different sectors, such as residential, commercial, and industrial. This is useful for designing energy efficiency programs, establishing appropriate electricity rates, and planning for the future growth of electrical infrastructure.
As mentioned in [
37], it is essential to consider the load curve due to the growth in the final uses of electricity. Managing variations in electrical energy demand over time has become crucial, especially in the residential sector. Hence, optimal dispatch analysis will be conducted, taking into account the load curve, to determine the best management of the system’s generation capacity and the installed distributed generation.
5. Application of Algorithm for Network Analysis
An analysis will be conducted for each test case, following the subsequent structure: initially, the analysis case will be presented, detailing the network parameters. Following that, the disruptive event to the network and its consequences in terms of load shedding will be outlined. A solution will then be proposed through the application of a genetic algorithm (GA), and an optimal dispatch analysis will be performed to determine the optimal power dispatch.
Table 2 displays the initial cost parameters used to constrain the solutions provided by the genetic algorithm based on costs. The generator cost index assigns a cost to distributed generation based on the active power supplied to the system, while the line cost index assigns a cost to the distribution lines based on their total length. The last parameter shown in the table is the budget designated by each network operator to apply the contingency.
Similarly, the table presents the parameters designated for the execution of the genetic algorithm for each case. This includes a percentage of probability for mutation in each generation, the size of the initial population, and the population size when performing the crossover and mutation. The size of the selection is also defined, referring to the number of individuals from each generation selected as suitable solutions to carry out the crossover of characteristics.
Finally, the number of generations is defined, representing the iterations for which the algorithm is repeated. It is important to highlight that the appropriate choice of these parameters can significantly impact the quality of the solutions obtained and the computational efficiency of the algorithm. Therefore, it is essential to conduct a detailed analysis of the power system, considering aspects such as network topology, component limitations, and network size, to determine the optimal values of the genetic algorithm’s parameters and the network operator’s cost and budget indices.
5.1. Nine-Node IEEE System Analysis
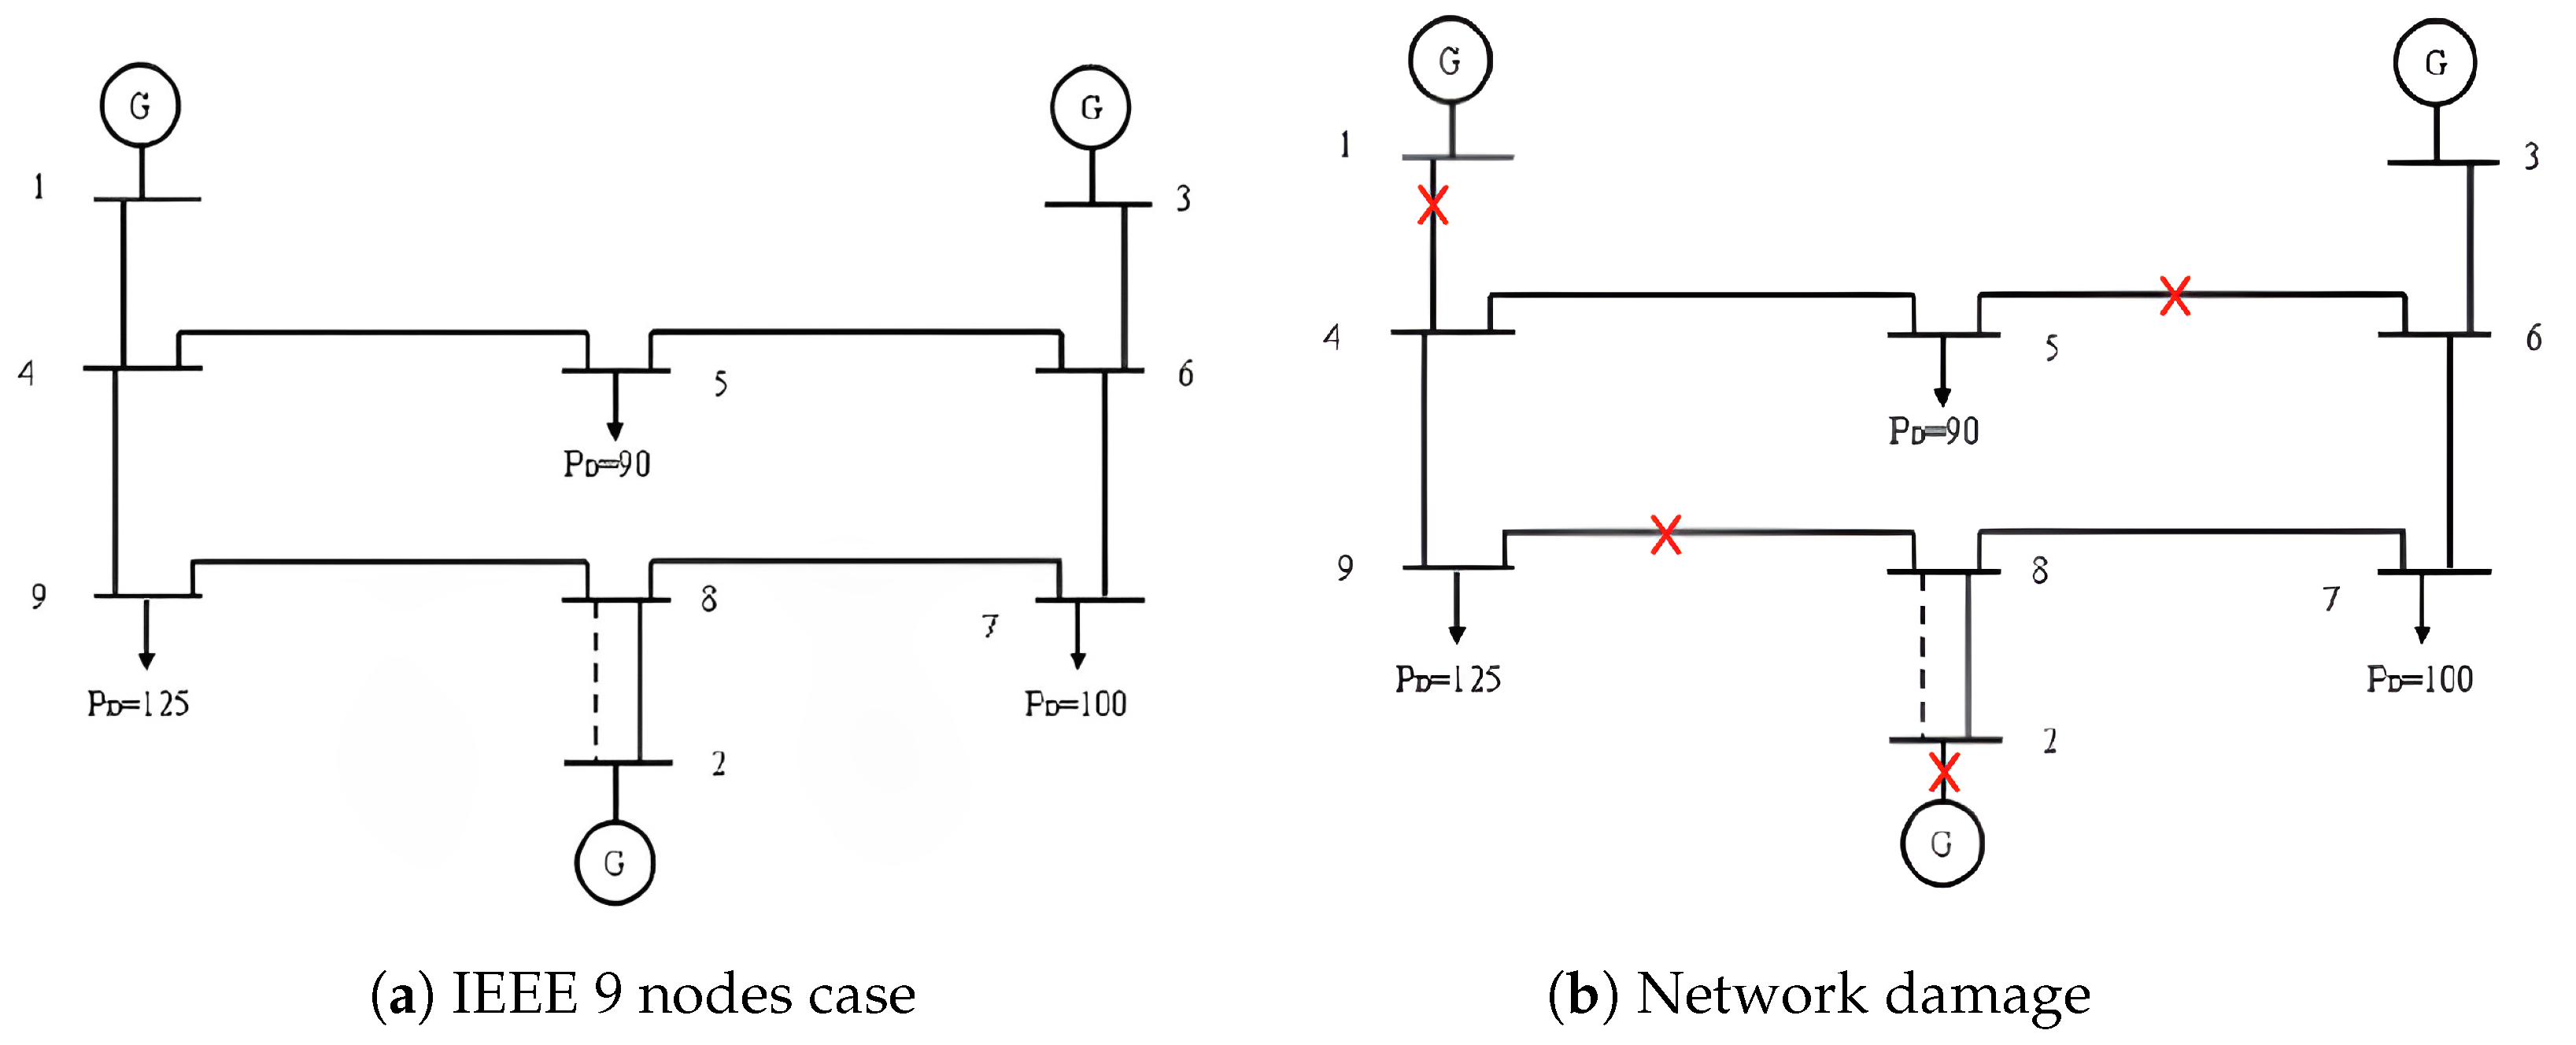
Next, the genetic algorithm will be applied with the objective of optimizing the topological reconfiguration in the IEEE 9 system shown in
Figure 2a in response to the damage illustrated in
Figure 2b. The system is documented by the authors in [
38], and the network parameters are detailed in
Table 3,
Table 4 and
Table 5.
Table 3 displays the line parameters. Each line is characterized by its index, name, origin and destination bus, length in kilometers, resistance and reactance per kilometer, capacitance and conductance per kilometer, maximum allowable current in kiloamperes, drop factor, and type of element. These parameters are used to analyze and model the behavior of the network in question, enabling the evaluation of its performance and the determination of optimal solutions for the problem under study.
Table 4 provides information about the electrical system buses, specifying their nominal voltage level, bus type, associated zone, service status, and maximum and minimum voltage limits. These data are essential for the analysis and design of the electrical system. Additionally, they indicate the connection node for each system load.
Table 5 provides information on the system generators, specifying the index that identifies each generator, the name of the bus to which it is connected, the active power generated in megawatts (MW), and the voltage in per unit (pu). The limits for both minimum and maximum reactive power are also specified.
In addition to the generated power, other relevant parameters are indicated, such as the control capacity of the generator and its operating status. These generators are considered controllable, meaning that the power they generate can be adjusted according to the needs of the system.
5.1.1. GA Damage Analysis and Solution
The damage applied to the network represented by the red cross consists of the generator connected to bus 2 going out of service, and the system disconnecting from the external network connected to bus 1. The line connecting nodes 5 and 6 will also be out of service, and finally, the line connecting nodes 8 and 9 will be out of service. As can be seen, this damage creates two islands in the system, leaving the loads of buses 5 and 9 completely unattended, as shown in
Figure 3b. This represents 215 MW, which is 68% of the total load of the system. It should be noted that once the power flow in the affected network is running, no overload was observed either in the lines or in the generators and other network elements.
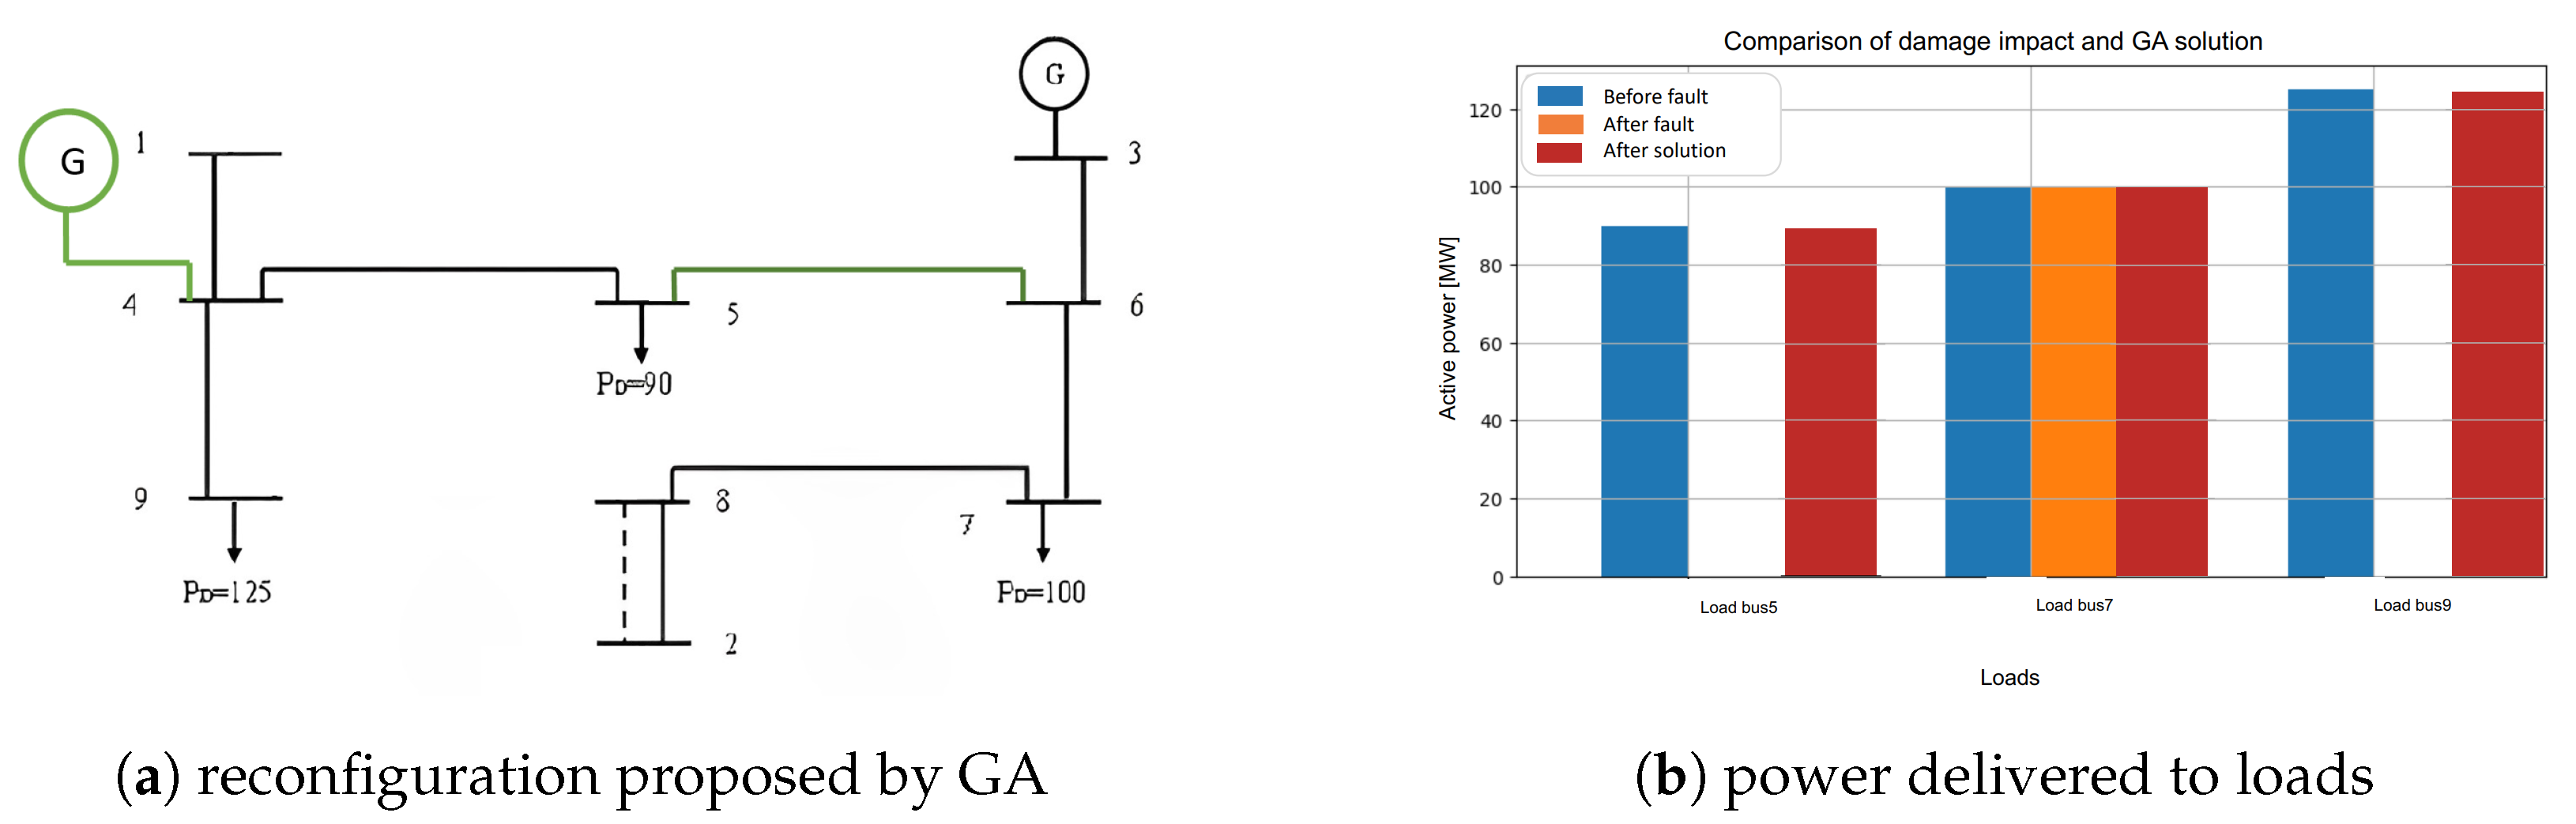
Executing the GA developed for this disruptive event resulted in obtaining an optimal topological reconfiguration for the system, as shown in
Figure 3a. Additionally,
Figure 3b shows three scenarios of power allocation to loads representing before the event, after the event, and when applying the solution to which the genetic algorithm converged. The first scenario (blue bars) shows the normal operation of the system, supplying the total power to the loads of each node whose parameters are shown in
Table 4. The second scenario (orange bars) describes the load shedding in each node as a consequence of the disruptive event, as evidenced in nodes 5 and 9 where the orange bar is zero. Scenario three (red bars) represents the situation after the GA solution was applied.
As a result of the GA when applying distributed generation to the system, the added generator has the characteristics shown in
Table 6a. It should be noted that the characteristics of the added generator were entirely determined via the genetic algorithm. Similarly,
Table 6b presents the parameters of the transmission line.
The location of the distributed generator at node 4 appears to be a very good solution because if it were installed at bus one, the impact on the load level would be the same. However, power losses in the system lines would be greater due to the increased distance from the generator to the consumption points. Likewise, installing a generator on bus 5 would imply a decrease in the voltage of bus 9 and an unnecessary overload of bus 5. The best benefits are obtained by installing distributed generation on bus 4 or bus 9 since it supplies the loads with the least loss in the lines. In accordance with this, the GA converged on one of these solutions, including the restoration of the line that connects nodes 5 and 6, supplying all the loads.
5.1.2. IEEE 9 - Cost Ratio and Reduction in Economic Losses
The analysis was conducted under conditions of maximum and constant load, specifically focusing on the hours of peak demand for electrical energy. Generally, the study concentrated on the period between 5:00 p.m. and 12:00 a.m., when the demand for electrical energy reaches its highest point. Therefore, the costs of electrical energy consumption were calculated for these 7 h.
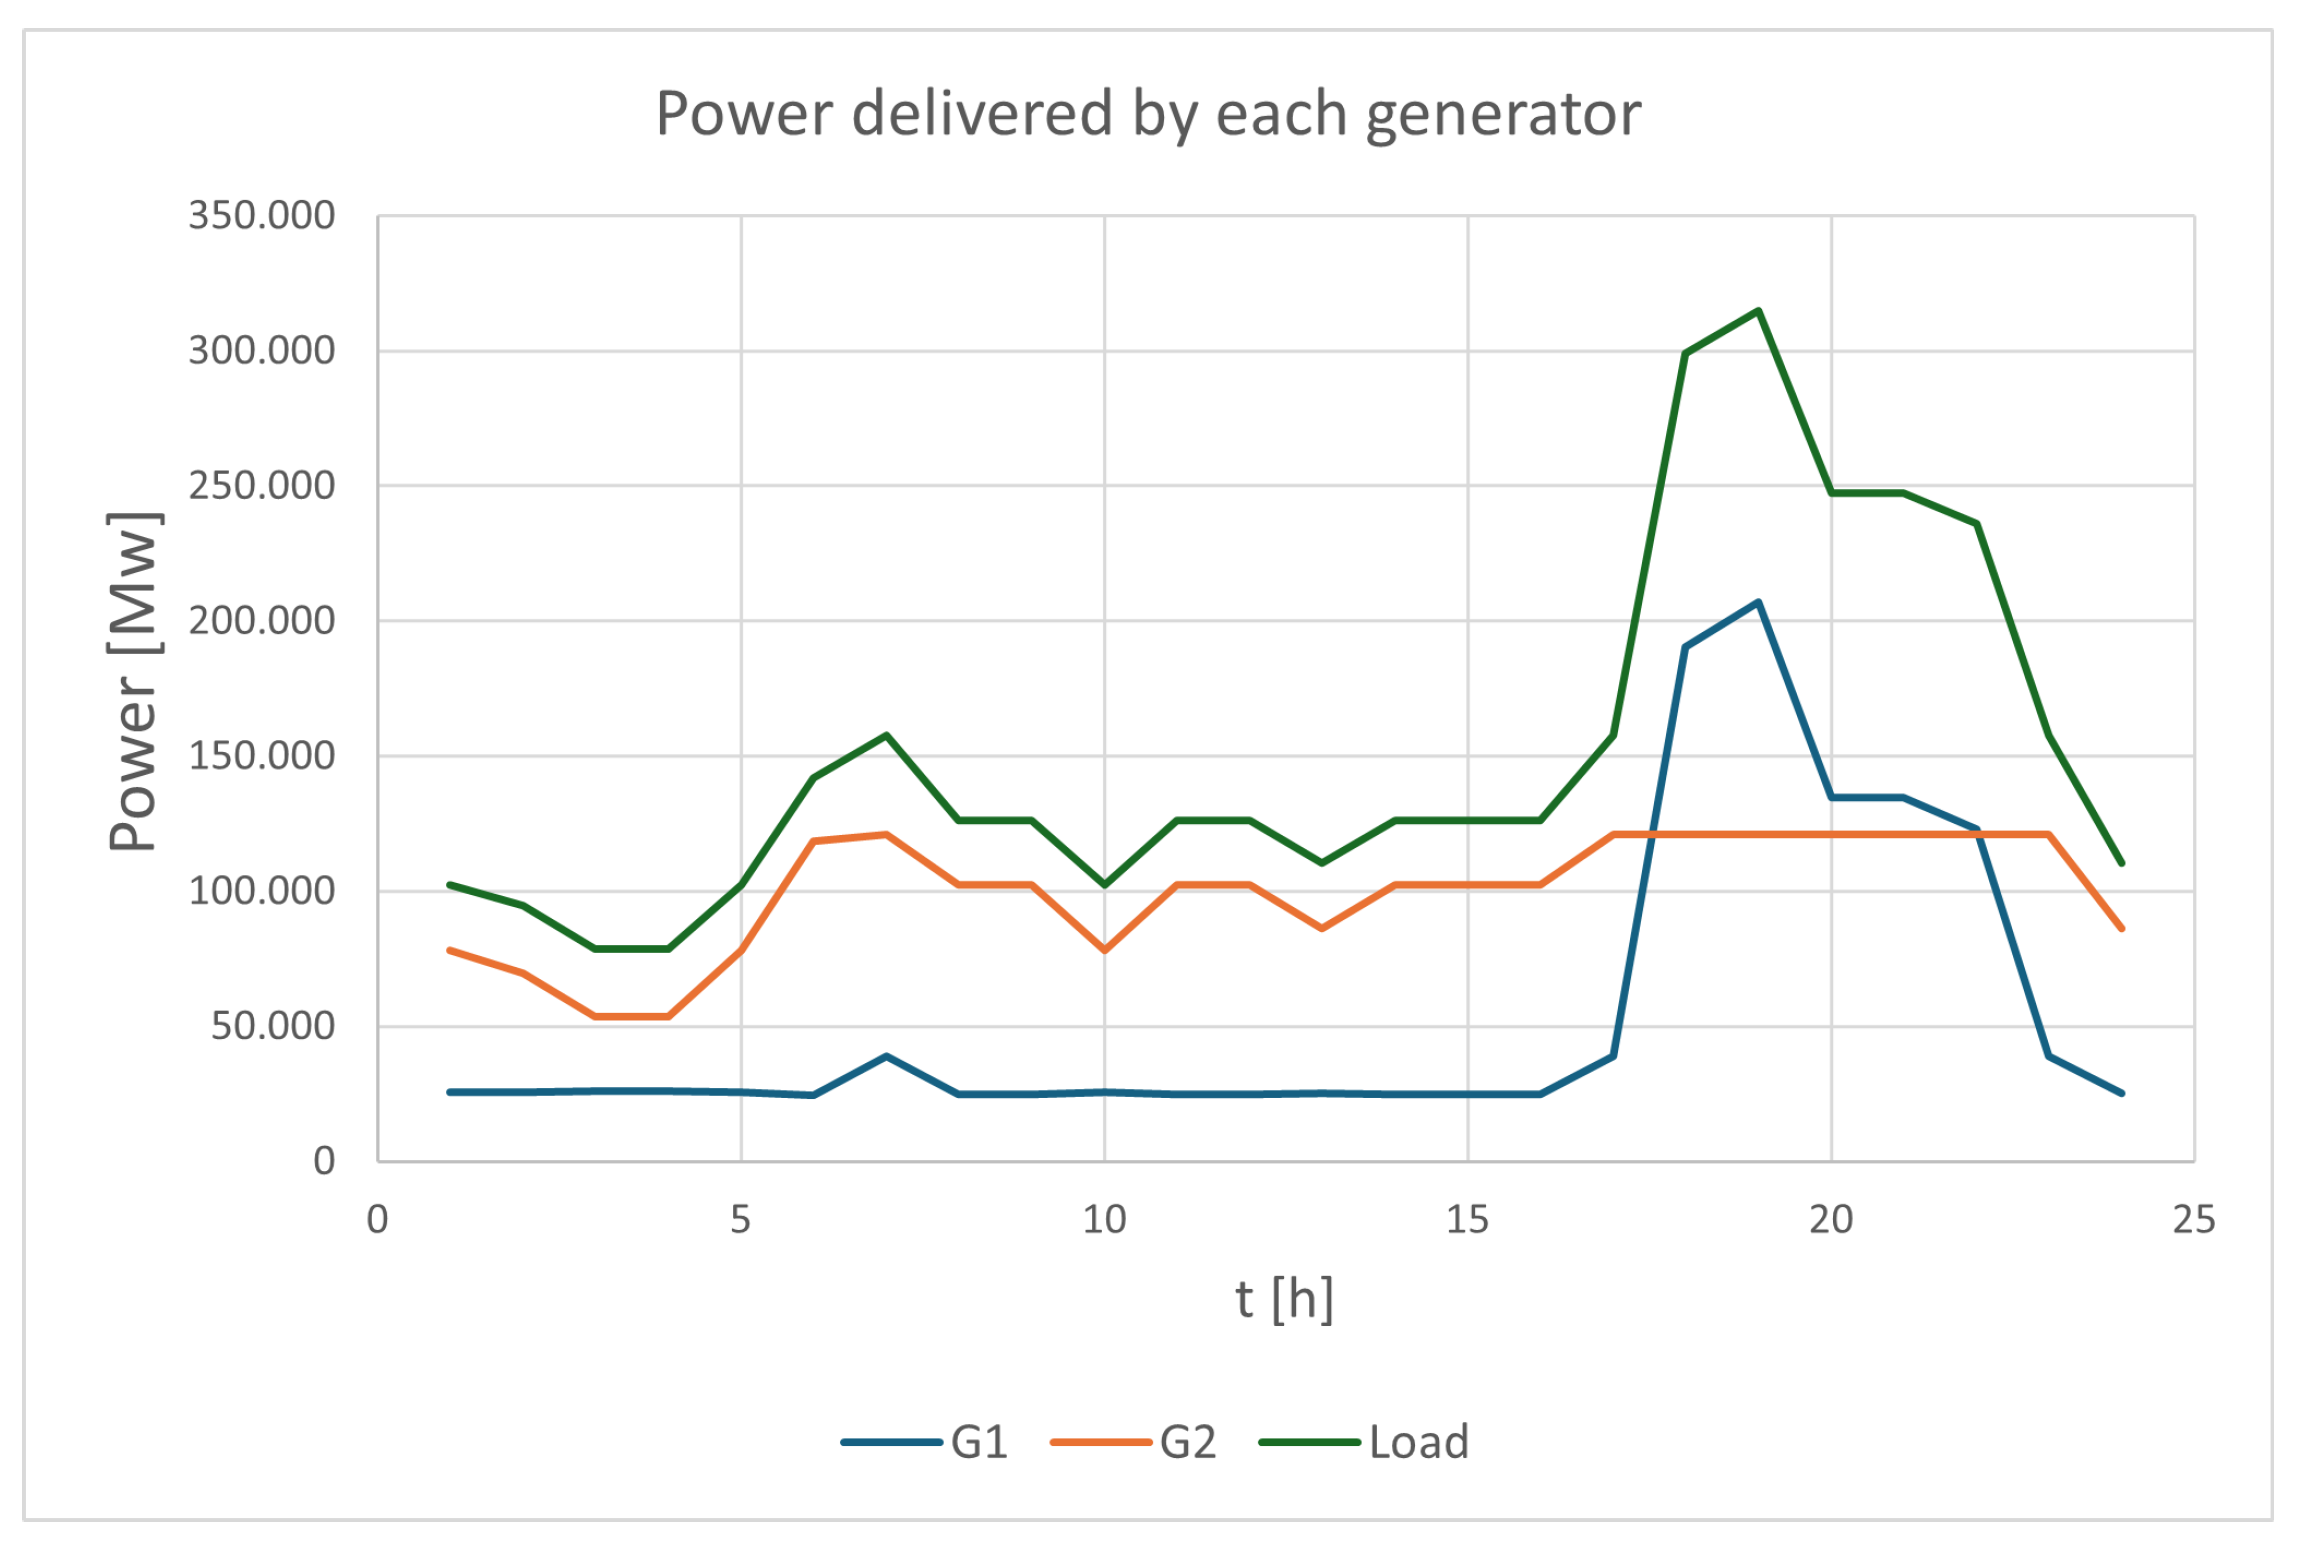
To perform optimal dispatch, a typical load curve for power systems is considered. This load curve is depicted in
Figure 4 (green curve) and is documented by the authors in [
39].
5.1.3. GAMS Report for Optimal Dispatch
Once the code is executed in GAMS, the generation parameters for each machine are obtained based on the load curve, with the aim of achieving optimal dispatch that minimizes generation costs. The resulting information is depicted in
Figure 4.
Table 7, which shows the data graphed in
Figure 4, represents the optimal generation dispatch for the nine-node IEEE system throughout 24 h a day, with the objective of minimizing power generation costs.
This table details the amount of generation (in power units) for each generator in the system in each time interval. The generators are represented as G1 and G2. Additionally, the load corresponding to each time interval is included.
It is important to highlight that this optimal generation dispatch is calculated to achieve a minimum cost, considering the characteristics and restrictions of the system.
It is recommended to perform a detailed analysis of the table to understand how energy generation varies depending on the load demanded in each time interval.
In summary, it is evident that both the results of the genetic algorithm (GA) and the optimal dispatch analysis demonstrated excellent performance in the IEEE nine-node test system. On the one hand, a 100% reduction in load shedding was achieved, meeting the network operator’s budgetary constraints. Additionally, a detailed report of the optimal dispatch is provided for each time interval using the load curve.
5.2. Thirty-Node IEEE Study System Analysis
Next, the GA will be applied to the 30-node IEEE system, with the objective of optimizing the topological reconfiguration of the network in response to the damage caused to the system.
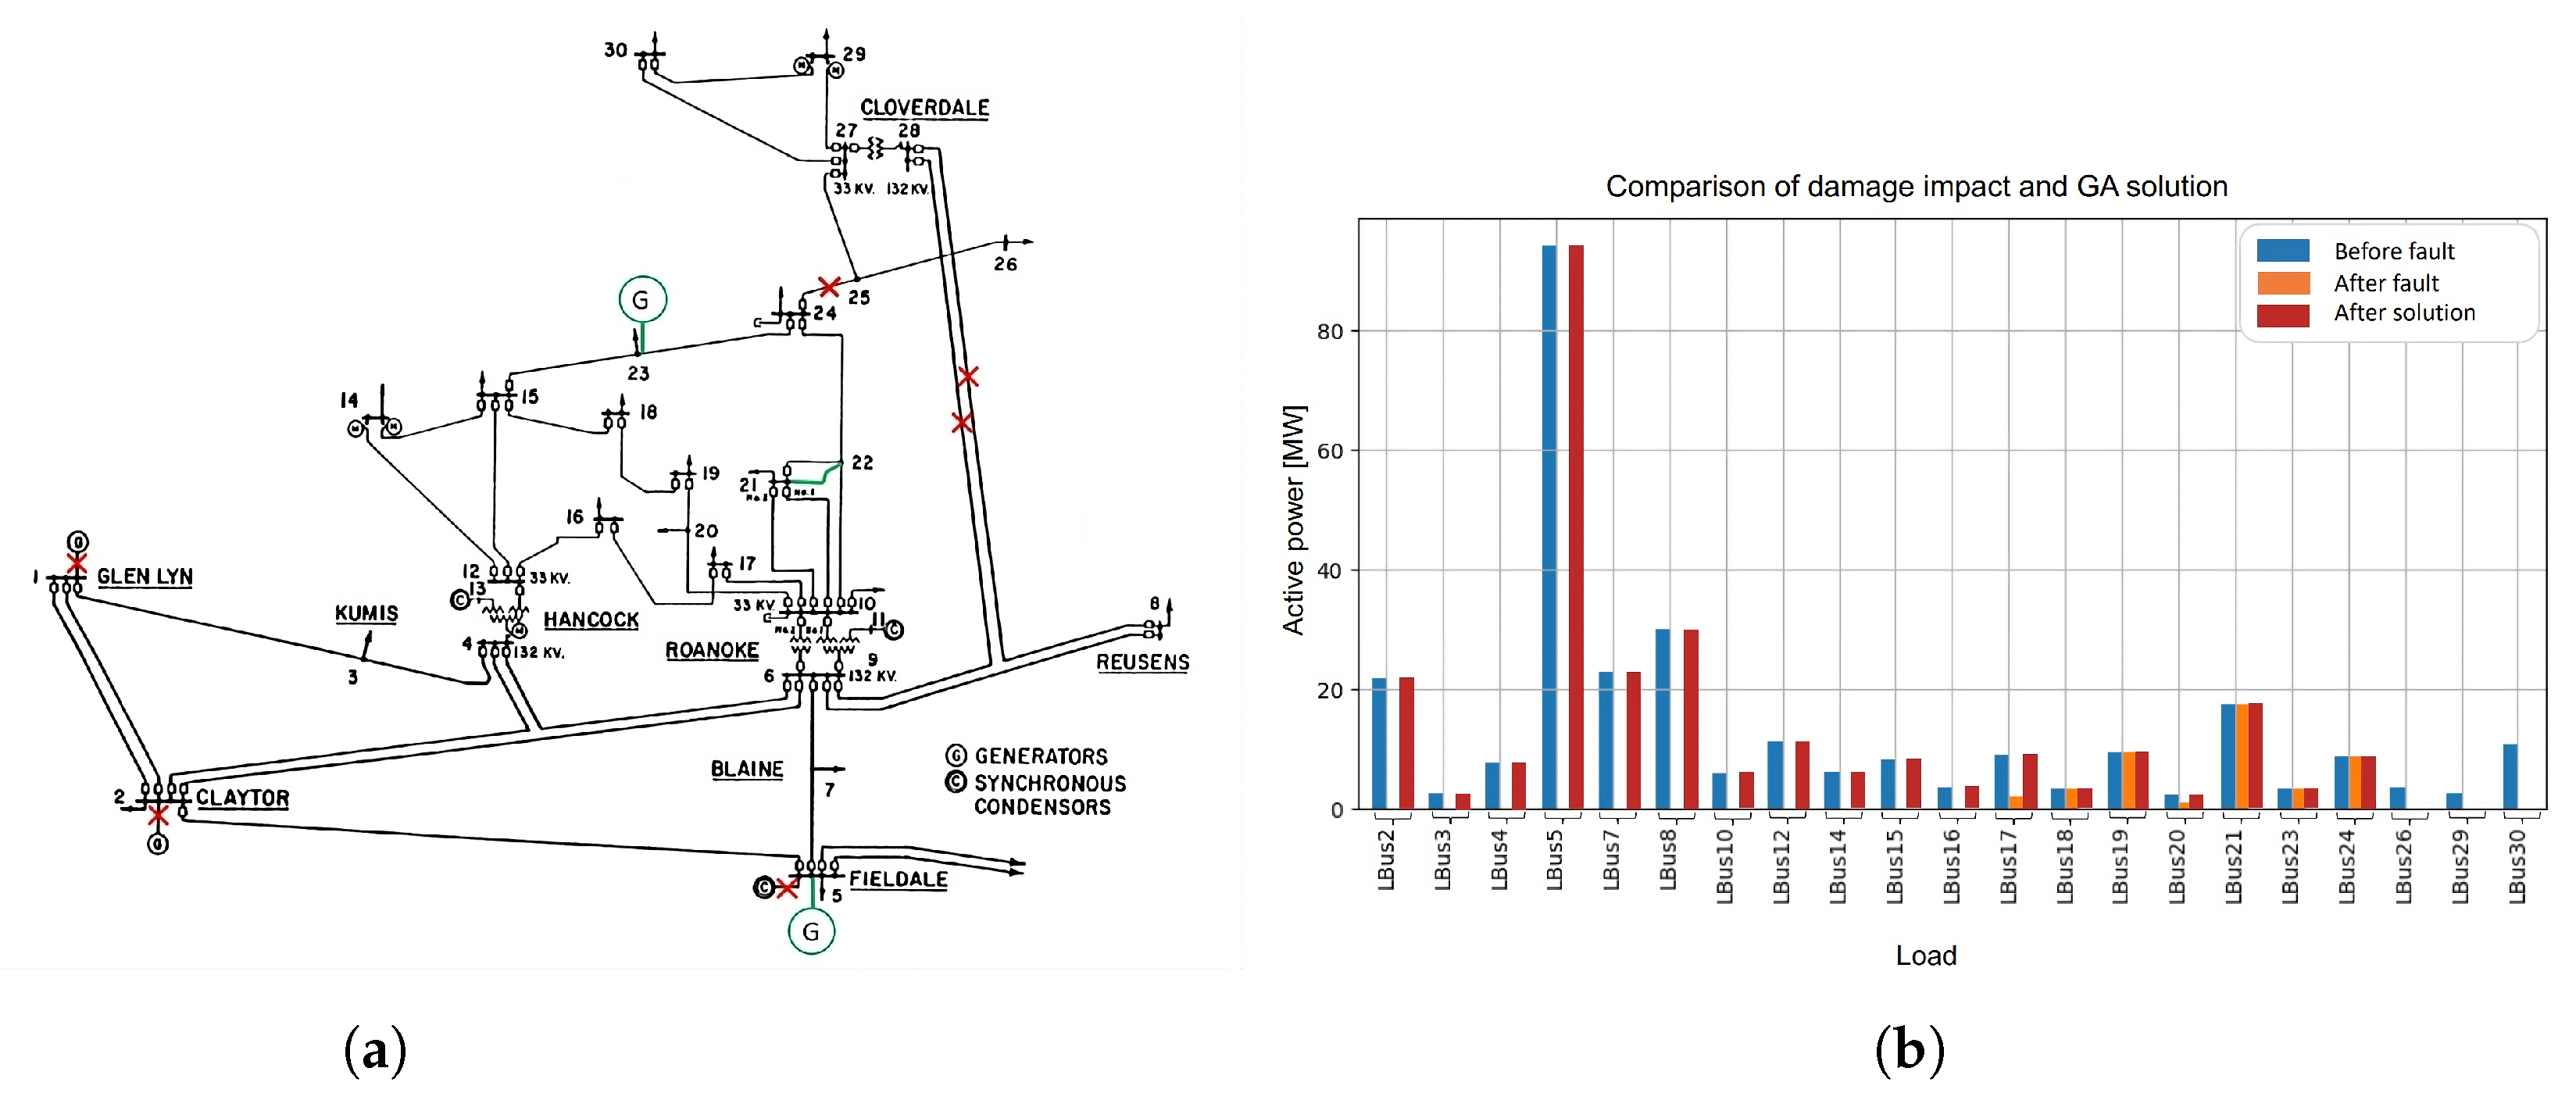
Figure 5a displays the test system, the applied damage, and the solution of including distributed energy resources (DER) and lines to the system.
The damage represented by the red crosses consists of the generator connected to bus 2 going out of service, the disconnection of the synchronous capacitor on bus 5, and the disconnection of the system from the external network on bus 1, which is the main power source. Additionally, three transmission lines are interrupted: the one connecting nodes 24 and 25, the one connecting nodes 8 and 28, and the one connecting nodes 6 and 28.
These failures result in the formation of two islands in the system, meaning that there are two groups of buses electrically isolated from the rest of the network. As a consequence of these failures, the load served on the system suffers severe load shedding. As seen in
Figure 5b, there is considerable load shedding, representing 84% of the total system load not being served after the disruptive event.
The solution represented by the lines and generators in green, obtained by executing the genetic algorithm with the parameters specified in
Table 2 for the IEEE 30-node system, allows for a topological reconfiguration of the network.
The proposed solution involves the incorporation of distributed generation at nodes 5 and 23, as well as the addition of a transmission line connecting nodes 21 and 22. The technical parameters related to distributed generation and the added line are presented in
Table 8a and
Table 8b, respectively.
Table 8.
Proposed network elements for network reconfiguration.
Table 8.
Proposed network elements for network reconfiguration.
| (a) Distributed generation |
| name | bus | p_mw | vm_pu | max_p_mw | min_p_mw |
| G_FATHER_1_2 | 22 | 40.5 | 0.848 | 60.65 | 0.0 |
| G_FATHER_2_1 | 4 | 13.50 | 0.848 | 20.250 | 0.0 |
| (b) Lines added to the system |
| name | from_bus | to_bus | length_km | r_ohm_per_km | x_ohm_per_km | max_i_ka |
| L_FATHER_2_0 | 20 | 21 | 0.504207 | 0.157100 | 0.400000 | 1 |
One notable result of this solution is the significant reduction in load shedding. Before the implementation of the solution proposed by the genetic algorithm, the system had an 84% unattended load, indicating a deficiency in demand satisfaction. However, thanks to the proposed reconfiguration, this percentage has been reduced to only 6% of unattended load.
Table 8b provides a graphical representation summarizing the before and after loading of the system on each node. It can be clearly observed how the implementation of the proposed solution significantly improves demand satisfaction, reducing unattended loading areas and improving the overall efficiency of the system.
5.2.1. IEEE 30 - Cost Ratio and Reduction in Economic Losses
The analysis was conducted under conditions of maximum and constant load, specifically focusing on the hours of peak demand for electrical energy. Generally, the study concentrated on the period between 5:00 p.m. and 12:00 a.m., when the demand for electrical energy reaches its highest point. Therefore, the costs of electrical energy consumption were calculated for these 7 h.
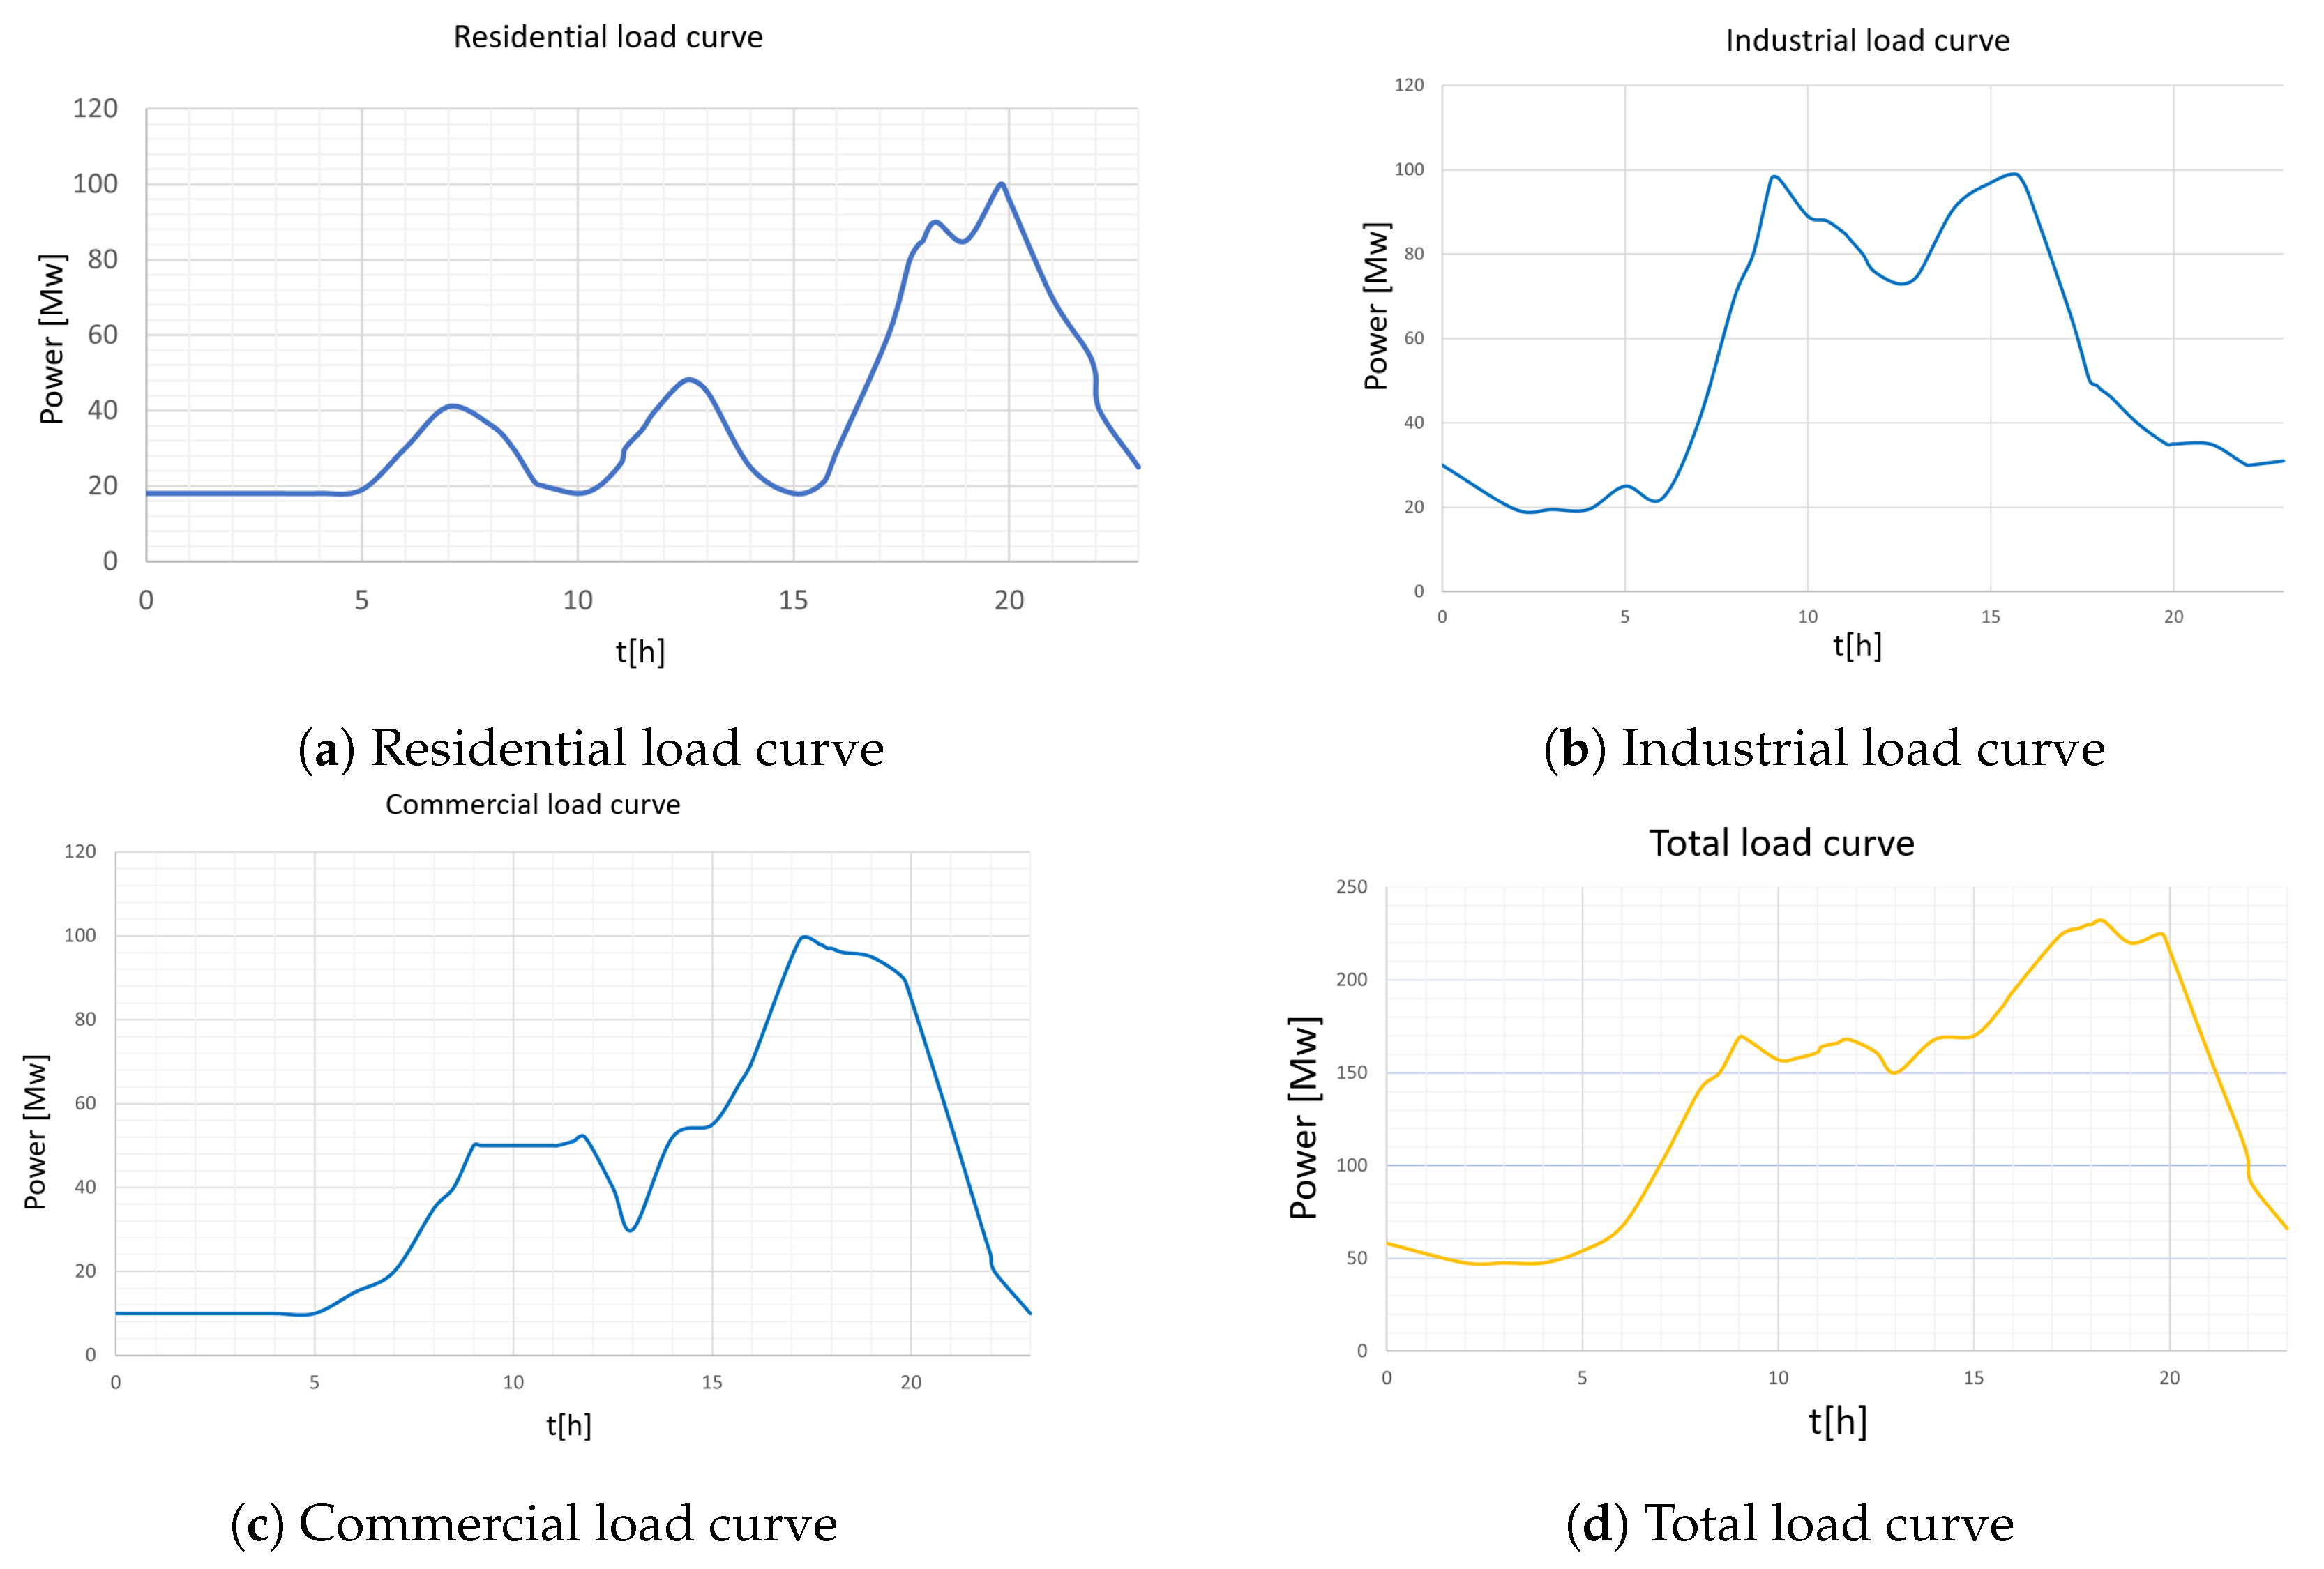
To carry out the optimal dispatch, the load curves of the 30-node system were taken from the study carried out in [
40]. The residential, industrial, and commercial load curves are shown in
Figure 6a,
Figure 6b, and
Figure 6c, respectively. Furthermore, the total load curve obtained by adding the above three curves is shown in
Figure 6d.
5.2.2. GAMS Report for 30-Node System
Once the code is executed in GAMS, the generation parameters for each machine are obtained based on the load curve, with the aim of achieving optimal dispatch that minimizes generation costs. The generation curves for each instant of time and for each generator, including distributed generation, are shown in
Figure 7.
This optimal generation dispatch for the 30-node IEEE system throughout 24 h a day is carried out with the objective of minimizing power generation costs.
This analysis shows the amount of generation (in power units) for each generator in the system at each time interval. The generators are represented as G1, G2, G3, G4, and G5. In addition, the load corresponding to each time interval is included.
It is important to highlight that this optimal generation dispatch is calculated by optimizing (minimizing) the mathematical model shown in
Section 4.3 to achieve a minimum cost, taking into account the characteristics and restrictions of the system.
In the case study of the IEEE 30-node system, it is observed that, although load shedding did not reach zero, there was a substantial reduction, thereby enhancing the system’s resilience. Furthermore, the optimal dispatch analysis revealed specific characteristics, such as consistent energy generation from generator 5. It is also noteworthy that generator 4 remained inactive during the initial 7 h of the day, contributing to this optimal energy distribution pattern.
6. Analysis of Results
The developed genetic algorithm proved to be efficient and capable of finding an optimal topological reconfiguration to reduce load shedding, depending on the network operator’s budget to handle such disruptive events. It is noteworthy that, for the first case study, the reconfiguration proposed by the developed software successfully restored electrical service to all users.
Table 9 shows the total cost of the proposed solution based on the indices established in
Table 2, along with the GA execution time. The GA demonstrates high efficiency, as good results were obtained in terms of execution time for the IEEE systems with 9 and 30 nodes, compared to the studies conducted in [
41,
42]. The developed GA reduces the execution times for power systems of 20 to 30 nodes by approximately 50%. It is important to highlight that, for the 30-node system, the software provided a solution that significantly reduced load shedding using only a small fraction of the defined total budget. The software was executed on a computer with the characteristics shown in
Table 10.
The proper implementation of distributed generation is emphasized as an effective strategy for reducing energy losses in electrical systems. Applying distributed generation results in a drastic decrease in line currents, meaning lower power losses associated with the resistance of transmission lines.
On the other hand, the mathematical analysis carried out in GAMS with DNLP proposes an energy dispatch where generation costs will be minimized, taking into account the load curve, losses in the lines, and parameters of each generator.
All the mentioned aspects substantially benefit the network operator and the end user since the power system analysis presented in this article is comprehensive, covering costs associated with load shedding, costs associated with energy generation, and costs associated with power losses in the lines, implementing a topological reconfiguration of the network that involves minimal costs, in addition to improving the reliability and resilience of the network.
7. Conclusions
In summary, the developed genetic algorithm has proven to be a highly efficient and cost-effective tool for mitigating load shedding in electrical systems. By optimizing topological reconfigurations within budget constraints, it successfully restored electrical services, notably achieving a significant reduction in load shedding in the 30-node IEEE system with minimal budget utilization. The integration of distributed generation emerged as an effective strategy, substantially decreasing line currents and lowering power losses in transmission lines.
The mathematical analysis using GAMS with DNLP showcased a comprehensive approach to energy dispatch, minimizing generation costs while considering load curves, line losses, and generator parameters. This holistic analysis addresses costs associated with load shedding, energy generation, and power losses, providing substantial benefits to both network operators and end users.
Overall, the combined application of the genetic algorithm, distributed generation, and mathematical analysis contributes to cost reduction, improved reliability, and enhanced resilience of power networks. These findings underscore the practical significance of the proposed methodologies in optimizing electrical systems, offering valuable insights for efficient and sustainable power management.
Separating the two methods does not imply a decrease in the solution’s quality since the reconfiguration’s objective is to minimize load shedding, making the costs of energy generation irrelevant. On the other hand, we validated the GA based on the fact that in the IEEE systems with 9 and 30 nodes, the reconfiguration exhibited a substantial reduction in load shedding, as detailed in the results.


