1. Introduction
Ongoing conflicts in the Near East led to mass refugee movements to Central Europe in 2015 and 2016 when more than 2.5 million people applied for asylum in member states of the European Union [
1]. One of the primary paths to Europe was the informal “Balkan route” that spans from Turkey to Central Europe through Greece, North Macedonia, Albania, Kosovo, Montenegro, Serbia, Bosnia and Herzegovina, Slovenia, and Hungary. From 2015 until March 2016, 1.2 million people moved along this route. In this period, the refugee movements led to challenging situations in the affected countries as the movements along the Balkan route did not result from a coordinated decision among these countries but instead developed gradually [
2]. Local public authorities and relief organisations in these countries faced the extreme logistical challenge of providing for such a large number of arriving refugees. Besides these practical problems, public authorities and relief organisations had to deal with a lack of information about refugee movements, making the organisation of efficient and effective humanitarian aid virtually impossible [
3]. Especially at the beginning of 2015, refugee groups of varying sizes arrived at the border at all hours of the day without prior notification. This disorganisation was caused by the limited communication between those involved and the inability to collect information. It demonstrated the need for accurate information that can be collected quickly and at any time throughout humanitarian crisis situations.
In the big data era, addressing and solving the aforementioned problems is a necessary task that should be a high priority for all involved authorities and organisations. For one, there are various data sources with different characteristics available at any time that include useful information about the current state of refugee movements. Human sensors are of particular interest and comprise social media networks (sharing publicly useful information), crowdsourcing (completing online tasks) or offline solutions for pedestrians (completing offline tasks) [
4]. Social media have proven to be useful as they provide timely big data across borders and can be used for real-time monitoring of collective refugee movements. Furthermore, refugees commonly use social media networks as a platform to communicate and collect information [
5]. Thereby, for the data collection and analysis the principles of “Collective Sensing” can be followed [
6].
Other human sensor datasets could serve as further major data sources such as high temporal and spatial resolution data of refugees moving between places within countries, but could not be obtained for this study. Therefore, we substitute human sensor datasets with refugee movement statistics supplied by the United Nations High Commissioner for Refugees (UNHCR), which provides statistics about the number of arriving refugees at a temporal resolution of one month. This UNHCR dataset can be used to analyse past refugee movements and serve as the basis for statistical models to forecast and simulate refugee movements. Social media data and the UNHCR dataset complement each other as social media enable real-time monitoring and the UNHCR data allow us to learn from past trends and thus predict future trends.
In this publication, we propose an approach on how social media and UNHCR datasets can be analysed with state-of-the-art machine learning methods based on multiple features. This includes extracting information about current refugee movements, forecasting daily arrivals per country, and simulating refugee movements in a network model that goes beyond current research efforts. The purpose is to provide relief organisations and public authorities with a sophisticated approach to have access to more information during large-scale refugee movements.
The paper starts with reviewing related work. Then, we lay the foundation of our analysis by providing exploratory analysis results on refugee-related Twitter data (tweets) to show that the collected Twitter dataset can be used to capture real-world events. For this research, we acquired tweets through spatial and temporal queries before filtering the dataset with keywords and performing a spatio-temporal analysis on this subset. Through this, we aimed to detect collective refugee movements and hot spots. Next, we trained a Convolutional Neural Network (CNN) to identify tweets describing refugee movements, including various facts mentioned in the tweet text (refugee-related keywords, origin, destination, means of transport and number of refugees). Additionally, we applied statistical models on the UNHCR dataset to forecast the number of incoming refugees per country. We assume that the UNHCR data could easily be collected by Non-Governmental Organisations (NGOs) through digital media (e.g., smartphones, websites). However, especially in a situation with limited data, forecasting only provides limited insights. Consequently, we also discuss simulation approaches relying on network models in order to analyse potential future scenarios. The analysis results show the potential benefits and limitations of collecting useful information for public authorities and relief organisations, which we discuss in detail at the end of the paper. Below, we list the research questions that we aimed to answer through this study:
RQ1: How can we extract spatio-temporal patterns from refugee-related tweets that match with collective real-world refugee movements?
RQ2: How can we identify tweets that include movement information about collective refugee movements?
RQ3: Which time-series models are suitable for forecasting the number of incoming refugees per country?
RQ4: How can we design a network model to simulate potential refugee movements related to real-world events?
4. Methods: Extracting, Simulating and Forecasting Refugee Movements
The approach proposed in this paper is demonstrated in
Figure 5. Both Twitter datasets were filtered using expert keywords (
Section 4.1), and a hot spot analysis was applied on the Geo-Tweets to extract collective refugee movement paths (
Section 4.2). The keyword-filtered tweets were additionally filtered using a pre-trained CNN to extract tweets including factual information (
Section 4.3). From these tweets, relevant facts for emergency organisations, such as means of transport, number of refugees, and origin–destination pairs, were identified to describe refugee movements quantitatively. Lastly, UNHCR data were used to forecast refugee movements using the ARIMA stochastic model (
Section 4.4). We also designed a network model for simulation using the UNHCR dataset (
Section 4.5).
4.1. Extracting Refugee-Related Tweets with Keywords
We used keyword filtering to exclude a large number of Geo-Tweets not related to refugees. We defined a set of keywords for each of the predominantly used languages in the study area, namely English, German, Hungarian, Serbo-Croatian, Greek and Arabic. The selection of terms and translation were guided by experts from relief organisations and native speakers. The keywords include terms explicitly referring to refugees, but also terms for entities and concepts related to the refugee movement (see
Figure 6).
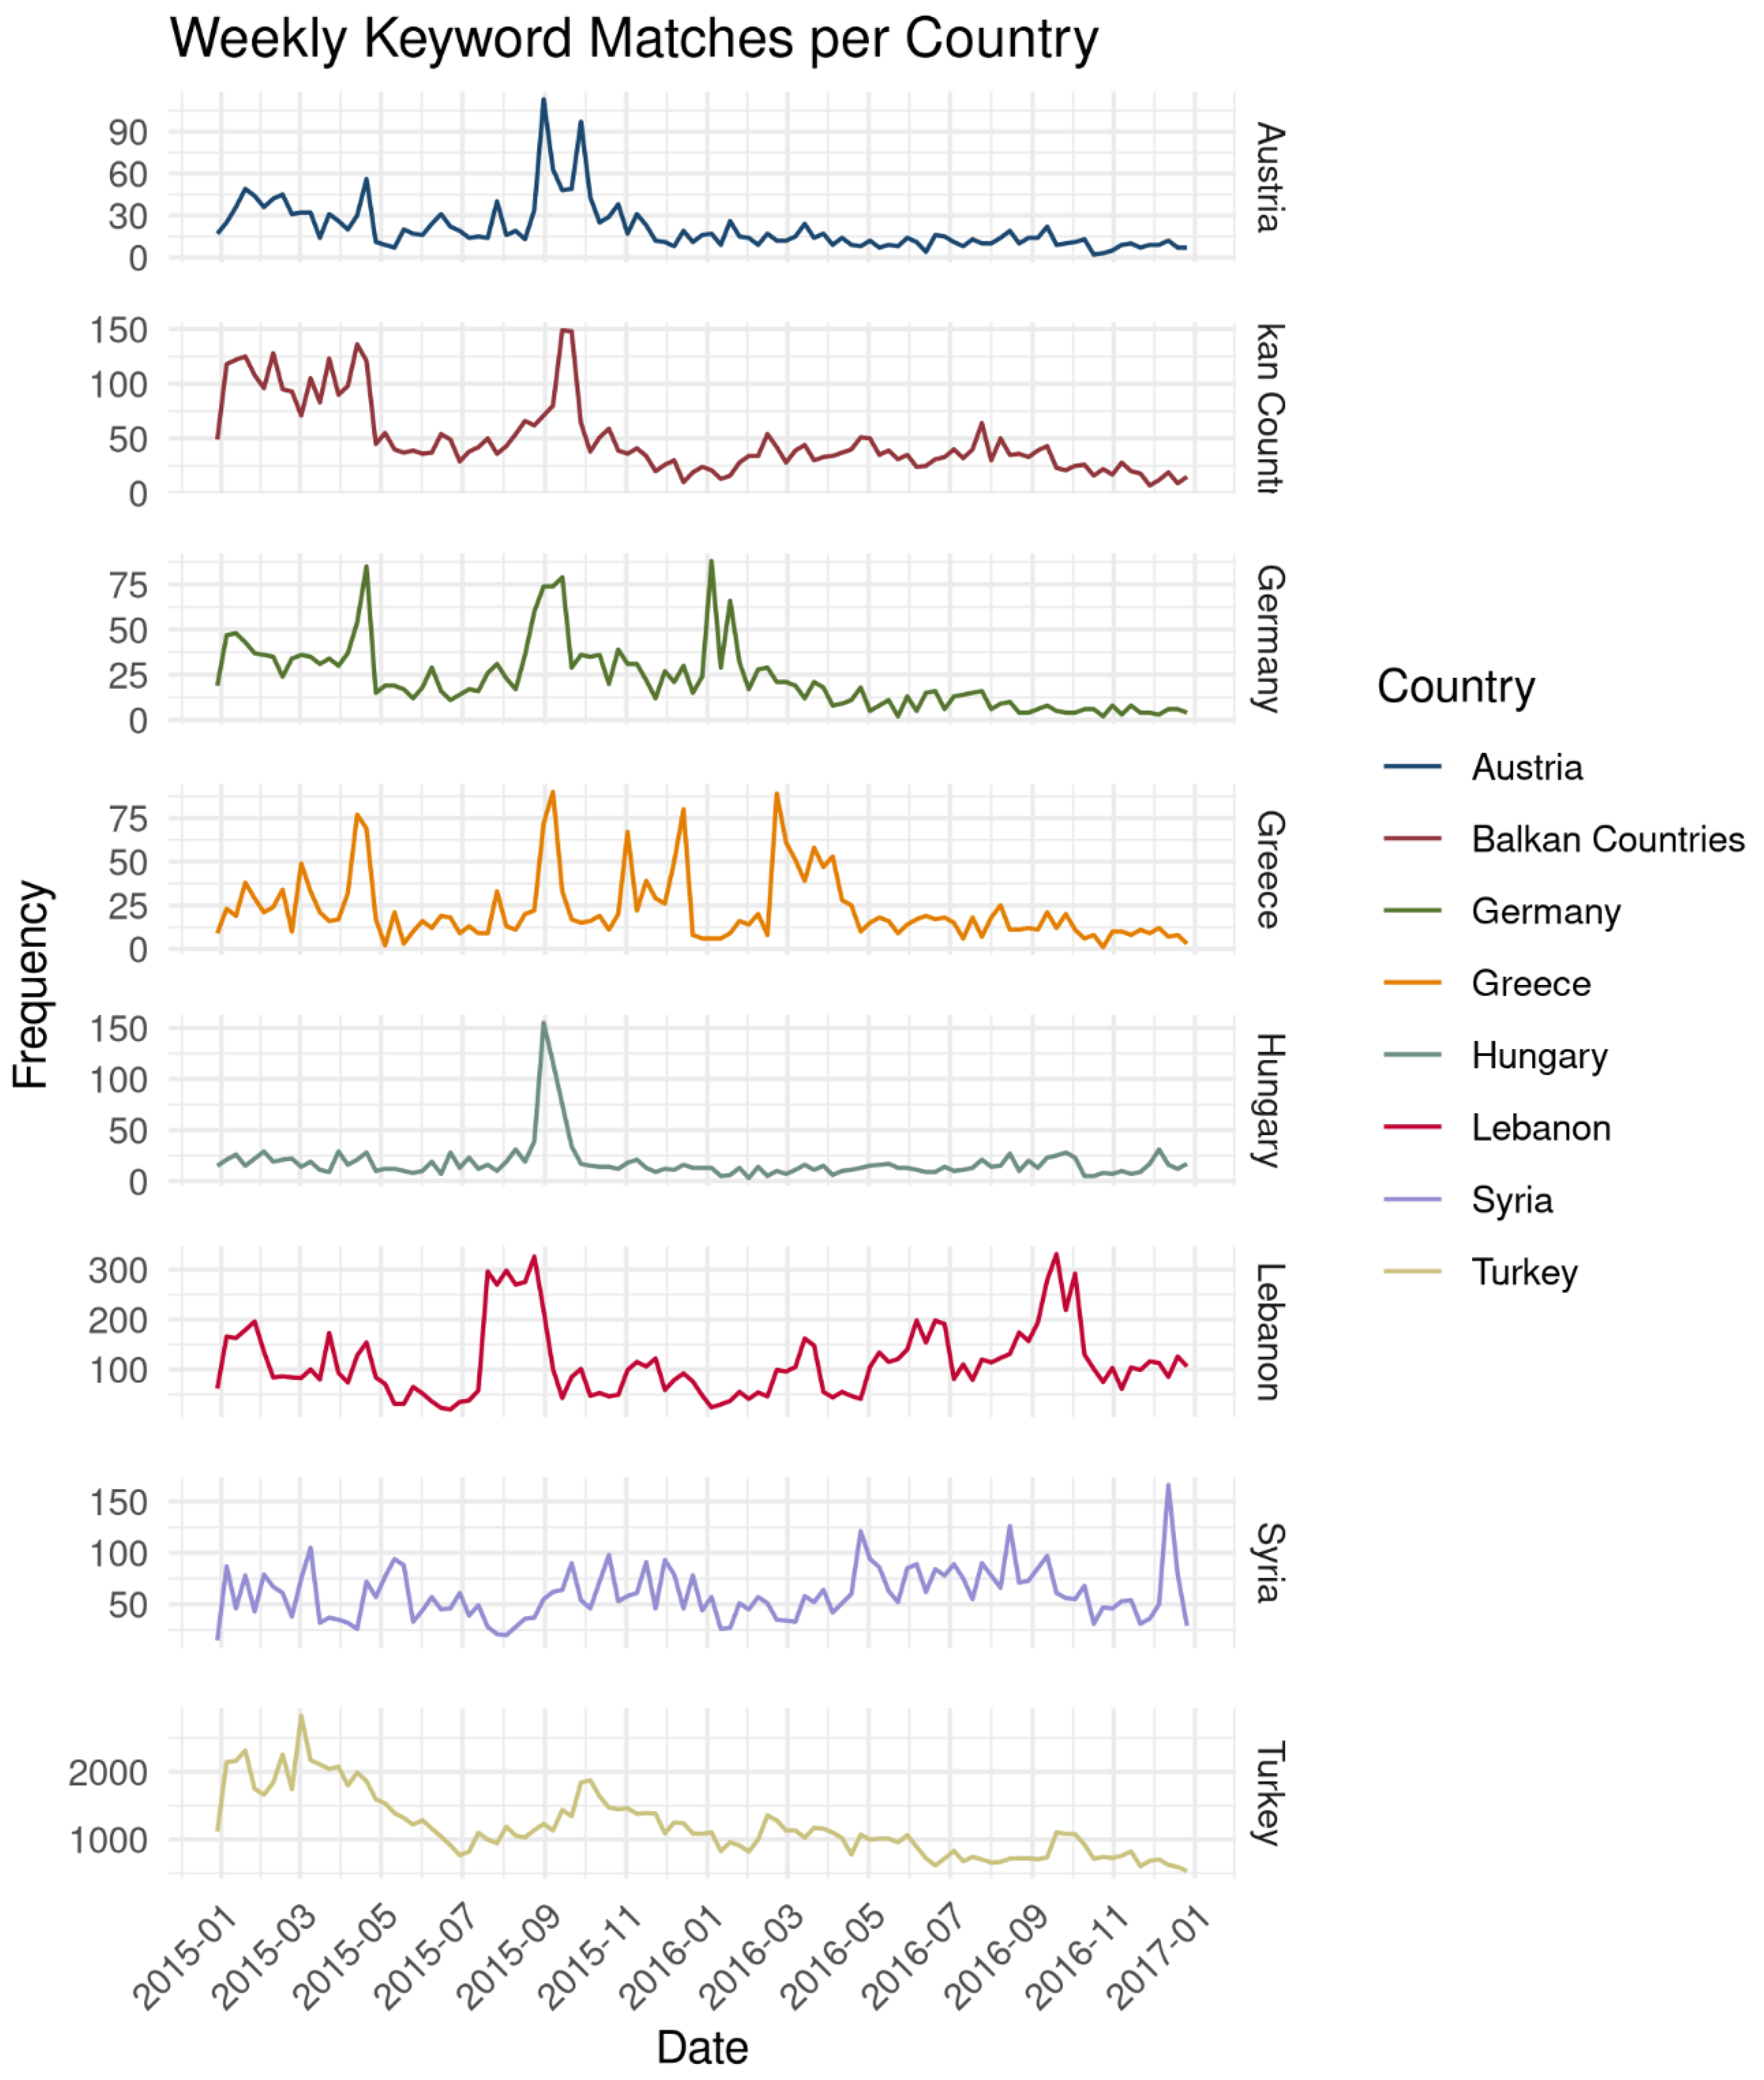
As a sanity check for the representativeness of these terms, we developed the following hypothesis: The refugee movement saw recurrent peaks over time, often following combat operations, which in turn lead to a rising number of tweets associated with this topic. We consider a set of keywords to be indicative of related tweets if its occurrence over time exhibits a peak at the same time as refugee numbers do.
Figure 7 shows the time series of keyword matches within selected countries. We found that major events during the war appear to be reflected in the Twitter data, such as the Palmyra offensive in May 2015, which led to ISIL controlling 50% of the Syrian territory [
42], or the Aleppo offensive in late 2015 that caused tens of thousands to flee the city [
43].
To cross-check the validity, we compared the frequencies of keywords in our Twitter dataset with those on Google Trends [
44]. Google Trends is a tool that visualises the frequencies of queries on the search platform. The search data are normalised by scaling the values between 0 and 100 [
45]. We normalised the Twitter data to make them comparable with the Google Trends output.
Figure 8 illustrates the trends for the German keyword “flüchtling” (German for “refugee”) for the two media. Although a first peak in the Twitter data occurs in April 2015 and a peak in the Google Trends data occurs by the end of January 2016, both platforms exhibit a high at the beginning of September 2015, and have a similar slope in other periods.
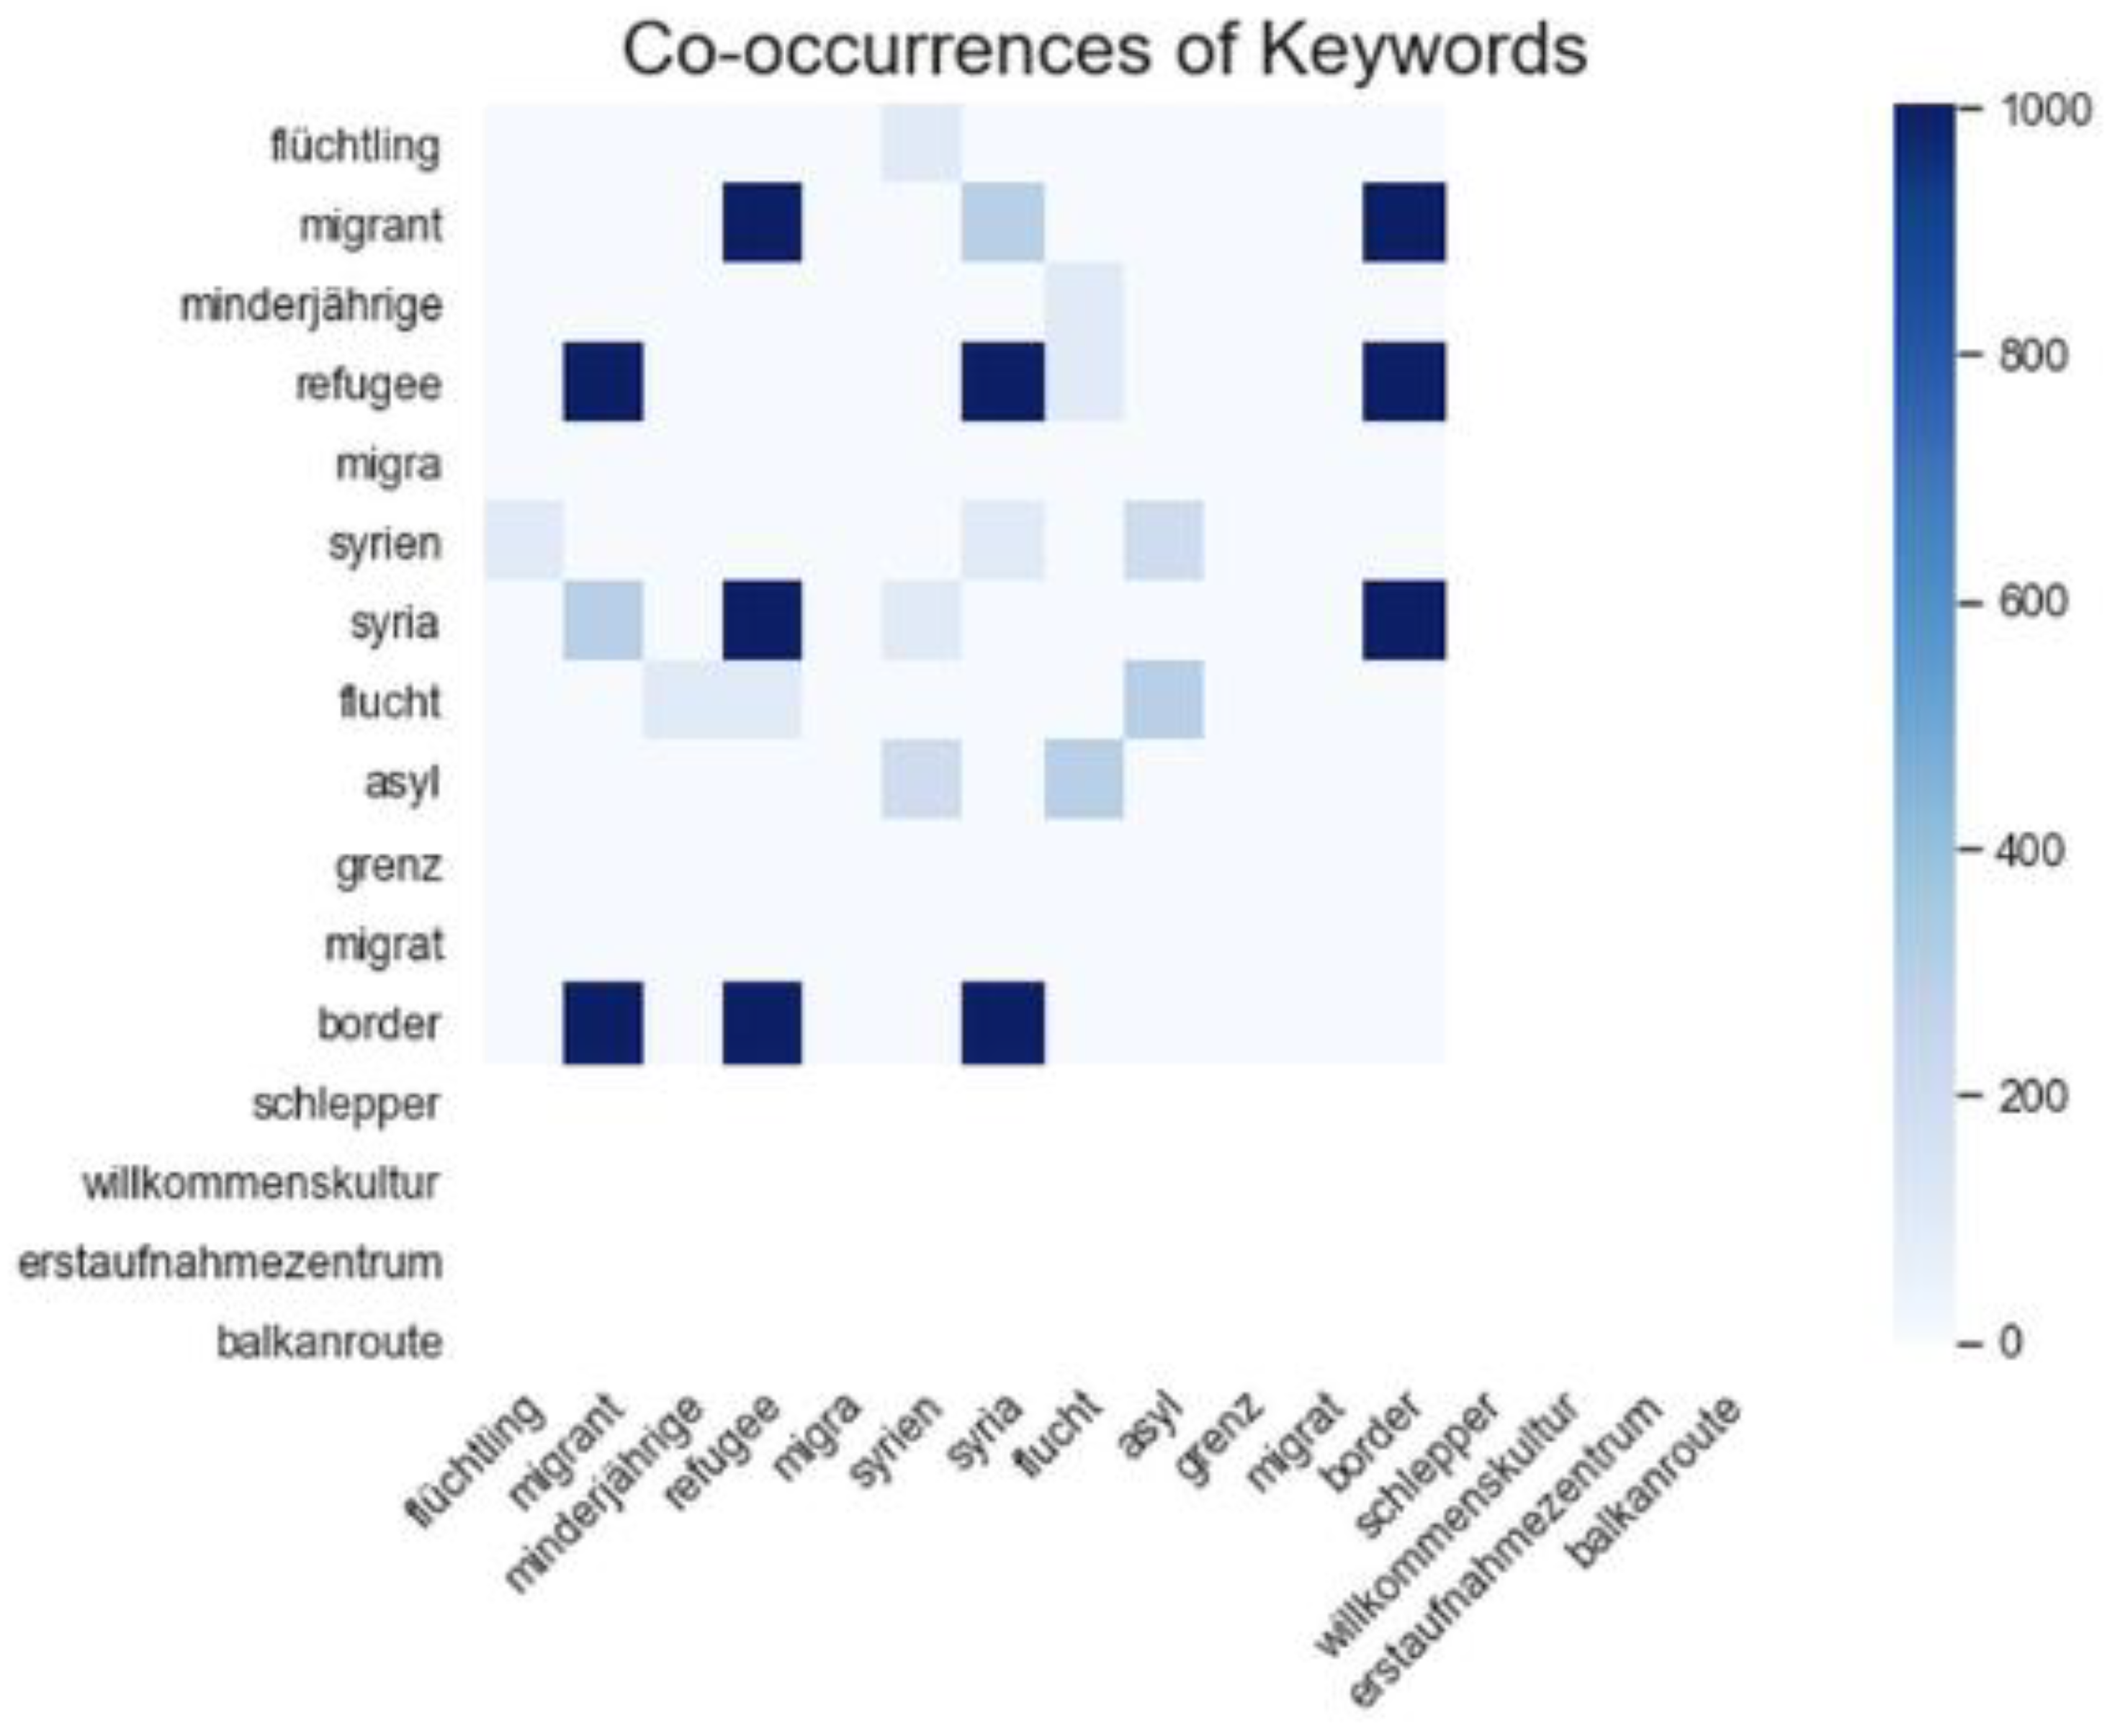
We examined the co-occurrence of the suggested keywords in our dataset across the various languages.
Figure 9 focuses on German and English keywords and exhibits higher absolute values for the term-pairs “syria” and “refugee”, “syria” and “border”, “border” and “refugee” and “refugee” and the stem “migra”. It is worth noting that although they are English keywords, these terms also occur in German tweets, e.g., “#refugeeswelcome” [
46] was a popular hashtag in Germany and Austria, and the word stem “migra” has the same meaning and application in German. The two German keywords with higher co-occurrence values are the term “flüchtling” for refugee and “flucht” signifying the act of fleeing. More specific German keywords such as “minderjährige” (referring to “unbegleitete Minderjährige”, unaccompanied minor) have a smaller frequency overall.
4.2. Identifying Refugee Movements through Spatio-Temporal Clustering of Tweets
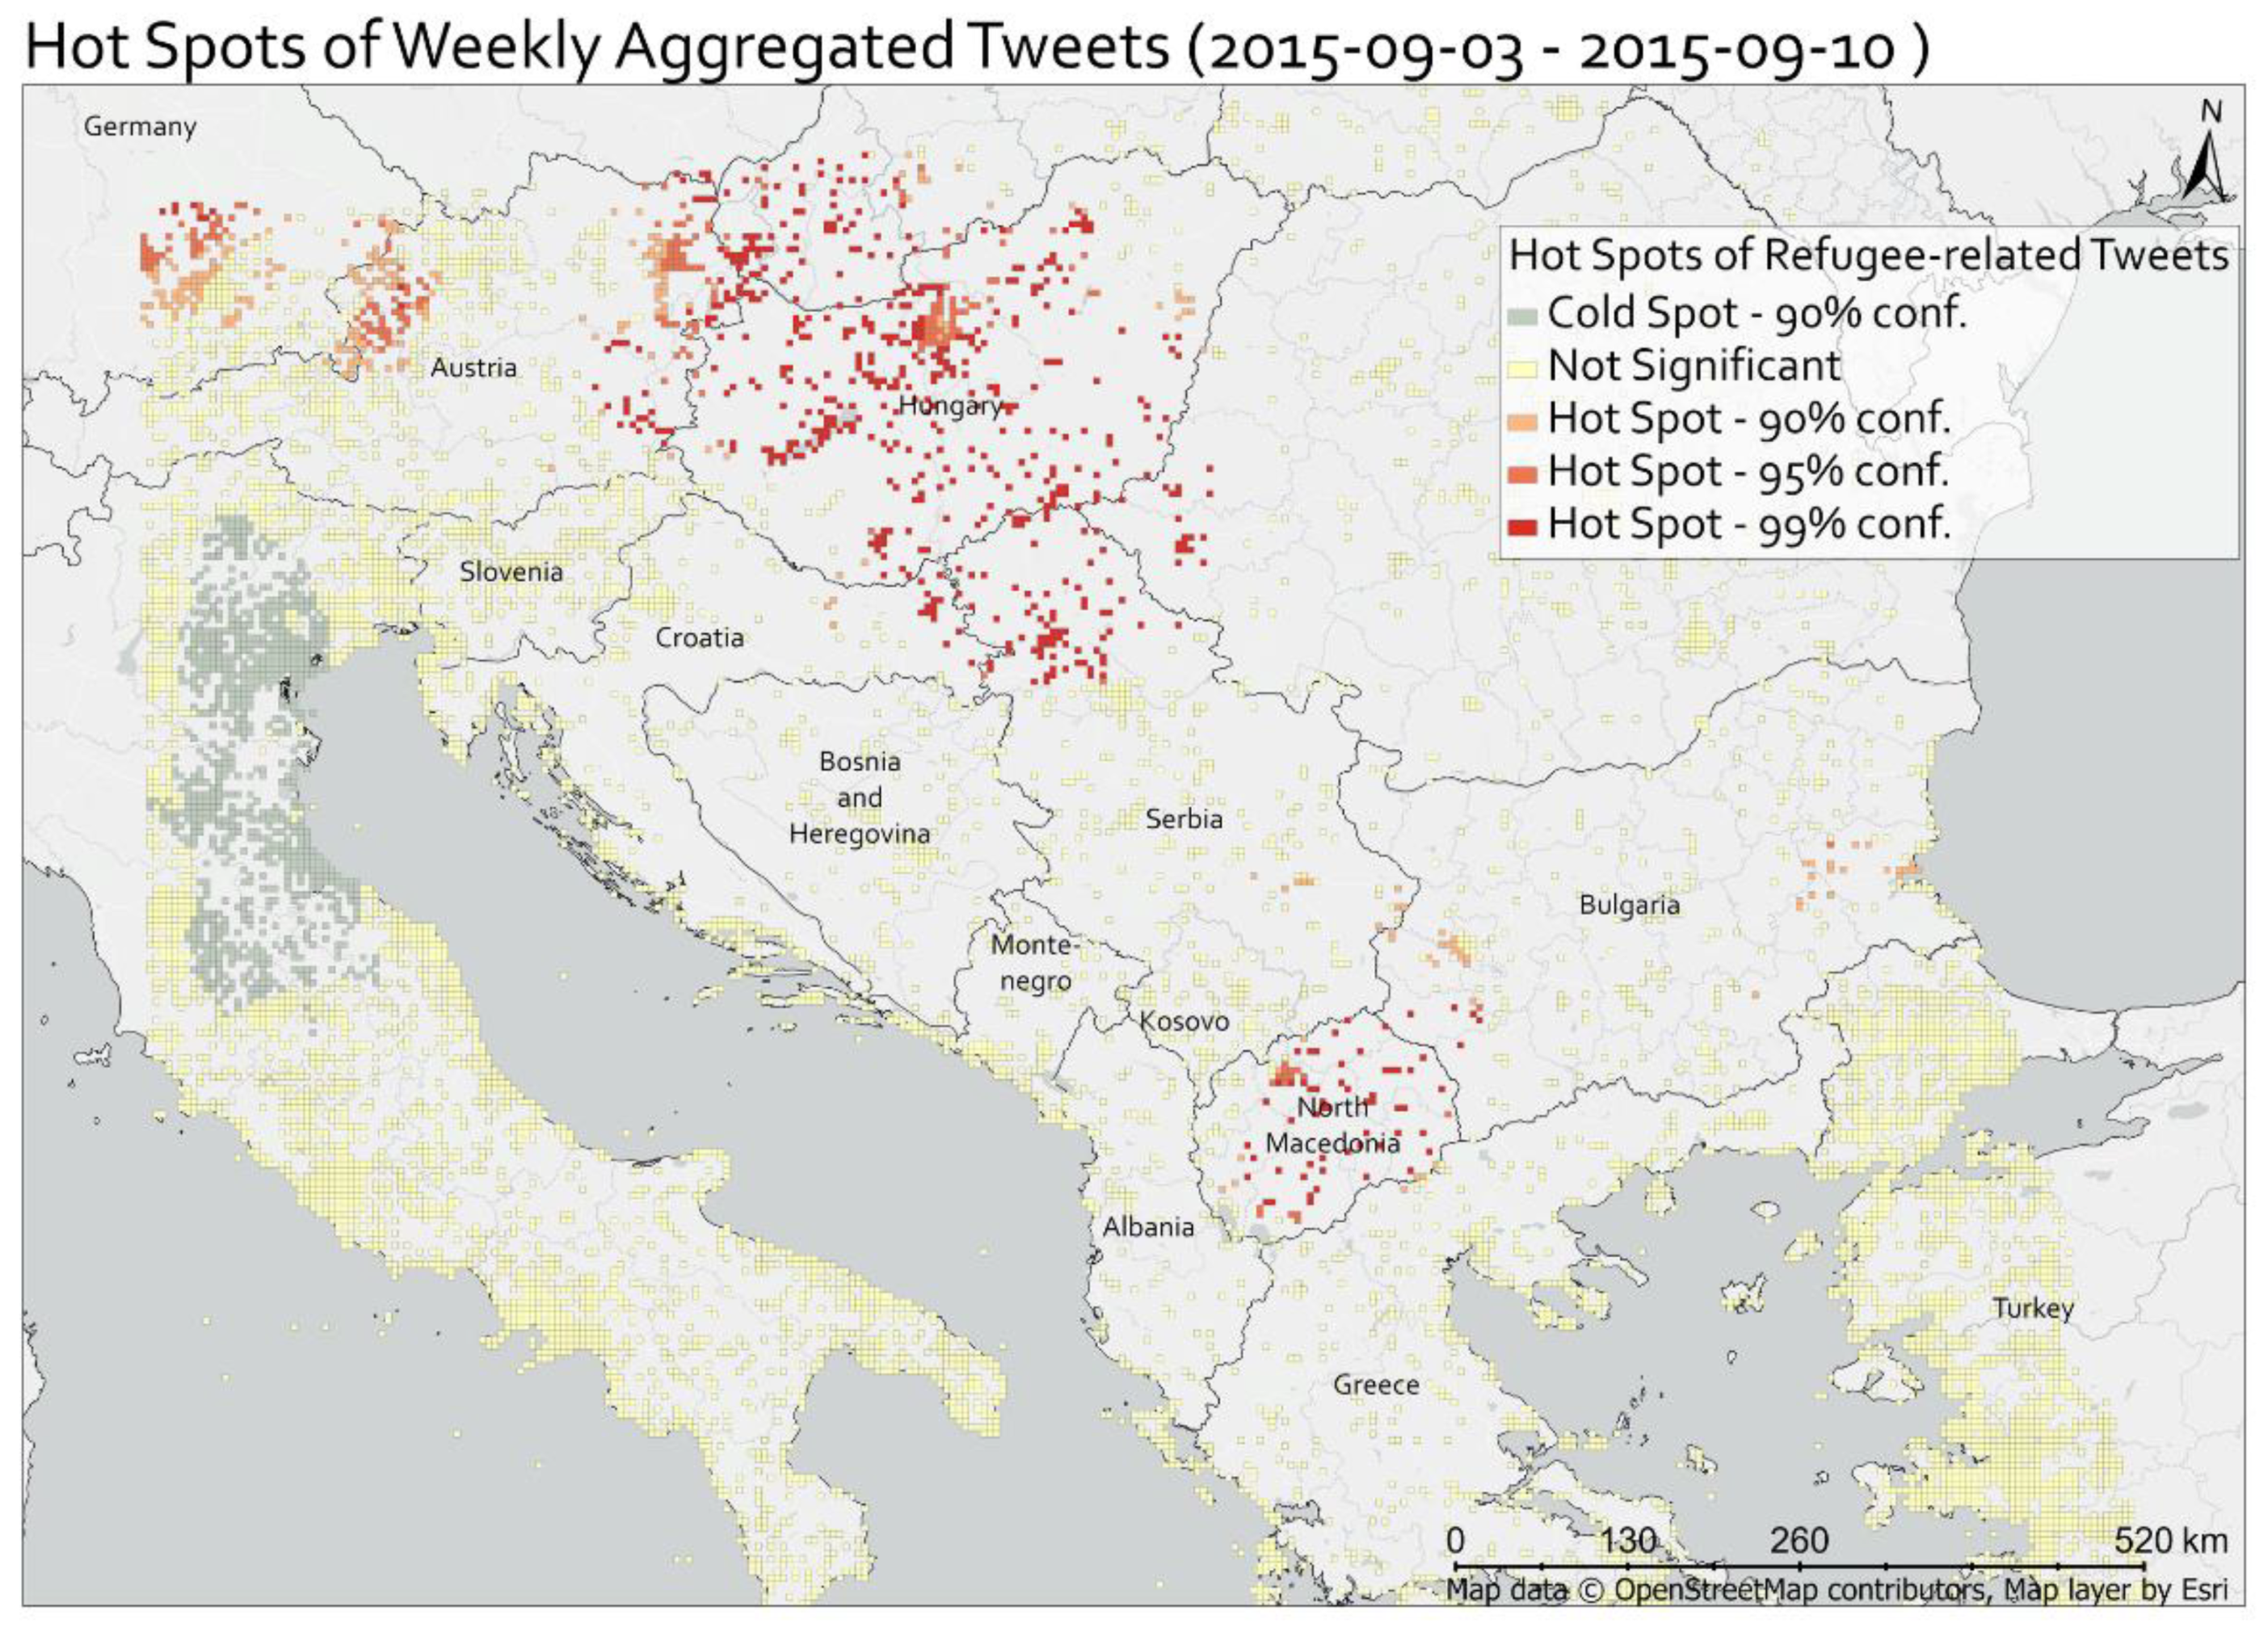
A critical task for emergency services is monitoring refugee movements across borders to prepare for incoming refugees and to estimate the time of arrival at their desired destination. Therefore, we aimed to visualise collective refugee movements on the Balkan route by applying a spatio-temporal analysis on refugee-related tweets. The analysis works under the assumption that people are more likely to comment about refugees on social media when they observe and/or are impacted by refugee movements.
For this analysis, we used the refugee-related Geo-Tweets (see
Section 4.1). We binned the tweets weekly to enable the identification of collective refugee movements by comparing different points in time. We chose weekly bins as refugees oftentimes find themselves stuck at borders for many days and travel in groups in which they can cross borders at certain times. In the next step, we applied a hot spot analysis on the weekly binned refugee-related tweets to visualise spatial patterns related to refugees in the area of interest. The hot spot analysis is based on Getis-Ord
, which detects local clusters of high or low values in a spatial neighbourhood [
47]. To apply a hot spot analysis on the refugee-related tweets, we created a grid of rectangular cells and aggregated the number of refugee-related and unfiltered tweets in every cell. The cell depends on the number of tweets in the area of interest and on the area’s size. The calculation of the cell size is based on [
48], where the cell size length is calculated as follows:
where
is the size of the area of interest, n is the number of refugee-related tweets and
d is used to adjust the cell size for use case specific requirements. We set
d to twelve in order to have more granular cells that could be necessary to detect crossings along the border. Furthermore, we excluded cells without tweets from the analysis to differentiate between zero and null values in the cells. Subsequently, every shown cell in the hot spot maps also represents at least one tweet.
4.3. Extracting Refugee Movement Information from Tweet Text
In
Section 4.2, we explain how we extracted refugee-related tweets using keywords, but further analysis is required to identify facts about refugee movements in the text. Therefore, we trained a neural network to extract tweets that include information about refugee movements following the examples in
Section 3.1. The data used in this task are multi-lingual, which needs to be reflected in the design of the fact extraction methods. We decided against using a machine translation approach, as the risk of losing valuable information through mis-translation is high in a domain with frequent mis-spellings and jargon. Some parts of the fact extraction pipeline can natively handle multiple languages, while others can be easily extended to cover additional languages. As a proof of concept, all methods were extended to work with both English and German text, as these languages are most prevalent in the labelled Twitter dataset.
The tweets should include information about the means of transport, number of refugees, origin, and destination. We used DBpedia Spotlight to recognise location names in the text [
49]. Movement information could be extracted if the location names were referenced by a preposition or verb indicating movement. A distinction between the origin and destination was made by categorising the keywords in movements towards and away from a location. Finally, the coordinates for a location were determined via DBpedia [
50] using the DBpedia:Locations extracted in spotting. This was performed to directly depict locations on a map or to aggregate across specific regions. We used the 2016 version of geocode Nomenclature of Territorial Units for Statistics (NUTS) to divide countries into regions. To do this, the NUTS entity that matches DBpedia:Locations in the total area was selected from all NUTS entities that contain a location.
4.3.1. Convolutional Neural Network Architecture for Identifying Refugee-Related Tweets
Our model is based on pre-trained task-specific embeddings generated in the work of Pennington et al. [
51]. They consist of 200-dimensional vectors extracted from a multilingual corpus of 2 billion tweets. An advantage of this collection is the availability of specific embeddings for stop words such as the RT marker or user mentions. This collection of embeddings also encompasses tokens in all of the most frequent languages of tweets, thereby implicitly providing multilinguality support.
In our analyses, we tried various neural network settings to achieve the highest average precision (AP) [
52] value in 10-fold cross-validation in the training set. The architecture is comprised of three parallel convolutional blocks with filter sizes of (1, 200), (3, 200), and (5, 200) and 192 filters each. The features extracted thereby are then concatenated and pooled using max-over-time pooling (see
Figure 10). Pooling is necessary to transform the word representations that the convolutions produce into a representation for the whole document. We apply dropout with a dropout rate of 0.1, meaning that at each update step, a randomly selected 10% of the weights is neglected. This is performed to prevent the model from learning dependencies between specific features, producing a more robust model. We used Adadelta [
53] for the training that is a variant of stochastic gradient descent that uses adaptive learning rates per dimension to improve convergence. The neural network is trained [
53] for 30 epochs with a learning rate of 1, followed by 20 epochs of 0.1. Such a learning rate schedule can help with fine-tuning the model weights. Weight decay is applied with a factor of 1 × 10
−4 to regularise the model and prevent it from overfitting.
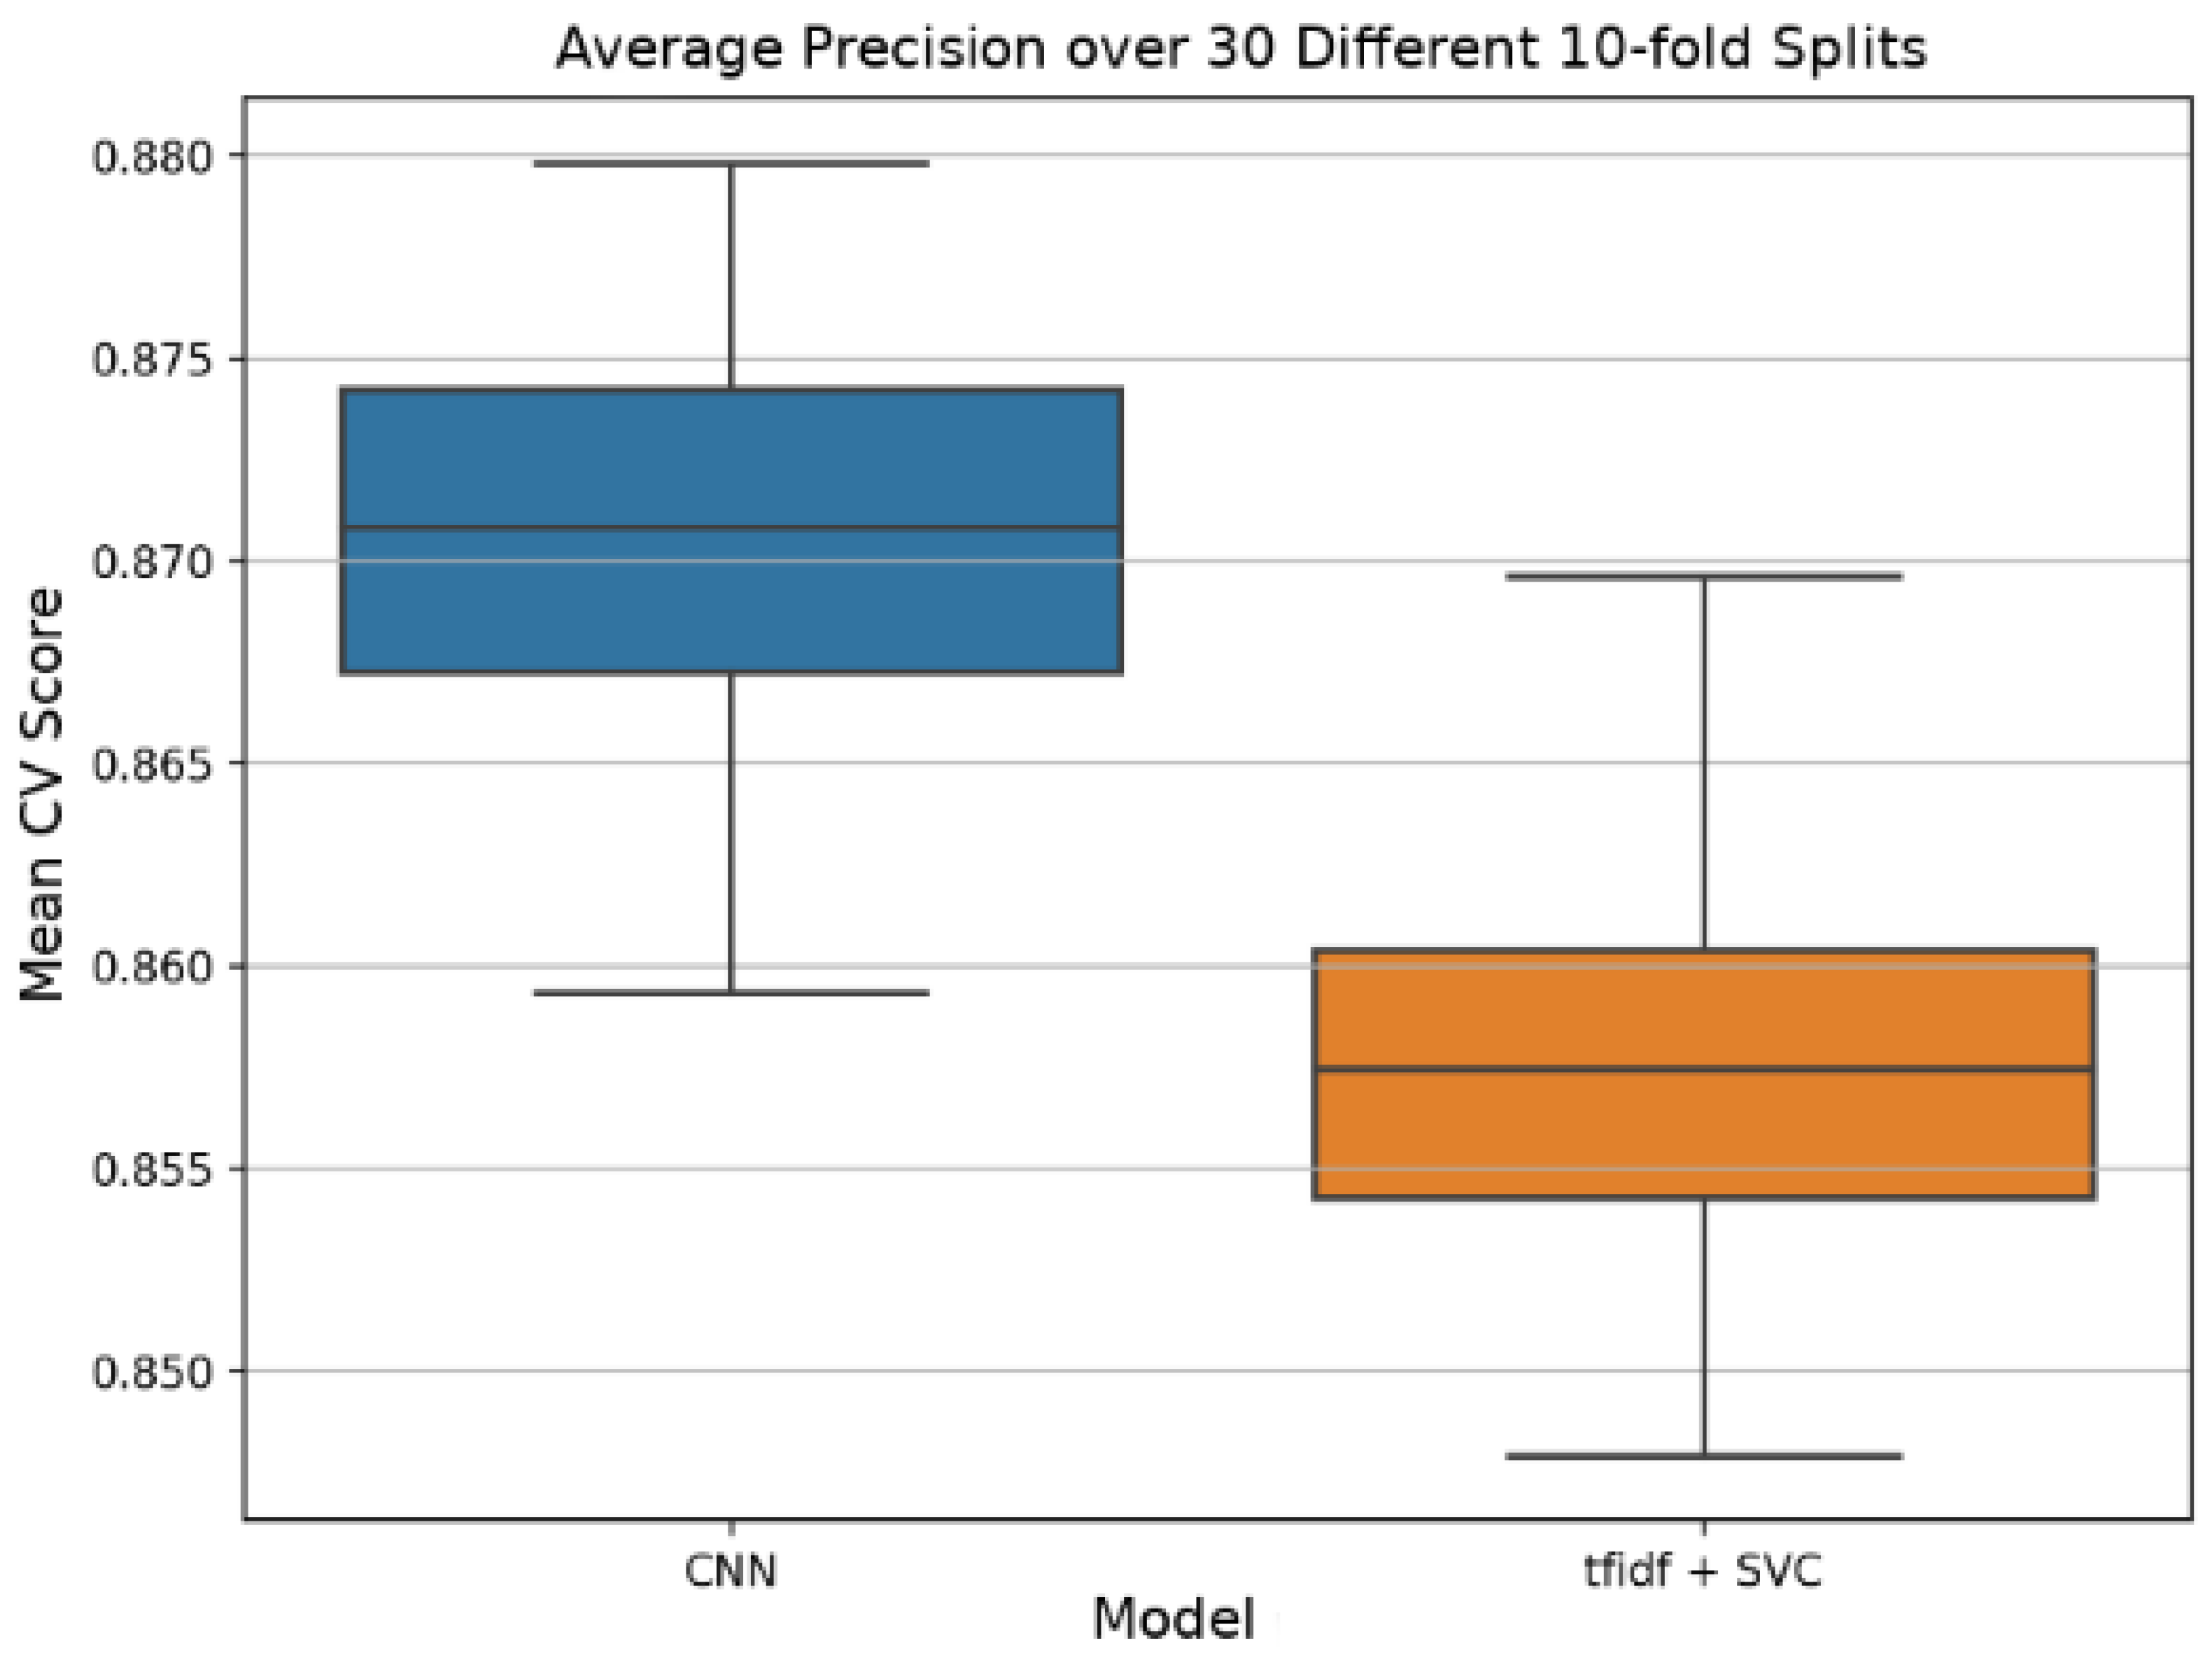
Compared to a baseline model that uses a simple approach of term frequency–inverse document frequency (tf-idf) weighted bags-of-words fed into a linear Support Vector Machine [
54,
55], it repeatedly produces significantly better results. It achieves an AP of 0.871 ± 0.0048 versus 0.858 ± 0.005 for the baseline model on the test set.
Figure 11 shows boxplots with median values for the AP values of the baseline and CNN model.
4.3.2. Dependency Parsing and Location Extraction with DBpedia
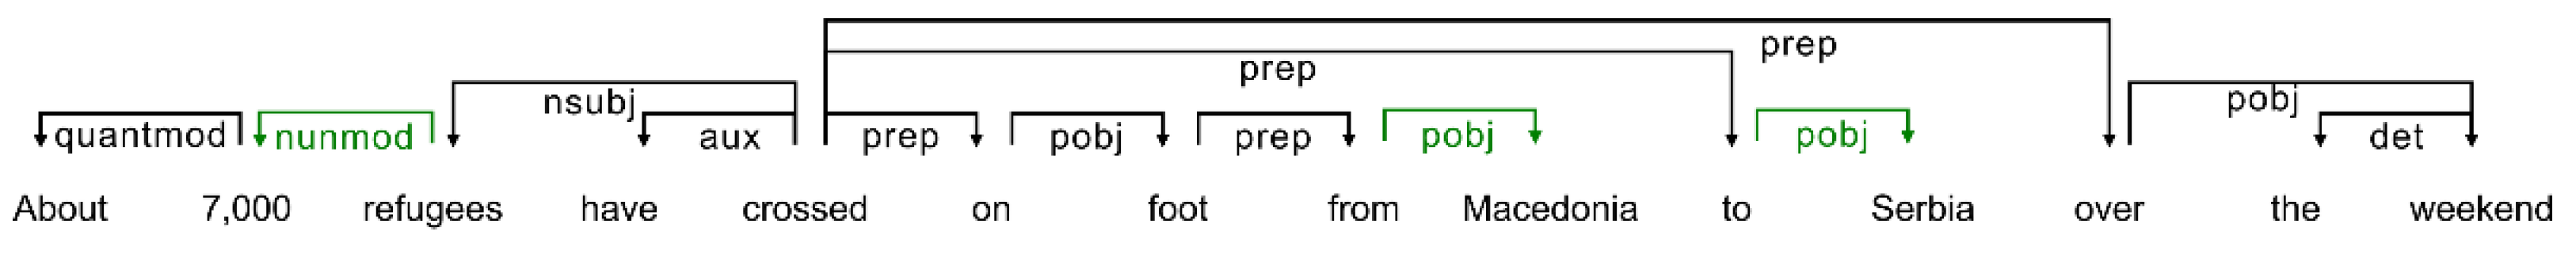
We extracted movement information from the text using the dependency parser from StanfordNLP Core [
56] to find keywords related to previously detected locations. It is available for multiple languages. An example of such a result is given in
Figure 12. Note how the dependency numeric modifier (nummod) can be used to detect which object a quantity is referring to, with pobj providing information about which objects prepositions refer to. Furthermore, we added artificial “dependencies” via a high-precision heuristic technique in which any sequence of the form “<preposition> <noun>” as well as “<verb> <preposition> <noun>” is considered a direct dependency. This is especially useful for determining movement direction. The keywords such as “refugee” and the prepositions “to” and “from” for the example of
Figure 12 need to be manually selected for each language.
We used DBpedia Spotlight to extract the locations from the tweet texts. DBpedia Spotlight is a tool used to link unstructured information to DBpedia resources. The Wikipedia dataset is the basis of DBpedia, which is structured as an open knowledge graph. DBpedia Spotlight uses the characteristics of the knowledge graph for spotting. Minimum support, defined as 20 Wikipedia in-links and a spotting confidence of 0.5, is required for a match. To avoid ambiguity, i.e., the linking of multiple entities to one surface form, DBpedia Spotlight only returns the best candidate for a phrase, as per the internal confidence score. The Simple Protocol and RDF Query Language (SPARQL) endpoint of DBpedia makes it possible to determine the longitude and latitude for location names that are in DBpedia. Information about a location’s area and its type (e.g., continent, country, municipality) is also retrieved via this endpoint.
4.3.3. Deduplication of Tweets and Authenticity Scores
As reposting is frequent in microblogging, textual duplicates need to be removed. This is no trivial task due to the slight changes that may be applied before reposting, such as user mentions or other comments. However, the limited number of characters encountered allows us to use a simplification in this task, namely the binary BoW on n-grams with n = 3. The Jaccard similarity between these bags is then compared against a threshold. Since we do not need all pairwise similarities but only find similar pairs, an inverted index can be used to drastically reduce computation. Each post is only compared against posts that contain at least one common n-gram, retrieved via the inverted index. The relatively high n = 3 ensures that this results in a low number of necessary comparisons.
Authenticity scores should reflect how likely it is that factual information represented in a post is truthful. During the United States presidential election in 2016, “fake news” was shared on social media platforms, which led to awareness strategies to reduce its impact [
57,
58]. In addition, several social networks reacted and Twitter added an additional label to tweets with synthetic and manipulated media [
59]. Based on these efforts, we assume a basic level of user scrutiny before reposting. Accordingly, a post is considered more authentic if it accumulates many duplicates in a corpus of relevant instances [
60]. Overall, this means that authenticity scores are a by-product of the above-mentioned textual deduplication. The authenticity score can be weighted by using the Jaccard similarity of the deduplication.
4.4. Forecasting Daily Arrivals of Refugees
A time series is defined by a stochastic process (), which represents an ordered series of values with the index time . The forecasting task involves predicting the unseen values ahead of time. In our analyses, several deterministic and stochastic approaches were applied to the data to estimate the daily arrivals of refugees through the Balkans.
We first produced an autoregressive (AR(p)) model, where p is the order of the model, and the model is given by
where
is white noise, and constant c describes a stationary process whenever the autoregression parameter
Next, we established an autoregressive–moving-average (ARMA) model with a moving averages (MA(p)) component added to the AR(p) model, given by
An ARIMA model explicitly assumes the underlying trend to be a linear function. By adding a new constant and an additional time-dependent term to the previous equations, the ARIMA (
p = autoregressive,
d = difference and
q = moving averages) can be expressed as:
Next, we applied a seasonal model that models the seasonality by extending the idea of ordered differencing in ARIMA by forming seasonal differences.
is the seasonal period for the differenced series
if it satisfies an
.
is denoted as
and the model can be expressed as:
The model has sets of parameters, namely, the non-seasonal (
p,
d and
q) and the seasonal parameters (
P,
D and
Q), which are determined in a three-fold process: identification, parameter estimation, and diagnostic validation. We visualised the standardised residuals of a SARIMA model in
Figure 13 that was used in the diagnostic validation. For a good fit, the residuals should be normally distributed around zero, which can also be seen in
Figure 13. At the identification stage, an ARMA process is developed based on the estimated autocorrelated function (ACF) and partial autocorrelation functions (PACF). The order of the model is chosen based on the lowest Akaike’s Information Criterion (AIC) [
61]. In the next step, residual monitoring is performed to determine the adequacy of the model, and the process repeats until the model fits certain expected criteria, for instance, the residuals being normally distributed around zero.
Further, we train a simple Bayesian network, which can be expressed as a set of observation equation
and the system equation
.
serves as initial information, and and are known -dimensional and dimensional vectors. and , also known as the evolution matrix, are known p-dimensional vectors of covariates. and describe the covariate structure among the components of and , respectively.
A first-order derivative is calculated for the expected value at each step of using the different models to estimate the slope of the trend curve. This trend curve is included to reflect important information regarding the degree of increase or decrease in incoming refugees.
4.5. Designing Network Models for Refugee Movements
Forecasting methods are limited to the availability of data and can seldom be extrapolated to include unobserved situations. This is particularly true for refugee movement, where political decisions influence the model at hand. Thus, we explored geo-spatial simulation models to overcome the limitation of data-driven forecasting methods.
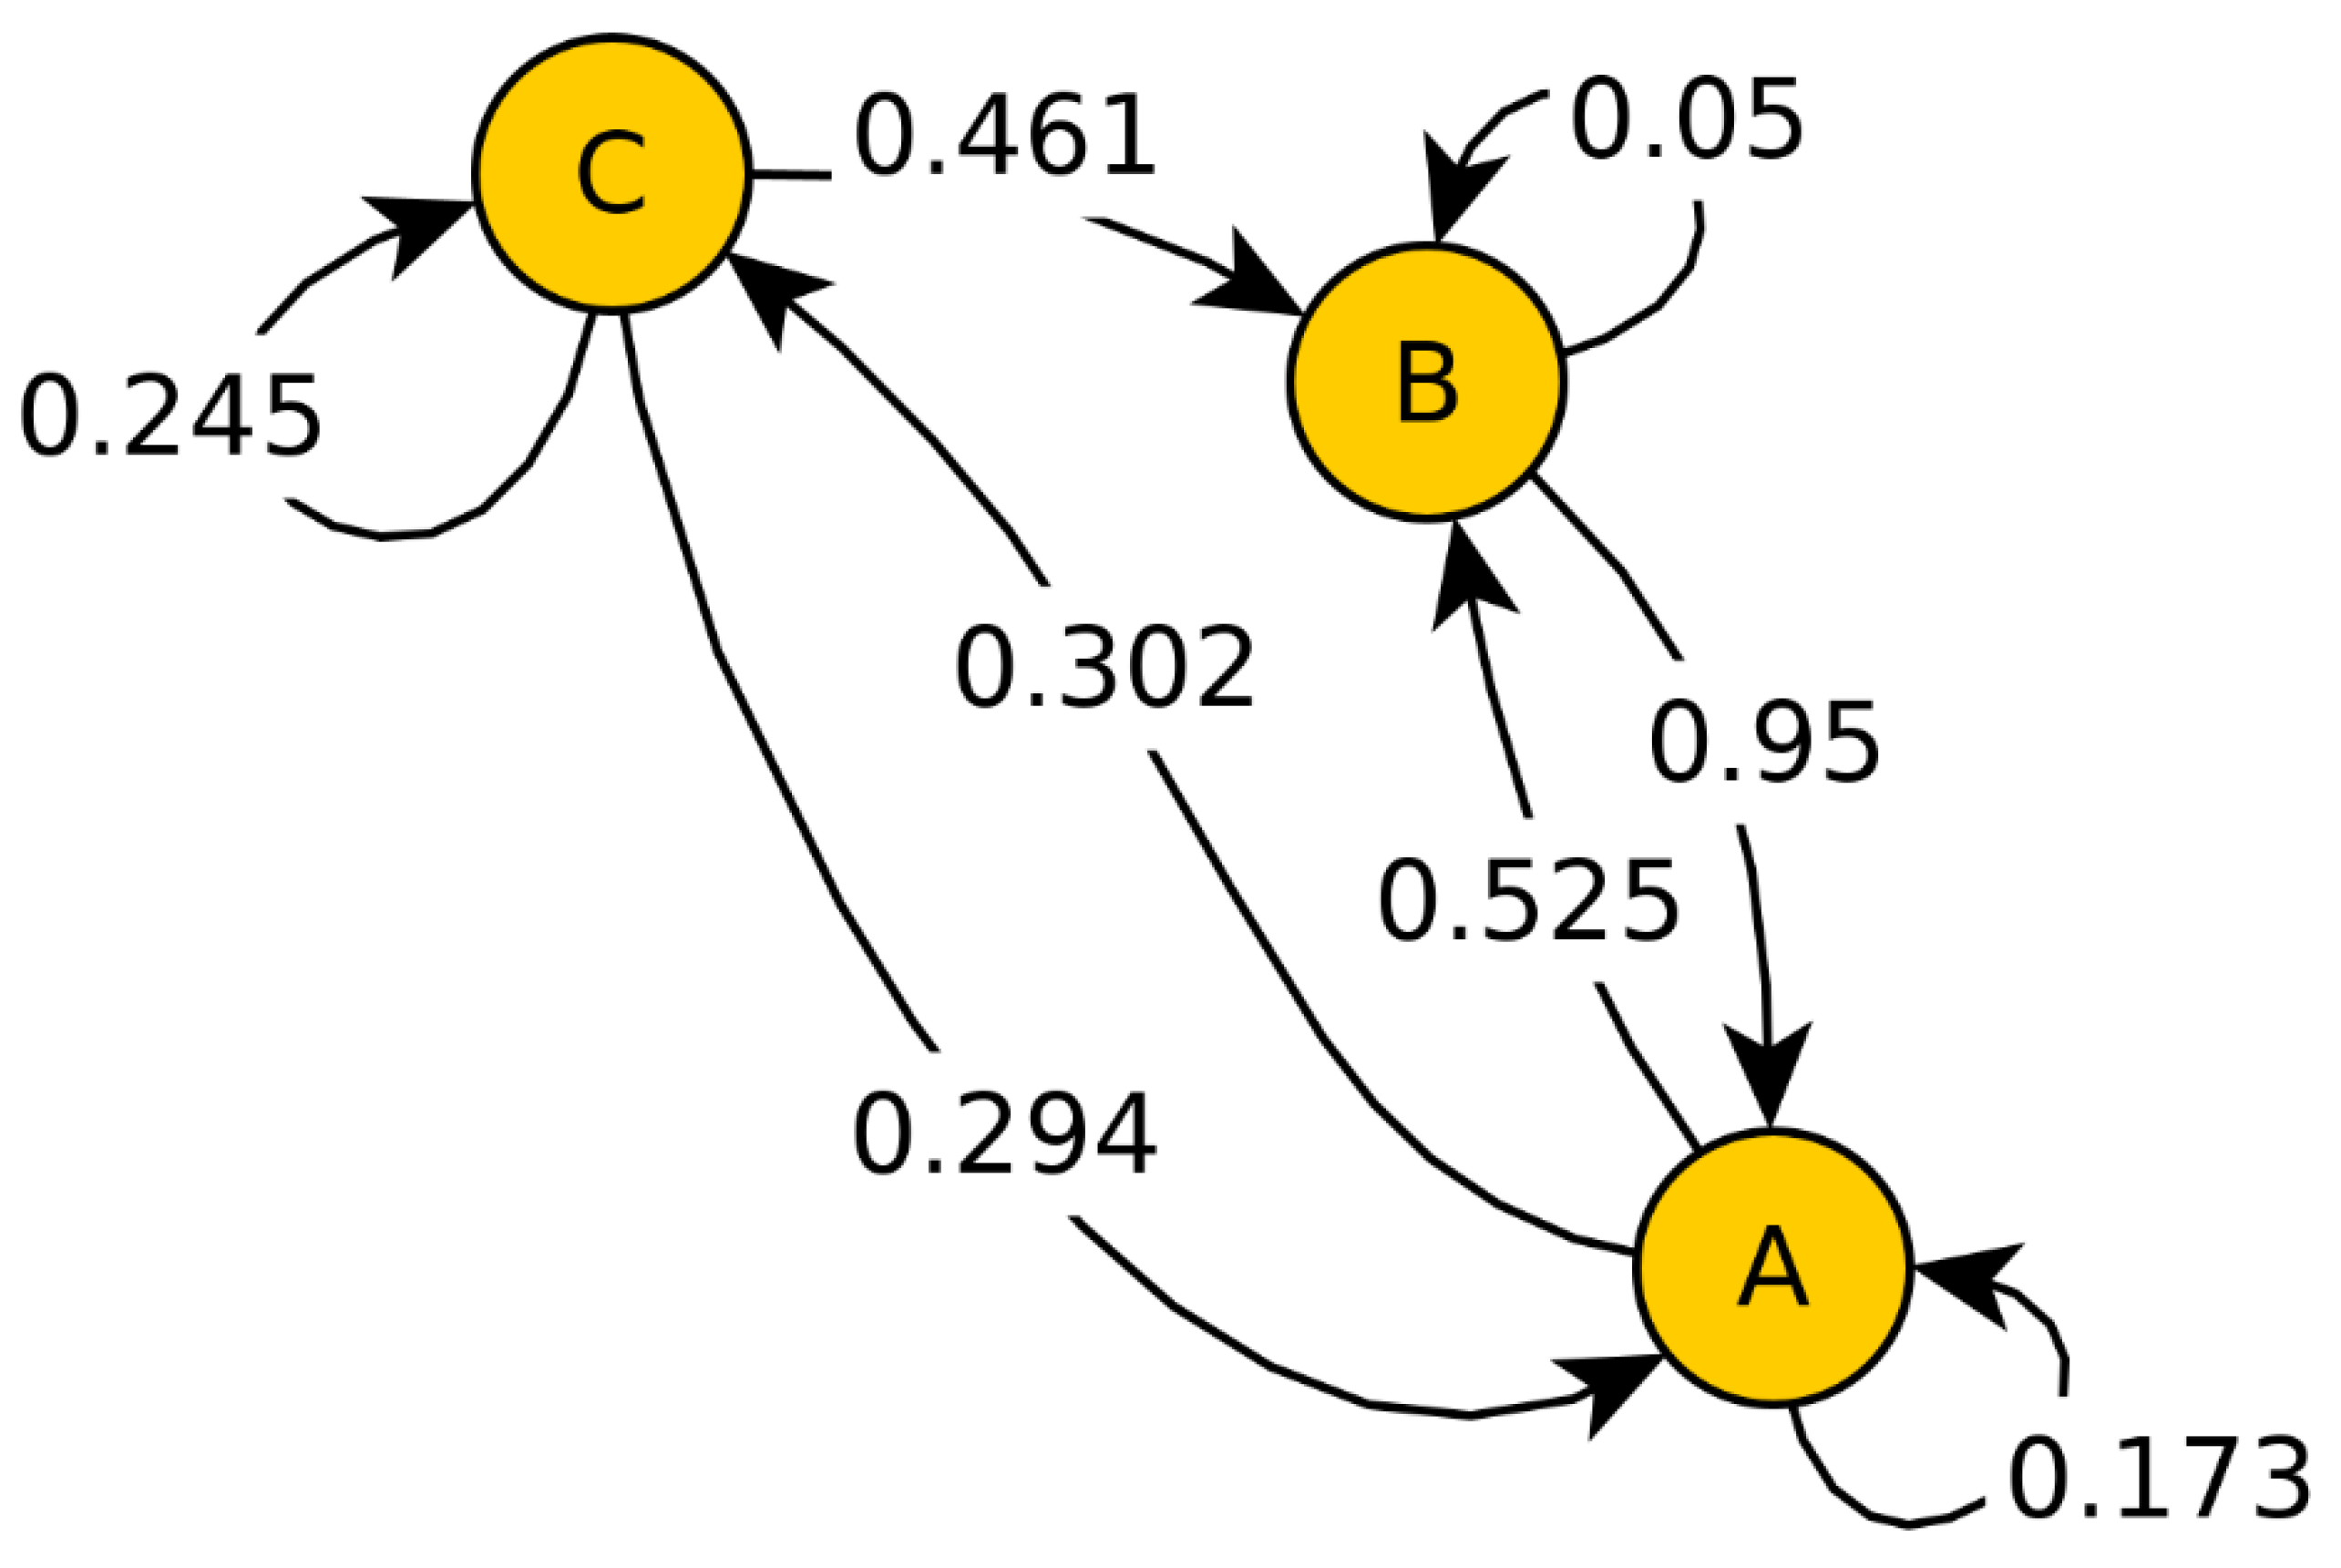
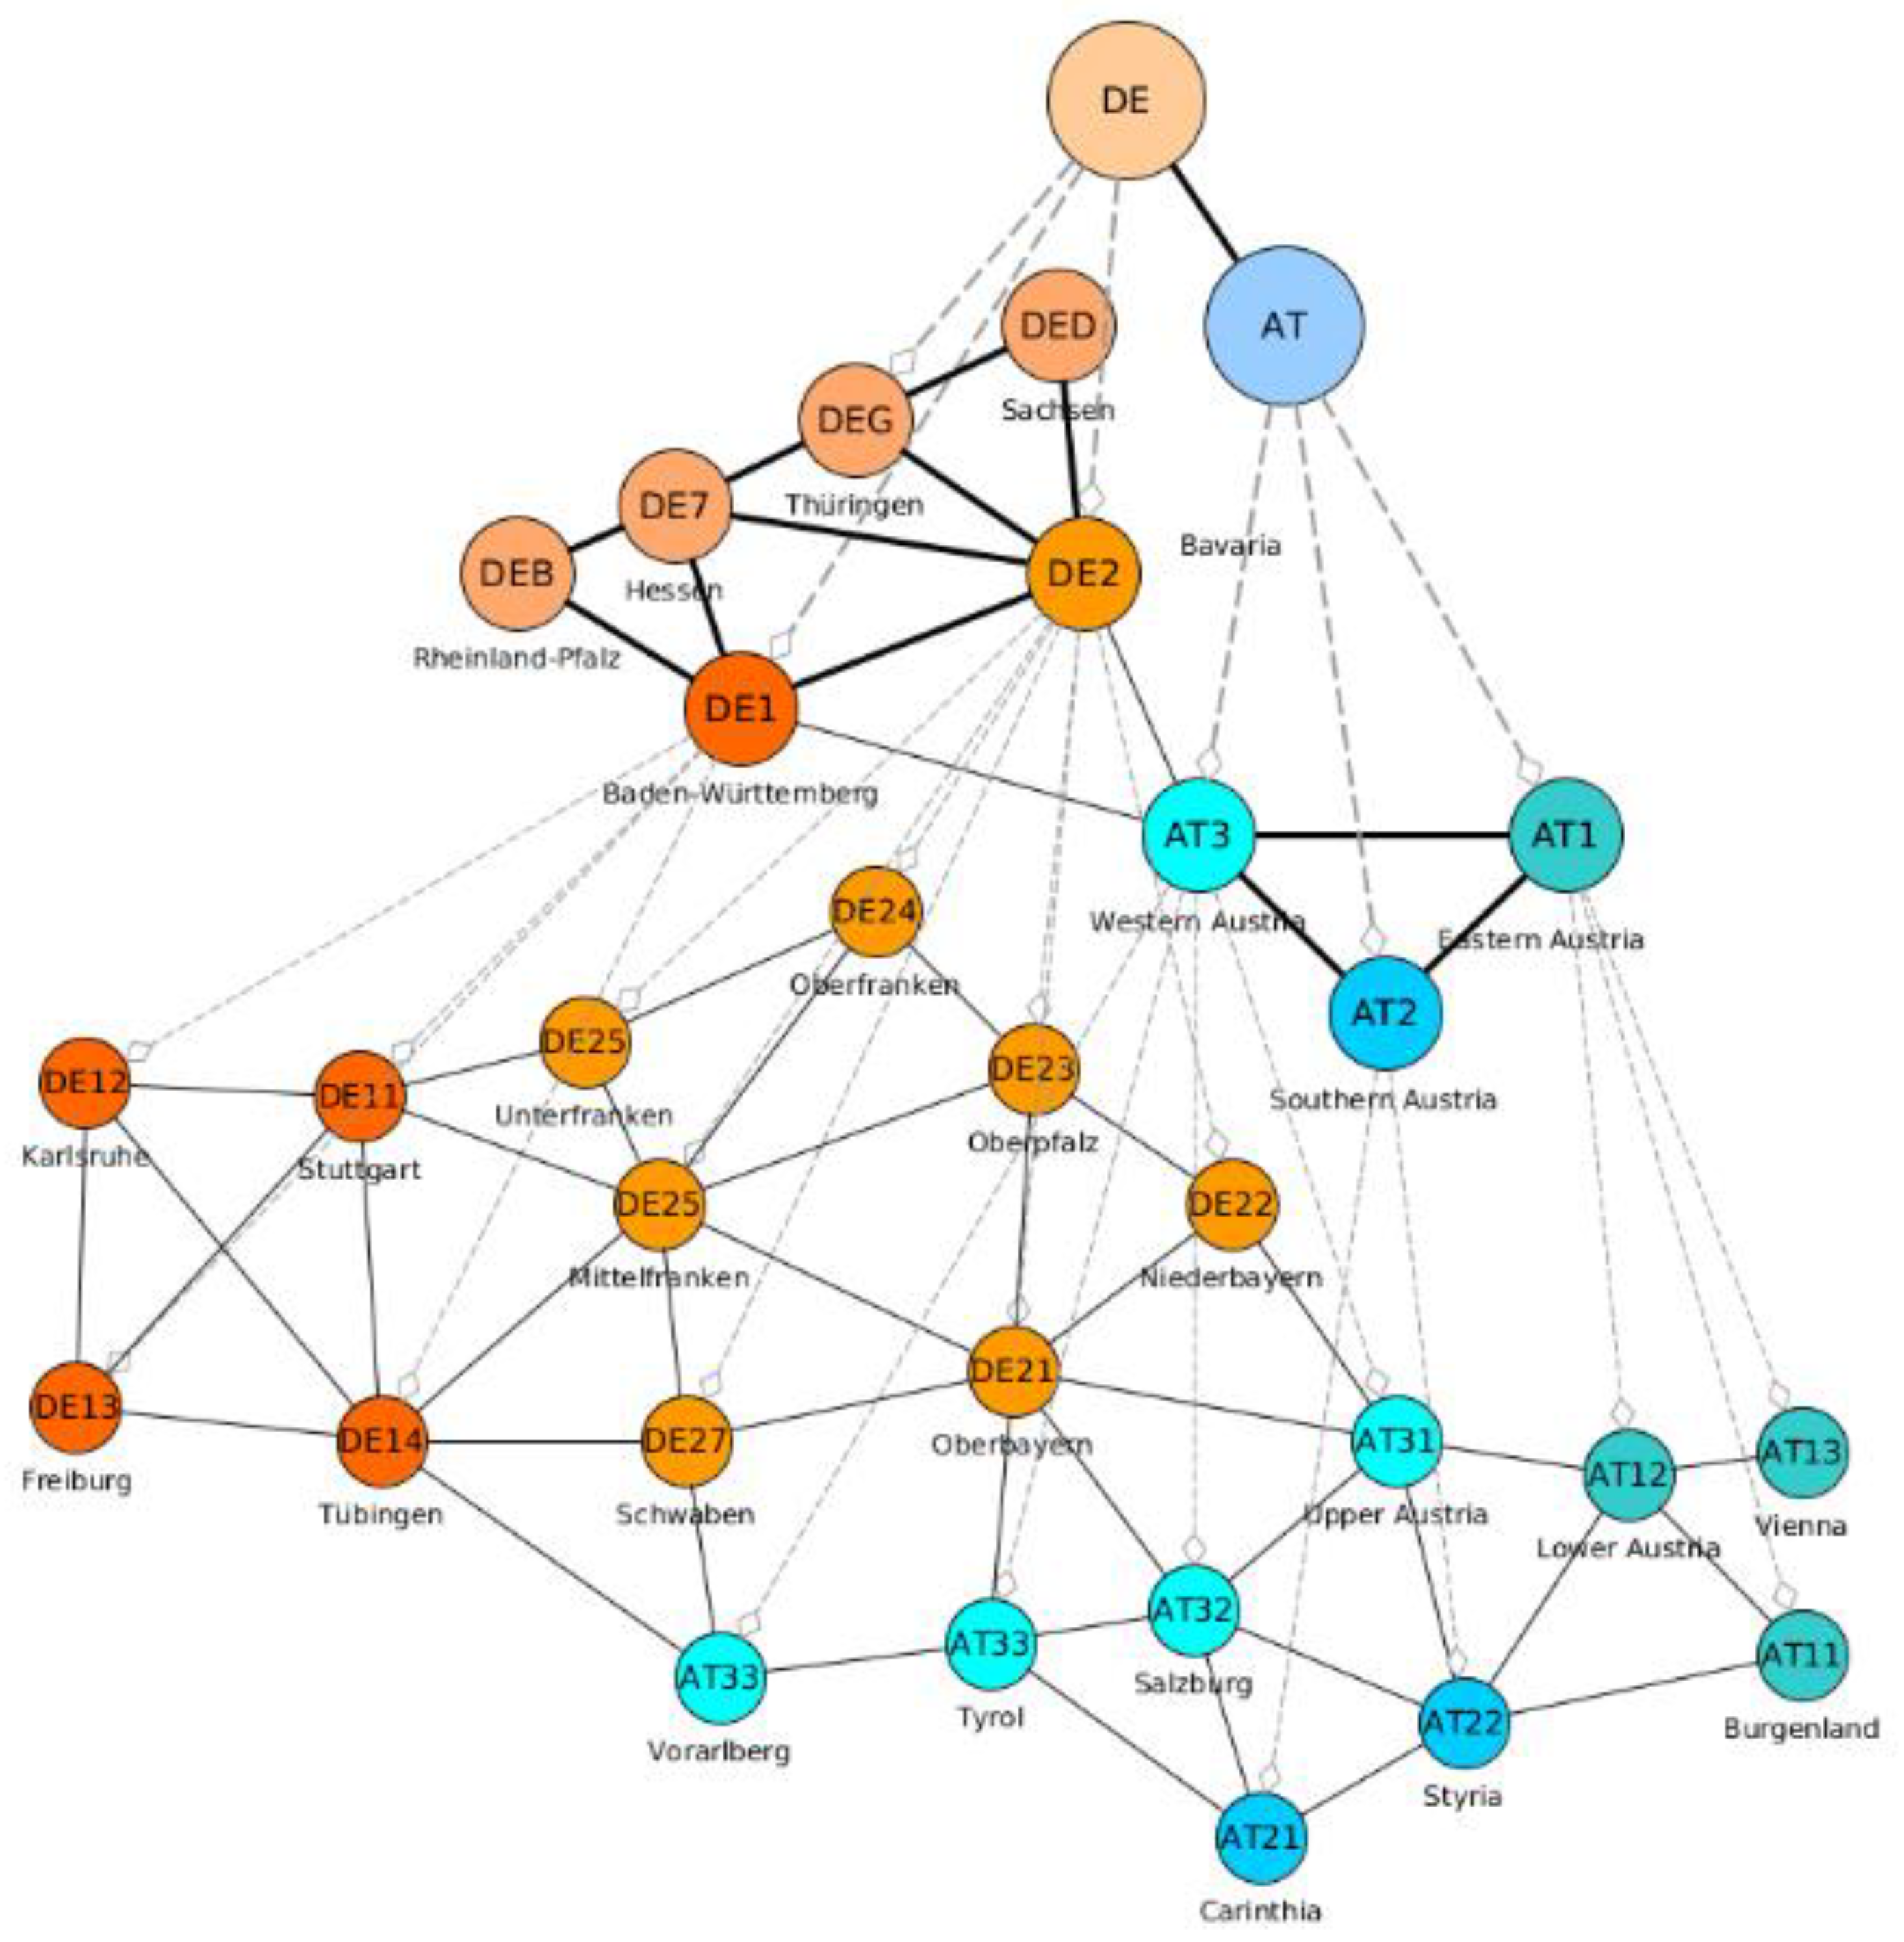
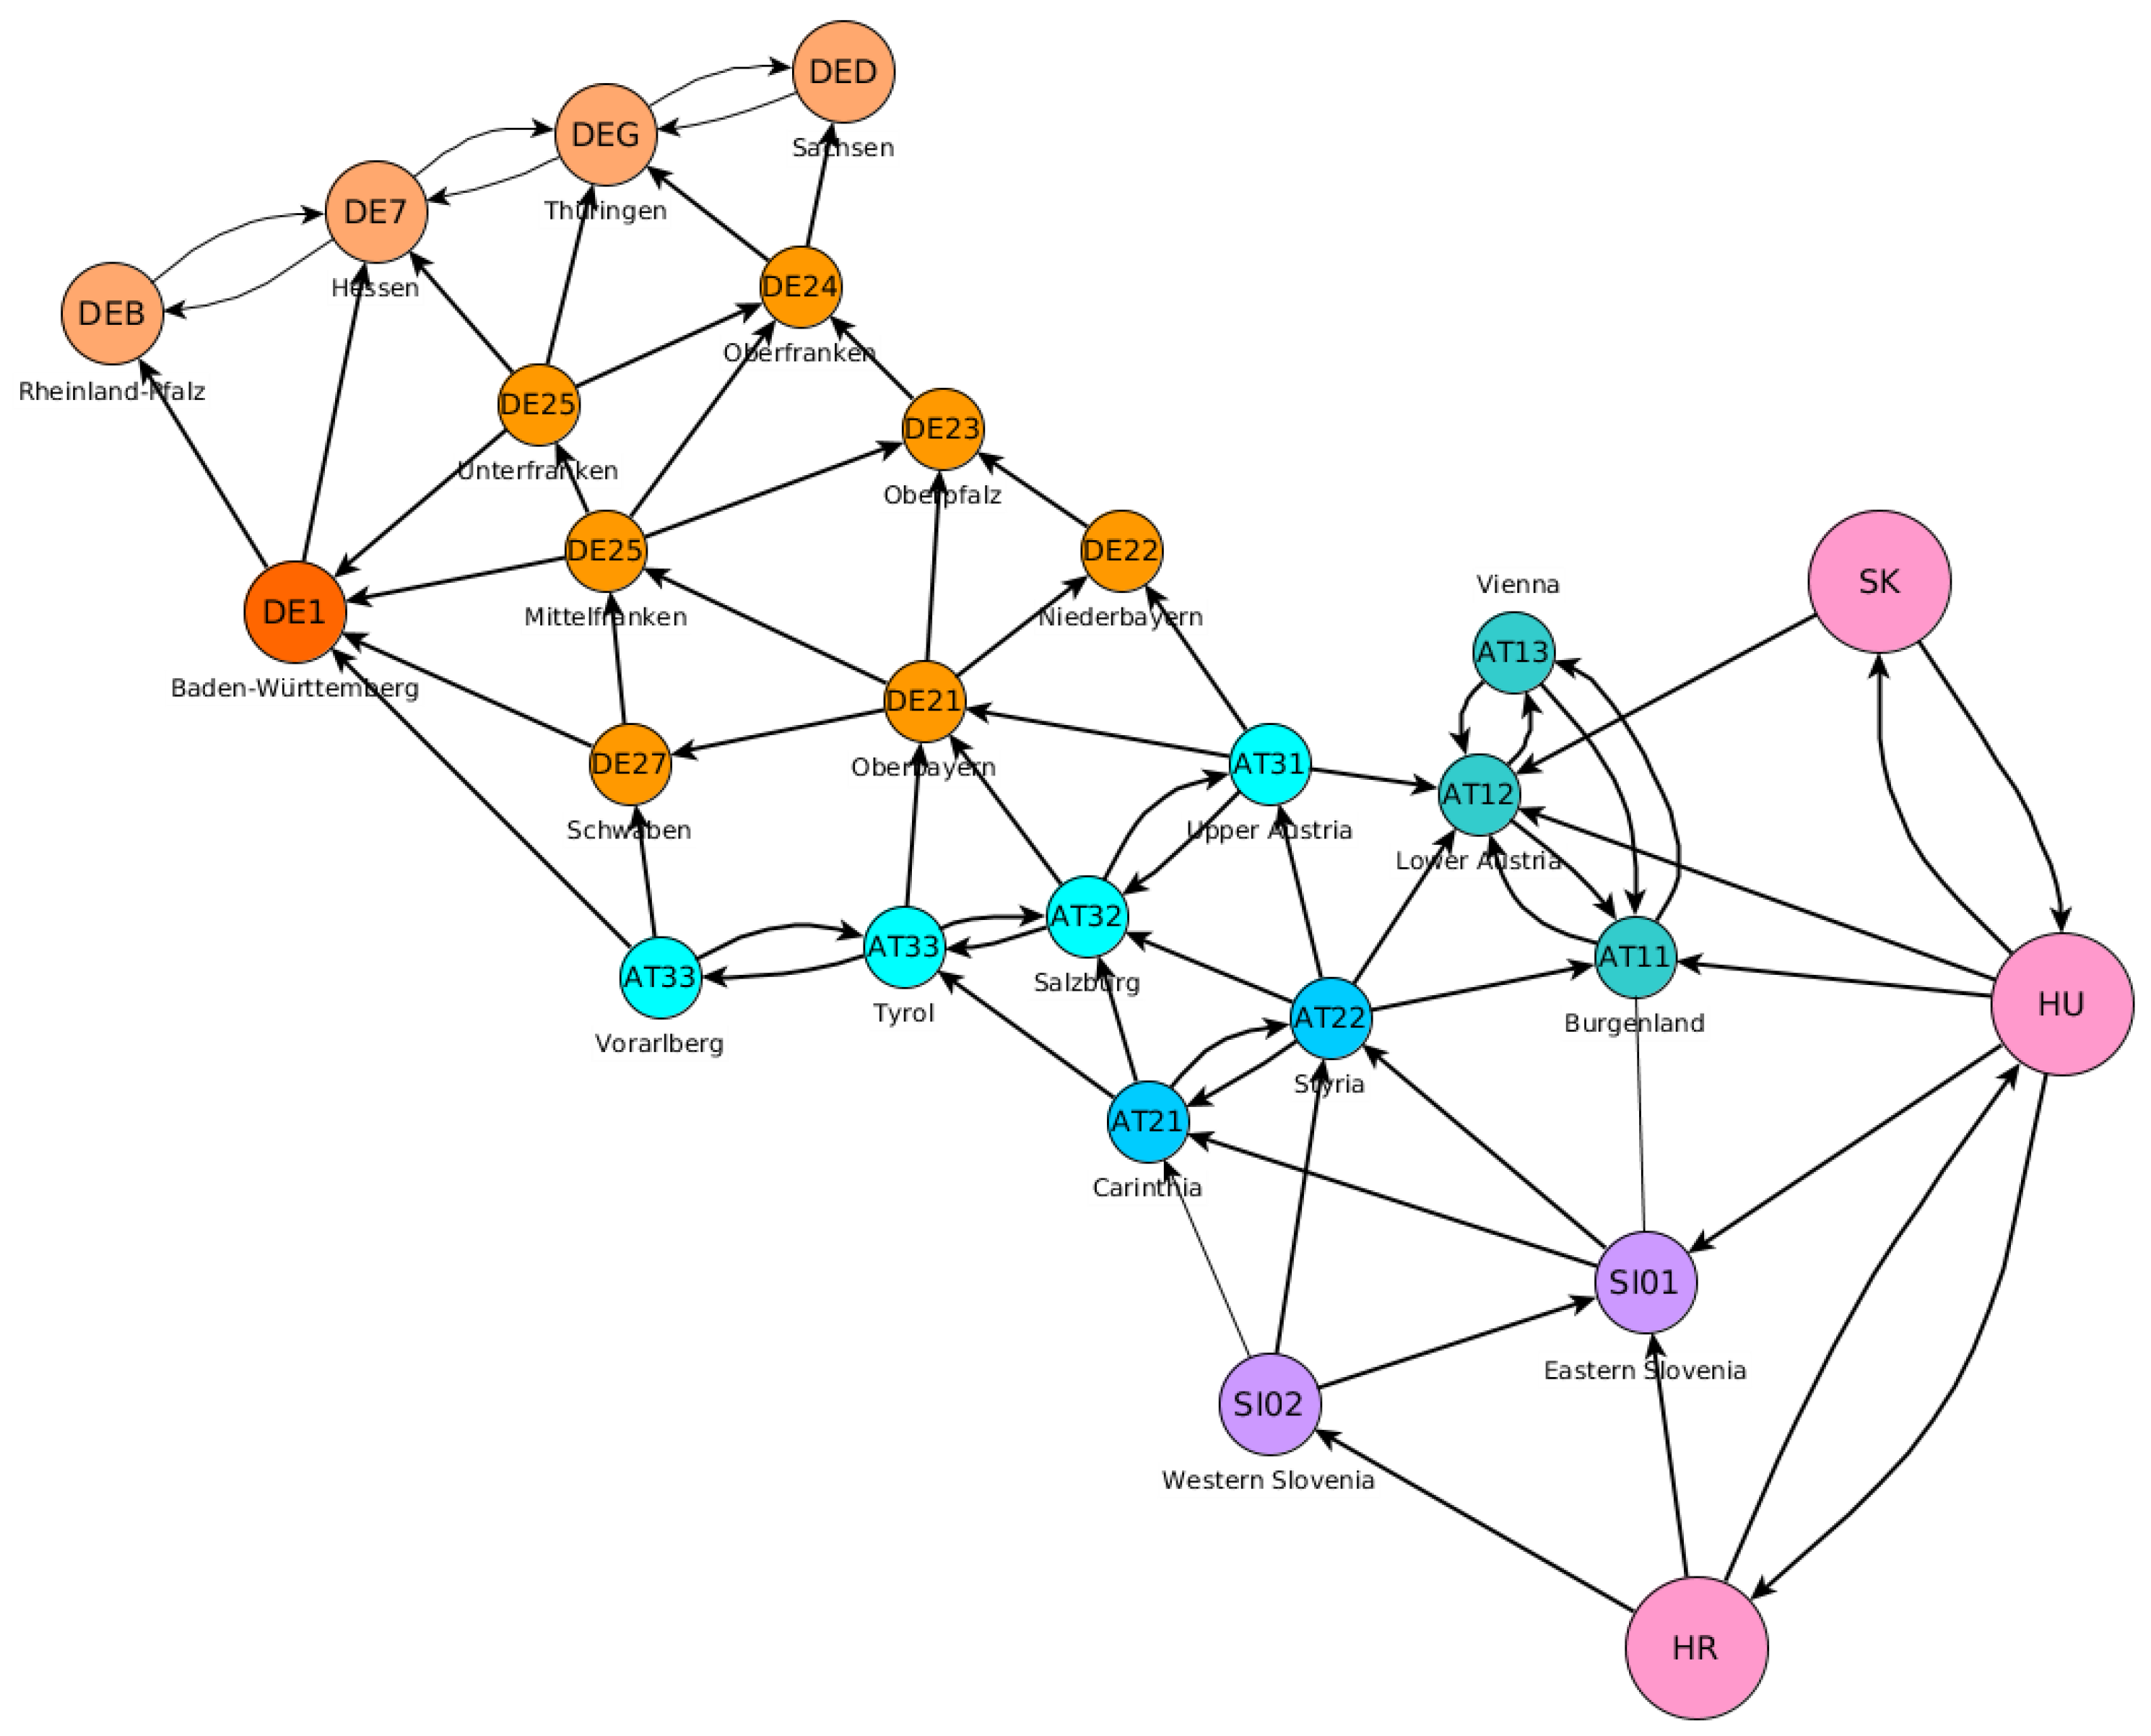
Particularly, we investigated a network-based simulation model to simulate refugee movements. In a network, the vertices of the graph are an abstraction of a geographic reference area such as a state name, a spatial resolution, or coordinates. Its edges denote possible paths between those geographic references. Furthermore, the graph is directed and contains weights reflecting the transition probability from one vertex to another vertex. To remain consistent with probabilities, all outgoing edges of every single vertex of the network must sum up to one and must be greater than zero. The resulting adjacency matrix of this graph then has the property of being column stochastic and the matrix is then called a transition matrix. This is very closely related to concepts from a Markov chain, but the vertices are geographical states rather than events.
A network with fixed transition probabilities behaves like a column stochastic matrix, and when iterating over a time index, it will converge to its eigenvalues, as shown in the example in
Figure 14. To take a further temporal dynamic into account, we allowed the underlying transition probabilities of fixed connectivity of the network to change. For discrete-time steps
we have transition probabilities in an adjacency matrix
in which only the edges of an initial
(the initial network) are allowed.
To initialise a network, we looked at different stages: defining the network vertices and their geographical mapping, defining initial connectivity, which must be respected in subsequent steps, and defining factors and dynamics, which can change the connectivity in subsequent time steps.
An approach is to manually define a spatial extent in a geographic hierarchy such as the NUTS hierarchy and then come up with semi-automatically generated vertices and their associated geographic regions. Another approach would be to define coordinates for reverse geo-coding and obtain vertices with automatically detected extents of their associated geographic region. We used the NUTS code hierarchy and OpenStreetMap (OSM) for these automated approaches. In the second stage, we collected distance information of the associated geographic regions of vertices, restricted the distances to possible travelling distances for the desired time window, e.g., one day, and used this to define the basic connectivity of the network. In the third stage, we introduced weights (also called factors) for several sources of real-world statistics to control the changing dynamics of the transition probabilities. Those weights can be drawn from a Dirichlet distribution. We consider geographic distances and population densities as two real-world statistics, but the concept easily transfers to other statistics such as weather conditions or air traffic [
62].
Finally, the described network can either be used to learn from exemplary time series data or its structure, and the underlying parameterised distributions can be used to sample simulated observations for each region. Given a set of observed regions with statistics about refugees, we can formulate an objective that is then used to improve the network dynamics to sample realistic observations.
6. Discussion
We proposed an approach to analyse social media data and refugee movement statistics with state-of-the-art machine learning methods. The experiments cover the refugee movements from Turkey to Central Europe in 2015 and 2016 and show which information about this event can be extracted and how refugee movement statistics can be used with our approach. We evaluated the social media results by comparing them with events and routes described in newspaper articles. The forecasting and the simulation of the refugee movements rely on the actual refugee movement statistics and the forecast models were assessed quantitatively with the RMSE.
The four research questions defined in the introduction can be answered as follows and comprise the major findings of our analysis:
RQ1: We found that a hot spot analysis applied on refugee-related tweets extracted using keywords suggested by experts reveals spatio-temporal patterns corresponding to real collective refugee movements described in newspaper articles. The results presented in
Section 5.1 demonstrate that changes in the refugee paths as well as key locations were identified in the analysed Twitter dataset.
RQ2: When training a CNN with annotated data that distinguishes between tweets containing factual information about refugees and others, we were able to identify tweets with information about collective refugee movements (see
Section 5.2). The information extracted from social media corresponds to the actual transit routes of refugees at the time.
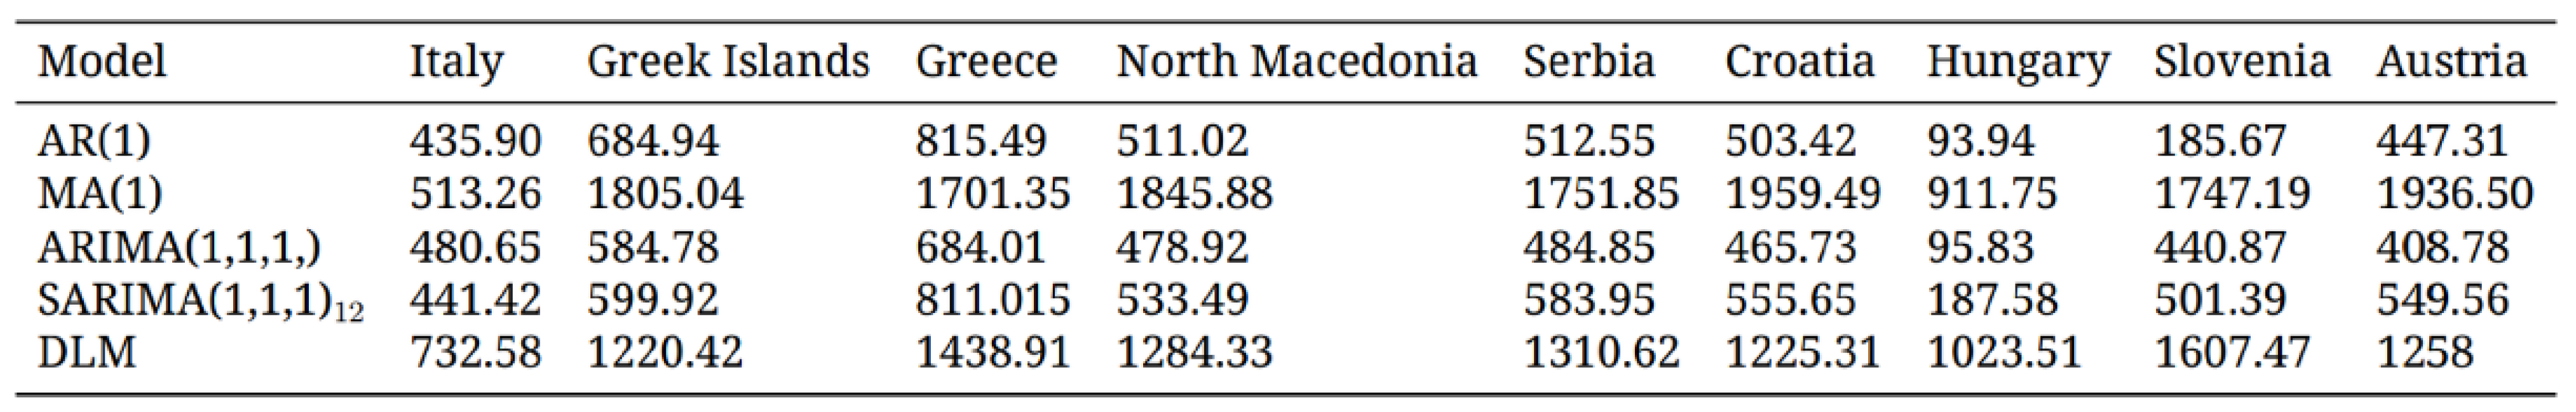
RQ3: We applied various time-series models on refugee movement statistics to forecast numbers of arriving refugees per country and found out that, overall, ARIMA achieved the best RMSE (see
Section 5.3). However, in some cases, other models, such as AR and SARIMA, outperformed ARIMA.
RQ4: By combining refugee movement statistics with geo-spatial datasets such as OSM or NUTS, we were able to design a network model to simulate potential refugee movements (see
Section 5.4). It simulates state changes per (fixed) time step and estimates how movements occur quantitatively. The transition matrix can be extended with real-world statistics such as population densities, weather conditions or geographical distances that provide a high flexibility for simulation.
The demonstrated methods and datasets provide manifold opportunities to enhance refugee management. First, by extracting and visualising the weekly bins, we can monitor temporal changes within the area of interest where collective refugee movements have been indicated. These changes are of high interest for relief organisations and public authorities who rely on timely movement information to allocate their resources accordingly. Furthermore, the acquired information can be combined with other systems to validate new unverified information provided by third parties. Because our approach allows us to monitor large areas, it can also inform the target selection process for focal monitoring systems such as satellite-based remote sensing.
Secondly, the information extracted from the tweets’ content allows us to describe refugee movements quantitatively and qualitatively. This information includes attributes such as the means of transport or the number of refugees travelling from one location to another. By extracting quantitative figures, organisations can optimise their planning and scale their logistics according to the number of refugees arriving.
Thirdly, forecasting based on refugee movement statistics provides organisations with the possibility to go from simply reacting to the situation to being prepared for similar future scenarios ahead of time. In combination with the spatio-temporal simulation, authorities can optimise their logistics based on past events and can simulate potential situations. In comparison to the information extracted from social media, these results are based on statistical datasets that can complement these results well.
Concluding, the research conducted in this study improves the current refugee management procedures by extracting additional information from an online data source and estimating spatial and temporal developments. In comparison to traditional data, the results can be produced in real-time as the social media posts can be collected at any time.
The datasets and methods used in this study provide valuable insights for relief organisations and public authorities. However, multiple aspects need to be considered when using these datasets and methods, which we discuss in this section.
6.1. Limitations and Possible Improvements of Social Media Data Analysis
The Twitter datasets mostly consist of irrelevant data that do not add any value to our analysis. Therefore, we extracted relevant tweets based on predefined keywords. We considered tweets to be relevant if they included one or more keywords. Although we carefully considered the used keywords with the help of experts, the keywords need to be adapted and must be translated by language experts to other languages to make them usable for other or similar use cases in the future. While conducting the analyses to identify relevant tweets, we also tried a topic modelling method to extract language-independent topics from the corpus. Topic modelling has been successfully applied in various other domains to identify relevant tweets. In our case, the goal was to identify one or more topics related to refugee movements. However, topic modelling did not yield a satisfying result. We believe that in comparison to other events, such as earthquakes, for example, refugee movements do not cause a sudden interest in social media and associated activities are distributed over a longer period of time. Therefore, the tweets that are related to refugee movements are not considered to be an independent topic but rather a part of other topics.
The hot spot analysis results showed highly promising results when we compared the hot spot maps with reports of the area. However, one issue with this method is that the calculated cell size strongly influences the result. For the cell size, we adapted a formula that takes the extent of the area and the number of tweets into account. In its original form, we needed to use a larger moving window than weekly so that the cells are fine-grained enough to draw conclusions about areas of particular interest, such as borders. In the case of the weekly moving window, such areas of interest were often only represented by one cell. In order to use the weekly moving window, we adapted the formula and added a variable in the divisor. This makes the use of the formula more flexible for various use cases and domains.
By using only keywords for the extraction of relevant tweets in the first step, we are aware that the extracted dataset can include artificially created tweets by bots or fake news about refugee movements. Both problems need to be tackled, but there is no general solution for detecting bots and fake news yet. Therefore, we decided not to remove any tweets from the dataset and assumed that the number of artificially created tweets and fake tweets does not strongly influence the results.
Another critical aspect is the ambiguities in the location extraction from the text by DBpedia Spotlight, whereby the location with the highest internal score is matched with the location in the text. DBpedia Spotlight detects multiple locations, but the score can still be improved. The internal score depends on the context of the text, which improves with the length of the text. As tweets are short by nature and several studies have shown that DBpedia Spotlight can be worse than other platforms [
67], we expect that the results can be improved by combining multiple platforms.
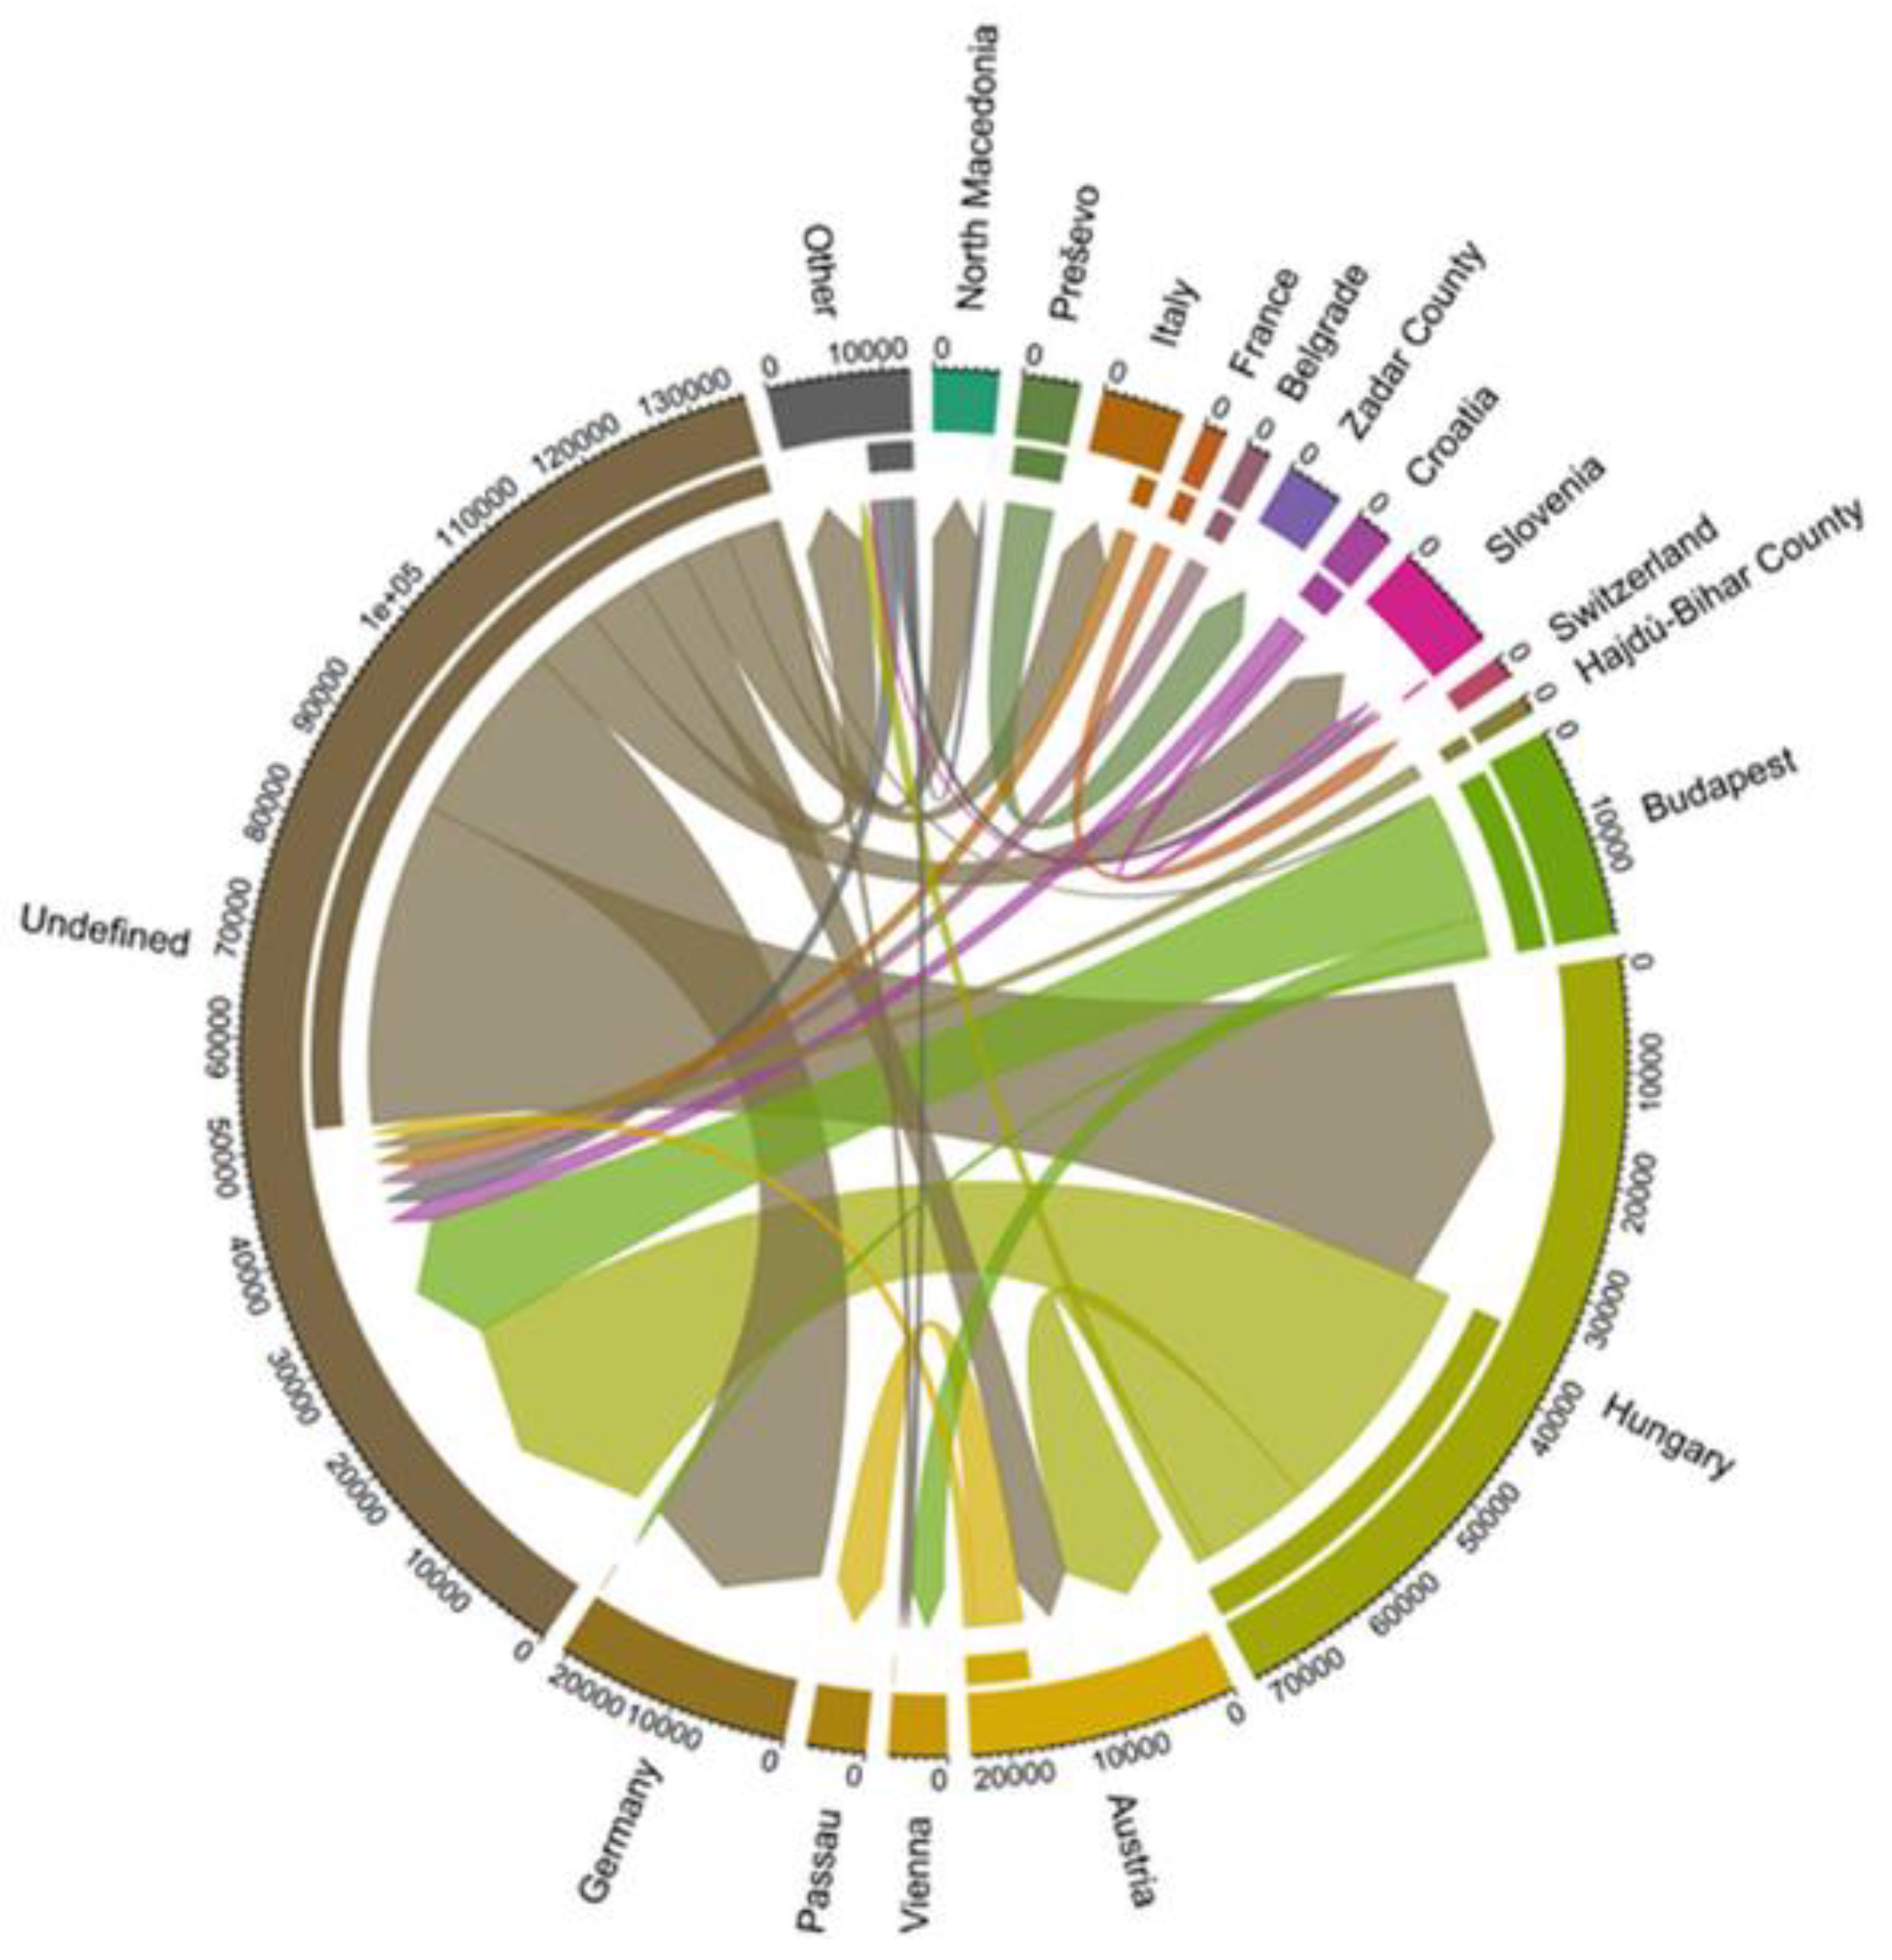
The information extraction could identify either the origin or the destination mentioned in a tweet in most cases, which results in the additional category “undefined” in the chord diagrams. Although this is an unsatisfactory result, it reflects the nature of tweets where people assume a certain knowledge of context and do not share every piece of information explicitly. This could be solved by matching the information from different tweets where either origin or destination is missing.
While the used CNN model achieves a reasonable performance, which is superior compared to a baseline model, it still suffers from a lack of available training data. Data augmentation can be employed to improve the generalisation ability of a neural network. Such strategies apply label-preserving transformation during training and thereby increase the variability of data seen by the network. Zhang et al. [
68] propose augmentations by replacing words using a thesaurus. Thereby, words are stochastically replaced with words that have a similar meaning according to the thesaurus. A replacement is chosen from the ranked synonyms via, e.g., a geometric distribution. A similar approach can be undertaken by computing the similarity as the (cosine) distance in the word embedding space. Both data augmentation strategies were tried but proved to be of little benefit while being costly to compute.
Any strategy that works on the words has the disadvantage of requiring separate pre-processing, including embedding lookups, for each training epoch (e.g., 50×). Furthermore, replacing words via similarity in the embedding domain is costly, even when scaling them so that the Euclidean is equal to the cosine similarity and can be used to increase the computation speed. Lastly, both the distribution for determining whether a word is replaced as well as how a replacement is selected from available candidates need to be tuned.
On a small dataset, such a process is prone to overfitting, leading to a resulting model that is not usable in the real world. Therefore, no augmentation was used for our final model. A technique that is promising and requires little tuning but was not tested is the back-translation augmentation [
69]. In this method, documents are automatically translated into another language and back into the original language, resulting in a paraphrased document with similar meaning. Trying such a method can be considered worthwhile in future work, given that an automatic translator that works well on tweets is available.
Instead of artificially increasing the amount of training data, more posts could be annotated using a crowdsourcing platform. As acquiring labelled data was a challenge for our dataset, the annotator instructions and examples should be designed carefully in order to achieve a consistent understanding of the annotation task. Additionally, the relevance of a post could be further distinguished into categories based on the presence of certain factual information, i.e., locations, refugees, or movement. This would allow for a model to better learn the association between certain semantic or syntactic patterns and facts that can be extracted later. If these categories could be learned automatically, an improvement in the runtime and accuracy for fact extraction could be achieved by only performing the steps for the types of information that are indicated by the classifier.
While text-based deduplication is an important step in the information extraction pipeline, it does not guarantee factual consistency. Specifically, it cannot be used to remove different paraphrases of the same information, e.g., headlines of news articles that describe the same event (various tweets in the Twitter datasets describe newspaper articles). If, however, fact extraction works to an appropriate degree, fact-based deduplication can be applied later to either aggregate information between duplicates or remove them. Techniques from both record linking and data deduplication methods needed, e.g., for database systems, could be used in this task.
6.2. Uncertainties in Time-Series Analysis and Reliability of Simulation Results
Refugee movements are inherently a very complex process reliant on a large set of uncertain circumstances. Forecasting such a complex phenomenon is undoubtedly riddled with high quantitative errors, making the choice of a perfect model rather arbitrary. Based on our analyses, it is hard to ascertain which approach is superior solely based on quantitative analysis, and we believe that relying on any one technique would not be prudent. The trend forecast, which is a hybrid approach, yields a more accurate result. Rather than focusing on quantitative single-valued outcomes, the trends in different outcomes should be evaluated subjectively and used in a larger risk management framework comprised of inputs from other experts. Our research demonstrates that a relatively softer mode of estimation, which involves forecasting trends with their corresponding slopes and model-specific uncertainties, can yield valuable insights into risk management frameworks.
The statistical modelling problem of refugee movements across both a temporal and a spatial dimension is not only complex in its mathematical nature but also too highly parameterised for so few time-series data points that we have available from the UNHCR database. This renders our research into a mostly analytical and artificial setting, and while simulation runs could give the impression of realistic results, it is inherently difficult to assess the reliability of their information. Reliability can only be provided if we make sure we analyse multiple settings of refugee movements of rich data quality in both the temporal and spatial dimensions and can be sure as intelligent humans that the explored settings are of a mostly independent and diverse nature.
From a technical perspective, we see a rising number of tools combining complex network analysis, differential equations, and agent-based simulation models, and our simulation model can serve as a fusion between network analysis and agent-based simulation with close relationships to hidden Markov models. Those tools can advance predictive and simulative systems for, e.g., refugee movements, information spreading, or epidemic modelling.
6.3. Availability of Datasets
The analysed datasets in this study were collected via Twitter’s API and UNHCR’s website. Social media data are commonly collectable through an API that social media networks such as Twitter, Foursquare, YouTube, or Flickr provide. In general, various parameters (constraining the request to a specific time span, area, or keywords that must be part of the data’s text) can be set to target the most useful data for the specific use case. However, the networks also restrict access to their data by limiting the use of their API by setting a maximum number of requests per predefined time slot or only providing data that were posted in the last seven days. Furthermore, it is only possible to collect a small percentage of the full dataset, even when the requirements of the API are met. These limitations can be overcome with paid subscriptions that reduce the restrictions by a network. However, only public data can be collected from the network as social media users can also protect their data by customising their data privacy settings in the social media networks.
Considering the aforementioned possibilities and limitations, public authorities and emergency organisations should set up and deploy a programme to collect social media data before a potential refugee movement and should continuously collect data that they can analyse if a sudden refugee movement occurs.
The UNHCR dataset is freely available on the UNHCR website. The updated estimates for the daily arrivals per country were published irregularly on their website and included the latest updates on previously published data and new data. As the data are provided by one organisation but include information from UNHCR border teams, authorities, and humanitarian partners, data availability strongly depends on UNHCR and their partners. Although there are also other organisations that provide information about refugees, we could not find a dataset with a similar temporal and spatial resolution for this study.


 ,
, 


