Article

Comparison of Power Requirements: Flapping vs. Fixed Wing Vehicles

Institute of Flight System Dynamics, Technische Universität München, Boltzmannstr. 15, 85748 Garching, Germany
Aerospace 2016, 3(4), 31; https://doi.org/10.3390/aerospace3040031
Submission received: 23 May 2016 / Revised: 31 August 2016 / Accepted: 1 September 2016 / Published: 28 September 2016
(This article belongs to the Special Issue Flapping Wings)

Abstract

:
The power required by flapping and fixed wing vehicles in level flight is determined and compared. Based on a new modelling approach, the effects of flapping on the induced drag in flapping wing vehicles are mathematically described. It is shown that flapping causes a significant increase in the induced drag when compared with a non-flapping, fixed wing vehicle. There are two effects for that induced drag increase; one is due to tilting of the lift vector caused by flapping the wings and the other results from changes in the amount of the lift vector during flapping. The induced drag increase yields a significant contribution to the power required by flapping wing vehicles. Furthermore, the power characteristics of fixed wing vehicles are dealt with. It is shown that, for this vehicle type, the propeller efficiency plays a major role. This is because there are considerable differences in the propeller efficiency when taking the size of vehicles into account. Comparing flapping and fixed wing vehicles, the conditions are shown where flapping wing vehicles have a lower power demand and where fixed wing vehicles are superior regarding the required power. There is a tendency such that fixed wing vehicles have an advantage in the case of larger size vehicles and flapping wing vehicles have an advantage in the case of smaller size ones.

Graphical Abstract

1. Introduction

Vehicles with flapping wings that enable simultaneous lift and thrust generation have gained significant interest as an alternative flight possibility when compared with fixed wing vehicles [1,2,3]. Flapping wing vehicles show a variety of aerodynamic configurational designs and constructional solutions for flapping the wings. The size of flapping wing vehicles ranges from large-scale, ornithopter-type aircraft powered by an engine or by the muscles of the pilot to small- and even micro-scale air vehicles.
One issue of flapping wing vehicles—among various disciplinary aspects—is the flight performance and efficiency that can be achieved with this type of vehicle. There are different topics in that field. A fundamental one is the power that is necessary to enable level flight and, in particular, the minimum power required to stay aloft. With regard to fixed wing vehicles, the relations describing the flight performance and the associated flight condition are well known, e.g., [4].
There is a number of papers and investigations concerned with the flight performance of flapping wing vehicles, e.g., [5,6,7,8,9,10]. Thus, significant progress in that field was achieved and important findings were obtained. This also holds for progress in the area of organisms that fly using wings or fins [11,12]. With respect to the efficiency of flapping wings and the achievable flight performance, there are differing results. This includes findings according to which flapping wings show a higher efficiency whereas other cases indicate a lower efficiency.
With regard to small-scale flapping wing flight, there are additional aspects that are related to the smallness of those vehicles [1]. Because of the small size, this type of vehicle shows unique features. One relates to unsteady effects, considered to provide advantages over comparable fixed wing designs. Another example are separated flow aspects which are assumed to enhance lift and thrust, and efficiency effects unique for micro-sized vehicles. Such effects will not be addressed because they are beyond the scope of this paper.
A key factor for the power demand of flapping wing vehicles is the drag. The drag consists of two parts, one is the drag at zero lift and the other part is the induced drag. In recent papers, it has been shown that the induced drag is strongly influenced by flapping [13,14,15]. The presented results reveal that there is a substantial increase in the induced drag in flapping wings when compared with an equivalent non-flapping, fixed wing configuration. The profile drag is also an issue [16]. In the present paper, this drag part is treated as an effective value in terms of an average holding for a flapping cycle.
The question, which is subject of this paper, is how the flight mechanical performance of flapping wing vehicles can be modelled and what are the mathematical relations describing the performance characteristics, in particular those describing the engine or muscle power necessary for level flight and the associated minimum. A further question is how the power required by flapping wing vehicles compares with that of fixed wing vehicles.
A goal of this paper is to derive explicit solutions in order to show the performance characteristics of flapping and fixed wing vehicles in a clear manner. Furthermore, emphasis is placed on the physical mechanisms underlying the performance characteristics of the vehicles. For the addressed purposes, a pragmatic approach with simplifying assumptions is deliberately made, such as using a quadratic drag polar or presupposing quasi-steady flow characteristics. In spite of this, the findings are considered to properly describe the essentials of the performance topics under consideration.

2. Performance Relations

A key factor of the flight performance efficiency of aerial vehicles is the power that the vehicles require for level flight. This is considered a performance indicator appropriate for comparing flapping wing and fixed wing vehicles.
The following relation holds for the engine power of a propeller-driven fixed-wing aerial vehicle equipped with a piston engine or an electrical motor in level flight [4]
P f i x = D   V η p r o p
where subscript “fix” is used to denote the fixed wing case. This relation can be expanded using the lift-weight equation in level flight
m g = C L ( ρ / 2 ) V 2 S
and introducing the non-dimensional power form
P ¯ f i x = P f i x 2 ( m g ) 3 / ( ρ S )
to yield
P ¯ f i x = 1 η p r o p C D C L 3 / 2
That relation can also be used for flapping wing vehicles in which case η p r o p = 1 holds. Furthermore, the drag and lift coefficients effective in flapping flight apply. Thus, for the power in flapping flight
P ¯ f l = ( C D C L 3 / 2 ) f l
where subscript “fl” is used to denote the flapping wing case.
The non-dimensional power forms, Equations (4) and (5), are considered appropriate for showing more clearly the effects of flapping that manifest in the drag characteristics. Furthermore, these forms are independent of size, mass and speed.
The minimum power is considered of particular interest because it is the lowest power demand for staying aloft. It is determined by the following relations
P ¯ f i x , min = 1 η p r o p ( C D C L 3 / 2 ) min
and
P ¯ f l , min = ( C D C L 3 / 2 ) f l , min
where it is presupposed that the optimum η p r o p value is associated with ( C D / C L 3 / 2 ) min .

3. Flapping Wing Vehicles

3.1. Modeling of Lift Characteristics of Flapping Wing Vehicles

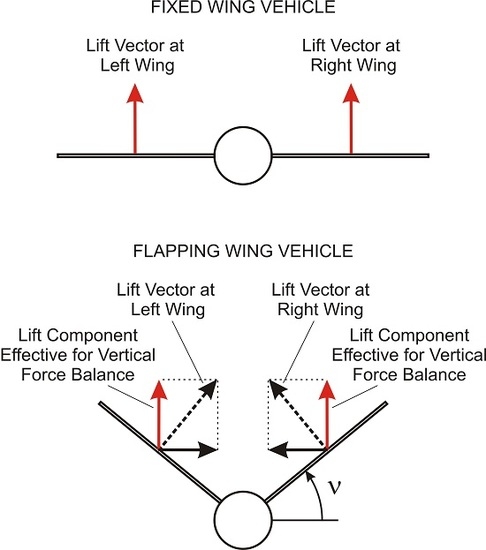
In flapping wings, the overall lift vector consists of two components, one of which acts at the left wing and the other at the right wing. This is graphically addressed in Figure 1 where the two components denoted by L ˜ l and L ˜ r are shown. The average amount of the overall lift vector for a complete flapping cycle can be modelled as
L = 1 t f l 0 t f l ( L ˜ l + L ˜ r ) d t
where t is the time, t f l is the flapping period and the “~” symbol denotes an instantaneous value (here for L ˜ l , r and also in the following for other quantities).
In forward flight, the lift vector is the aerodynamic force that balances the weight. Because of tilting, the lift vectors at the left and at the right wing do not fully act against the weight, but only a part of them. That part is given by the vertical components of L ˜ l and L ˜ r , as shown in Figure 1. Thus, for the average overall lift component acting in the vertical direction
L v e r t = 1 t f l 0 t f l ( L ˜ l + L ˜ r ) cos v   d t
This relation can be expanded applying the first mean value theorem for integration [17] to yield
L v e r t = cos v * t f l 0 t f l ( L ˜ l + L ˜ r )   d t
where v * is a value between the flapping angle limits v min and v max ,
v min < v * < v max
Using Equation (8), L v e r t can be expressed as
L v e r t = L cos v *
In terms of lift coefficient notation, the following relations apply according to the corresponding force relations
C L = L ( ρ / 2 ) V 2 S
and
C L , v e r t = C L cos v *
An insight into the effect of lift vector tilting can be obtained considering the case L ˜ l , r = const in the downstroke, L ˜ l , r = 0 in the upstroke, v min = 60 ° , v max = 60 ° and v ˙ = const where simplifying assumptions particularly relate to v min , v max and v ˙ . The assumption that the lift in the upstroke is zero, L ˜ l , r = 0 , can be considered a possible scenario. This is, for example, a scenario in the flight of birds [18,19]. For the described case, cos v * = 0.83 and C L = 1.21 C L , v e r t . As a result, the amount of lift that has to be generated is larger by 21% compared to the value which is usable for the vertical force balance concerning the weight.
A further insight into and a confirmation of the effect of lift vector tilting can be obtained by investigating the lift characteristics of a wing at a large flapping angle, ν , and applying an aerodynamic method appropriate for such a complex wing configuration. For this purpose, the FLM-Eu Code was used, which is an in-house developed computer program of the Institute of Fluid Mechanics of the Technische Universität München [20,21]. It is a highly efficient aerodynamic method for modelling the fluid flow around complex geometries and to obtain results of high numerical precision. It provides comprehensive modelling capabilities for a wide range of steady and unsteady flows of an inviscid, rotational and compressible nature and for complex two- and three-dimensional forms.
The computations were performed using the FLMNAV solver. This is an in-house developed code of the Institute of Fluid Mechanics of the Technische Universität München [20,22]. The solver is based on a finite-volume approximation to the integral form of the unsteady Euler equations. The conservation form of Euler equation is written in body fitted co-ordinates given as
Q τ + F ξ + G η + H ζ = 0
where Q is the vector of conservative variables times the Jacobian transformation, J, and F, G, and H are the conservative fluxes with respect to the ξ, η and ζ, directions.
As a case representative for complex wing geometry, a pigeon was selected to investigate the effects of high flapping angles. Furthermore, the pigeon wing is considered as an example for birds which are of interest for the subject under consideration. To achieve a detailed and realistic modeling of the pigeon wing, reference is made to [23], which provides an elaborate description of birds and presents detailed data concerning their form and mass properties. The geometry of the wing is presented in Figure 2. In Figure 2a, the planform of the wing and the profile as well as the generated surface mesh are depicted for zero flapping angle. The geometry of the wing and the generated mesh for 45.0° flapping angle are shown in Figure 2b.
Results on the effect of the lift vector tilt angle ν on the lift characteristics of the pigeon wing are presented in Figure 3. The lift coefficient effective for the vertical force balance, C L , v e r t , is shown dependent on the angle of attack α for three tilt angle cases, ν = 0 , ν = 22.5 ° and ν = 45.0 ° . While the case ν = 22.5 ° yields a small reduction in C L , v e r t when compared with the wing at zero tilt angle ν = 0 , there is a significant decrease for ν = 45.0 ° . The decrease in C L v e r t corresponds to a cosine-law when relating the decrease in C L , v e r t to C L 0 , v e r t (Figure 3), yielding
C L , v e r t ( C L , ν = 0 C L 0 , v e r t ) cos v

3.2. Modeling of Drag Characteristics of Flapping Wing Vehicles

Basically, the drag coefficient can be modelled as a quantity that is dependent on the lift coefficient effective in the vertical force balance, C L v e r t , and on the tilt angle of the lift vectors at the left and at the right wing, ν , yielding
C D = C D ( C L v e r t , ν )
To provide an insight into the effects of C L v e r t and ν on the drag, the above pigeon wing case is again considered. Results are presented in Figure 4 which shows the drag polar C L , v e r t ( C D ) for the three tilt angle cases dealt with before ( ν = 0 , ν = 22.5 ° , ν = 45.0 ° ). As a main result, the drag polar characteristics are changed such that the drag increases with the tilt angle, ν . This effect is comparatively small in the case of ν = 22.5 ° , while the increase in the drag reaches considerably higher values for ν = 45.0 ° .
An important aspect relates to the lift coefficient region in which the influence of lift vector tilting is large. The form of the curves presented in Figure 4 shows that the drag increase due to lift vector tilting is the larger the higher the lift coefficient. In the region of small lift coefficients, the influence of lift vector tilting is small or even negligible. This suggests that lift vector tilting primarily has an effect on the lift dependent drag.
To develop an analytical solution on the drag increase due to wing flapping, reference is made to the well-known quadratic drag polar relation holding for non-flapping wings. This relation can be expressed as
C D = C D 0 + C D i
where C D i is the induced drag coefficient accounting for the effect of the lift on the drag, given by
C D i = k π Α C L 2
The term k is called the induced drag factor that accounts for deviations from the elliptical lift distribution and Α is the aspect ratio of the wing ( Α = b 2 / S ).
In the case of flapping, the average drag coefficient of a complete flapping cycle involving the down- and upstroke can be obtained in a manner analogue to that for the lift coefficient in the preceding section. Thus for the average drag coefficient
C D = C D 0 + 1 π Α t f l 0 t f l k C ˜ L 2 d t
Expanding this relation and applying the first mean value theorem for integration [17] to the term describing the induced drag coefficient yields
C D i = k * π Α 1 t f l 0 t f l C ˜ L 2 d t
where k * is a constant. For the following, it is assumed that
k * k
To further expand the induced drag relation in Equation (20), the lift coefficient C ˜ L is split up into a constant given by the average, C L , and into a part depending on the time denoted by Δ ˜ ( t ) . Thus
C ˜ L ( t ) = C L + Δ ˜ ( t )
The average induced drag coefficient can then be expressed as
C D i = k π Α ( C L 2 + 1 t f l 0 t f l Δ ˜ 2 d t )
Expanding the integral term, Equation (23) can be replaced by
C D i = k π Α ( C L 2 + Δ a v 2 )
where Δ a v 2 > 0 is the average of Δ ˜ 2 .
With reference to Equation (14), the average induced drag coefficient can be expressed as a function of the lift coefficient effective in the vertical direction, C L , v e r t = cos v * C L . Thus
C D i = k f l a p π Α C L , v e r t 2
where k f l a p is the induced drag factor effective for flapping
k f l a p = 1 + Δ a v 2 / C L 2 cos 2 v * k
This relation shows that there are 2 effects of flapping that increase the induced drag factor k f l a p when compared with the induced drag factor of a non-flapping fixed wing, k :
(1)
Tilting of lift vector due to flapping the wings, resulting in the term cos 2 v * .
(2)
Changes in the amount of the lift vector in the course of the flapping cycle, resulting in the term Δ a v 2 .
To provide an estimate of the Δ a v 2 effect, it is assumed that the lift curve during the flapping cycle, consisting of the downstroke and the upstroke, is such as schematically presented in Figure 5. This figure shows that lift is generated in the downstroke whereas there is no lift in the upstroke. A behavior involving zero lift in the upstroke occurs in birds [18,19]. A possible reason for zero lift in the upstroke is that, in this case, there are no detrimental effects of the lift on the thrust. That is because a positive lift in the upstroke would generate a negative thrust due to its rearwards inclination caused by the upward movement of the wing [14].
Further to the lift behavior presented in Figure 5, examining Equation (25) with regard to an arbitrary lift curve shows that the minimum of the induced drag is obtained if the lift coefficient in the downstroke is constant, yielding
C ˜ L d o = const
where subscript “do” is used to indicate that C ˜ L d o is referenced to the downstroke time period. A constant lift coefficient in the downstroke is supposed to hold in the following treatment because this can be regarded as the most favorable performance reference of a flapping wing vehicle that cannot be undercut. This constant lift coefficient is considered appropriate for a performance comparison between flapping and fixed wing vehicles.
For C ˜ L d o = const , the following result is obtained for the induced drag factor described by Equation (26) in the case of equal down- and upstroke lengths
k f l a p = 2 cos 2 v * k
This means that the induced drag is at least doubled when compared with non-flapping, caused by the changes in the amount of the lift vector during the flapping cycle.
However, the induced drag increase is further enlarged when accounting for the effect of lift vector tilting, i.e., for the cos 2 v * term in Equation (28). For this purpose, the above simplified case ( L ˜ l , r = const in the downstroke, L ˜ l , r = 0 in the upstroke, v min = 60 ° , v max = 60 ° and v ˙ = const ) is considered, resulting in cos 2 v * = 0.68 to yield
k f l a p = 2.92 k
In summary, the results on the effects of lift vector tilting ( cos 2 v * ) and lift amount changes ( Δ a v 2 ) show that there is a substantial increase in the induced drag due to flapping when compared with the induced drag of non-flapping, fixed wings.

3.3. Power Requirements of Flapping Wing Vehicles

Introducing k f l a p , a relation describing the power required by flapping wing vehicles can be derived such that a direct comparison with fixed wing vehicles is possible. With reference made to Equations (12) and (14) for incorporating the lift-weight balance, and to Equation (25) for incorporating the drag, the power relation Equation (5) can be expanded to yield
P ¯ f l = C D 0 C L , v e r t 3 + k f l a p π Α C L , v e r t
Examining this relation with regard to its minimum, the following result is obtained
P ¯ f l , min = 4   C D 0 27 ( k f l a p π Α ) 3 4

4. Fixed Wing Vehicles

To expand the relation describing the engine power required by fixed wing vehicles, Equation (4), reference is made to the quadratic drag polar, Equations (17) and (18), which holds also for fixed wing vehicles. Thus, the following result is obtained for the power required by fixed wing vehicles in level flight
P ¯ f i x = 1 η p r o p ( C D 0 C L 3 + k π Α C L )
Examining this relation yields for the minimum power
P ¯ f i x , min = 4 η p r o p   C D 0 27 ( k π Α ) 3 4
where it is assumed that the optimal value of η p r o p is associated with the minimum power flight condition.
Concerning the comparison with flapping wing vehicles, Equations (32) and (33) show that the propeller efficiency η p r o p is a key factor with respect to fixed wing vehicles. Therefore, an overview on possible η p r o p values is provided in the following, related to fixed wing vehicles that are comparable in size with flapping wing vehicles.
In regard to a comparison with large flapping wing vehicles, reference is made to the experience in the field of small propeller-driven aircraft. For this purpose, representative cases for achievable propeller efficiencies of such aircraft are presented in Figure 6 and Figure 7. The case of Figure 6 relates to a light aircraft, the propeller efficiency of which is shown dependent on the advance ratio
J = V n D p r o p
where n is the rotation rate (in revolutions per second) and D p r o p is the propeller diameter. Effects of the blade pitch angle are also graphically addressed. The point that is of primary interest in the present context is the level of high η p r o p values that can be reached. The curves plotted in Figure 6 show that this level is close to η p r o p = 0.9 , holding for all blade pitch angles.
The case of Figure 7 relates to an ultralight vehicle where the propeller efficiency dependent on the speed for different propeller diameters is presented. Here again, the point of primary interest is the high η p r o p level that can be reached. The curves depicted in Figure 7 show that the level here is above η p r o p = 0.8 , holding in all propeller diameter cases.
In regard to a comparison with small and mini flapping wing vehicles, reference is made to the experience in the related field of propeller driven vehicles. As exemplary cases, propeller efficiencies of such vehicles are plotted in Figure 8 and Figure 9. The results presented in Figure 8 show that the propeller efficiency is lower than that of the larger vehicles considered before, attaining a level of about η p r o p = 0.7 . A case with a considerably smaller level is depicted in Figure 9, where the highest η p r o p values are around η p r o p = 0.45 .
As a résumé of the considerations on fixed wing vehicles, a possible range of propeller efficiencies is from 0.4 to 0.9.

5. Comparison of Power Required by Flapping and Fixed Wing Vehicles

To compare the power required by flapping and fixed wing vehicles, it is assumed that the aerodynamic configuration of the fixed wing vehicle is equivalent to the basic aerodynamic configuration of the flapping wing vehicle at a zero flapping angle ν = 0 . Accordingly, the C D / C L values of the fixed wing configuration and the flapping wing configuration at ν = 0 are considered to agree. This means with reference to Equations (29) and (31) that differences in the required power are caused by the propeller efficiency η p r o p on the side of the fixed wing vehicle and by the induced drag factor k f l a p on the side of the flapping wing vehicle.
As regards the vehicle mass, this does not explicitly appear in the non-dimensional form of the power, Equations (29) and (31). A possible difference in that regard between flapping and fixed wing vehicles can be accounted for by considering the relationship between the non-dimensional power forms with the dimensional power relation given in Equation (1).
Results on the comparison of flapping and fixed wing vehicles are presented in Figure 10 where the required power dependent on the speed is shown. For the speed applied in the diagram of Figure 10, the following non-dimensional form is used
V ¯ = V / V *
where V * is the speed at minimum drag given by
V * = 2 m g ( π Α C D 0 / k ) 1 / 2 ρ S
Basically for the results presented in Figure 10, both power curves show the usual characteristic according to which the required power decreases initially with the speed until a minimum is reached and increases thereafter at higher speeds. The dotted lines in the low speed range are considered possible extensions with regard to the maximum lift coefficient.
Besides that general characteristic, there are distinct differences between the two power curves. This is related to the selected values of k f l a p and the propeller efficiency η p r o p . The fixed wing vehicle involves a higher power demand in the entire speed range. This is basically due to the low propeller efficiency assumed to apply in that case. The superiority of the flapping wing vehicle in terms of a lower power demand increases at higher speeds.
A further effect is that the minimum power of the flapping wing vehicle is at a higher speed than that of the fixed wing vehicle. This is a general characteristic caused by the effect of k f l a p . For the minimum-power speeds of the flapping wing vehicle, V ¯ P ¯ f l , min , and the fixed wing vehicle, V ¯ P ¯ f i x , min , the following relations hold
V ¯ P ¯ f l , min = ( 1 / 3 )   k f l a p / k 4 V ¯ P ¯ f i x , min = 1 / 3 4
These expressions show that V ¯ P ¯ f l , min > V ¯ P ¯ f i x , min generally holds because of k f l a p / k > 1 .
A change such as that graphically addressed in Figure 11 holds for the power relationship between both vehicle types if the induced drag factor effective for flapping and the propeller efficiency are at higher values. Because of the higher propeller efficiency, the performance of the fixed wing vehicle is improved to the effect that it shows a lower power demand. This applies notably at lower speeds, while in the high speed range the curves are nearer to each other.
In the case graphically addressed in Figure 12, η p r o p and k f l a p were intentionally selected such that both vehicle types have about the same minimum power level. For this η p r o p and k f l a p scenario, the differences in the power characteristics between flapping and fixed wing vehicles becomes particularly apparent, yielding a lower power demand for fixed wing vehicles at low speed and lower power demand for flapping wing vehicles at high speed.
The propeller efficiency values applied in Figure 10, Figure 11 and Figure 12 are supposed to be constant. This implies a corresponding adaptation of the propeller-blade pitch angle to the speed (e.g., according to the characteristic presented in Figure 6). In the case that the propeller-blade pitch angle is constant, the required power of the fixed wing vehicle increases relative to the power curve involving constant propeller efficiency. This effect is schematically indicated in Figure 12, using a dotted line for addressing the constant propeller-blade pitch angle case. Both the dotted and solid power curves coincide at the point where the propeller efficiency values agree.
An important aspect of the required power is the flight condition that shows the minimum power sufficient for the vehicle to stay aloft. Using Equations (31) and (33), the following relation is obtained
P ¯ f l , min P ¯ f i x , min = η p r o p   ( k f l a p k ) 3 / 4
Examining this relation yields results graphically presented in Figure 13. There are two regions, one of which shows that flapping wing vehicles require lower power for level flight while in the other region fixed wing vehicles are superior. The dividing line of the two regions is given by
η p r o p =   (   k / k f l a p ) 3 / 4
At low induced drag factors k f l a p , flapping wing vehicles show a high aerodynamic efficiency so that they achieve a correspondingly high level of overall performance. Thus, fixed wing vehicles need to have a high propeller efficiency in order to yield a comparable flight performance. An increase of k f l a p leads to a reduction in the performance of flapping wing vehicles, more pronounced in the initial part of the curve depicted in Figure 13 compared with the remaining part. As regards fixed wing vehicles, they have a comparable performance for propeller efficiencies showing a correspondingly reduced level.

6. Conclusions

Comparing flapping and fixed wing vehicles, it is shown that there are two effects which have a decisive influence on the power requirements, specific for each vehicle type. For flapping wing vehicles, there is an increase in the drag that yields a negative effect on their flight performance. The drag increase, which is not existent with fixed wing vehicles, is due to an increase in the induced drag caused by flapping. For fixed wing vehicles, the propeller efficiency plays a major role. Experience with propeller efficiencies shows that these are lower for small sized vehicles. As a result, there is a tendency such that fixed wing vehicles show a power requirement advantage in the case of larger size vehicles and flapping wing vehicles in the case of smaller size ones.

Conflicts of Interest

The author declares no conflict of interest.

Nomenclature

b wing span
C D drag coefficient
C L lift coefficient
D drag
g acceleration due to gravity
k , k f l a p lift dependent drag factor
L lift
m mass
P power
S reference area
t time
V speed
V * minimum-drag speed
V ¯ non-dimensional speed, V ¯ = V / V *
Α aspect ratio, Α = b 2 / S
ν tilt angle of lift vector
η p r o p propeller efficiency
ρ air density

References

  1. Muller, T.J.; DeLaurier, J.D. An overview of micro air vehicle aerodynamics. In Fixed and Flapping Wing Aerodynamics for Micro Air Vehicle Applications; Mueller, T.J., Ed.; American Institute of Aeronautics and Astronautics: Reston, VA, USA, 2001; Volume 195. [Google Scholar]
  2. Shyy, W.; Aono, H.; Chimakurthi, S.K.; Trizila, P.; Kang, C.-K.; Cesnik, C.E.S.; Liu, H. Recent progress in flapping wing aerodynamics and aeroelasticity. Prog. Aerosp. Sci. 2010, 46, 284–327. [Google Scholar] [CrossRef]
  3. DeLaurier, J.D. The development and testing of a full-scale piloted ornithopter. Can. Aeronaut. Space J. 1999, 45, 72–82. [Google Scholar]
  4. Brüning, G.; Hafer, X.; Sachs, G. Flugleistungen, 4th ed.; Springer: Berlin/Heidelberg, Germany, 2006. [Google Scholar]
  5. Anderson, J.M.; Streitlien, K.; Barrett, D.S.; Triantafyllou, M.S. Oscillating foils of high propulsive efficiency. J. Fluid Mech. 1998, 360, 41–72. [Google Scholar] [CrossRef]
  6. Paranjape, A.A.; Chung, S.-J.; Hilton, H.H. Optimizing the forces and propulsive efficiency in bird-scale flapping flight. In Proceedings of the AIAA Atmospheric Flight Mechanics Conference, Boston, MA, USA, 19–22 August 2013; p. 4916.
  7. Pesavento, U.; Wang, Z.J. Flapping wing flight can save aerodynamic power compared to steady flight. Phys. Rev. Lett. 2009, 103, 118102. [Google Scholar] [CrossRef] [PubMed]
  8. Mazaheri, K.; Ebrahimi, A.; Karimian, S. Performance analysis of a flapping-wing vehicle based on experimental aerodynamic data. J. Aerosp. Eng. 2012, 25, 45–50. [Google Scholar] [CrossRef]
  9. Wang, Z.J. Aerodynamic efficiency of flapping flight: Analysis of a two-stroke model. J. Exp. Biol. 2008, 211, 234–238. [Google Scholar] [CrossRef] [PubMed]
  10. Hall, K.C.; Hall, S.R. Minimum induced power requirements for flapping flight. J. Fluid Mech. 1996, 323, 285–315. [Google Scholar] [CrossRef]
  11. Lentink, D.; Dickinson, M.H. Biofluiddynamic scaling of flapping, spinning and translating fins and wings. J. Exp. Biol. 2009, 212, 2691–2704. [Google Scholar] [CrossRef] [PubMed]
  12. Lentink, D. Exploring the Biofluiddynamics of Swimming and Flight. Ph.D. Thesis, Wageningen University, Wageningen, The Netherlands, September 2008. [Google Scholar]
  13. Heerenbrink, M.K.; Johansson, L.C.; Hedenström, A. Power of the wingbeat: Modelling the effects of flapping wings in vertebrate flight. Proc. R. Soc. A 2015, 471, 20140952. [Google Scholar] [CrossRef] [PubMed]
  14. Sachs, G. Aerodynamic cost of flapping. J. Bionic Eng. 2015, 12, 61–69. [Google Scholar] [CrossRef]
  15. Sachs, G. New model of flap-gliding flight. J. Theor. Biol. 2015, 377, 110–116. [Google Scholar] [CrossRef] [PubMed]
  16. Sane, S.P.; Dickinson, M.H. The control of flight force by a flapping wing: Lift and drag production. J. Exp. Biol. 2001, 204, 2607–2626. [Google Scholar] [PubMed]
  17. Heuser, H. Lehrbuch der Analysis, Teil 1, 8th ed.; B.G. Teubner: Stuttgart, Germany, 1990. [Google Scholar]
  18. Pennycuick, C.J. Modelling the Flying Bird; Elsevier Ltd.: Oxford, UK, 2008. [Google Scholar]
  19. Tobalske, B.W. Biomechanics and physiology of gait selection in flying birds. Physiol. Biochem. Zool. 2000, 73, 736–750. [Google Scholar] [CrossRef] [PubMed]
  20. Cvrlje, T.; Breitsamter, C.; Weishäupl, C.; Laschka, B. Euler and Navier-Stokes simulations of two-stage hypersonic vehicle longitudinal motions. J. Spacecr. Rocket. 2002, 37, 242–251. [Google Scholar] [CrossRef]
  21. Jiang, L.; Moelyadi, M.A.; Breitsamter, C. Aerodynamic Investigations on the Unsteady Stage Separation of a TSTO Space Transport System; Forschungsbericht FLM-2003/34; Lehrstuhl für Fluidmechanik, Abteilung Aerodynamik, Technische Universität München: München, Germany, 2003. [Google Scholar]
  22. Cvrlje, T. Instationäre Aerodynamik des Separationsvorgangs zwischen Träger und Orbiter. Ph.D. Thesis, Technische Universität München, München, Germany, 2001. [Google Scholar]
  23. Herzog, K. Anatomie und Flugbiologie der Vögel; Gustav Fischer Verlag: Stuttgart, Germany, 1968. [Google Scholar]
  24. McCormick, B.W. Aerodynamics, Aeronautics, and Flight Mechanics; Wiley: Hoboken, NY, USA, 1979. [Google Scholar]
  25. Hepperle, M. Auslegung eines Propellers für Ultraleicht-Flugzeuge. Available online: http://www.mh-aerotools.de/company/paper_2/ulprop.htm (accessed on 7 June 2016).
  26. Deters, R.W.; Ananda, G.K.; Selig, M.S. Reynolds number effects on the performance of small-scale propellers. In Proceedings of the 32nd AIAA Applied Aerodynamics Conference, Atlanta, GA, USA, 16–20 June 2014; pp. 2014–2151.
Figure 1. Components of lift vector acting in vertical direction.
Aerospace 03 00031 g001
Figure 2. Wing geometry and generated mesh. (a) Wing planform and wing profile at zero flapping angle; (b) Wing at 45.0° flapping angle.
Aerospace 03 00031 g002
Figure 3. Lift coefficient acting in vertical direction dependent on angle of attack.
Aerospace 03 00031 g003
Figure 4. Drag polar showing relation between drag coefficient and lift coefficient acting in vertical direction.
Aerospace 03 00031 g004
Figure 5. Time history of lift coefficient during wing stroke.
Aerospace 03 00031 g005
Figure 6. Propeller efficiency for a light aircraft (reproduced from [24], Piper Cherokee Arrow PA-28R).
Aerospace 03 00031 g006
Figure 7. Propeller efficiency for an ultralight vehicle (reproduced in part from [25]).
Aerospace 03 00031 g007
Figure 8. Propeller efficiency of a small-scale propeller (reproduced in part from [26], propeller diameter: 0.2286 m).
Aerospace 03 00031 g008
Figure 9. Propeller efficiency of a small-scale propeller (reproduced in part from [26], propeller diameter: 0.2286 m).
Aerospace 03 00031 g009
Figure 10. Power required in level flight ( k f l a p = 1.5 , η p r o p = 0.5 ).
Aerospace 03 00031 g010
Figure 11. Power required in level flight ( k f l a p = 2.5 , η p r o p = 0.9 ).
Aerospace 03 00031 g011
Figure 12. Power required in level flight ( k f l a p = 2.5 , η p r o p = 0.5 ).
Aerospace 03 00031 g012
Figure 13. Regions of superiority of flapping and fixed wing vehicles.
Aerospace 03 00031 g013