1. Introduction
Network representation of complex systems that arise in social sciences, biology, neuroscience, or finance is widely used to analyze the statistical properties of systems. Besides these properties, since agents in the nonlinear relationship have heterogeneous interaction levels, their structural complexities can also be determined in these network representations. Structural changes of any physical or abstract system under stress conditions can be observed in the granular particles of the system. For this reason, the granulation of complex systems is also a very important task to be completed [
1,
2,
3]. From a mathematical perspective, the granular structure of a complex system modeled by a network coincides with clusters formed by system agents. When the network vertices denote the agents of the system, the cluster of the vertices is called a community graph. In addition to this general definition, no agreement has been reached on a common mathematical definition [
4,
5]. Although there are various community identifications and community detection algorithms, combining meaningful mathematical community definitions with computational effective methods still remains a challenge.
Cluster problems that arise in subjects such as statistical data analysis, pattern recognition, and machine learning are generally defined on continuous metric spaces. Voronoi diagram partition, which is frequently used in computational geometry studies, is a method that determines the set of points closest to certain seeding points of a continuous metric space. For example, the sets of points closest in terms of Euclidean distance to the points taken in a Euclidean space form a Voronoi diagram of this space. Moreover, seeding points and triangles emerging from the adjacency relation of Voronoi cells constitute the Delaunay triangulation of the underlying metric space [
6,
7,
8,
9]. Network models, represented by mathematically simple directed/undirected graphs, together with the graph distance, form a discrete metric space. In determining Voronoi diagrams for this type of metric space, sets of points with minimum graph distances to seeding points are taken into account [
10,
11,
12]. In this study, we present an approach based on the Voronoi diagram used on discrete metric spaces for vertex clusters, which represent the granular structure of a network. This type of simple geometric approach provides reliable results at low computational complexity.
Financial complex systems are structures of agents in dense and nonhomogeneous relations at many levels. The complex systems that we consider in our study are stock markets. With correlation distances between time series of the daily closing prices corresponding to companies traded on the stock market, a weighted network model of the markets can be obtained. However, due to the intense relationship of agents in financial systems, the use of complete graphs to represent this type of network causes the loss of information on network topology and geometry. Various filtering methods are presented in the literature to overcome this type of problem [
13,
14,
15,
16,
17]. Filtration methods are based on the principle of preserving strong network connections and removing weak connections from the topology. Since the resulting filtration is chordal, i.e., a filtration that preserves discrete geometry, we use the Triangulate Maximally Filtering Graph approach presented in [
16] in order to filter networks.
Two major problems arise when determining clusters of financial networks with Voronoi diagrams. The first problem is determining a meaningful length of edges in the discrete metric space where the network is embedded. Since the correlation distance of the time series of agents is non-negative, it represents a solution for this type of problem. The second problem is determining the seeding points of the Voronoi diagrams. In order to solve this problem, the weighted and unweighted topologies of the filtered network should be considered separately, and seeding points should be selected based on the highest local correlation coefficient. At the same time, this selection is made in a controlled manner so that the granular structure of the network does not differ much. For this reason, each of the Voronoi cells is called coarse granules, and such Voronoi partition is called coarse granulation.
Changes in the granular structure of financial systems take place during periods of economic crisis. This type of structural change can be observed together with the change in the geometry of granules. In this study, we use a discrete analogous Haantjes curvature of a curve in a metric space to capture such geometric changes. To examine these changes in the geometry of the coarse granule structures, we looked at the discrete Haantjes curvatures of the paths that are furthest from the seeding locations of the Voronoi cells. During crisis situations, we detected significant changes for Borsa Istanbul, London Stock Exchange, and NASDAQ. The averages of discrete Haantjes curvatures were used to encode such changes. Overall, the method presented in this study can serve as a strong indicator of a financial network.
The rest of the paper is organized as follows.
Section 2 presents details on the coarse graining method based on Voronoi diagrams. Moreover, it features the definition of the Haantjes curvature and the selection of paths.
Section 3 reports detailed results on the topologies of a granular structure within stock markets throughout an economic crisis period. We considered three differently sized stock markets and different lengths of crisis periods. The resulting Haantjes curvatures across economic crises are also presented. Finally,
Section 4 discusses empirical results and presents concluding remarks.
2. Methodology
Complex and dynamic interacting systems can be studied by using graph theory principles. According to the literature, the terms “graphs” and “networks” are used indistinctly. Graphs are discrete mathematical concepts that can be expressed via tuples such that . In this expression, stands for the set of vertices, and stands for the set of edges. From a mathematical point of view, for ,. If is unordered, then is called an “undirected graph”. Generally speaking, the term network is used for graphs that represent real-world objects where vertices are agents of the system and edges indicate the relationship between agents. Besides, in terms of different levels of heterogeneity regarding the intensity of connections, complex networks are usually expressed with a triple , where . Such triple is called an edge-weighted graph and ω is the weight function.
In the construction of complex network models, the presence or absence of edges between the vertices to which agents are assigned can be derived from a direct definition and, in some network models, this situation is uncertain. For example: in movie actor networks, if two actors played in the same movie, an edge is created between them [
18]; if two servers are connected on a web page in WWW networks, an edge is created between them [
19]; in semantic networks, if the dictionary contains the same meaning, an edge is created between two distinct words [
20]. In networks where agents are expressed by a time series, however, it is not always clear how to determine the details of the network topology. In such networks, an edge between vertices is determined by the Pearson correlations of the respective time series [
21,
22,
23].
The most common example for networks where edges are determined by the Pearson correlation is represented by financial networks. In such networks where agents are stocks, companies, banks, and exchange rates, each agent can be expressed in a time series according to the daily price. Compared to other correlation networks, financial networks establish very dense relationships. In order to model such a dense relationship, complete graph models with an edge assigned between all vertices are used. Let us consider the logarithmic return of the daily closure price
of the stock
at time
as
Then, the Pearson correlation of the stocks
i and
j
leads a correlation distance function
A stock market can be modeled by a weighted complete graph
, where
V is the set of stocks operating on the market and
. Since
, 0 ≤
(
i,
j) ≤ 2. Although the complete graph model includes all relationships, it also comprises the weights close to 2, so it is difficult to determine the local and global topological properties of the network structure. Various filtering techniques are presented in the literature to overcome this problem. In the seminal paper of [
24], Minimum Spanning Trees (MST) are used to determine the hierarchical structure of financial networks. Such filtering encodes the subdominant ultra-metric structures of financial networks. MST filtration is a method that can be used to extract a spanning tree from the correlation distance matrix. Similarly, another filtration method based on the correlation distance matrix but including more edges than MST is proposed in [
25]. Planar Maximally Filtering Graph (PMFG) is a method that adds edges to the MST filtration by embedding the graph on a manifold with genus
g and by maintaining the filtered topology as planar. Although the PMFG filtering technique elicits more effective results via cluster analysis than the MST technique, it ignores the underlying network geometry. This situation causes the network to be embedded only in spherical, toric, and handled-toric manifolds and, hence, the information about the hyperbolic geometry of financial networks is reduced. Therefore, in this study, we use the Triangulated Maximally Filtered Graph (TMFG) [
16] method in order to filter the weighted complete graph
.
TMFG is a filtering of a network that allows the resulting graph to be chordal. Besides, TMFG has better computational complexity than PMFG filtering. Moreover, in the case of financial networks, TMFG keeps the underlying geometry of financial agents by allowing chordal property, since zero-mean stationary time series can be embedded in a Hilbert space with an inner product (considering the Pearson correlation coefficient) [
26]. The definition of
indicates that values closer to 0 show strong negative or positive correlations. Hence, in order to construct a TMFG filtration, we determined the graph distance matrix with entities of
, where the values closer to 2 show strong negative or positive correlations.
In network theory, a measure of the degree to which network vertices tend to cluster together is called the clustering coefficient. This measure can be considered global or local. The local clustering coefficient of a vertex in a network is the fraction of triangles that actually exist over all possible triangles in its neighborhood and an indication of the embeddedness of single vertices [
27,
28]. A network modeled by the complete graph
derived from a correlation matrix tends to have
many triangles. A correlation between the vertices
and
and a correlation between the vertices
and
trigger a correlation between
and
, since there are edges assigned between each of the vertices. Hence, there is no correlation coefficient in this network. Now, let us assume that the TMFG filtration of
is
. In this case, a correlation between the vertices
and
and one between
and
results in a correlation between
and
even
. This property raises the clustering coefficient on
.
Most studies on clustering coefficients assume the non-negativity of weights. Since we use the correlation distance function as the weight function, we employed the local clustering coefficient in this study as
where
denotes the degree of the vertex
and
stands for the graph region of interest [
29,
30].
Granulation and granular computing for complex systems have become subject to many research studies recently. The denotation of granulation and relation among granular structures is the main aspect of granular computing. Granular computing can be performed by using partition, coverage, and neighboring. In the context of the financial system, such granulation can be considered as the covering partition of network vertices in dense relations and can be achieved by using non-overlapping graph communities. However, in order to perform geometric structural computations, graph communities may need to include strong restrictions. For instance, in [
26], the authors briefly showed that geodetic convex boundary curvatures of graph communities vary throughout an economic crisis. The approach in [
26] is focused on the embedding of actors to the metric space endowed by correlation distance. However, the approach entailed a restriction, namely that paths be geodetic. In the present study, we propose a spatial clustering regarding the network geometry by using weighted Voronoi regions, which eliminates topological restrictions on paths.
Voronoi diagrams are classic computational geometric data structures that partition the plane into convex polygons. Each polygon contains exactly one generating point and every point in a given polygon is closer to its generating point than to any other point. Given a particular subset of agents in the financial network, we aim to determine which vertices of the network are most likely affected by changes throughout an economic crisis. Let
be a weighted graph distance on
and
. We call the cluster
where
, the weighted network Voronoi region associated with
. Moreover, we consider
to be coarse graining of
. VDG addresses the question of how the granular geometry of a network changes throughout an economic crisis by decomposing the network into regions of influence of central vertices. This approach also gives additional insights into the functional relationships existing in the network.
In the method of determining the granular structure of the graph GT, the local clustering value defined in Equation (4) is used to determine the central vertices, namely seeds of the VDG. In other words,
is a seeding of VDG if
, where
and
. However, in this case, a problem arises concerning the number of seeding points that need to be chosen. Of course, the number of seeding points determines the cardinality of VDG. To overcome this problem, one can consider the VDG cardinality to be constant for each filtering. However, such an approach would be ineffective due to large changes in
Ci values. At this point, TMFG appears as a highly effective filtering method not only with the advantage of computational complexity but also for the use of the unweighted topology of the network. Since the network topology of the
is chordal, it contains only 3- and 4-cliques. Let
be the number of 3-cliques on
of
and
be the number of subgraphs with 2 edges and 3 vertices, one of which is
i such that deg(i) = 2. Then, the local clustering coefficient of a vertex
in an unweighted graph is defined as
Hence, the values of all of do not vary significantly; that is, most of the local clustering coefficient values on have certain ratios. Therefore, we choose seedings of VDG as the vertices with the greatest value. Then, amongst them, we eliminate the ones with lower weighted values. It is not always possible to set a sharp lower limit, as the values because this type of elimination varies considerably. For this reason, we call this VDG coarse graining from the standpoint of this study.
In addition to the Ollivier and Forman type Ricci curvatures, which are used quite frequently in the literature [
31,
32,
33,
34,
35,
36,
37,
38,
39,
40,
41], there are also different types of curvatures defined in metric spaces. For example, [
42] defined metric curvature by comparing the ratio between the length of the curve arc and the chord on which it rests [
43]. In the context of general metric spaces, the definition of Haantjes curvature can be presented as follows:
Let
be a metric space. Let
be a curve in
and
,
, and
points on
, with
standing between
and
. Then, the Haantjes curvature of
at
is given by the limit
where
is the length of the arc
and 24 is the normalization coefficient.
Now, let us assume that
is a network endowed with a graph topology. In this case, an arc
turns to be a graph path
in which the initial point is
and the terminal point is
, or vice versa. In the discrete setting, the limiting process has no relevance. Moreover, the normalizing constant 24, which assures that the limit coincides with the conventional concept in the case of smooth planar curves, is unneeded in this instance. Then, the Haantjes curvature of
is defined as
where
is the (weighted) length of the path and
is the graph distance on the network. The details about the Haantjes curvature in a graph setting can be found in [
43].
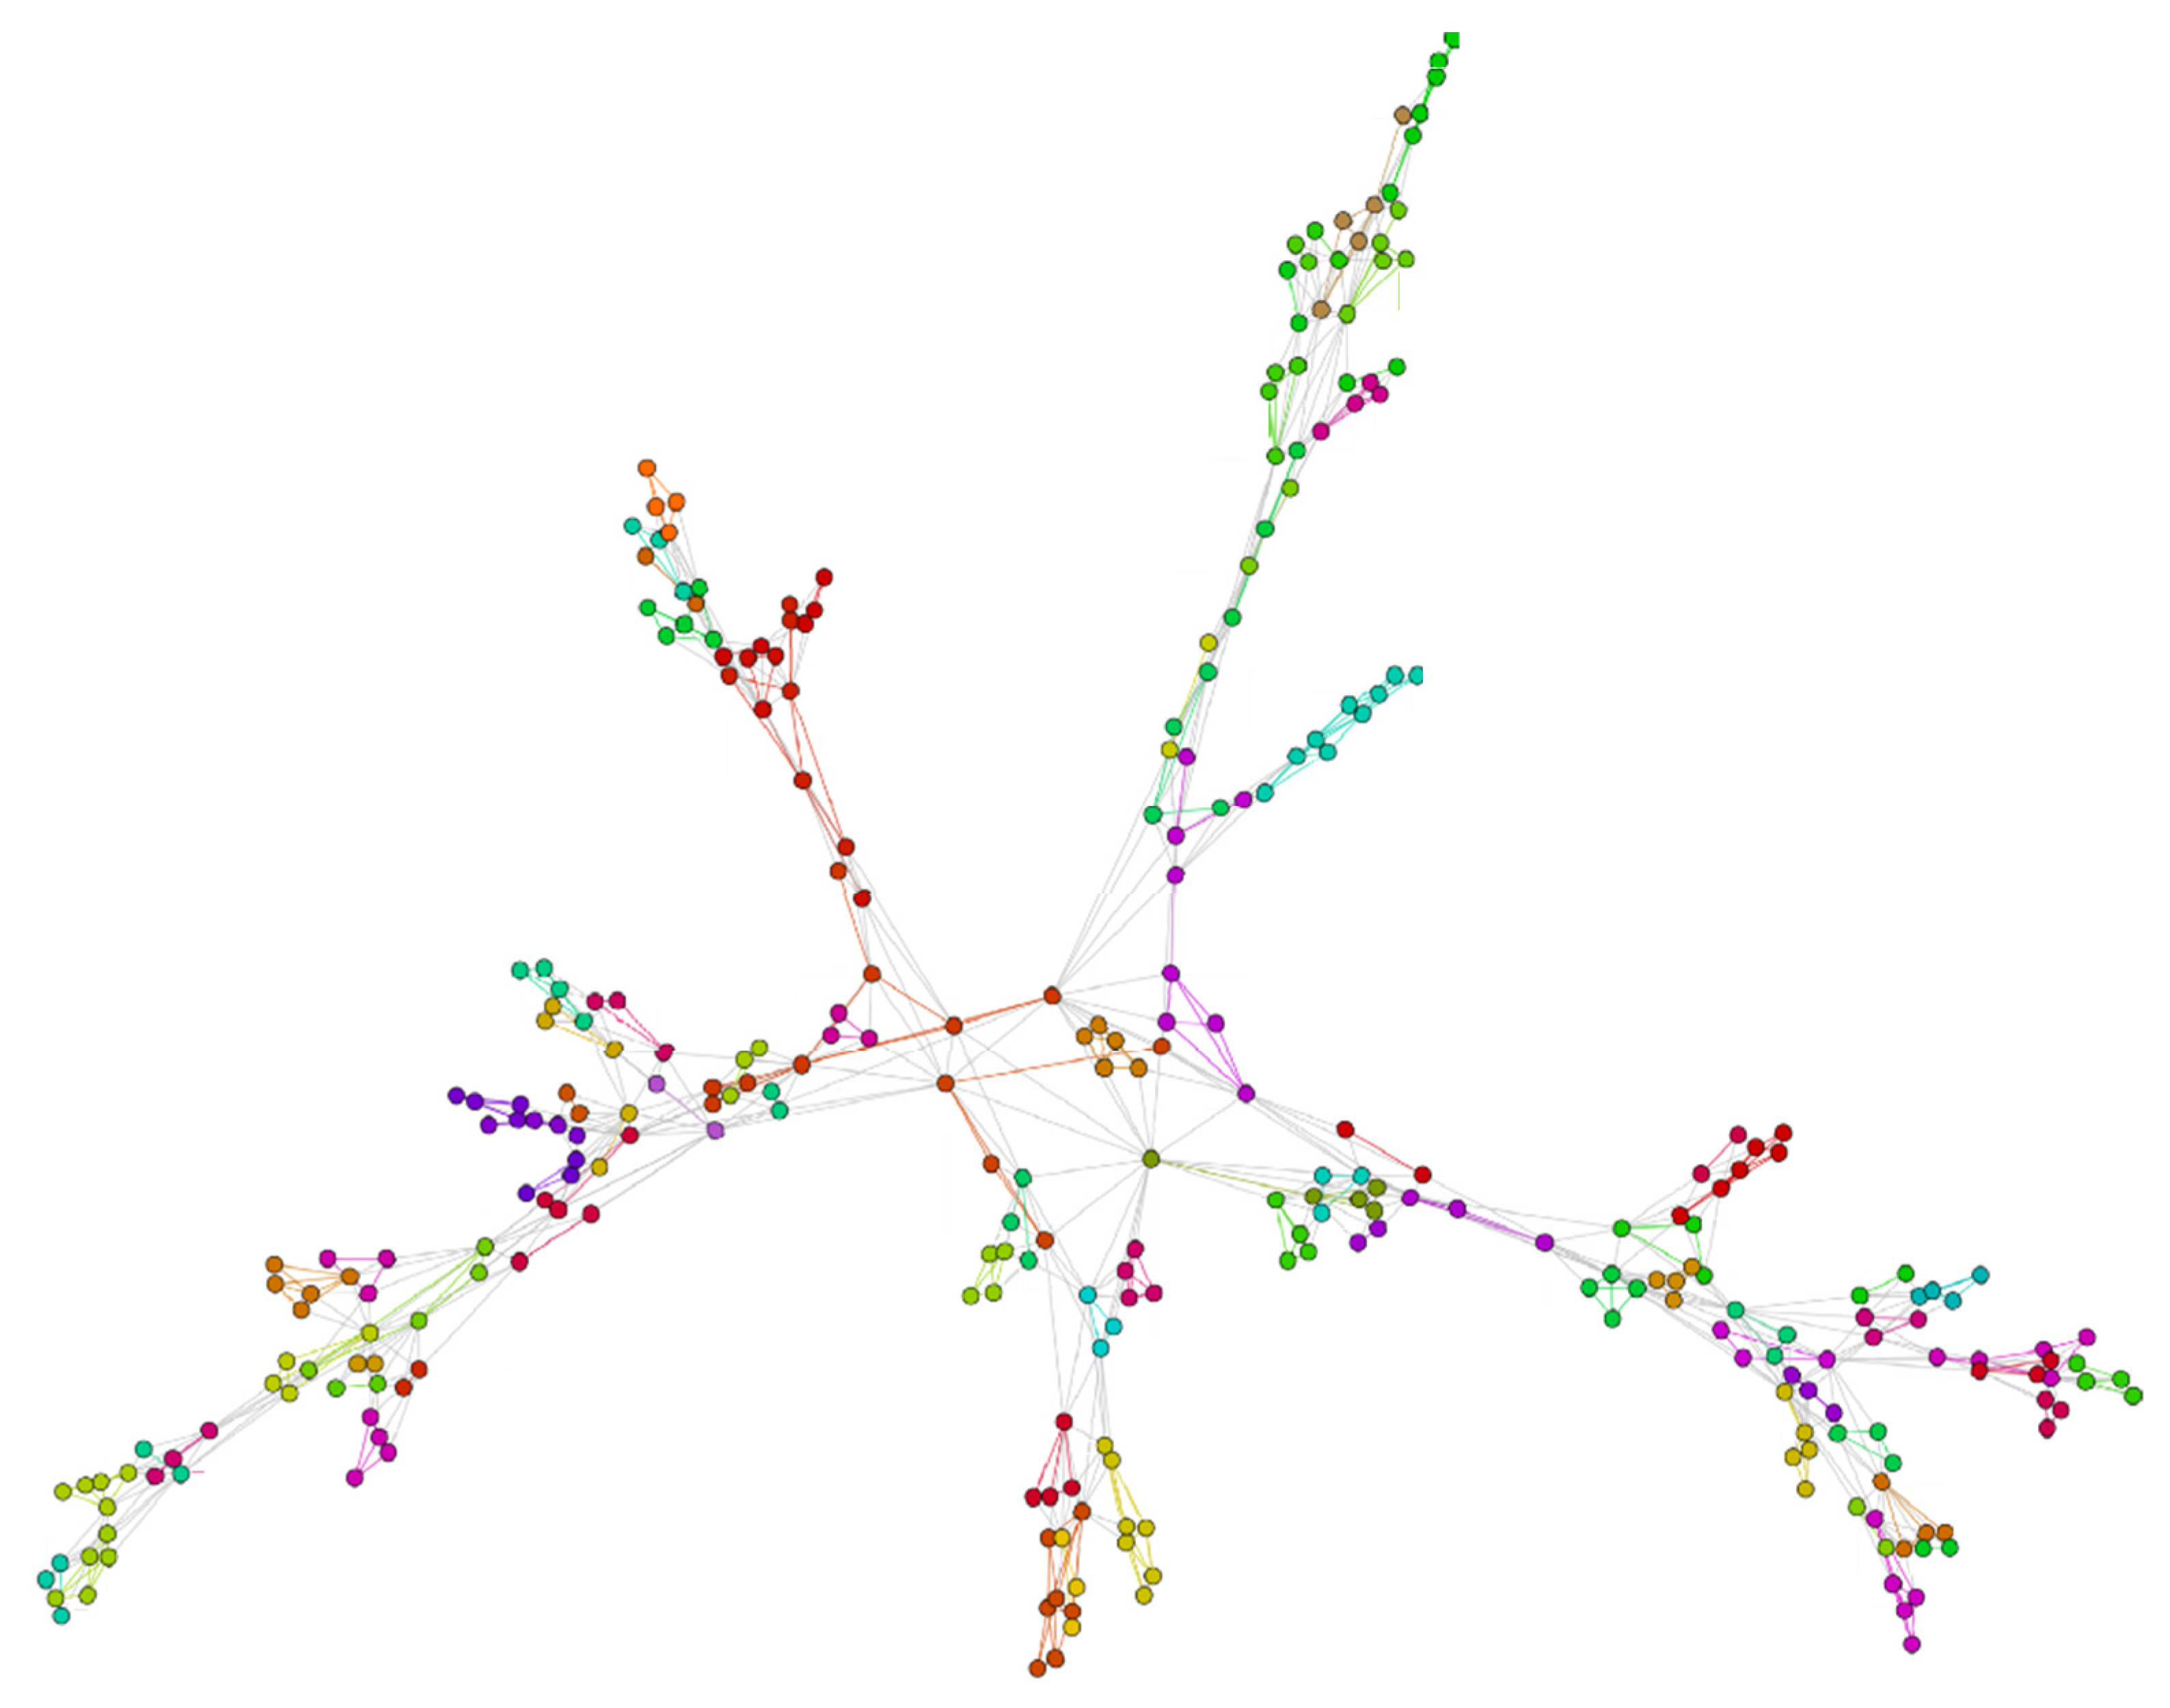
In
Figure 1, we present an example of the VDG partition of a
formed by correlation distance. The filtered weighted graph in this example has a total of 327 vertices and 90 Voronoi cells. When the network in the example is examined, it is seen that locally high degree vertices have a central tendency. However, Voronoi regions do not only occur over those vertices. In addition, the number of vertices in some regions is quite low. It can be said that the curvature calculation will not affect the general average in these regions.
We use a similar curvature definition presented in Equation (8) for subnetworks induced by VDGs of
. Now, let us assume that a subnetwork induced by a VDG of
is
. The selection of paths π in
is important for the geometry of coarse grains. In particular, if the paths
are chosen as the paths furthest away from the center of
, which is the seeding point of VDG, the curvature of these paths encodes information about the compactness of the
and the factors influencing its boundaries. Let
be the seeding vertex of a VDG and
, where
and
.
,
is called the distance of
to
. Since
, we choose maximum whenever we define graph distance. For the set of all possible paths
composed of the paths
that are furthest away from the central vertex,
; and then, the Haantjes curvature reads as
Then, the total coarse boundary curvature of VDG can be computed as
3. Results
In this study, in order to analyze the variations of the coarse graining method and coarse boundary curvatures of each VDG region, we have discussed three different stock market networks and three different economic crises. Agents of each stock market network are selected as companies traded in that market. Each time series must be of equal length in order to define the Pearson correlation of the time series created with logarithmic returns of companies’ daily closing prices. In each time frame, in order to eliminate the effect of the moving window size, each time window is selected to span ten transaction days and to be sampled twice a week.
Stock market indices were selected in order to differ in terms of both the number of agents and the time frame. Hence, we considered the Financial Times Stock Exchange 100 Index or FTSE100 (London Stock Exchange, UK), the Borsa Istanbul Index or BIST (Borsa Istanbul, Turkey), and the Nasdaq-100 Index (NASDAQ, USA). The closing prices of stocks were obtained from the website yahoo.com and they were cross-checked with the data from investing.com for the market indices FTSE100 and Nasdaq-100. The BIST closing stock prices were retrieved from Borsa Istanbul.
The economic crisis period for the FTSE100 market index was represented by the Brexit referendum process, which was voted on 23 June 2016 in order for the UK to leave the European Union. As a result of this referendum, 51.9% of participants opted for the UK to exit the European Union. On 29 March 2017, the UK government initiated the procedure to leave the European Union based on article 50 of the EU Treaty. Hence, in terms of the FTSE100 index, the reference time frame comprises the moment when Brexit was voted until the moment when the UK authorities started the exit procedure.
2018 was a stressful year for the Turkish economy. In August, when the depreciation of the Turkish Lira against the US Dollar was the most dramatic, the European Central Bank expressed its growing concerns about the biggest lenders of the Euro Area. During the same period, US President Donald Trump released various statements concerning the doubling of Turkish steel and aluminum trade tariffs. This period was also characterized by the investment pledges of Qatari authorities and the precautions taken by the Turkish government. As for the BIST index, 2018 was the reference period.
One of the recent major economic downturns was the 2008 economic crisis. In the United States, irresponsible credit practices within the banking system and problems stemming from the housing market have been the catalyst for this crisis. With the bankruptcy of Lehman Brothers, the fourth-largest US investment bank, the 2008 crisis is considered the biggest global downturn after the 1929 Great Depression. In terms of the NASDAQ market index, 2008 was the reference period.
The networks of each stock market index are obtained via the TMFG filtering approach applied to the distance matrix that emerges from distance of the time series. The following measurements are used to evaluate the topological structures of these networks:
Let denote the TMFG filtration of at -th time window.
For
, the characteristic path length is used to evaluate the average maximal path between pairs of vertices and it is defined as:
where
is the number of edges in the longest path between nodes
i and
j. Equation (12) is defined for the
similarly to the measure given in [
44].
The variation in the density of
will be measured by the concept of the mean occupational layer [
45]. Let us consider that the central node
, which has zero level, hence the mean occupational layer can be defined for
as:
where
denotes the level of node
regarding
. For the consistency of our method, we determine the central vertex as the vertex with the highest local clustering coefficient.
Voronoi diagrams are a common way to create cells closest to the elements of a particular set of continuous metric spaces called seeds. The separation of the discrete metric space into VDG regions, like a network structure, corresponds to the detection of graph communities of the network structure. One of the most commonly used methods for determining graph communities is called modularity. In [
46,
47], an efficient modularity index in a network is defined as
where
is the number of clusters, deg(
j) is the degree of a vertex
j in
,
is the number of edges and
is the set of vertices in the
-th cluster.
In the following, we present detailed results on the FTSE100, BIST, and Nasdaq-100 network indices.
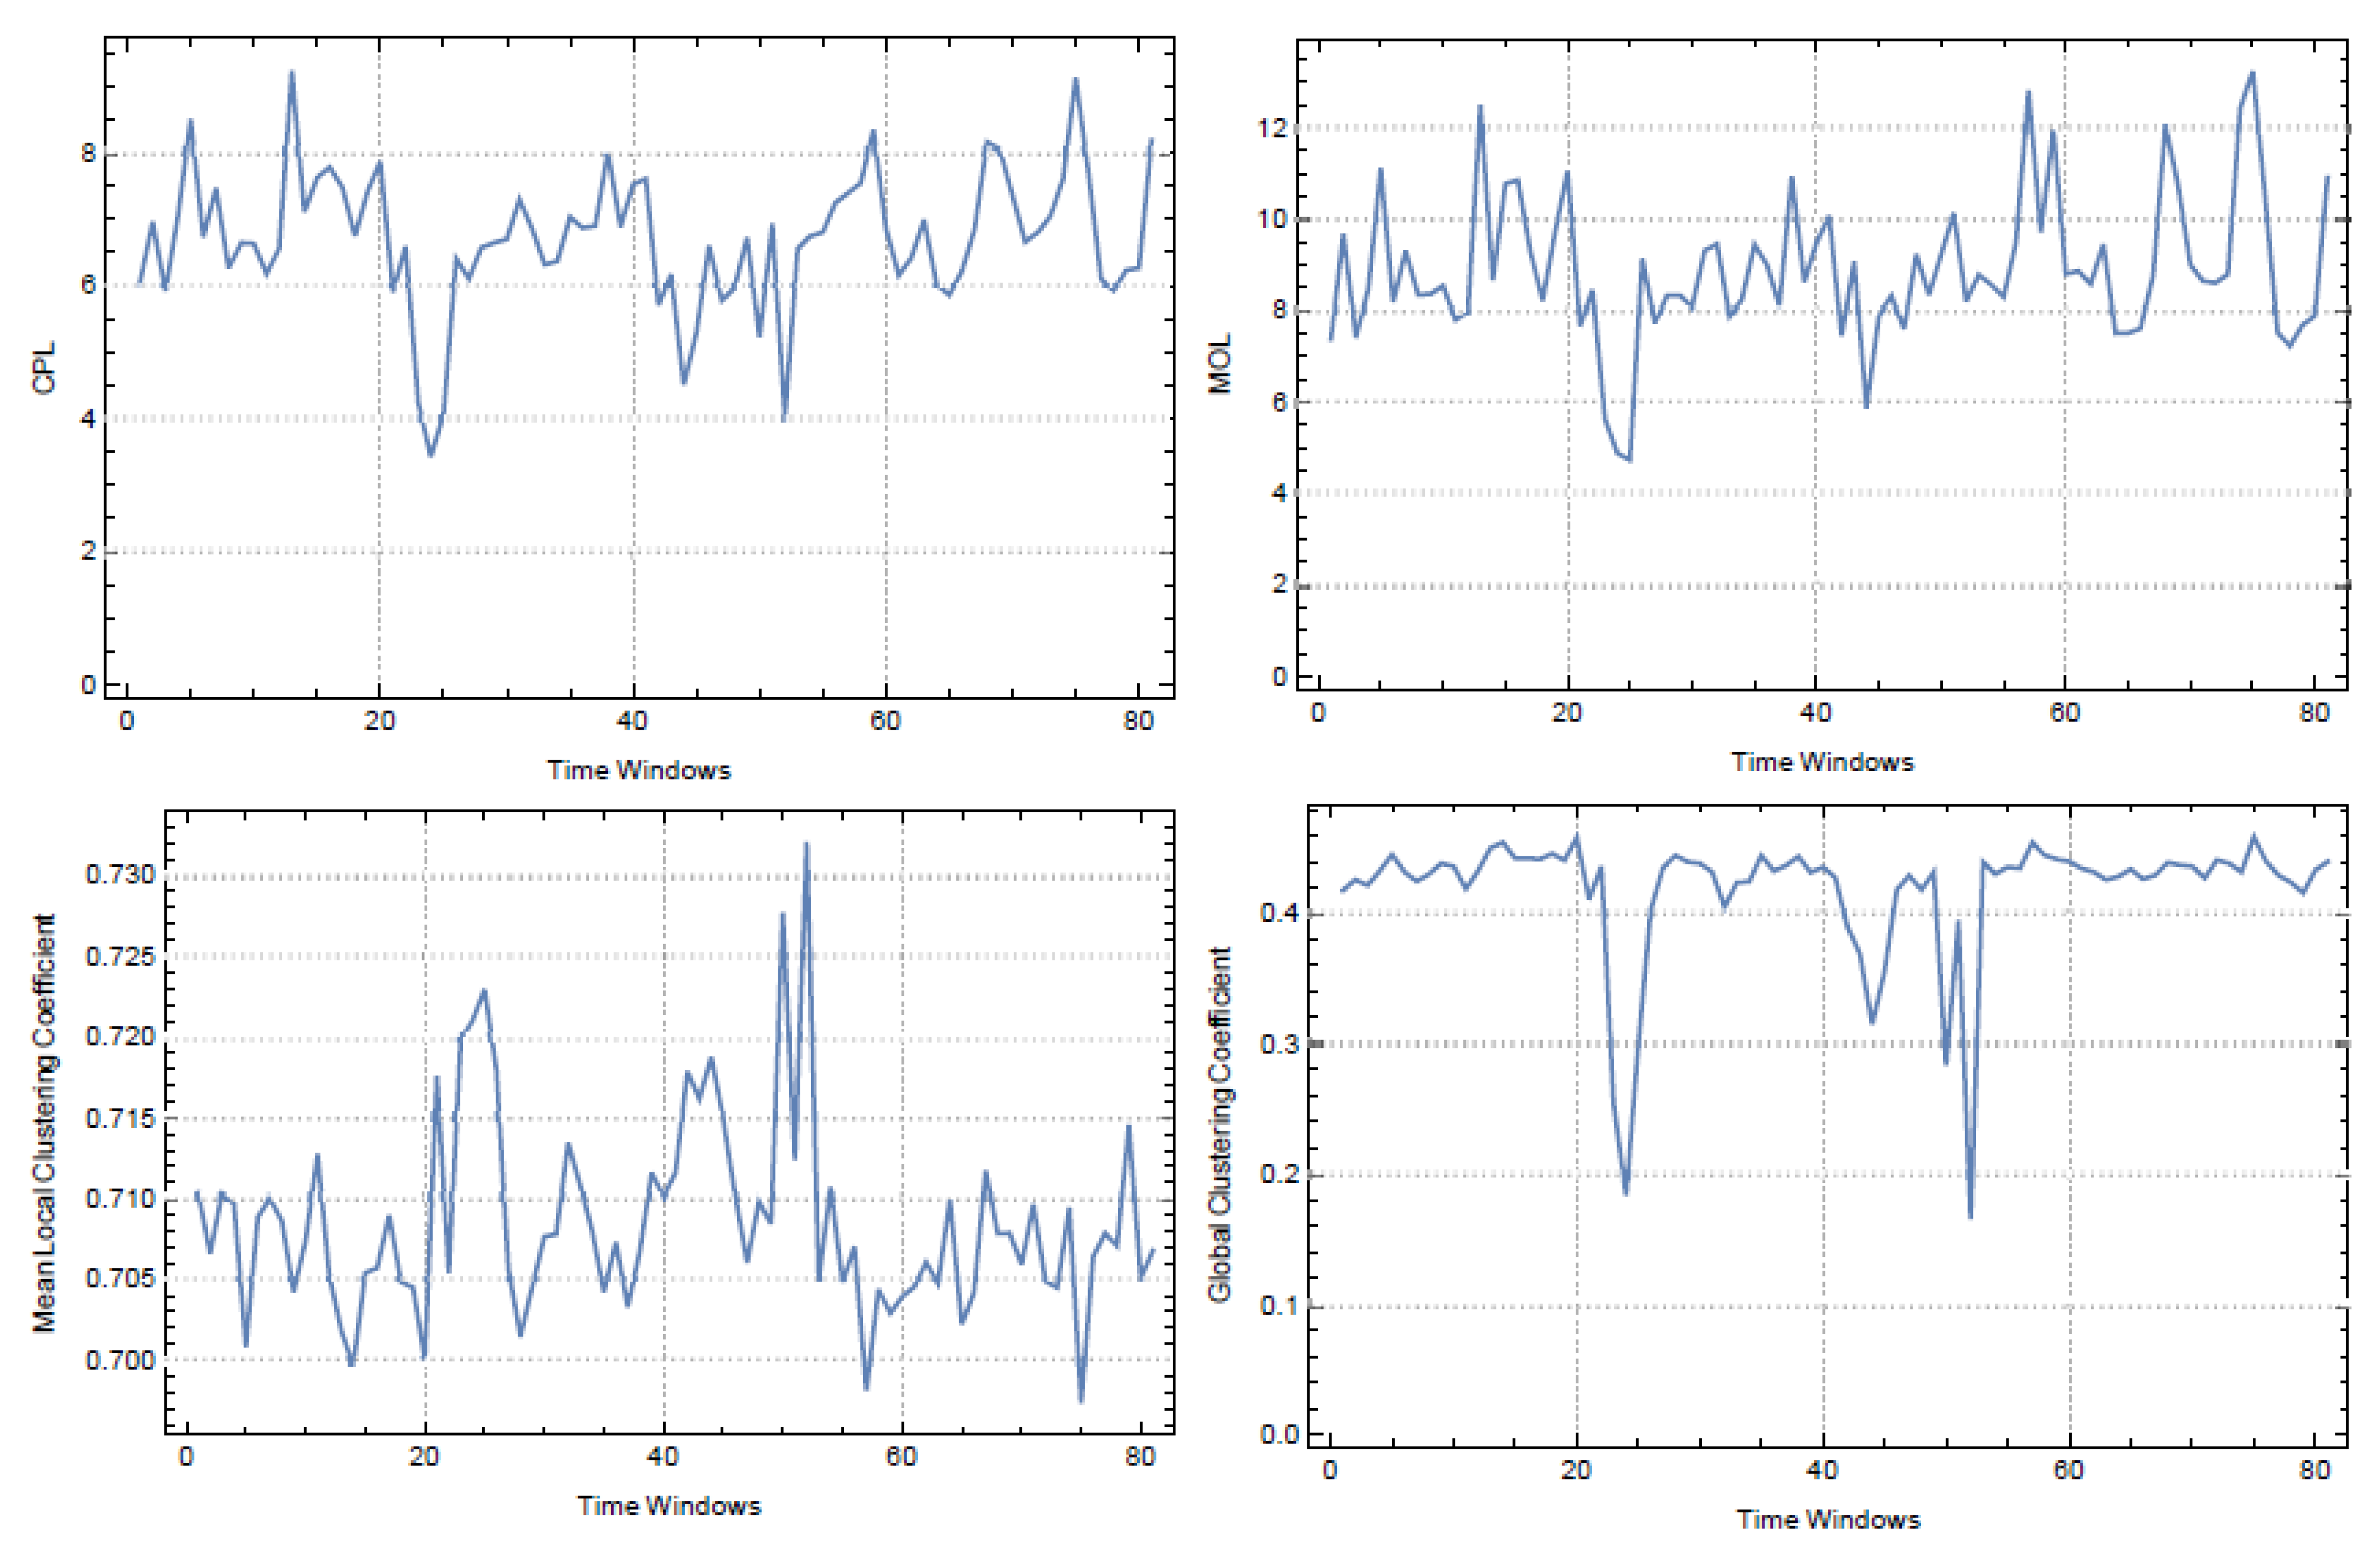
3.1. Results for the FTSE100 Index
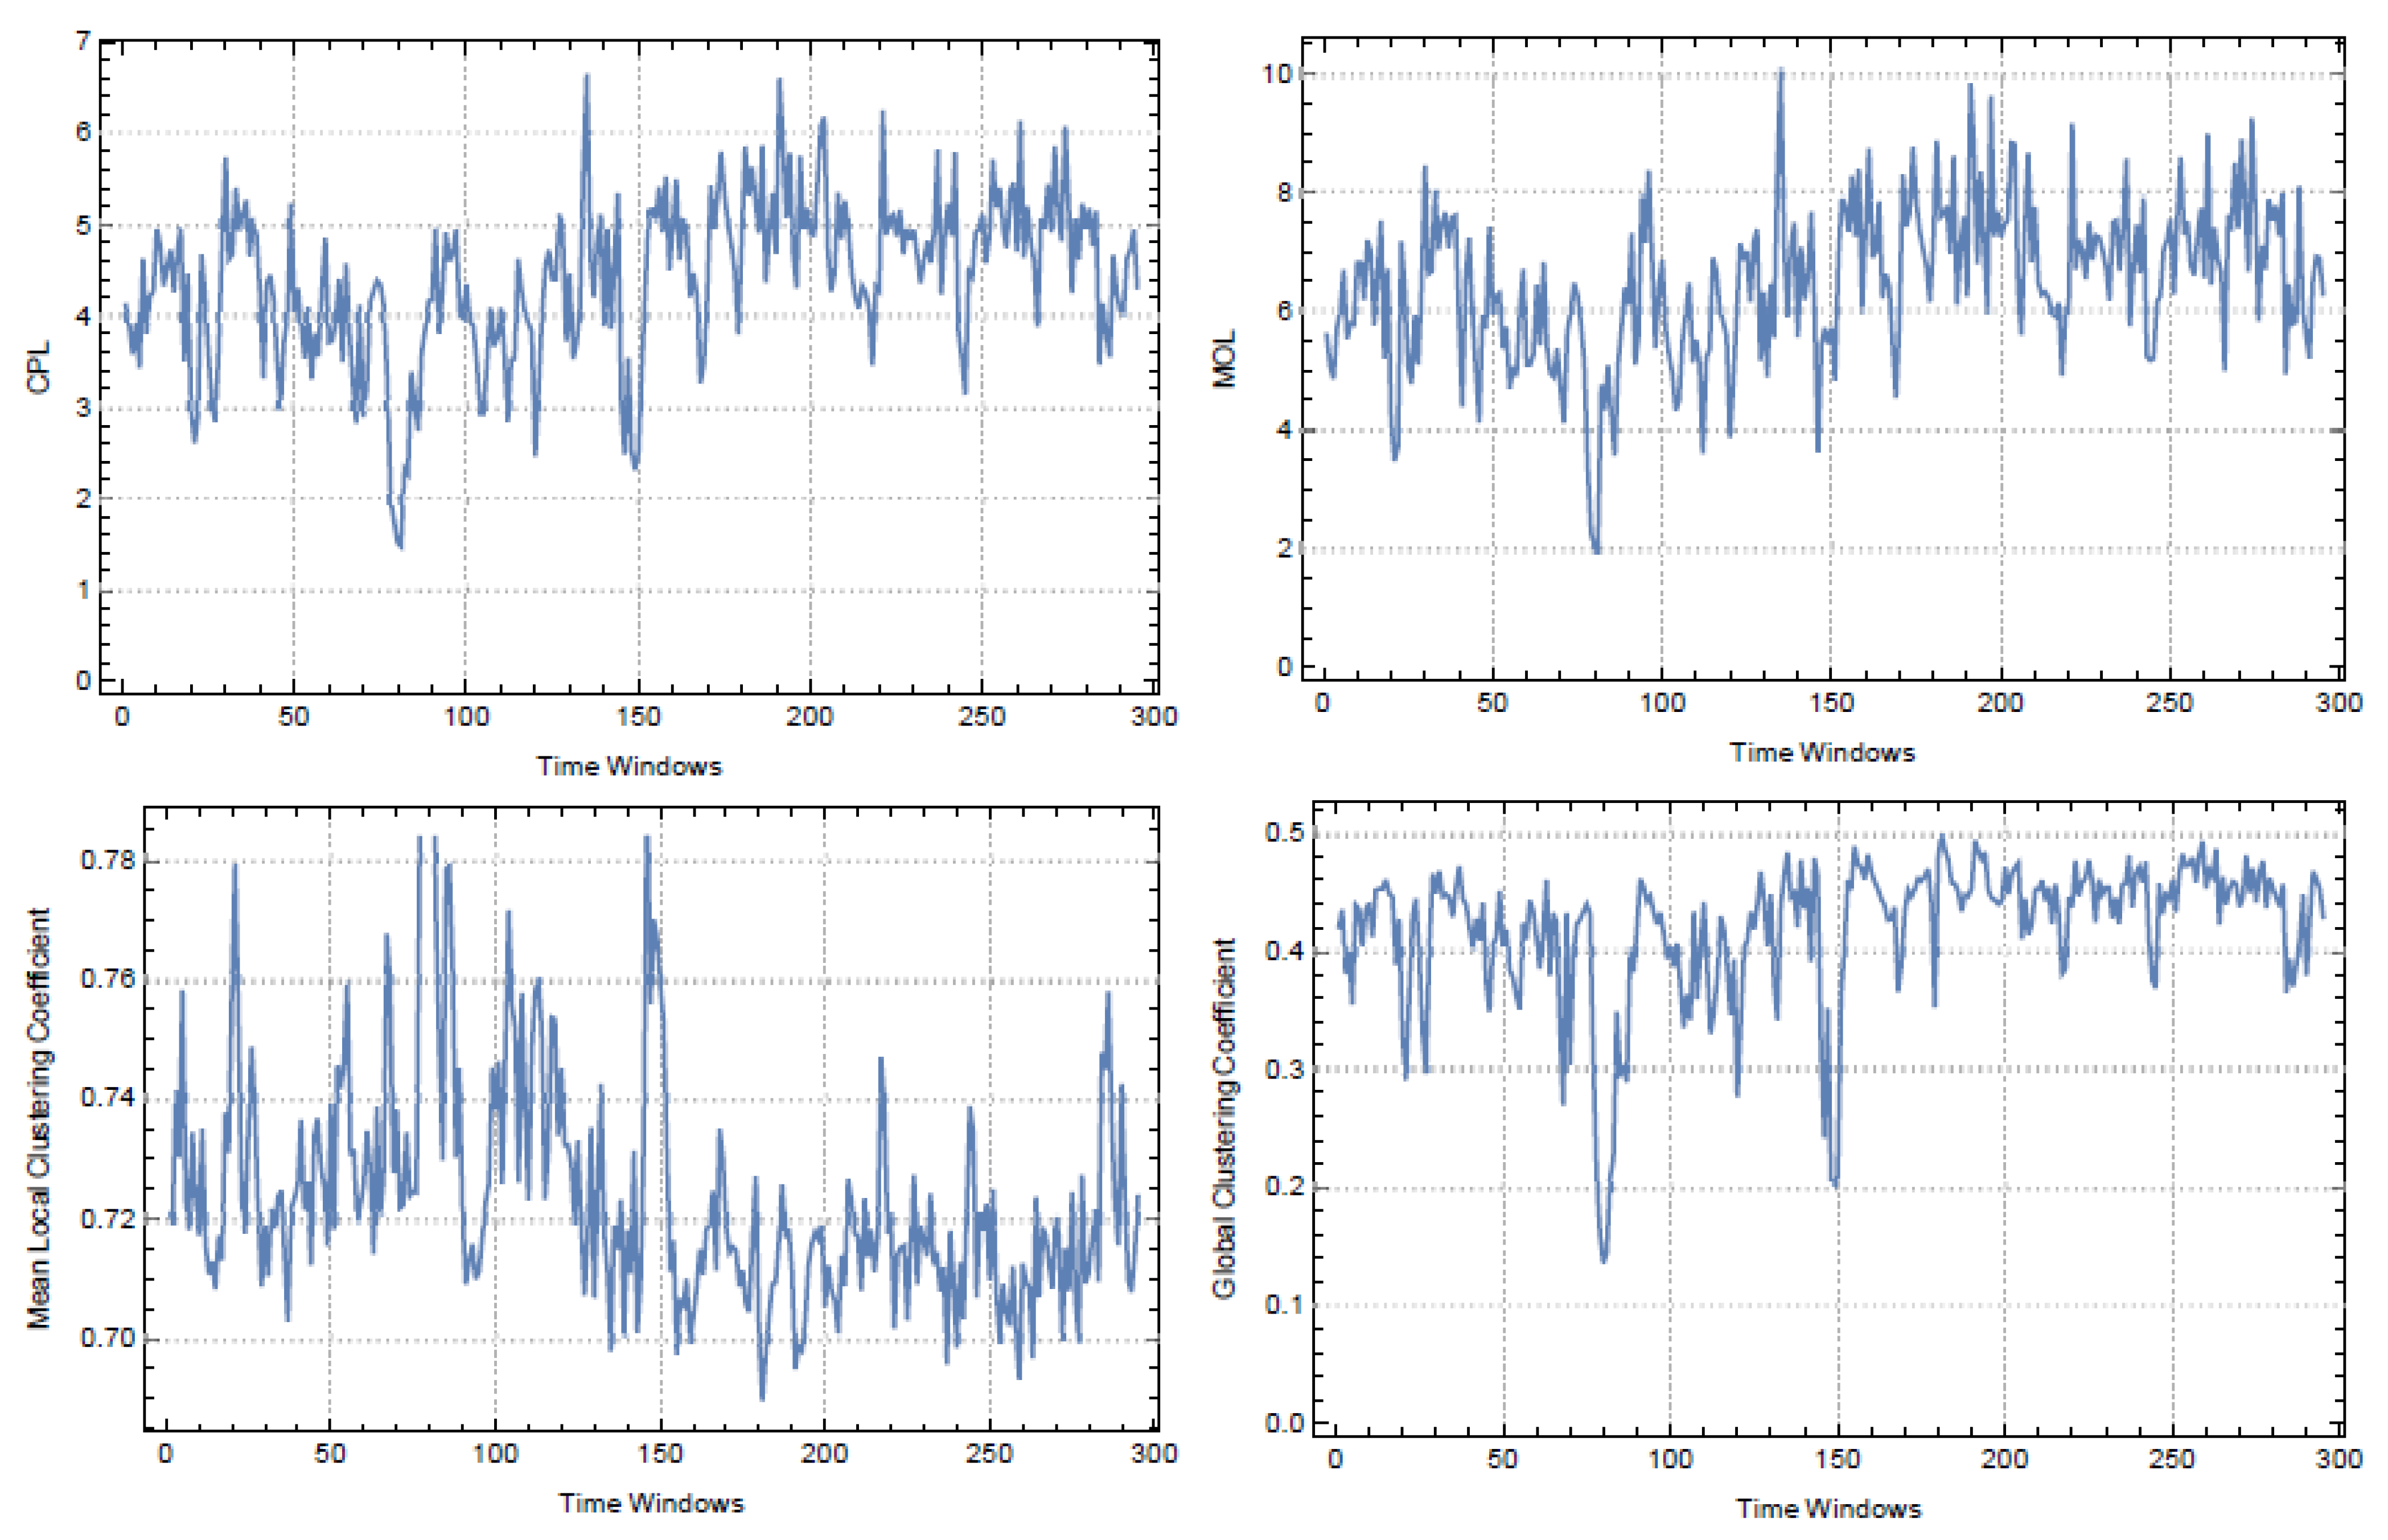
In this study, we evaluated the daily closing prices of stocks comprised in the FTSE100 index from October 2014 to March 2018 and the Brexit Referendum was chosen to be covered in this time frame. In order to define the Pearson correlation of time series, we used 94 stocks with equal time series lengths. Throughout this period, we observed a total of 295 moving windows. For each window, we obtained the TMFG filtration for
graphs. The values of network measures that were given by Equations (4), (12), and (13) and the global clustering coefficient are presented in
Figure 2. For CPL and MOL measures, we used Maximal Spanning Trees of each
.
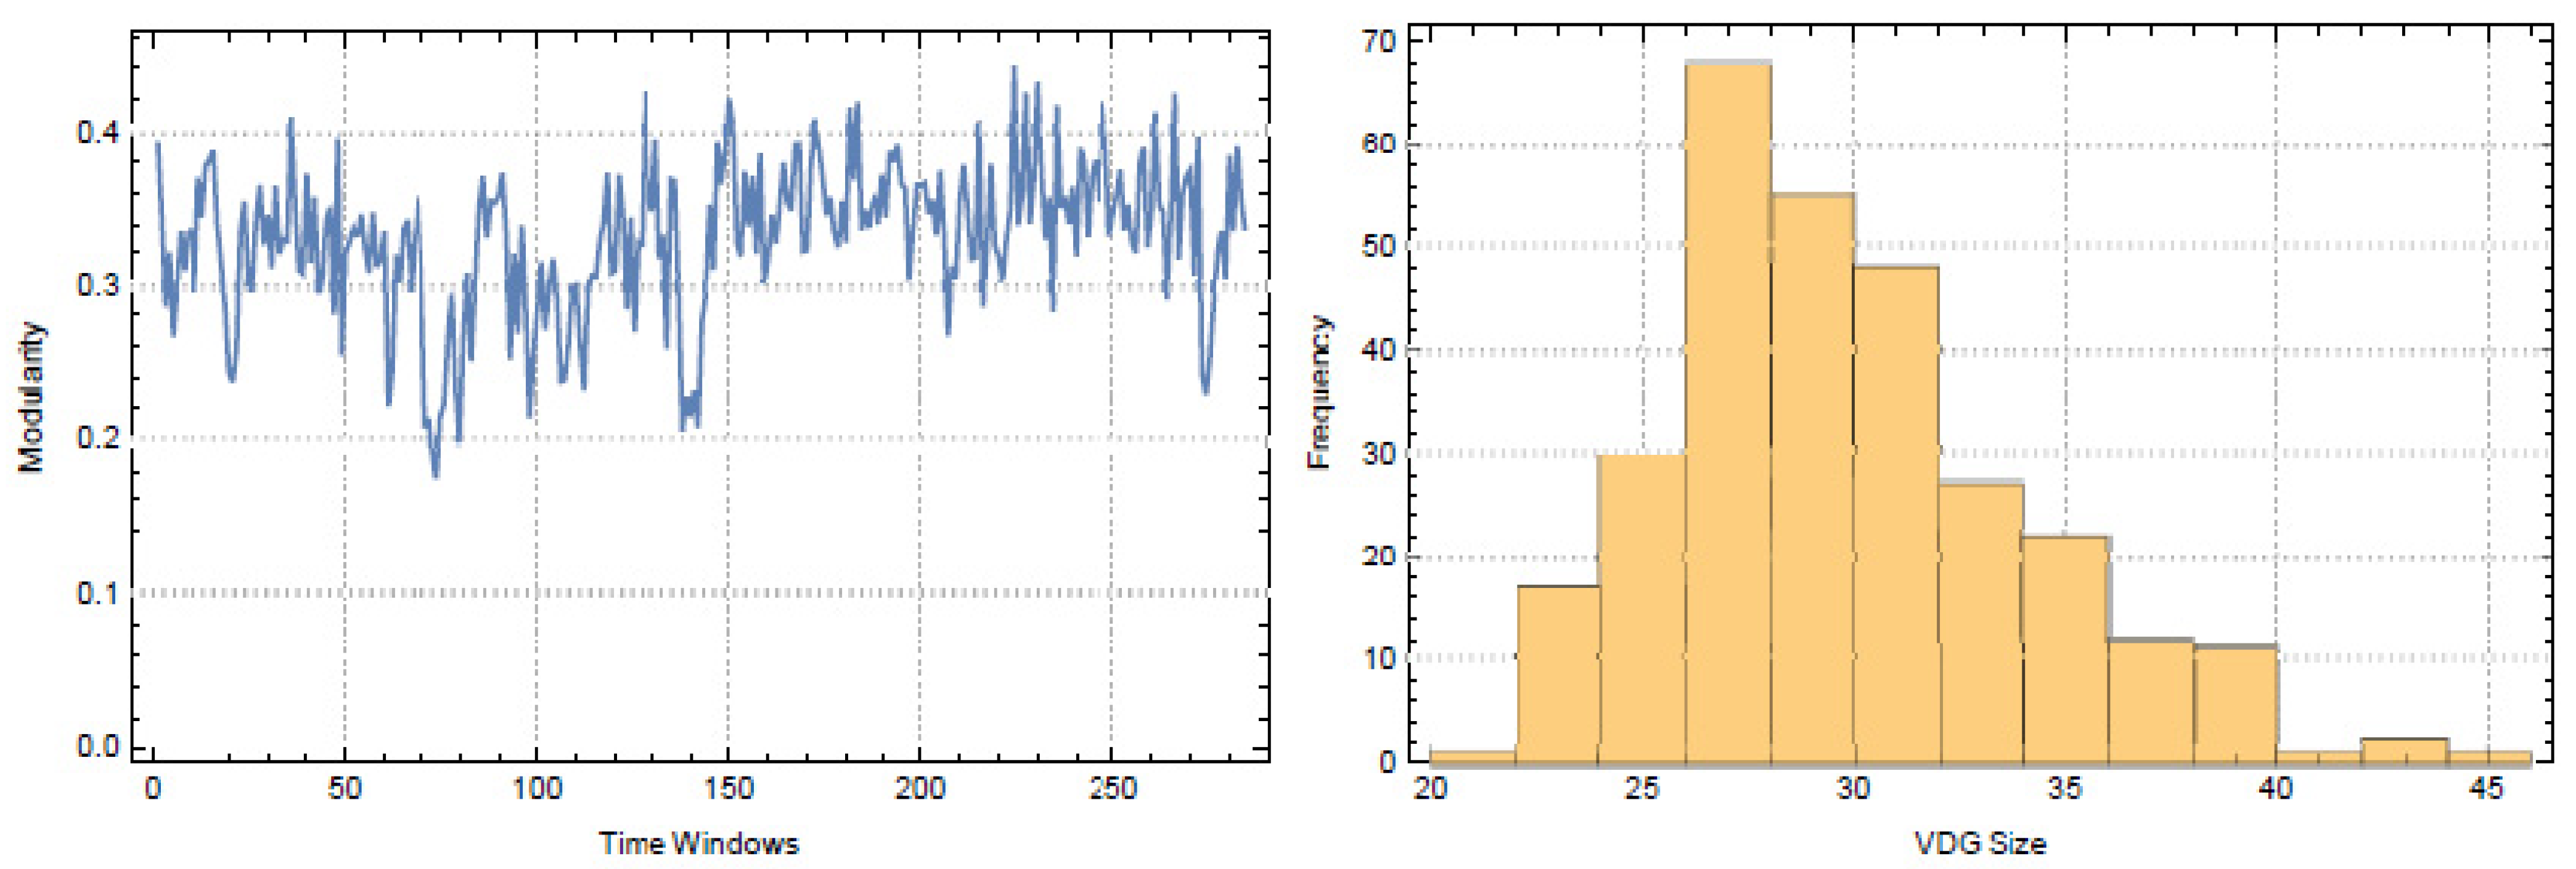
For each
of the FTSE100, we grained networks coarsely by determining VDG regions. The seeds of each VDG are obtained by the highest
and
scores. Since VDGs can be considered as graph communities of each
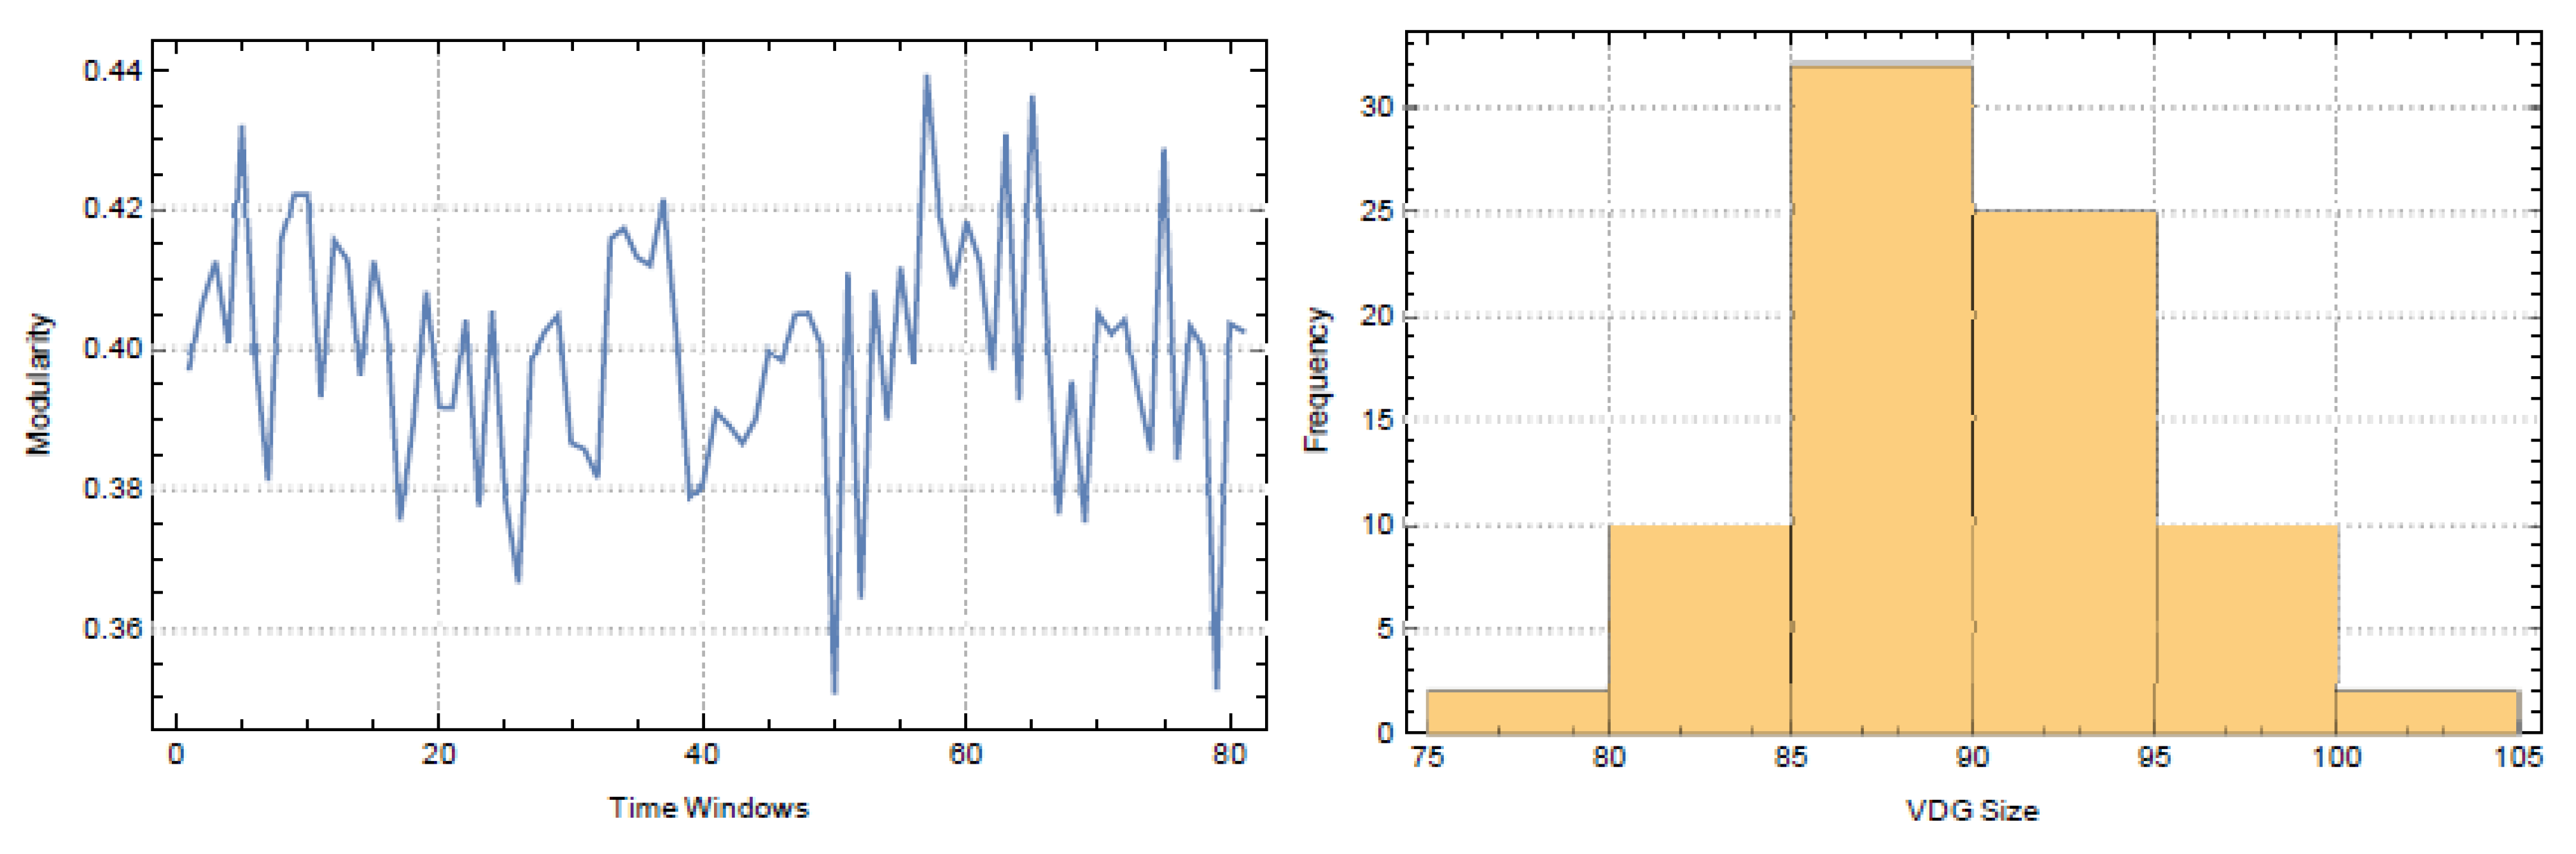
, we used modularity given in Equation (14) to measure cluster consistency. In
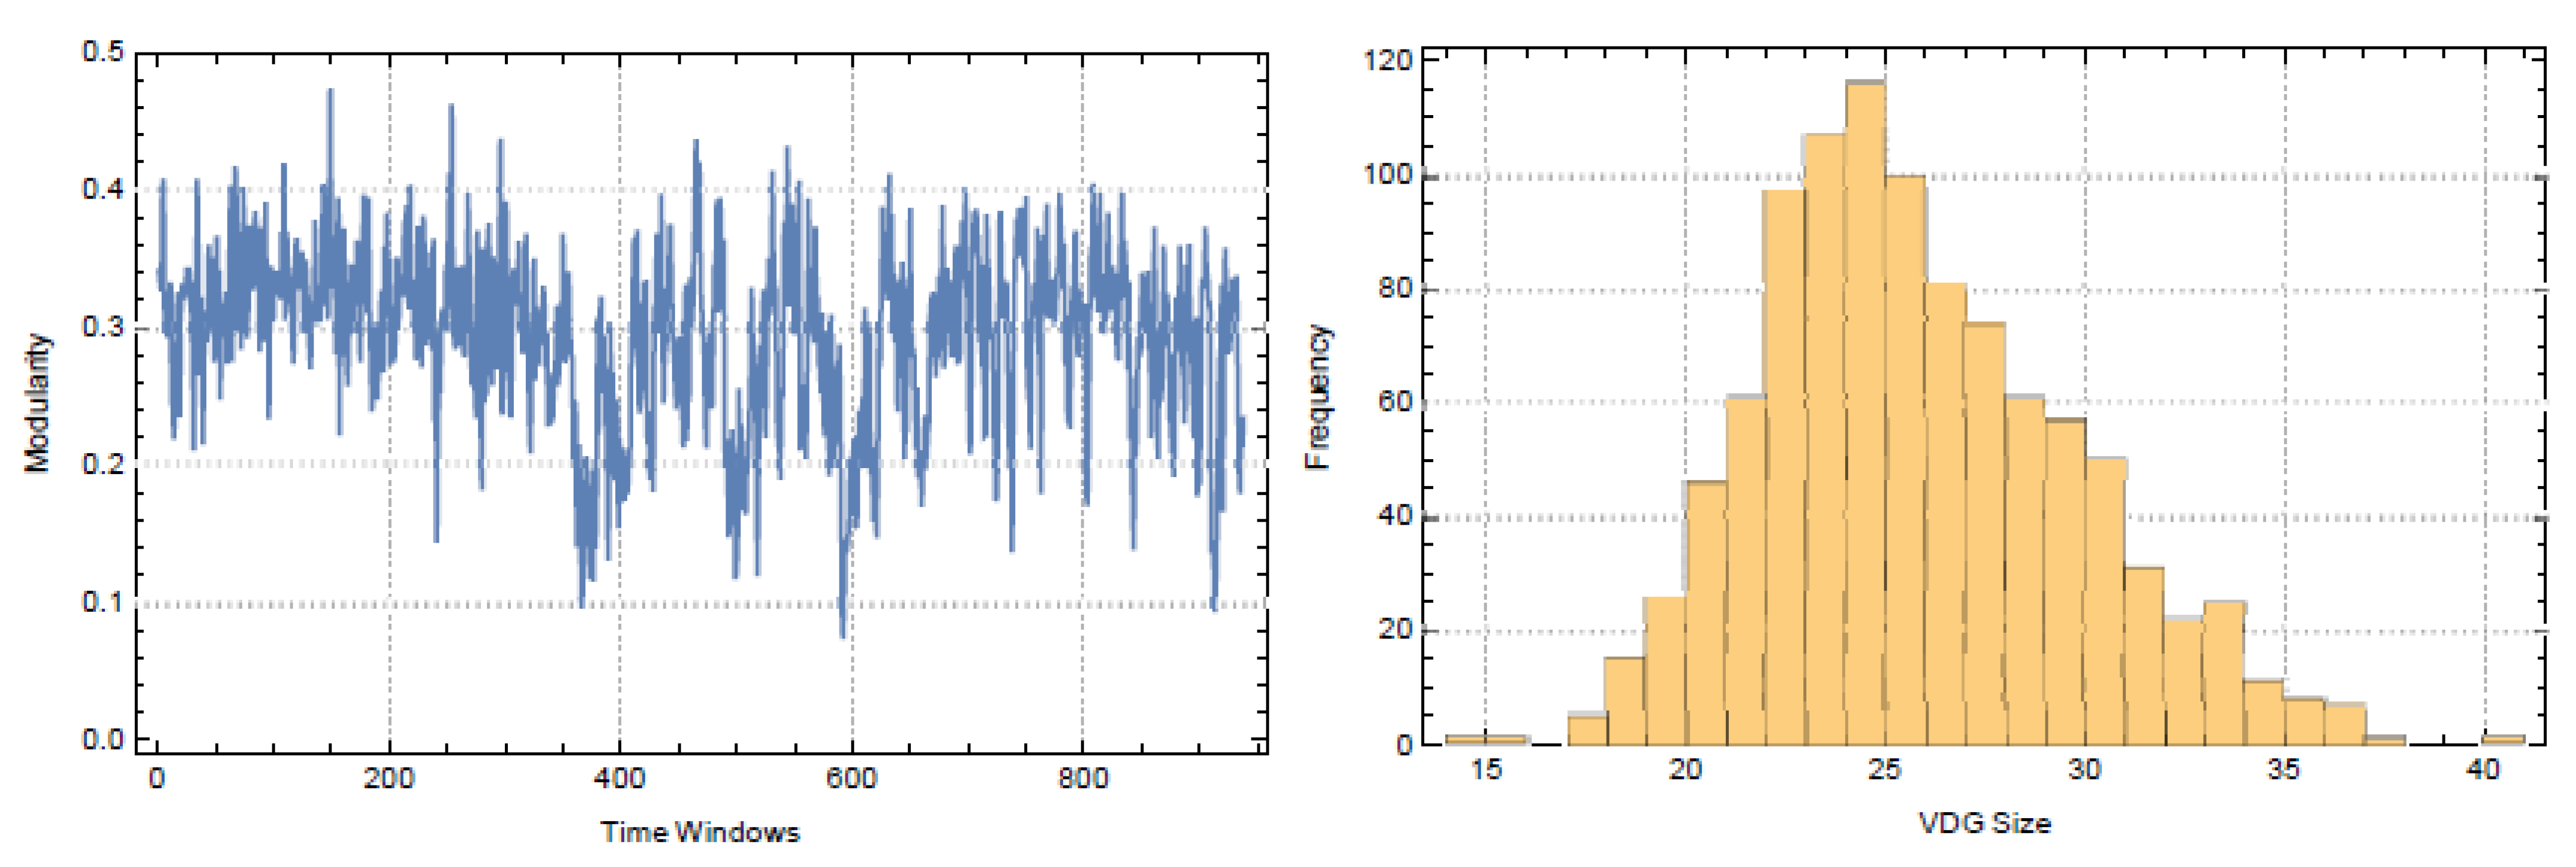
Figure 3, we presented modularity measures and the histogram of the sizes of VDGs for FTSE100.
From the histogram with the VDS sizes, it can be seen that some regions have really small sizes. Such grains are assumed to have no coarse boundary, in other words, they have
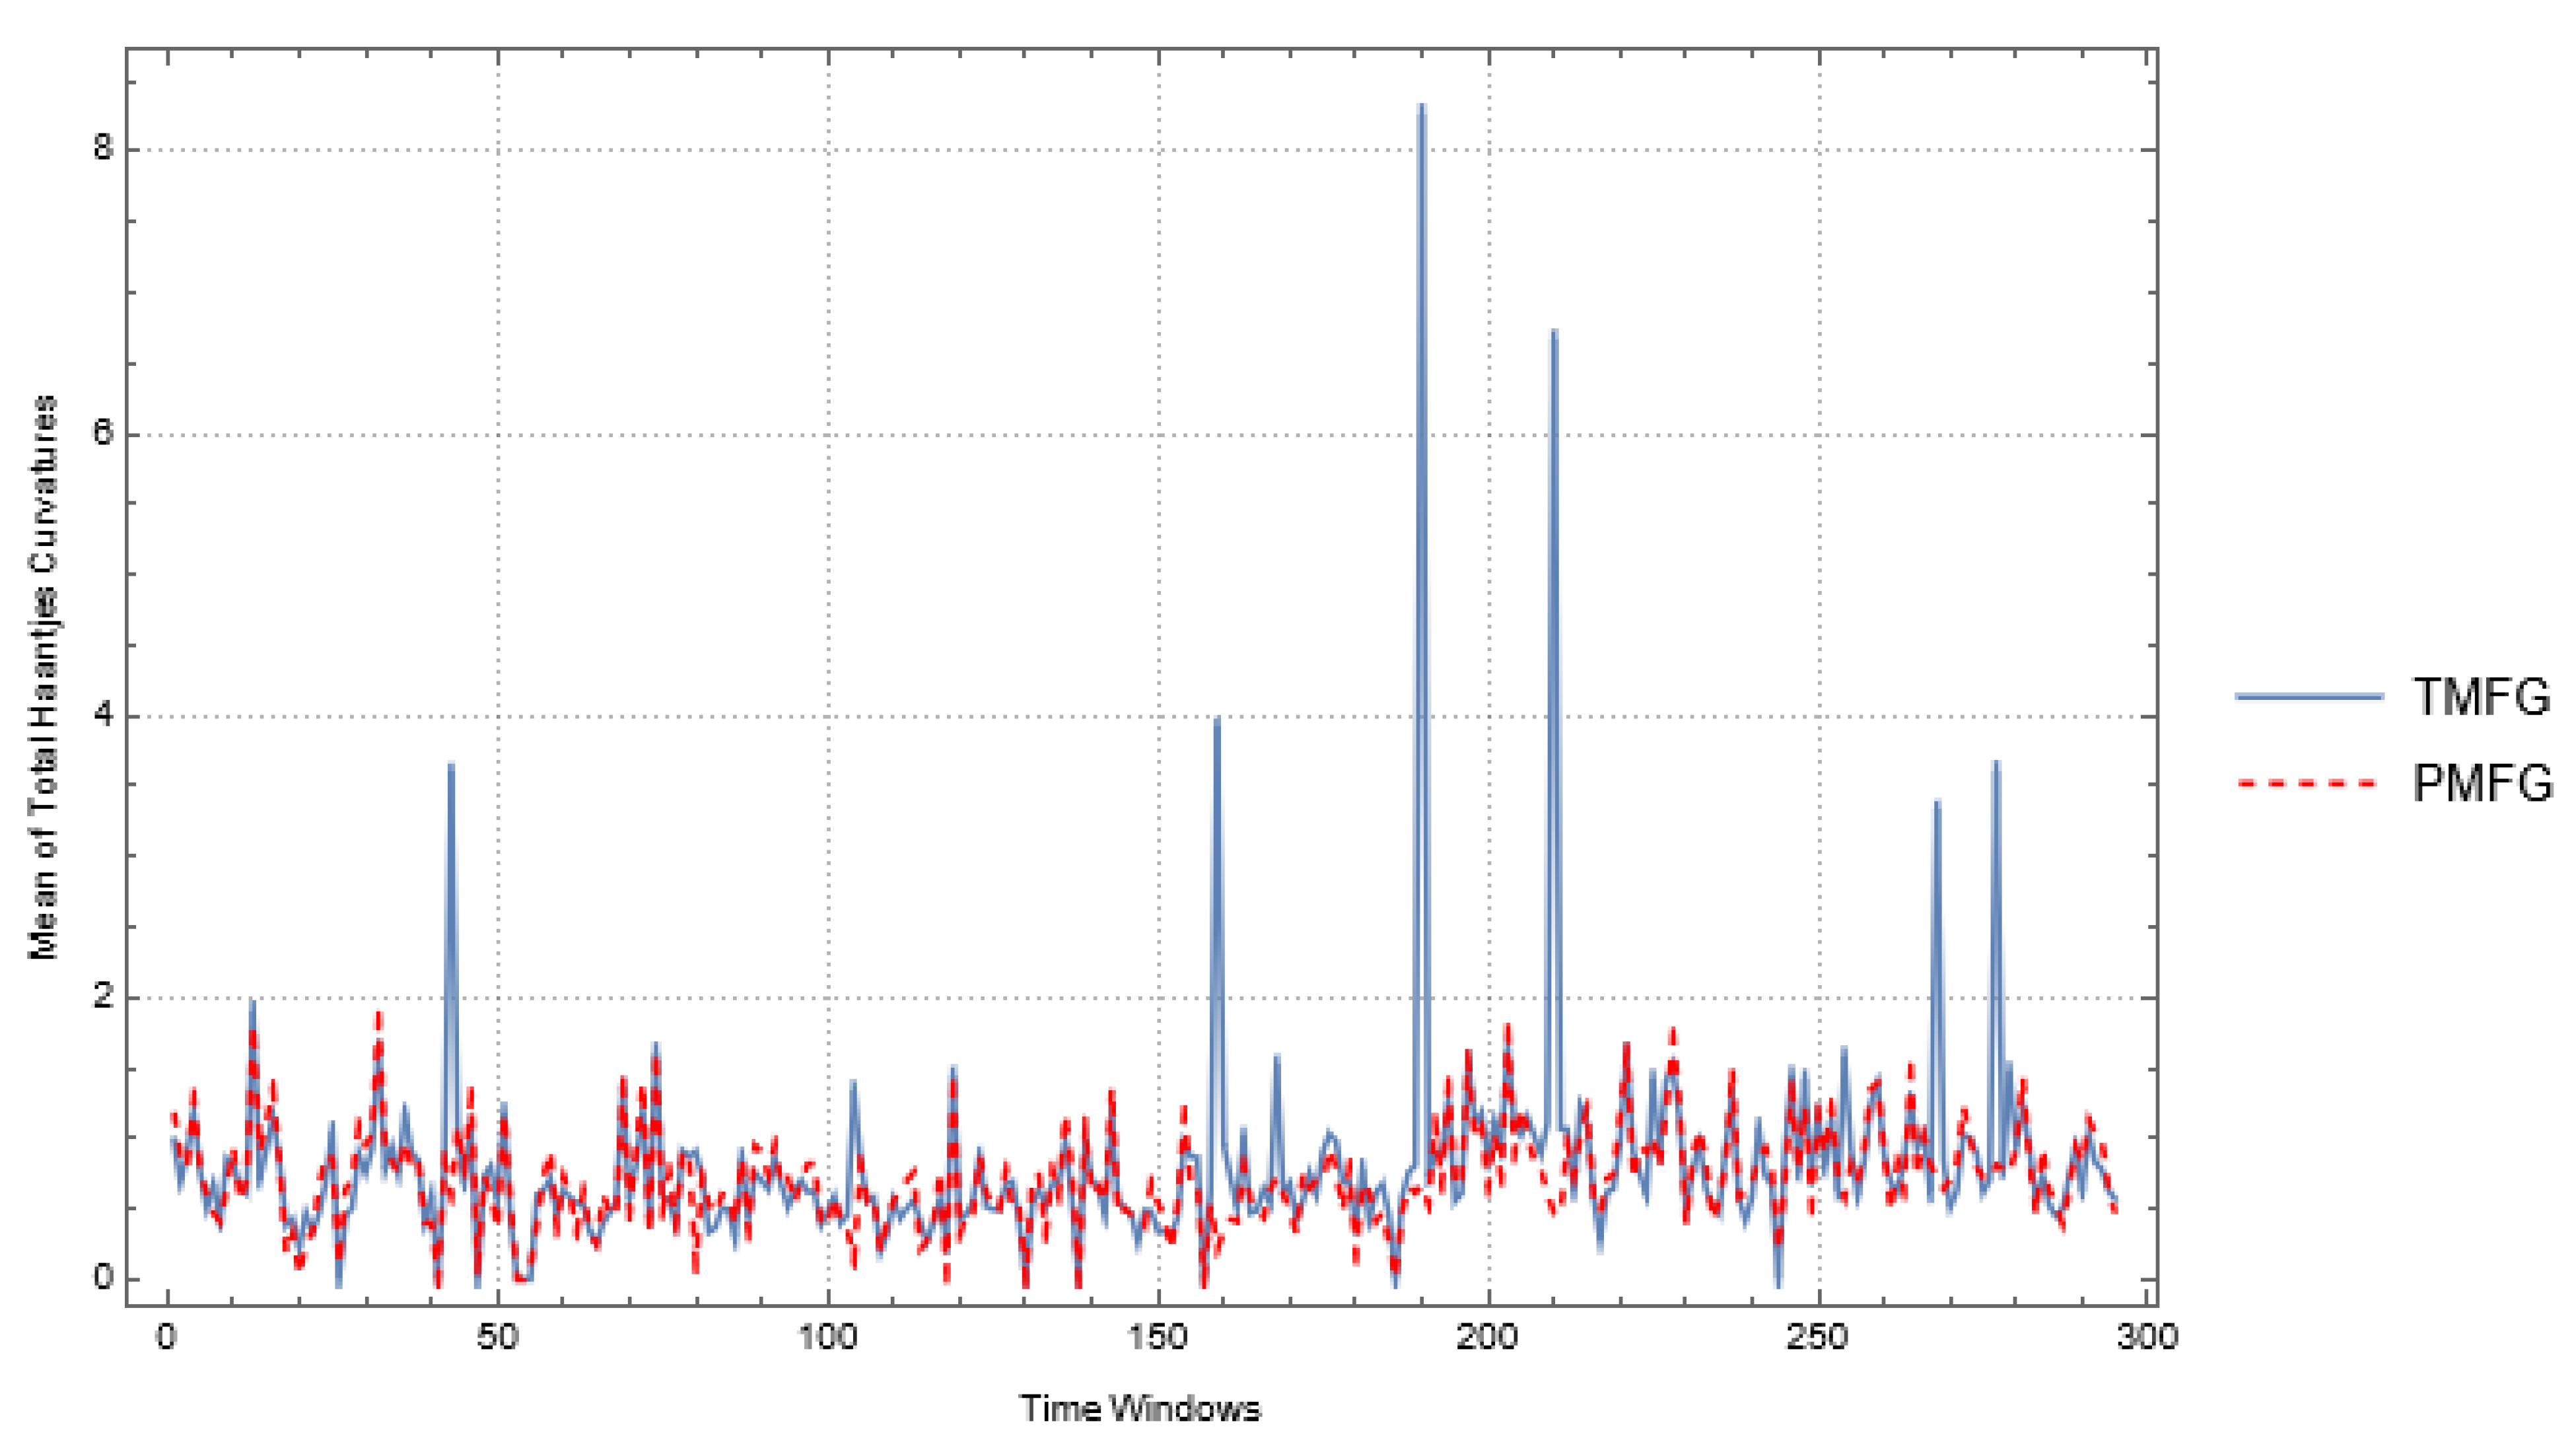
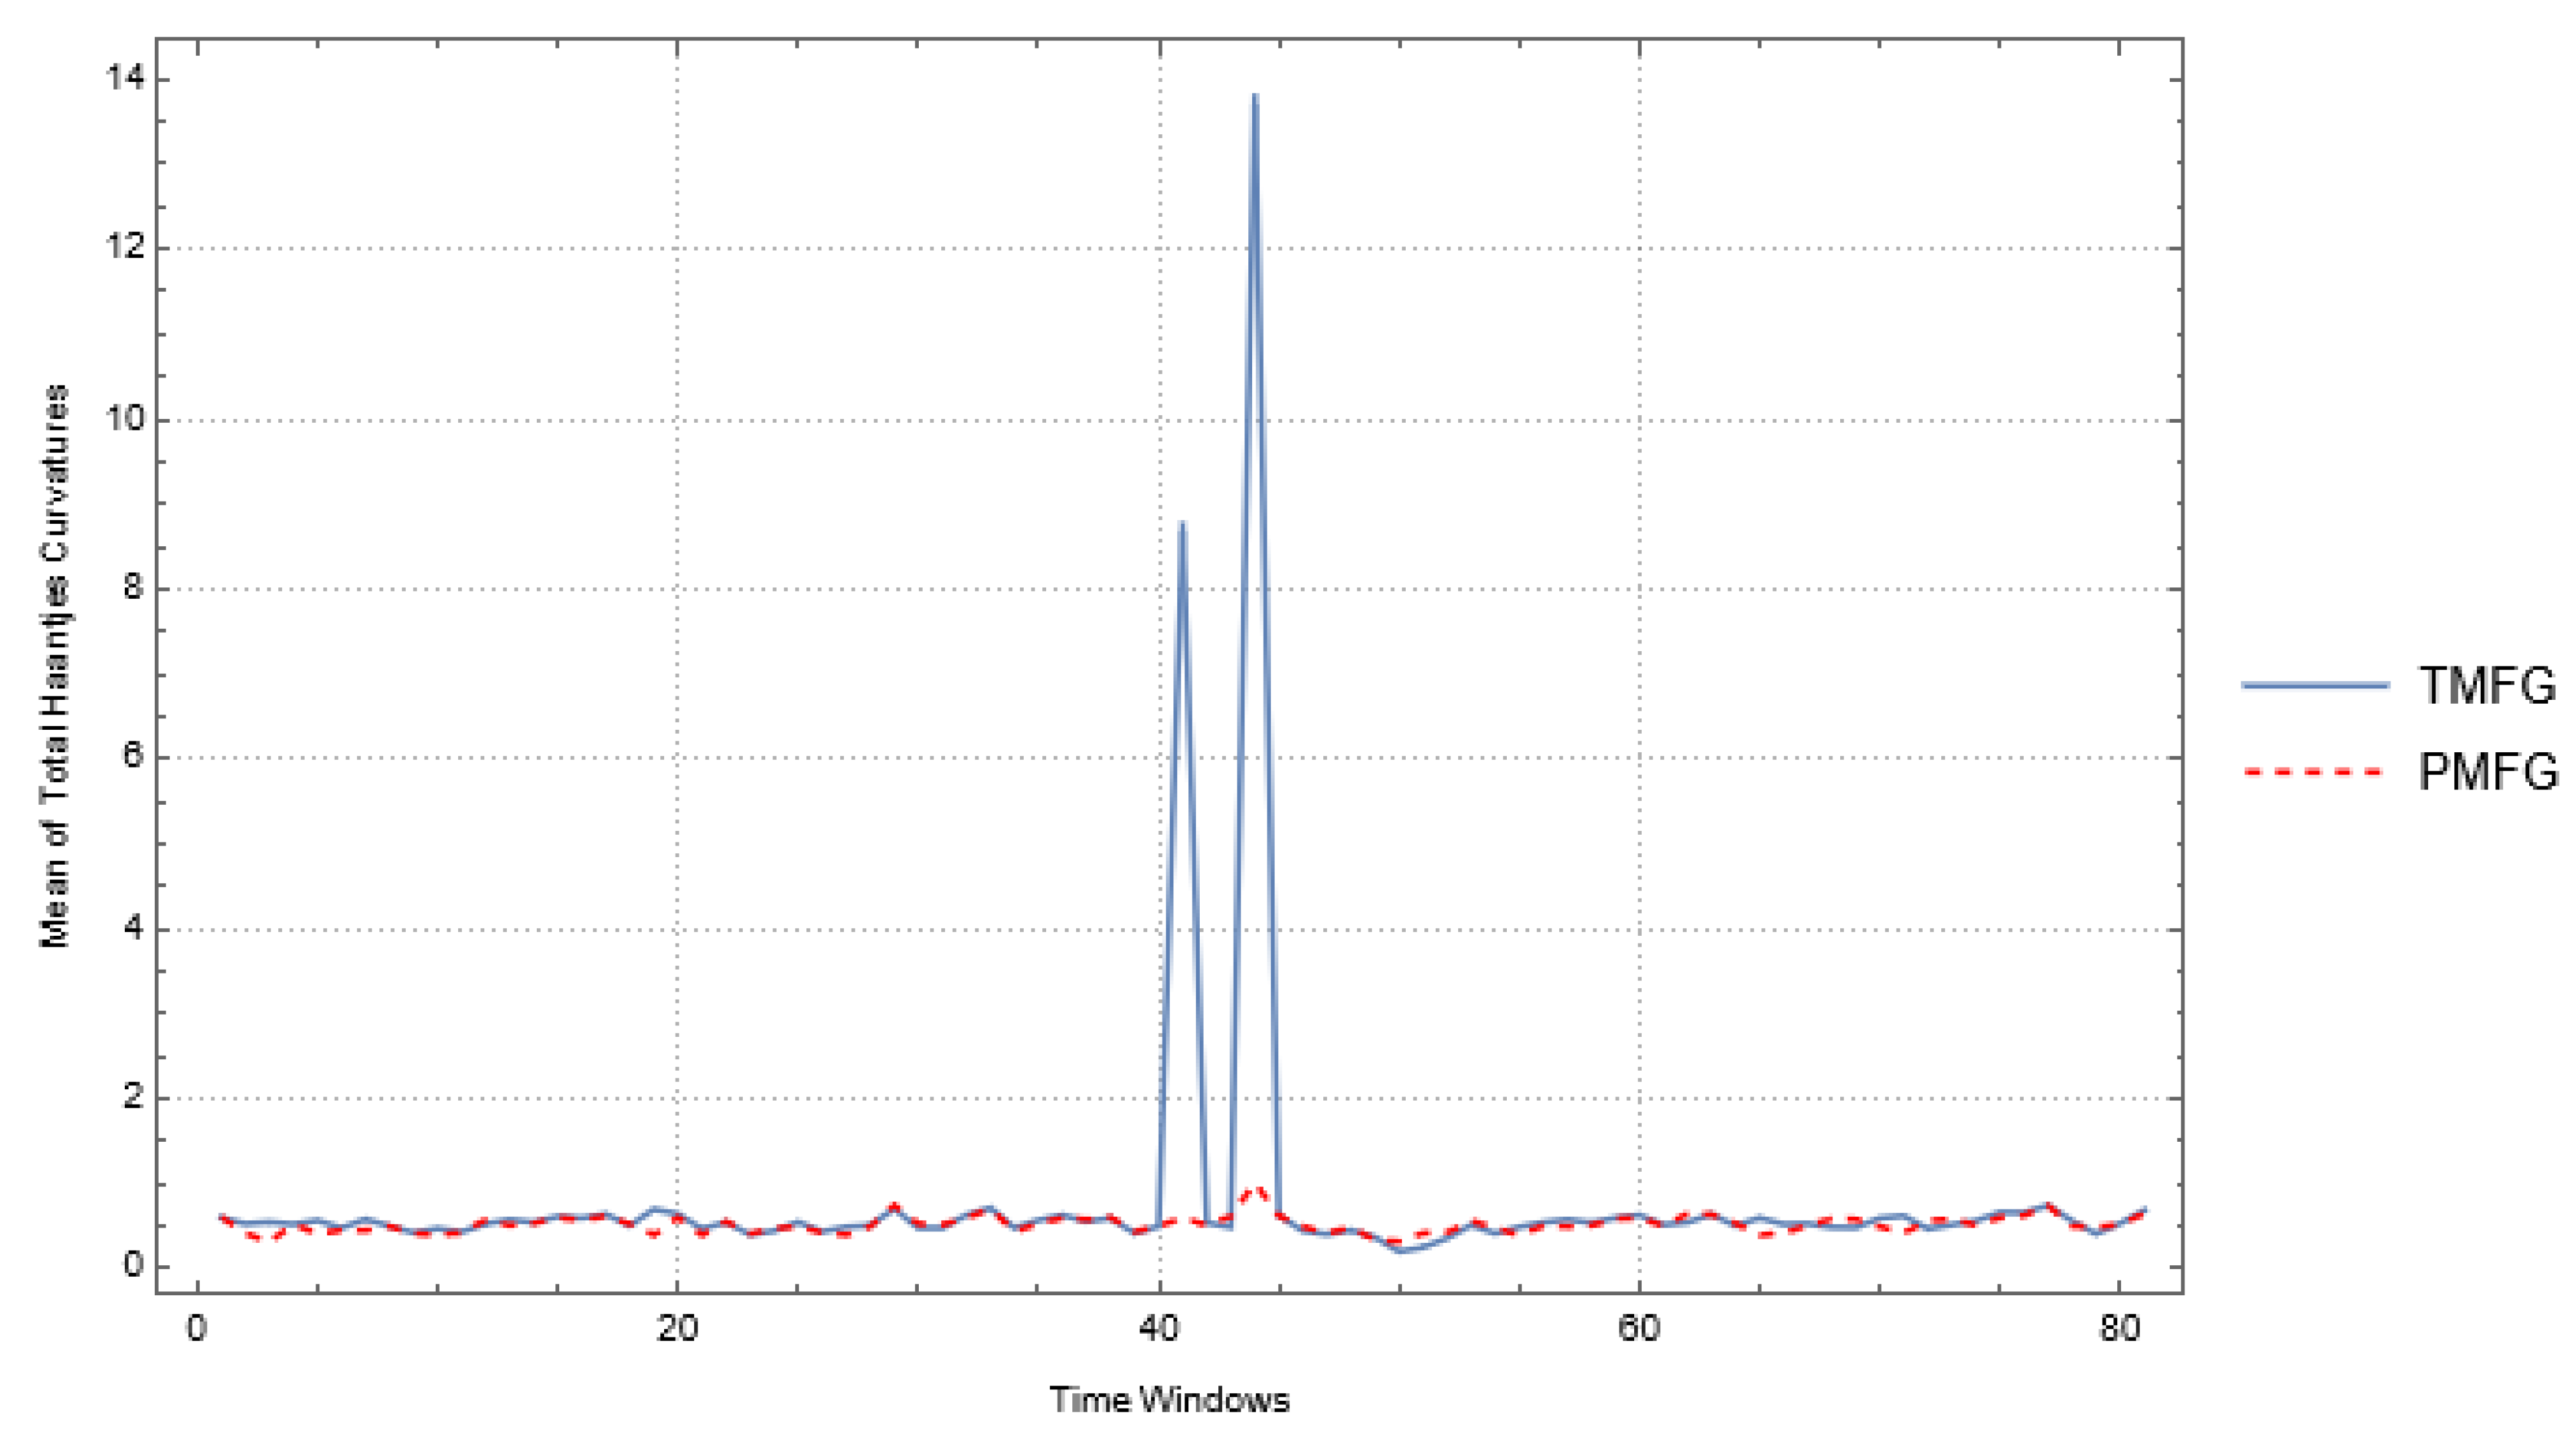
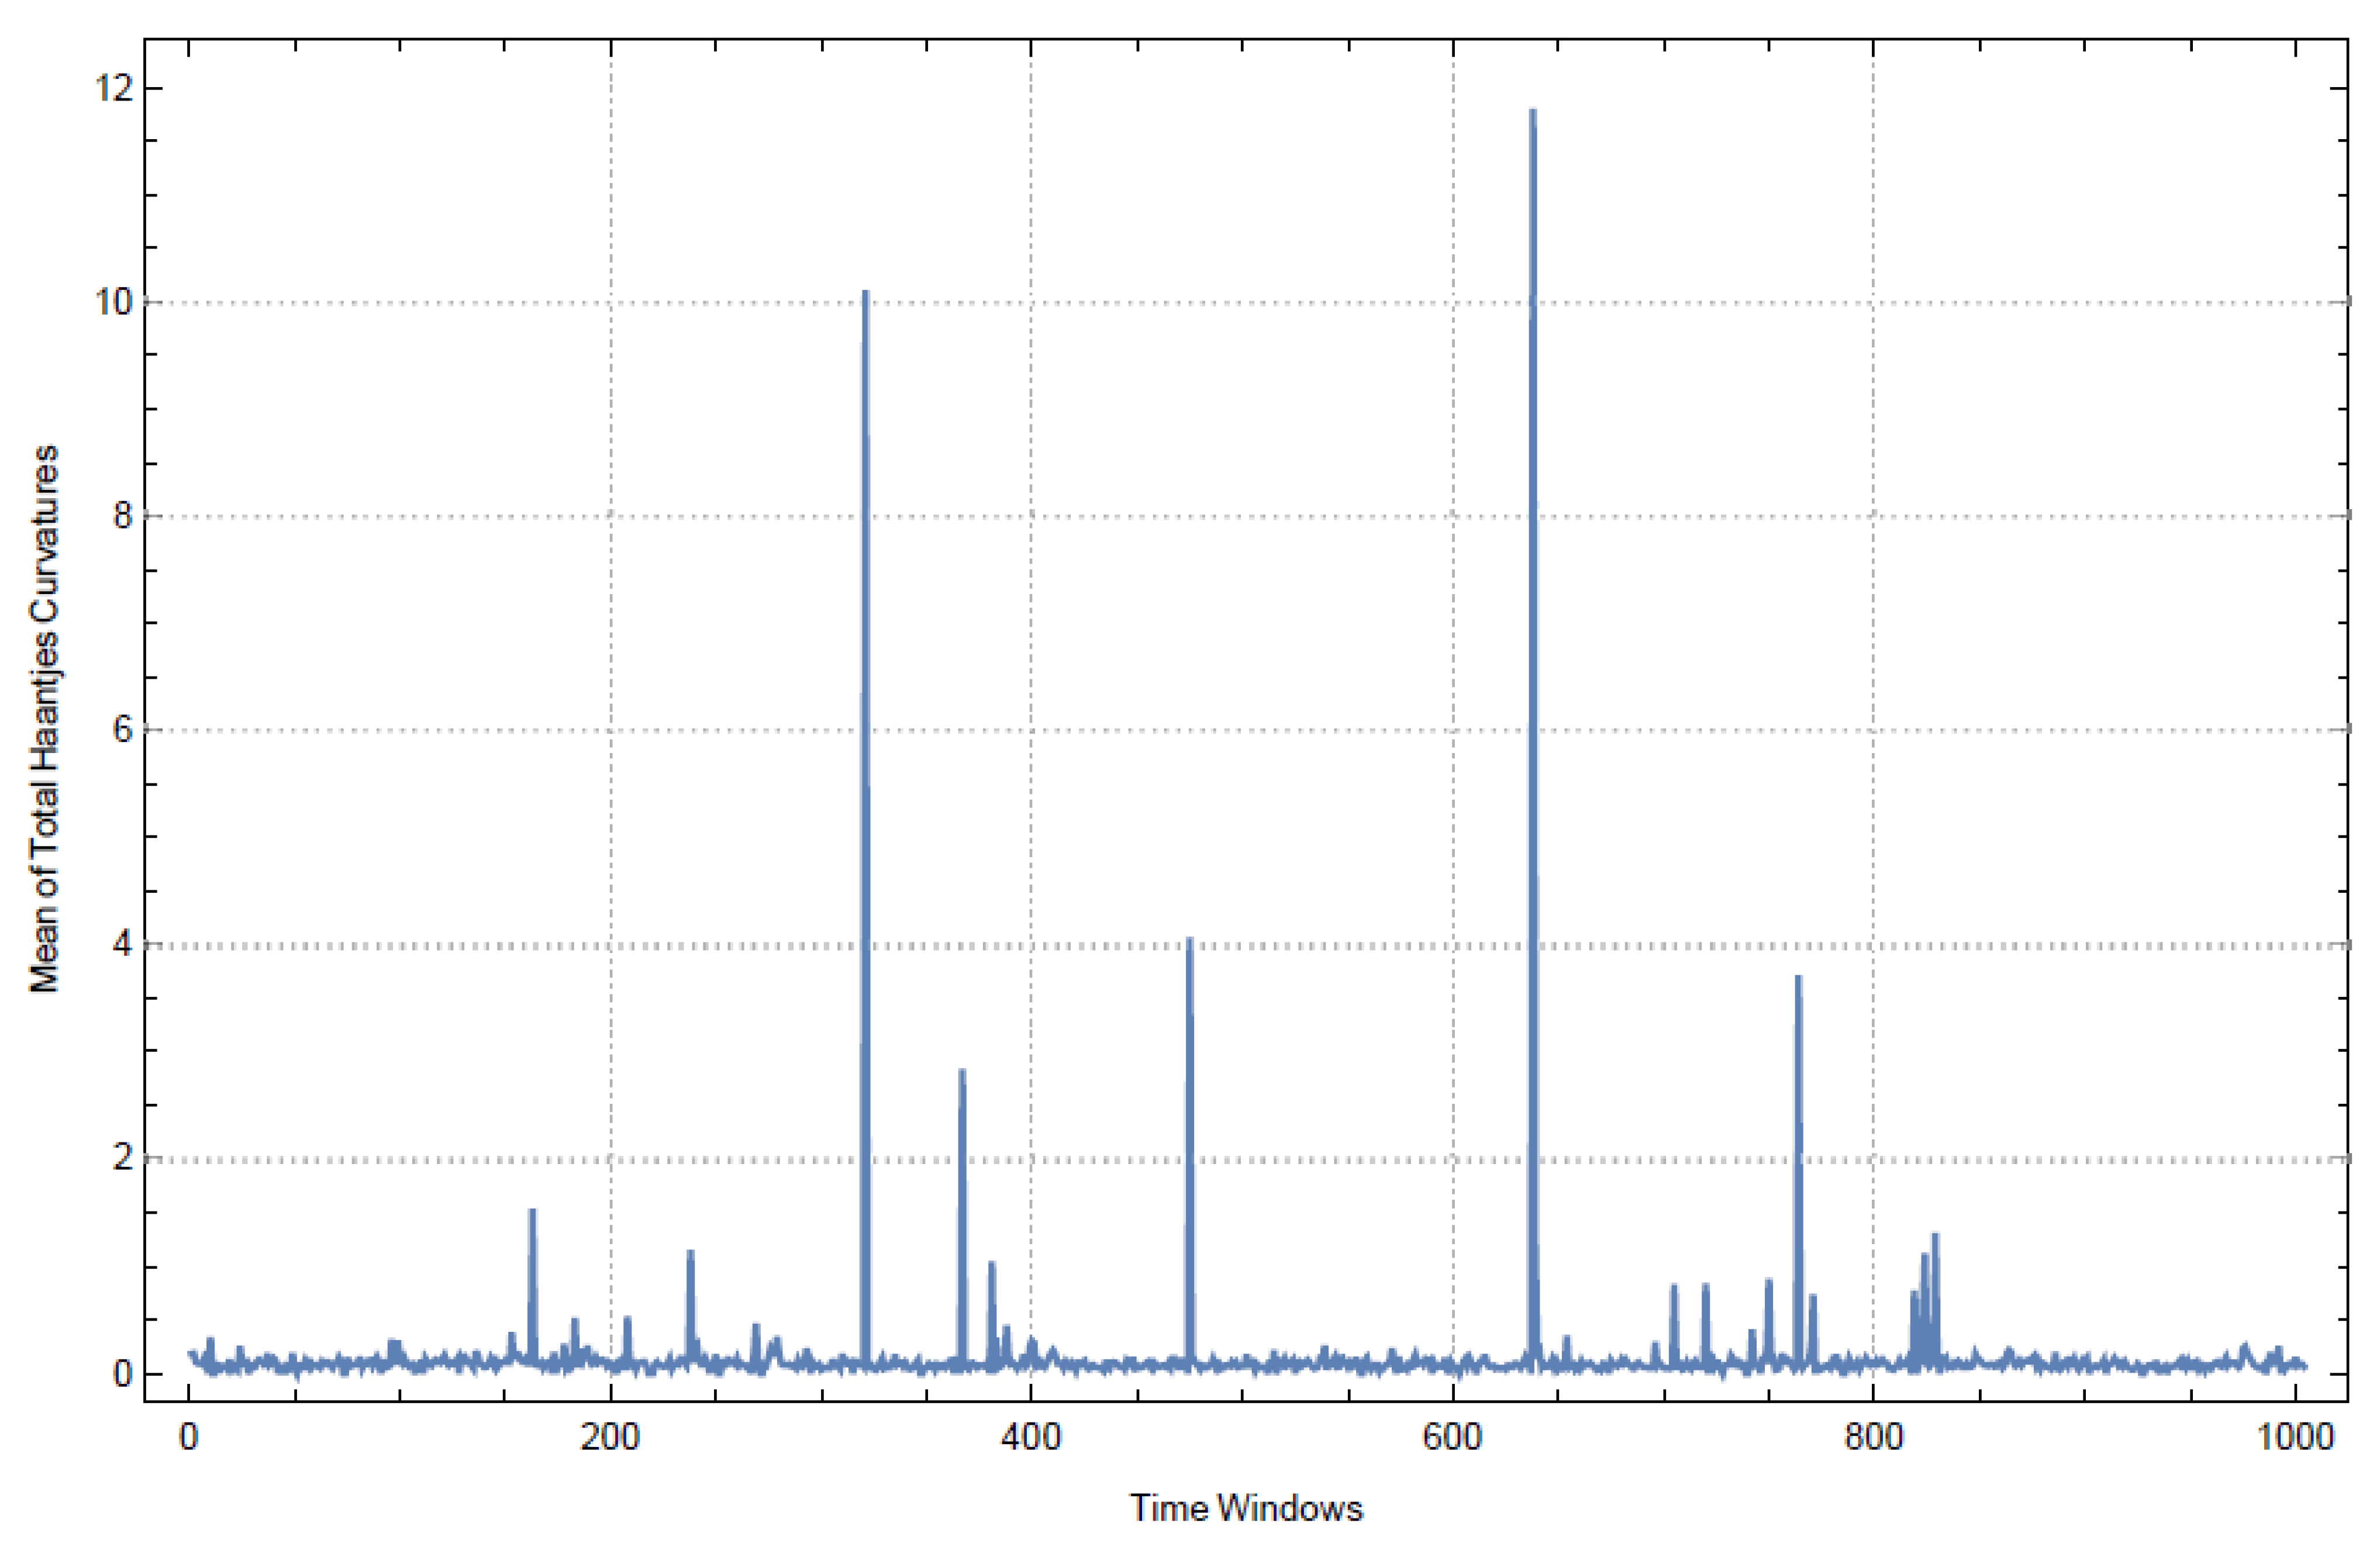
. Since we compute total Haantjes curvatures of coarse boundaries of coarse grains, we presented the means of total curvatures in
Figure 4.
3.2. Results for the BIST Index
For the second example, we evaluated the daily closing prices of stocks comprised by the BIST index from January 2018 to December 2018. This was a period of dramatic fall on the exchange rates of the Turkish Lira. In this sense, Trump’s tweets on increased tariffs were chosen to be covered. In order to define the Pearson correlation of the time series, we used 317 stocks with equal time series lengths. The stocks under consideration belong to the A and B segments of the BIST. Throughout the time frame, we observed a total of 81 moving windows. For each window, we obtained the TMFG filtration for
graphs. The values of network measures that were given by Equations (4), (12), and (13) and the global clustering coefficient are presented in
Figure 5. For the CPL and MOL measures, we used Maximal Spanning Trees of each
.
For each
of BIST, we grained networks coarsely by determining VDG regions. The seeds of each VDG were obtained by the highest
and
scores. Since VDGs can be considered as graph communities of each
, we used modularity given in Equation (14) to measure the consistency of vertex clusters. In
Figure 6, we presented modularity measures and the histogram of the sizes of VDGs for BIST.
In
Figure 7, we displayed the mean values of the total Haantjes curvatures of coarse grains.
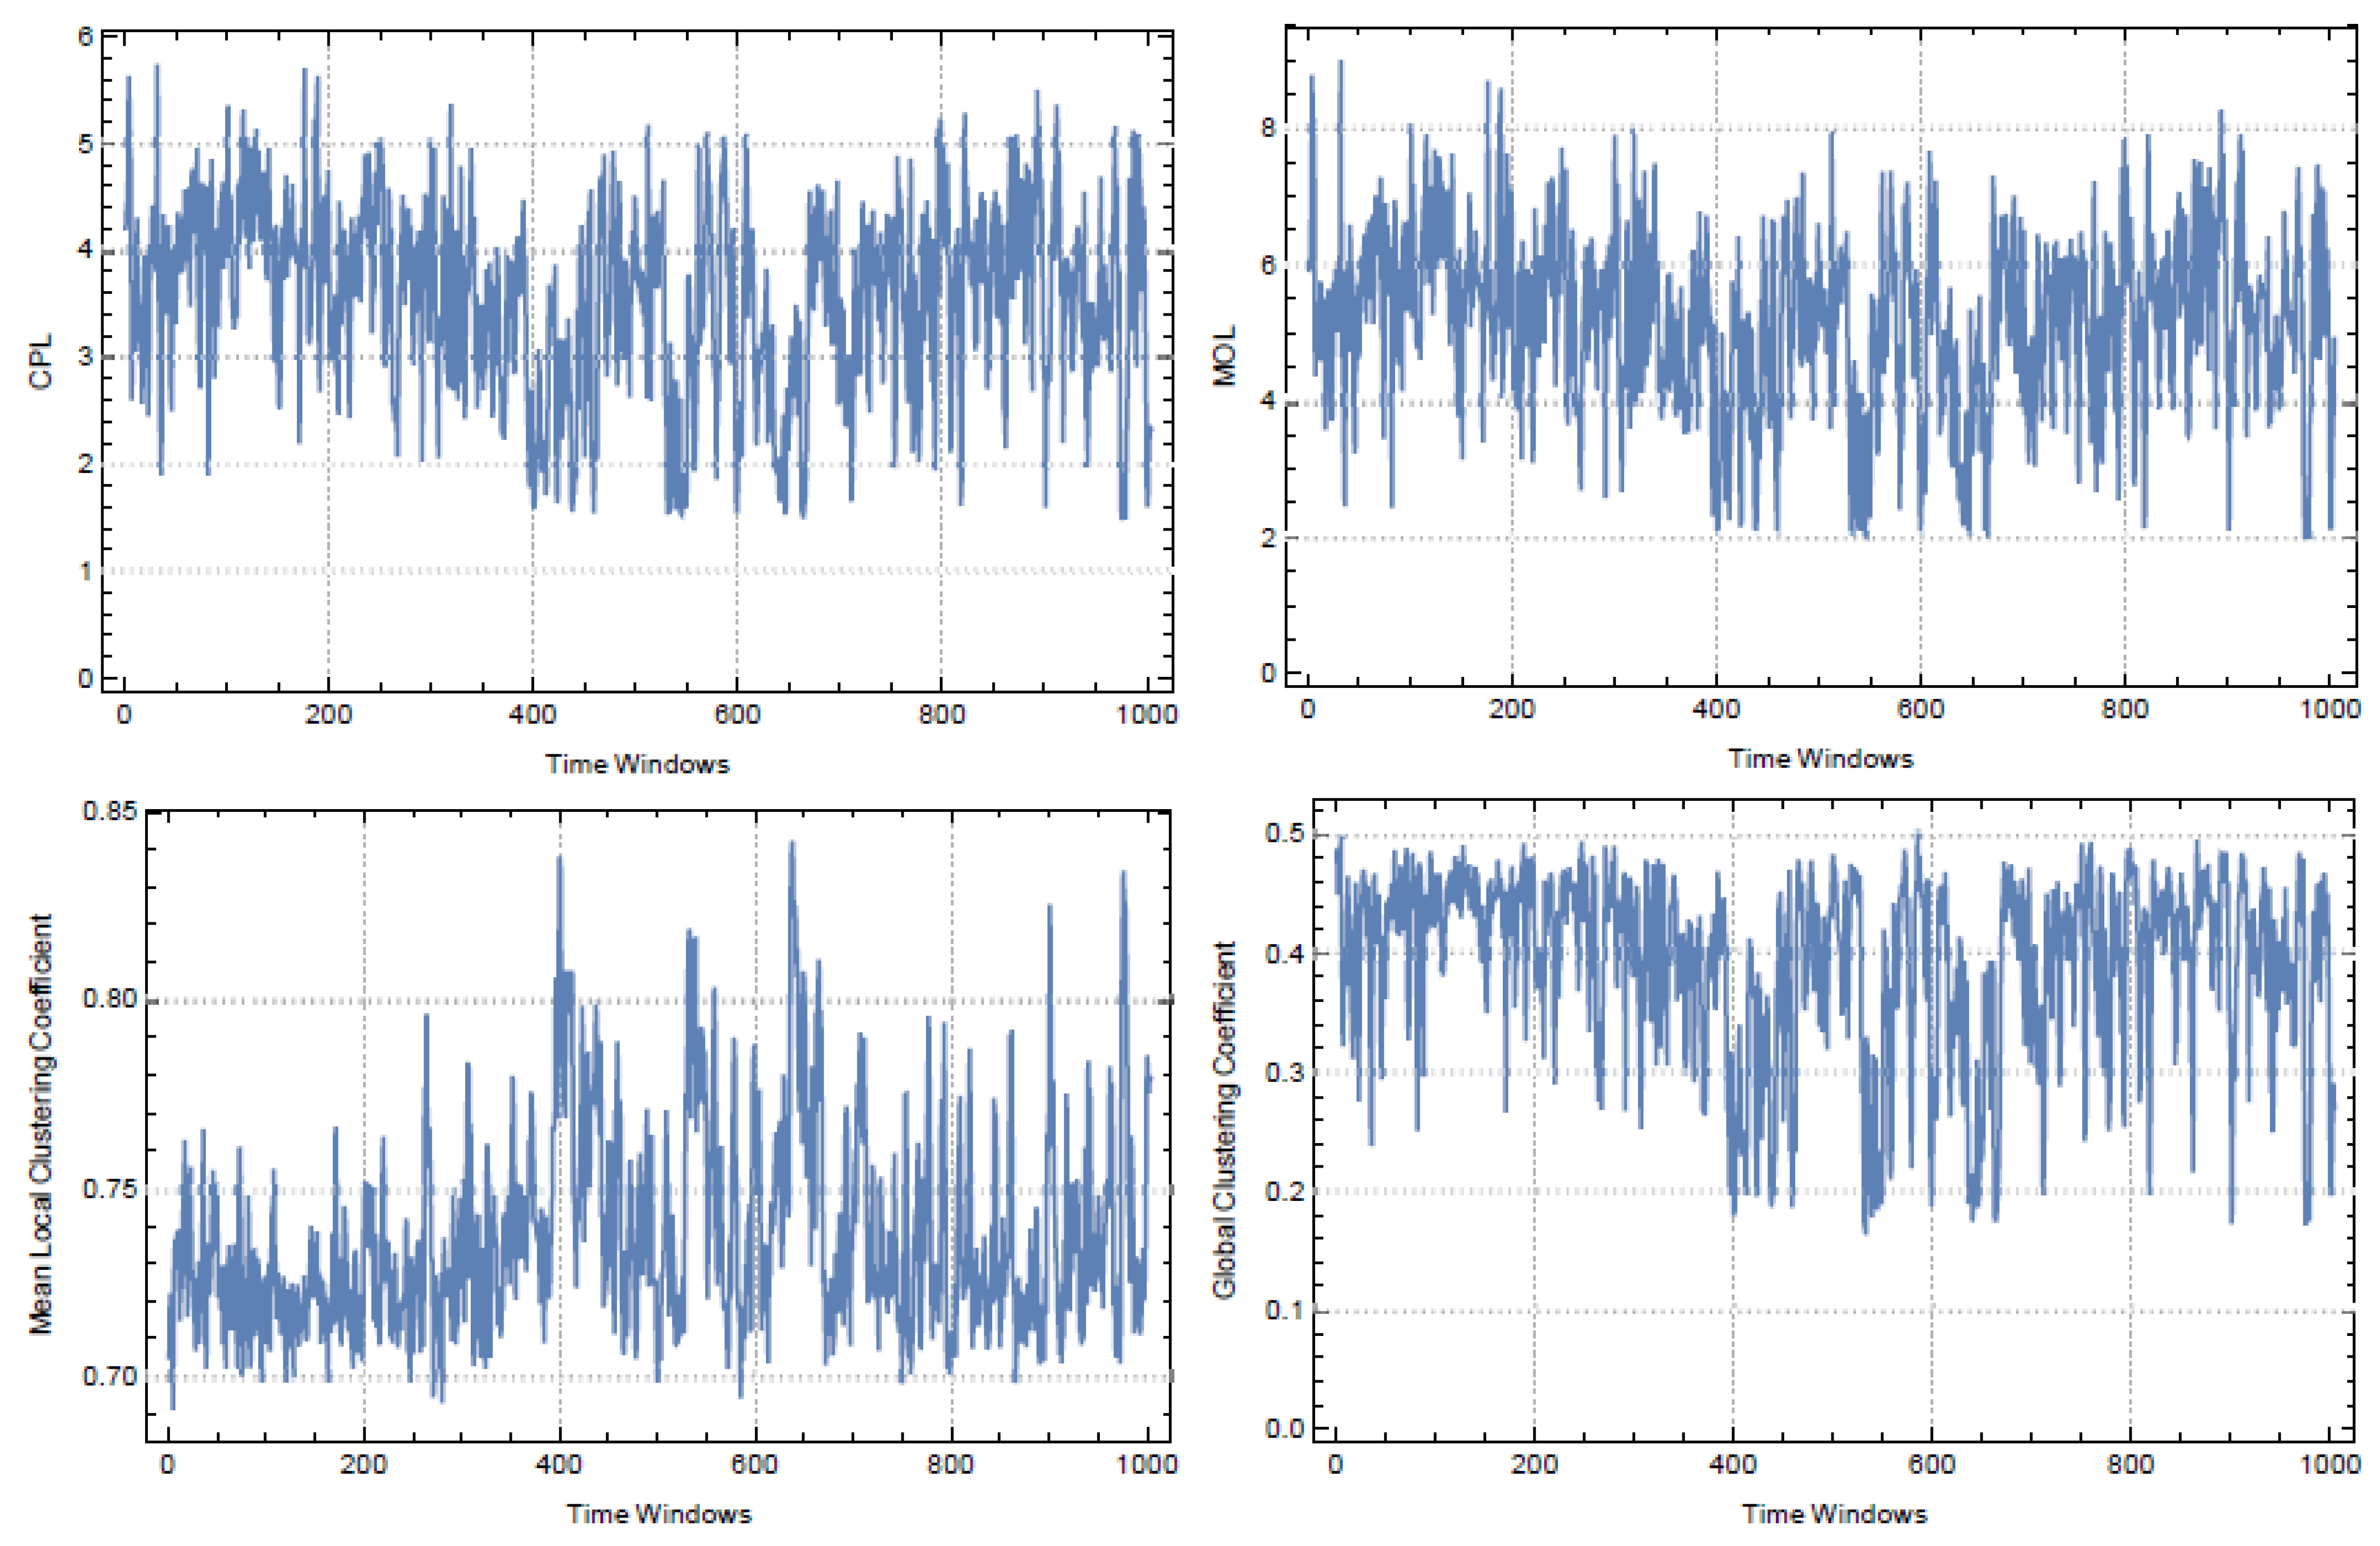
3.3. Results for the Nasdaq-100 Index
We evaluated the daily closing prices of stocks included in the Nasdaq-100 Index from January 2004 to December 2015 and the year 2008 was considered the benchmark period. In order to define the Pearson correlation of time series, we used 77 stocks with equal time series lengths.
Throughout the time frame, we obtained a total of 1,004 moving windows. For each window, we obtained the TMFG filtration for
graphs. Values of network measures that are determined by Equations (4), (12), and (13), and the global clustering coefficient are presented in
Figure 8. For the CPL and MOL measures, we again employed the Maximal Spanning Trees of each
.
For each
of the index, we grained networks coarsely by determining the corresponding VDG regions. The seeds of each VDG were obtained by the highest
and
scores. Since VDGs can be considered as graph communities of each
, we used modularity given in Equation (14) to measure the consistency of vertex clusters. In
Figure 9, we presented modularity measures and the histogram of the sizes of VDGs for Nasdaq-100.
In
Figure 10, we displayed the mean values of the total Haantjes curvatures of coarse grains. Since mean values regarding the PMFG filtration vary between
and
we have omitted the PMFG results for Nasdaq-100.
4. Conclusions and Discussion
It is fundamental to analyze the granular structure of a system, as well as the complex network modeling of systems formed by financial agents at different levels of interaction. In this study, we advanced a method for graining networks that model stock markets. By means of this coarse graining method, we examined the geometrical changes in the granular level of the network under the impact of an economic crisis.
As a first step, we used a method based on correlation distance to create networks. Hence, the complete graph representation of agents was chosen so that the weights be dialyzed. Moreover, we used correlation distances of time series obtained by logarithmic returns of daily closing prices of agents. The complete graph representation provided us with weak statistical information on network dynamics since the relationship was dense. At the same time, the network representation contained geometrically missing information as it was isomorphic to an n-dimensional abstract manifold. For these reasons, we applied TMFG filtering in order to obtain networks.
We examined network models of three different stock market indices. In this sense, we used moving windows to observe the structural change of each market. In each window, the TMFG filtering was applied to complete graphs formed by the agents’ time series. To compare the topological structures of the TMFG graphs, measurements such as CPL, MOL, mean LCC, and global clustering coefficient, frequently used in the literature, were applied to these graphs. We determined the CPL and MOL measurements in Maximal Spanning Tree structures since we dualized the correlation distance. During the crisis periods impacting the FTSE100, BIST, and Nasdaq-100 indices, high oscillations were observed for all measurement values. Moreover, only significant changes are elicited for the global clustering coefficients. Hence, these measurements alone are not strong indicators for TMFG filtering.
To define a stronger indicator and analyze the granular structure of financial systems for TMFG networks, we presented a Voronoi region based on the clustering method. Seeding points for VDG, which is a geometric partition for discrete metric spaces, were selected from the points of the TMFG graph with the most appropriate LCC score in both weighted and unweighted topologies. Therefore, we called the VDG graining of the network coarse graining. The modularity index was used to analyze the VDG clustering. According to the results, modularity values for the FTSE100, BIST, and Nasdaq-100 indices fell into the ranges (0.19–0.42), (0.35–0.44), and (0.1–0.5), respectively. The volumes of the VDG cells also had a significant distribution according to the number of agents they have for all three stock markets and the time frame used in the analysis. According to the modularity indices, it can be stated that the BIST index had the tightest granular structure as compared to the other two indices.
We studied the discrete Haantjes curvatures of the paths, which are furthest from the seeding points of the VDG cells, in order to observe changes in the geometry of the coarse granule structures. We noticed that remarkable changes occurred in the geometries of the granules for all three stock market indices during crisis periods. Such changes were encoded in the averages of discrete Haantjes curvatures. Overall, the most noticeable change occurred for the BIST market index because VDG cells formed tighter granules. When the average Haantjes curvatures are examined, it is observed that there is more variation for the FTSE100 index than for the BIST and Nasdaq-100 values. This shows that the Brexit process causes more stress in the FTSE100 index in the periods before and after. While the market is always looking for the market equilibrium after short-acting stress periods in the BIST index and long-term stress periods in the Nasdaq-100 index, this process takes longer for the FTSE100 index. The findings are compared to PMFG filtering in order to see if the Haantjes curvature is a better indication in TMFG filtering. The average Haantjes values exhibit higher oscillations in TMFG filtering during stress times, according to the data collected.
All in all, it can be stated that the method presented in this study can serve as a strong indicator of a financial network. The method can be extended to networks that model not only financial systems but also different types of complex systems [
48,
49,
50]. Hence, the approach from our study can serve as a starting point for research studies focused on geometrical, topological, and statistical aspects of network science [
51,
52]. In many quantitative financial models, the correlation matrix of asset returns is based on Pearson’s linear correlation. However, when used for fat-tailed financial time series such as stock returns and exchange rates, which have significant volatility changes, the linear correlation may cause some distortion [
53,
54]. The correlation matrix of unfiltered sample data series with a moving window, as a result, has basic flaws that are generally acknowledged by academics and practitioners. Yet, the approach is still extensively employed due to a lack of alternatives.


