6.1.2. Performance Analysis
The performance of proposed approaches is described in this part using measures such as energy consumption, drop, delay, throughput, packet delivery ratio, and fairness index.
- (1)
PHASE 1:
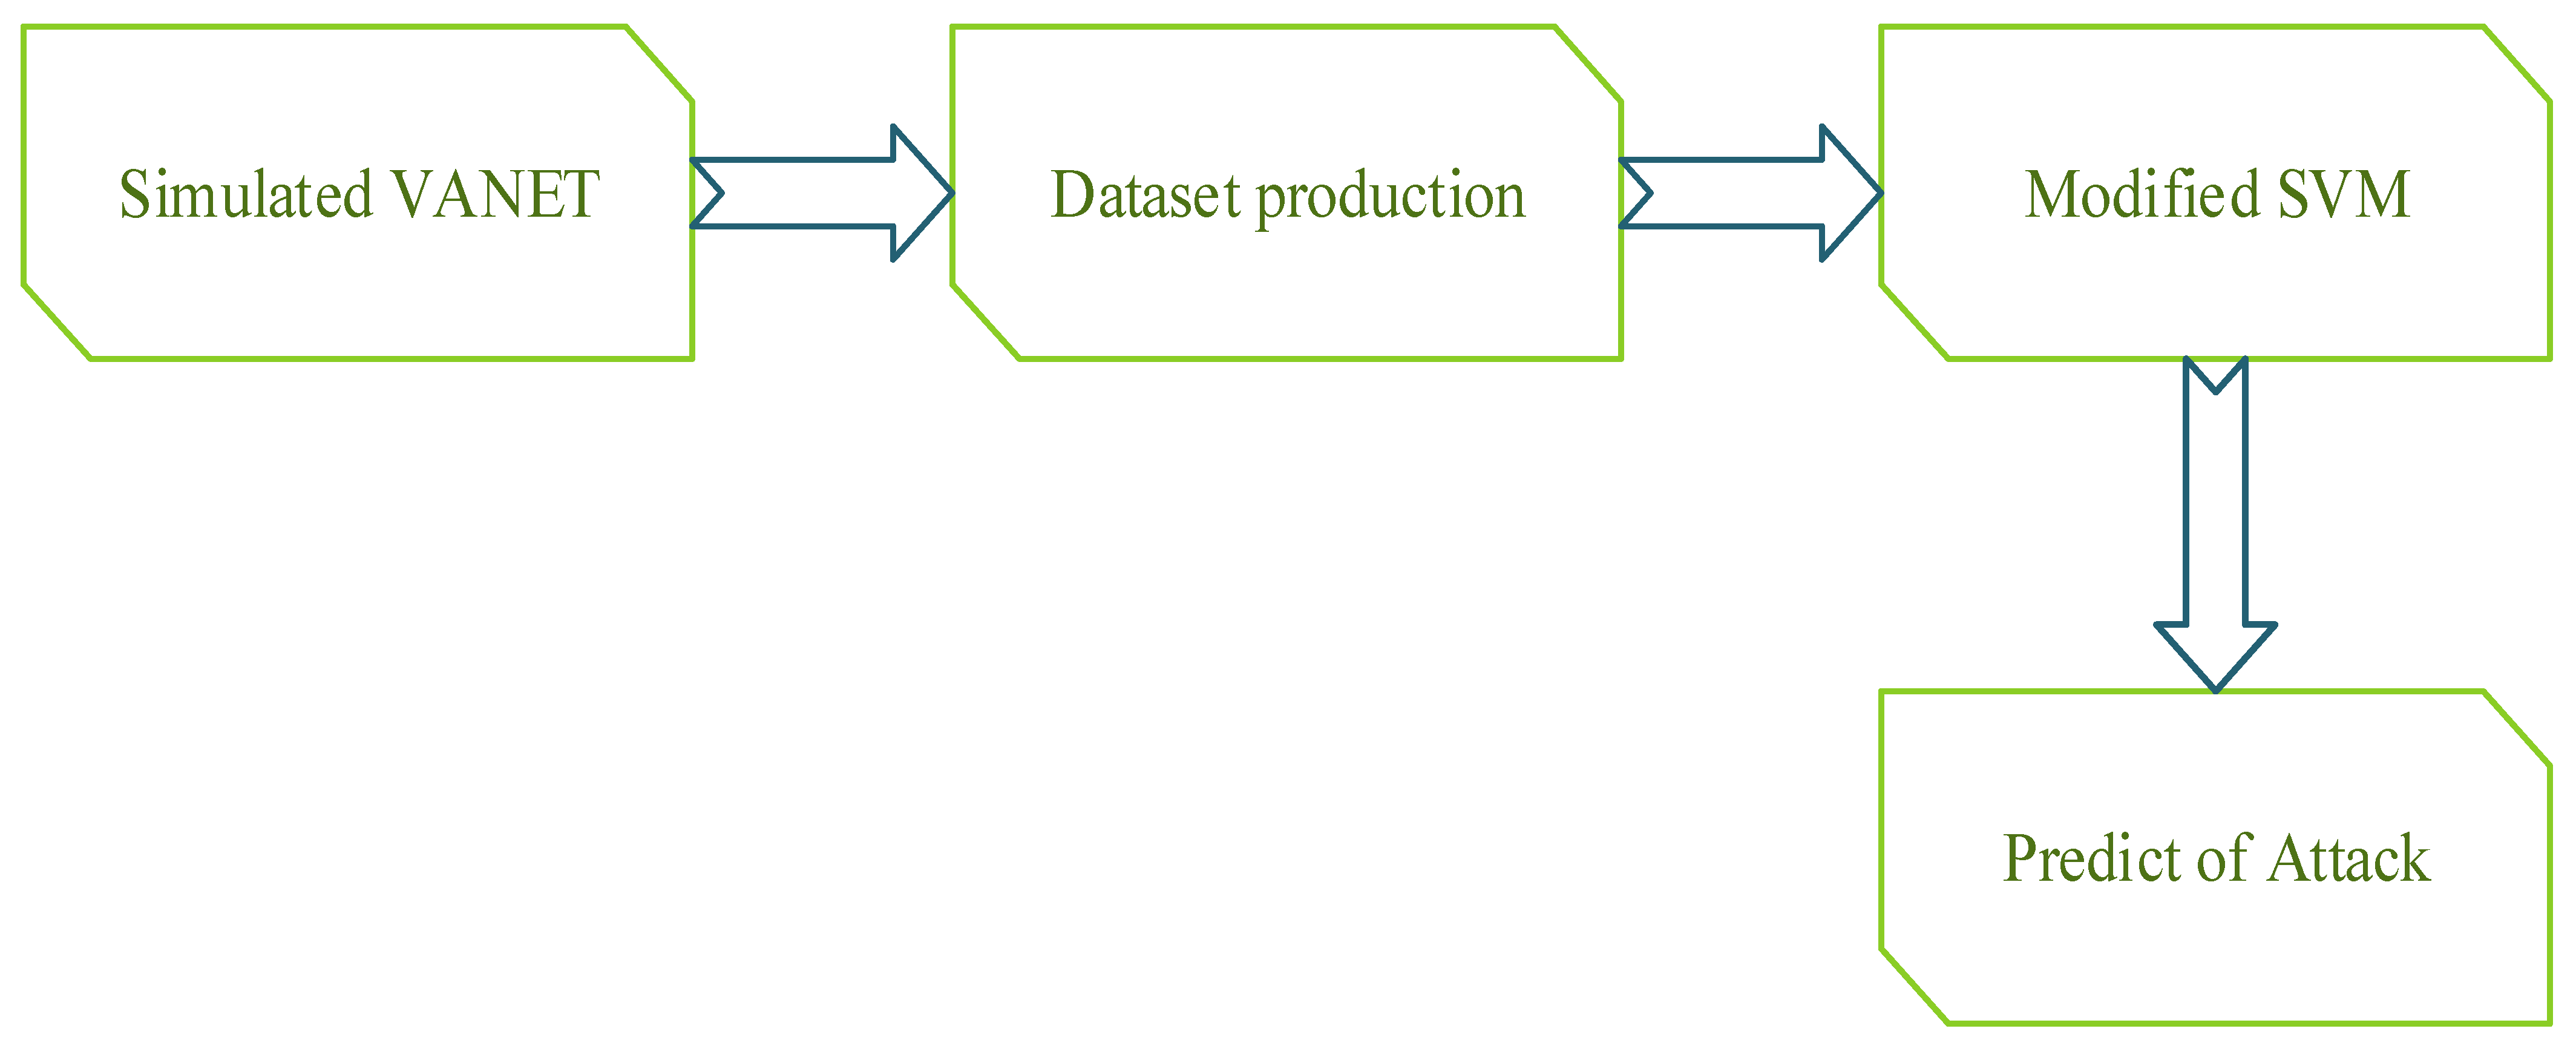
Phase I detected the DDoS attack using a novel machine learning technique called SVM-HHO, which provided vehicle information. This section describes the analysis, and the proposed performance is detailed below.
Performance measurements were primarily used to assess the model’s ability to identify DDoS attacks and allocate bandwidth in VANET situations. From
Table 3, it is shown that the proposed modified machine learning-based hybrid optimization technique is more effective compared with existing approaches. In node 60, the proposed methodology attained energy consumption of 0.35 J, delay ratio of 50, and drop ratio of 14.6785. In addition, the suggested approach attained an efficiency of 1710 in comparison with the existing method that attained efficiency of 794.
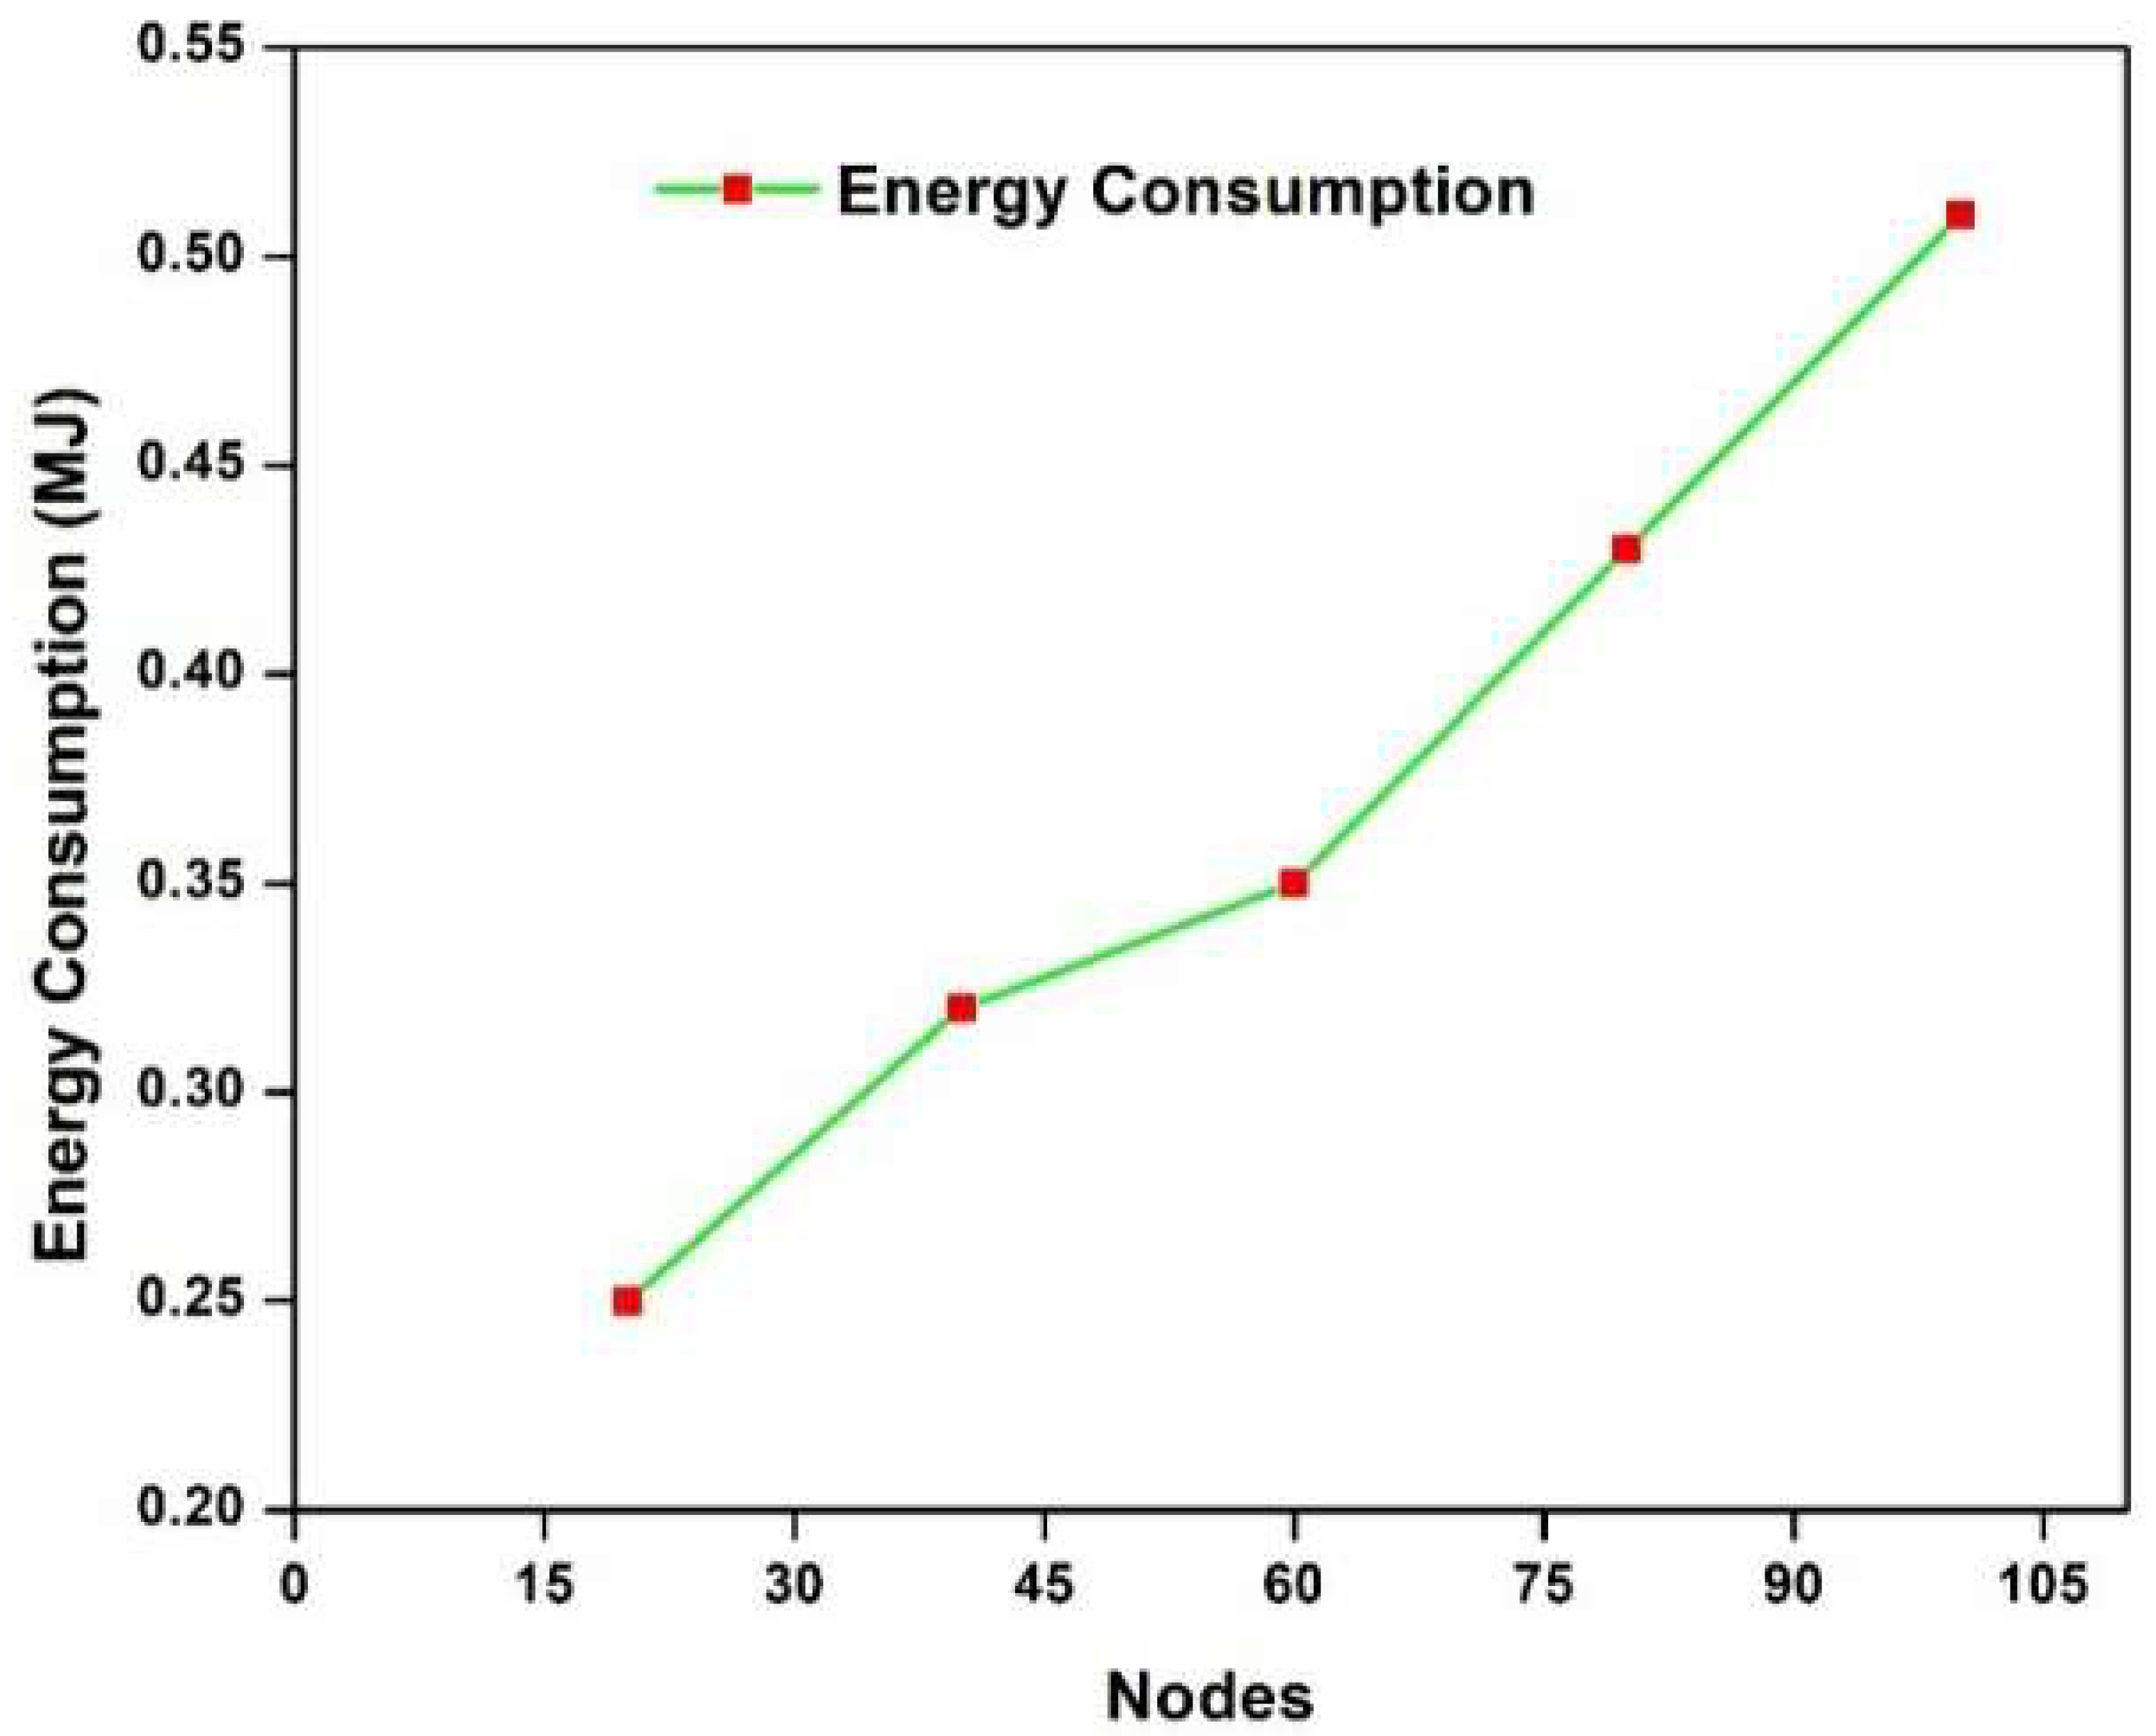
The total energy consumption of the proposed approach is shown in
Figure 8, based on the data in
Table 3. The rate of energy consumption of each node is noted. At node 100, the energy consumption of 0.5 is habited. The increase in nodes is accompanied with an increase in energy consumption.
From
Table 4, the energy consumption of the proposed method is tabulated at each node with the data set. Nodes with data set values are marked in
Table 4.
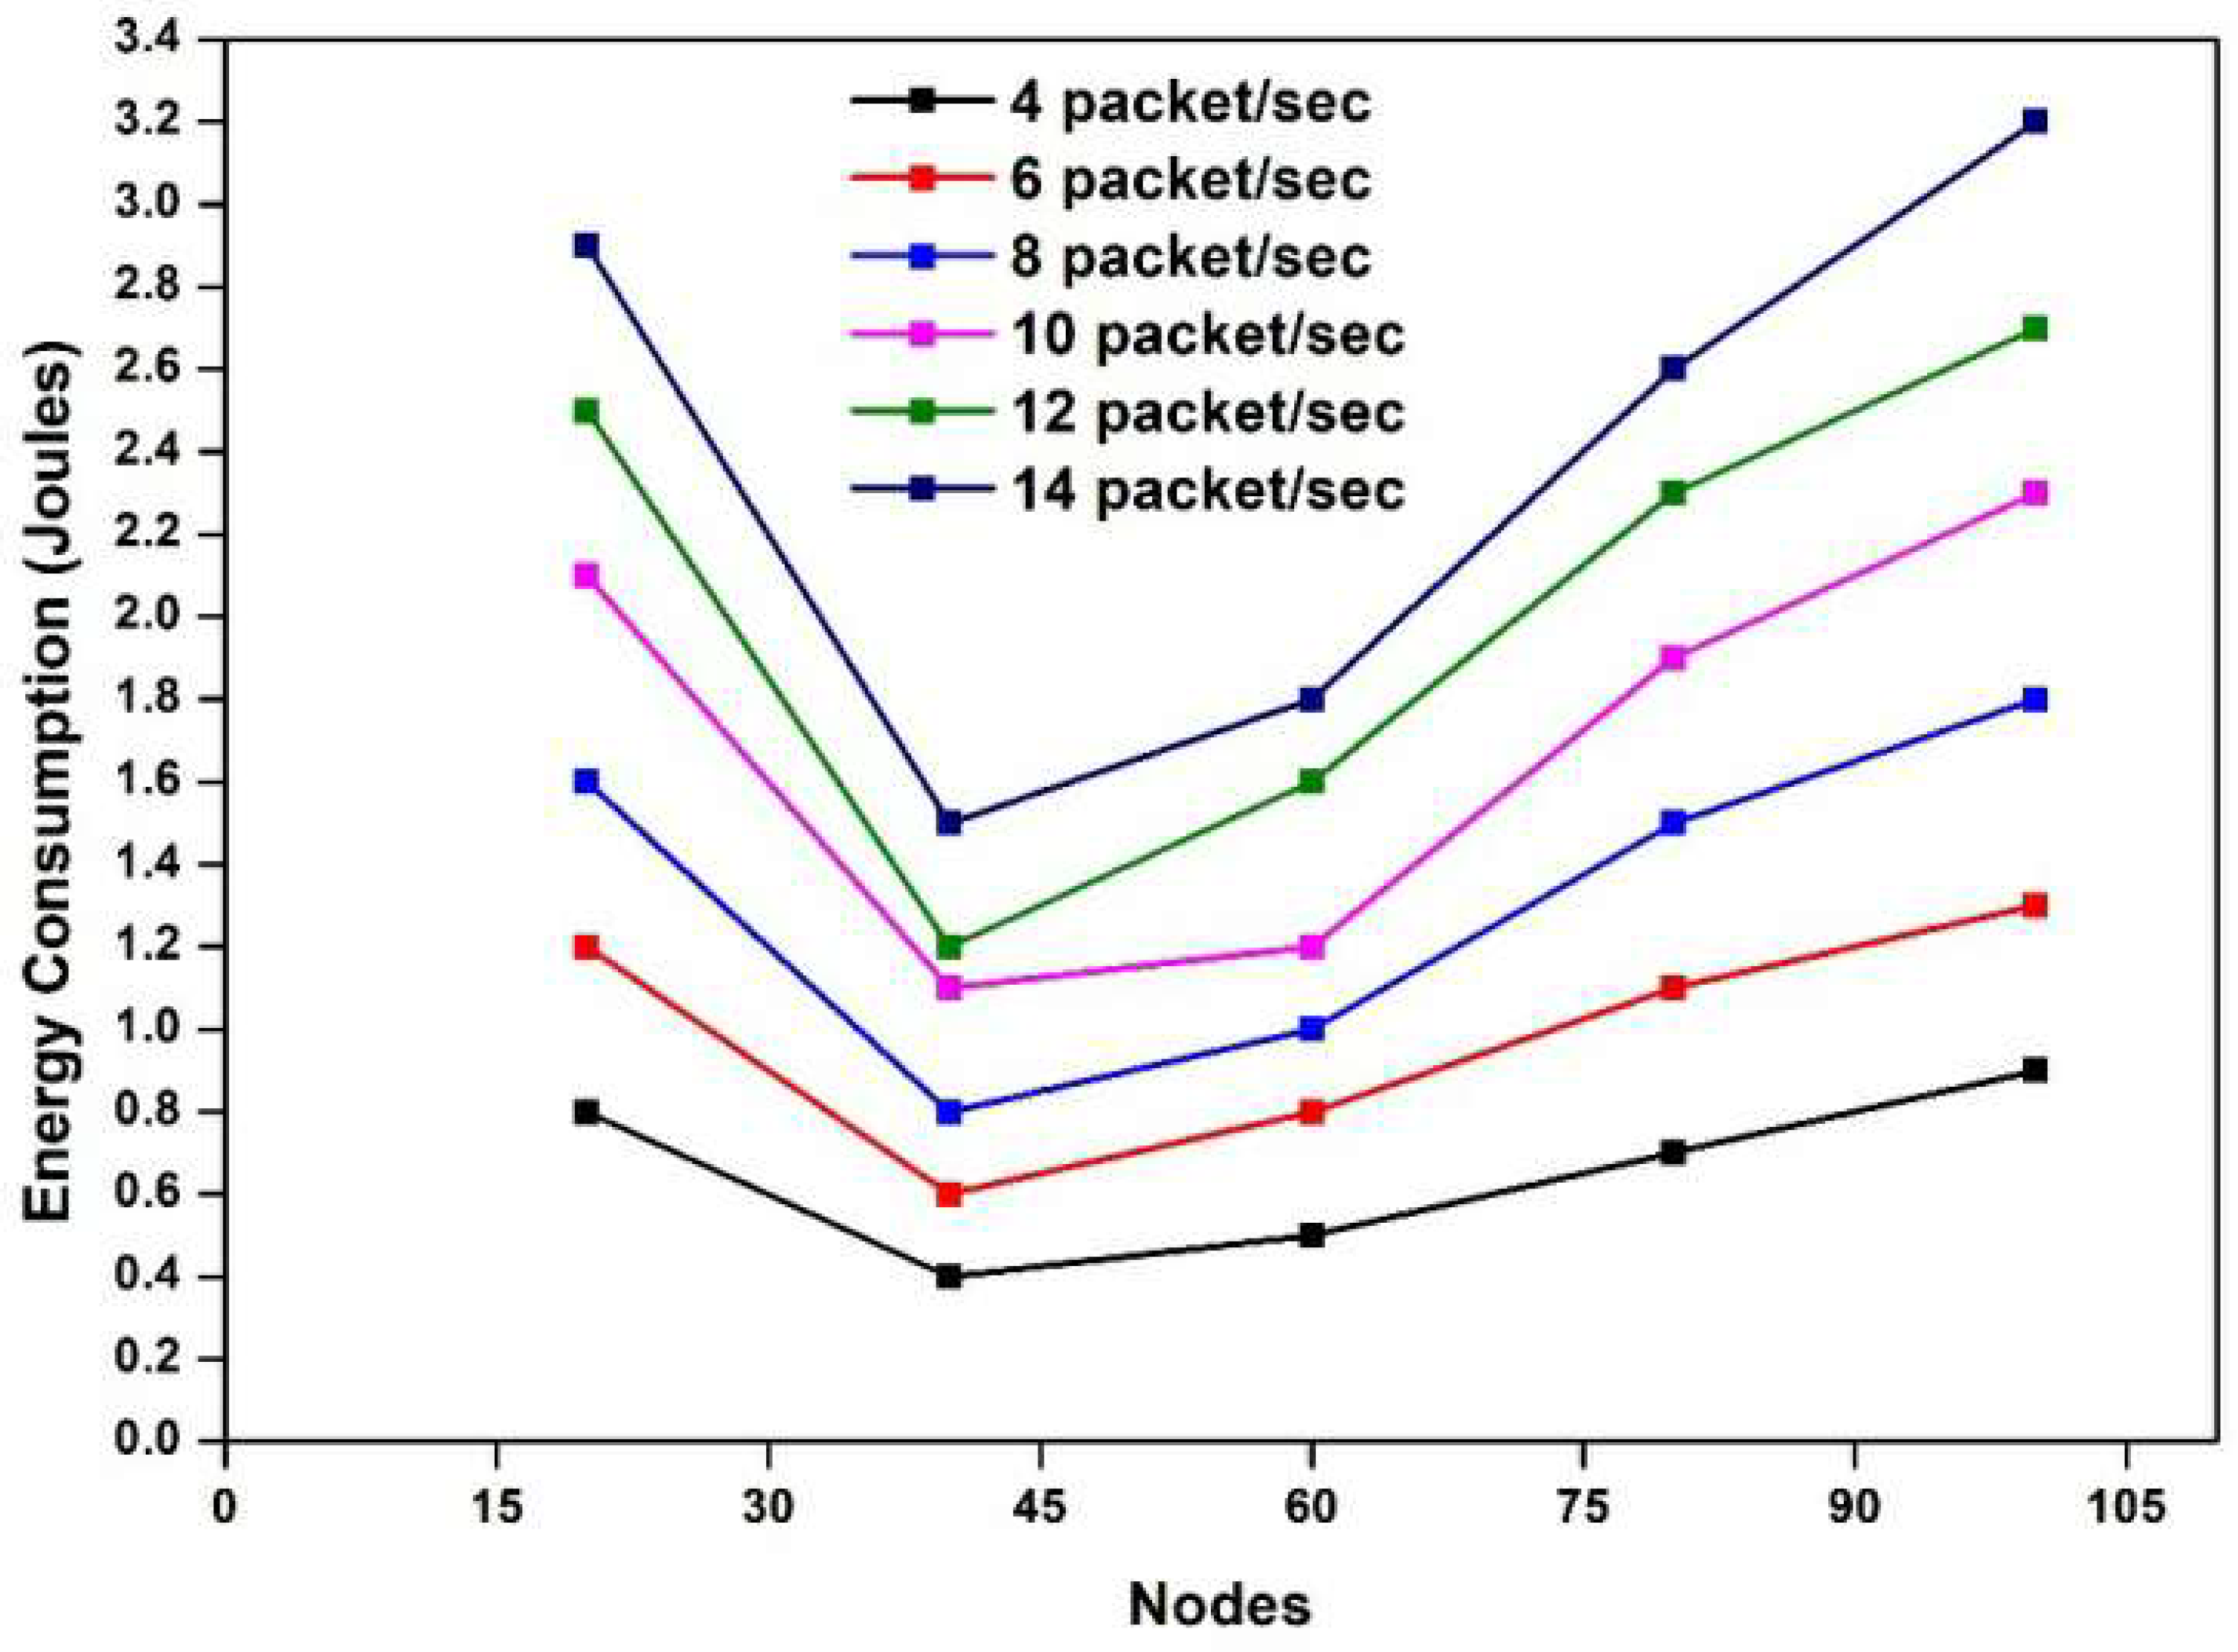
Figure 9 shows the data rate-based energy consumption ratio of the suggested approach. If the data packet rates are high, the energy is at a peak; if not, the energy produces lower data rates. From
Table 4, we can see that at node 20, energy consumption is 0.8, obtained at a data rate of 4, 1.2 is attained at a data rate of 6, 1.6 is acquired in a data rate of 8, and 2.1 is obtained at a data rate of 10. At a data rate of 12, 2.5 is gained, and at a data rate of 14, energy consumption is 2.9. Similarly, in node 40, energy consumption is 0.4 at a data rate of 4, 0.6 at a data rate of 6, 0.8 at a data rate of 8, 1.1 at a data rate of 10, 1.2 at a data rate of 12, and 1.5 at a data rate of 14. Moreover, at node 60, energy consumption is 0.5 at a data rate of 4, 0.8 at a data rate of 6, 1.0 at a data rate of 8, 1.2 at a data rate of 10, 1.6 at a data rate of 12, and 1.8 at a data rate of 14. In addition, at node 80, energy consumption is 0.7 at a data rate of 4, 1.1 at a data rate of 6, 1.5 at a data rate of 8, 1.9 at a data rate of 10, 2.3 at a data rate of 12, and 2.6 at a data rate of 14. Furthermore, at node 100, energy consumption is 0.9 at a data rate of 4, 1.3 at a data rate of 6, 1.8 at a data rate of 8, 2.3 at a data rate of 10, 2.7 at a data rate of 12, and 3.2 at a data rate of 14.
The overall network lifetime of the suggested method from
Table 3 is plotted and detailed in
Figure 10.
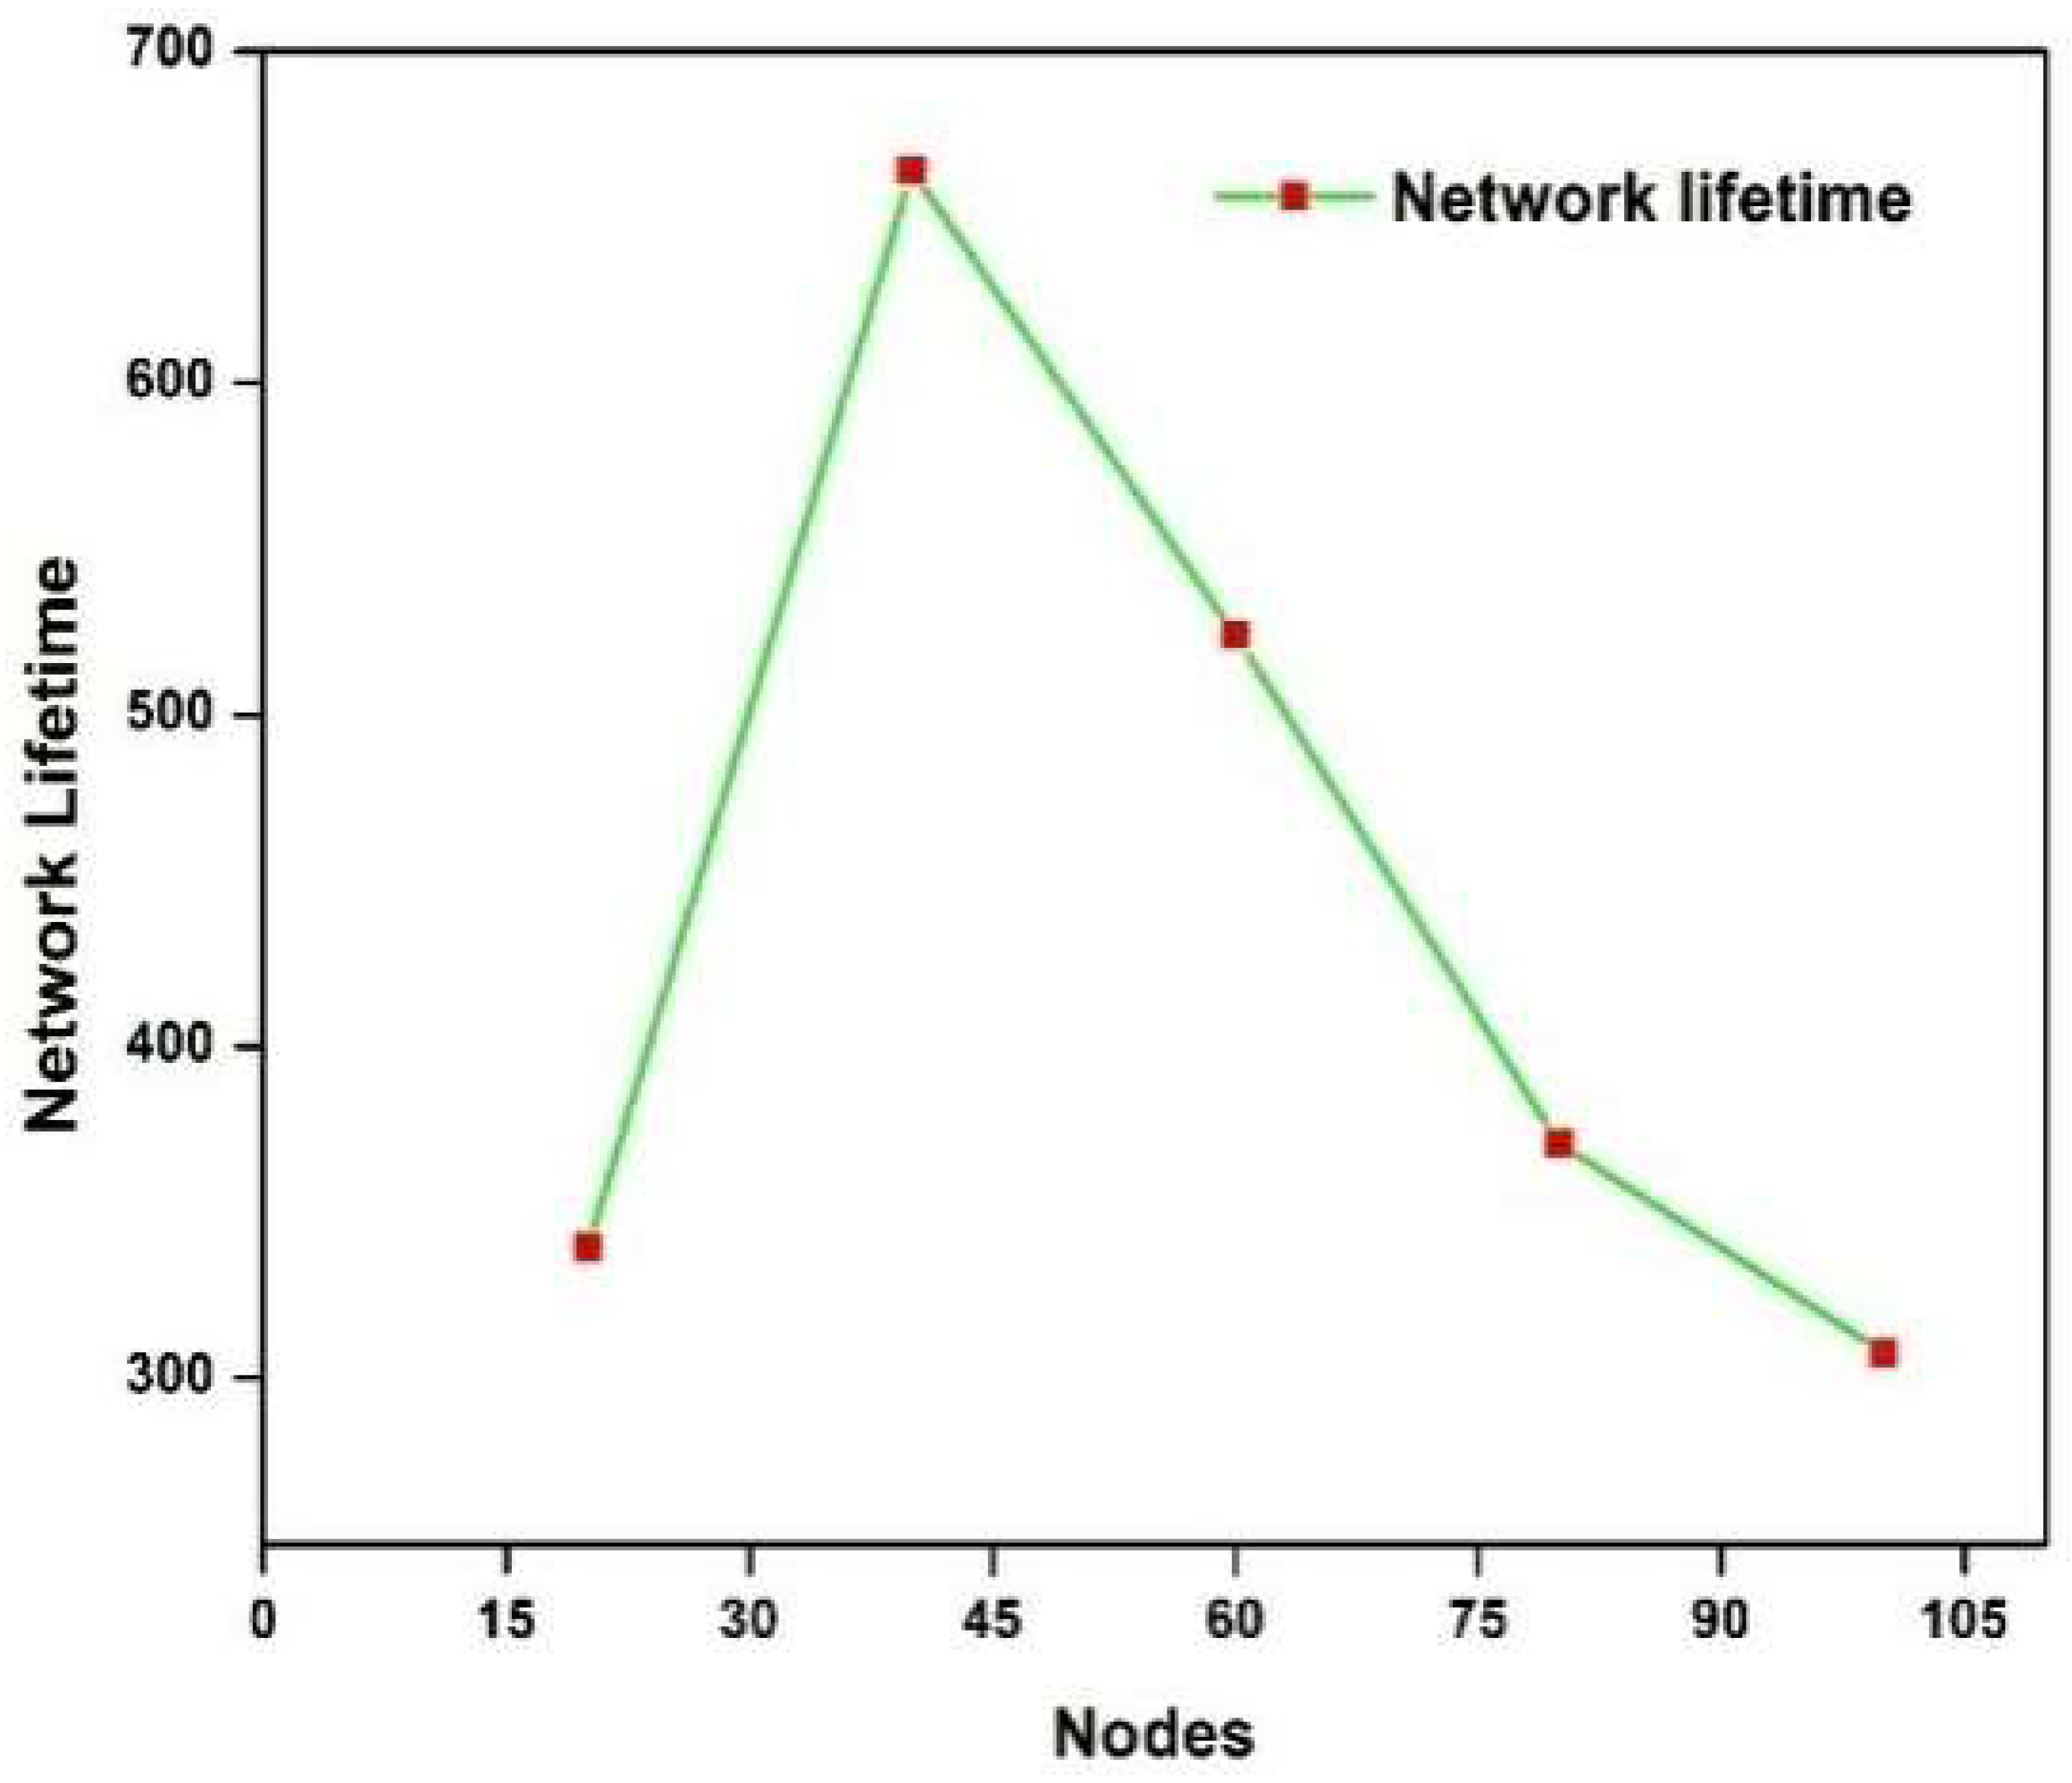
The lifetime of the network of the suggested approach is shown in
Figure 10. The lifetime of the network for each node was noted. At node 100, the network lifetime of 307.71 was habited. The increase in nodes was accompanied with an increase in network lifetime.
From
Table 5, the network lifetime of the proposed method was tabulated at each node with the data set. Nodes with data set values are marked in the
Table 5.
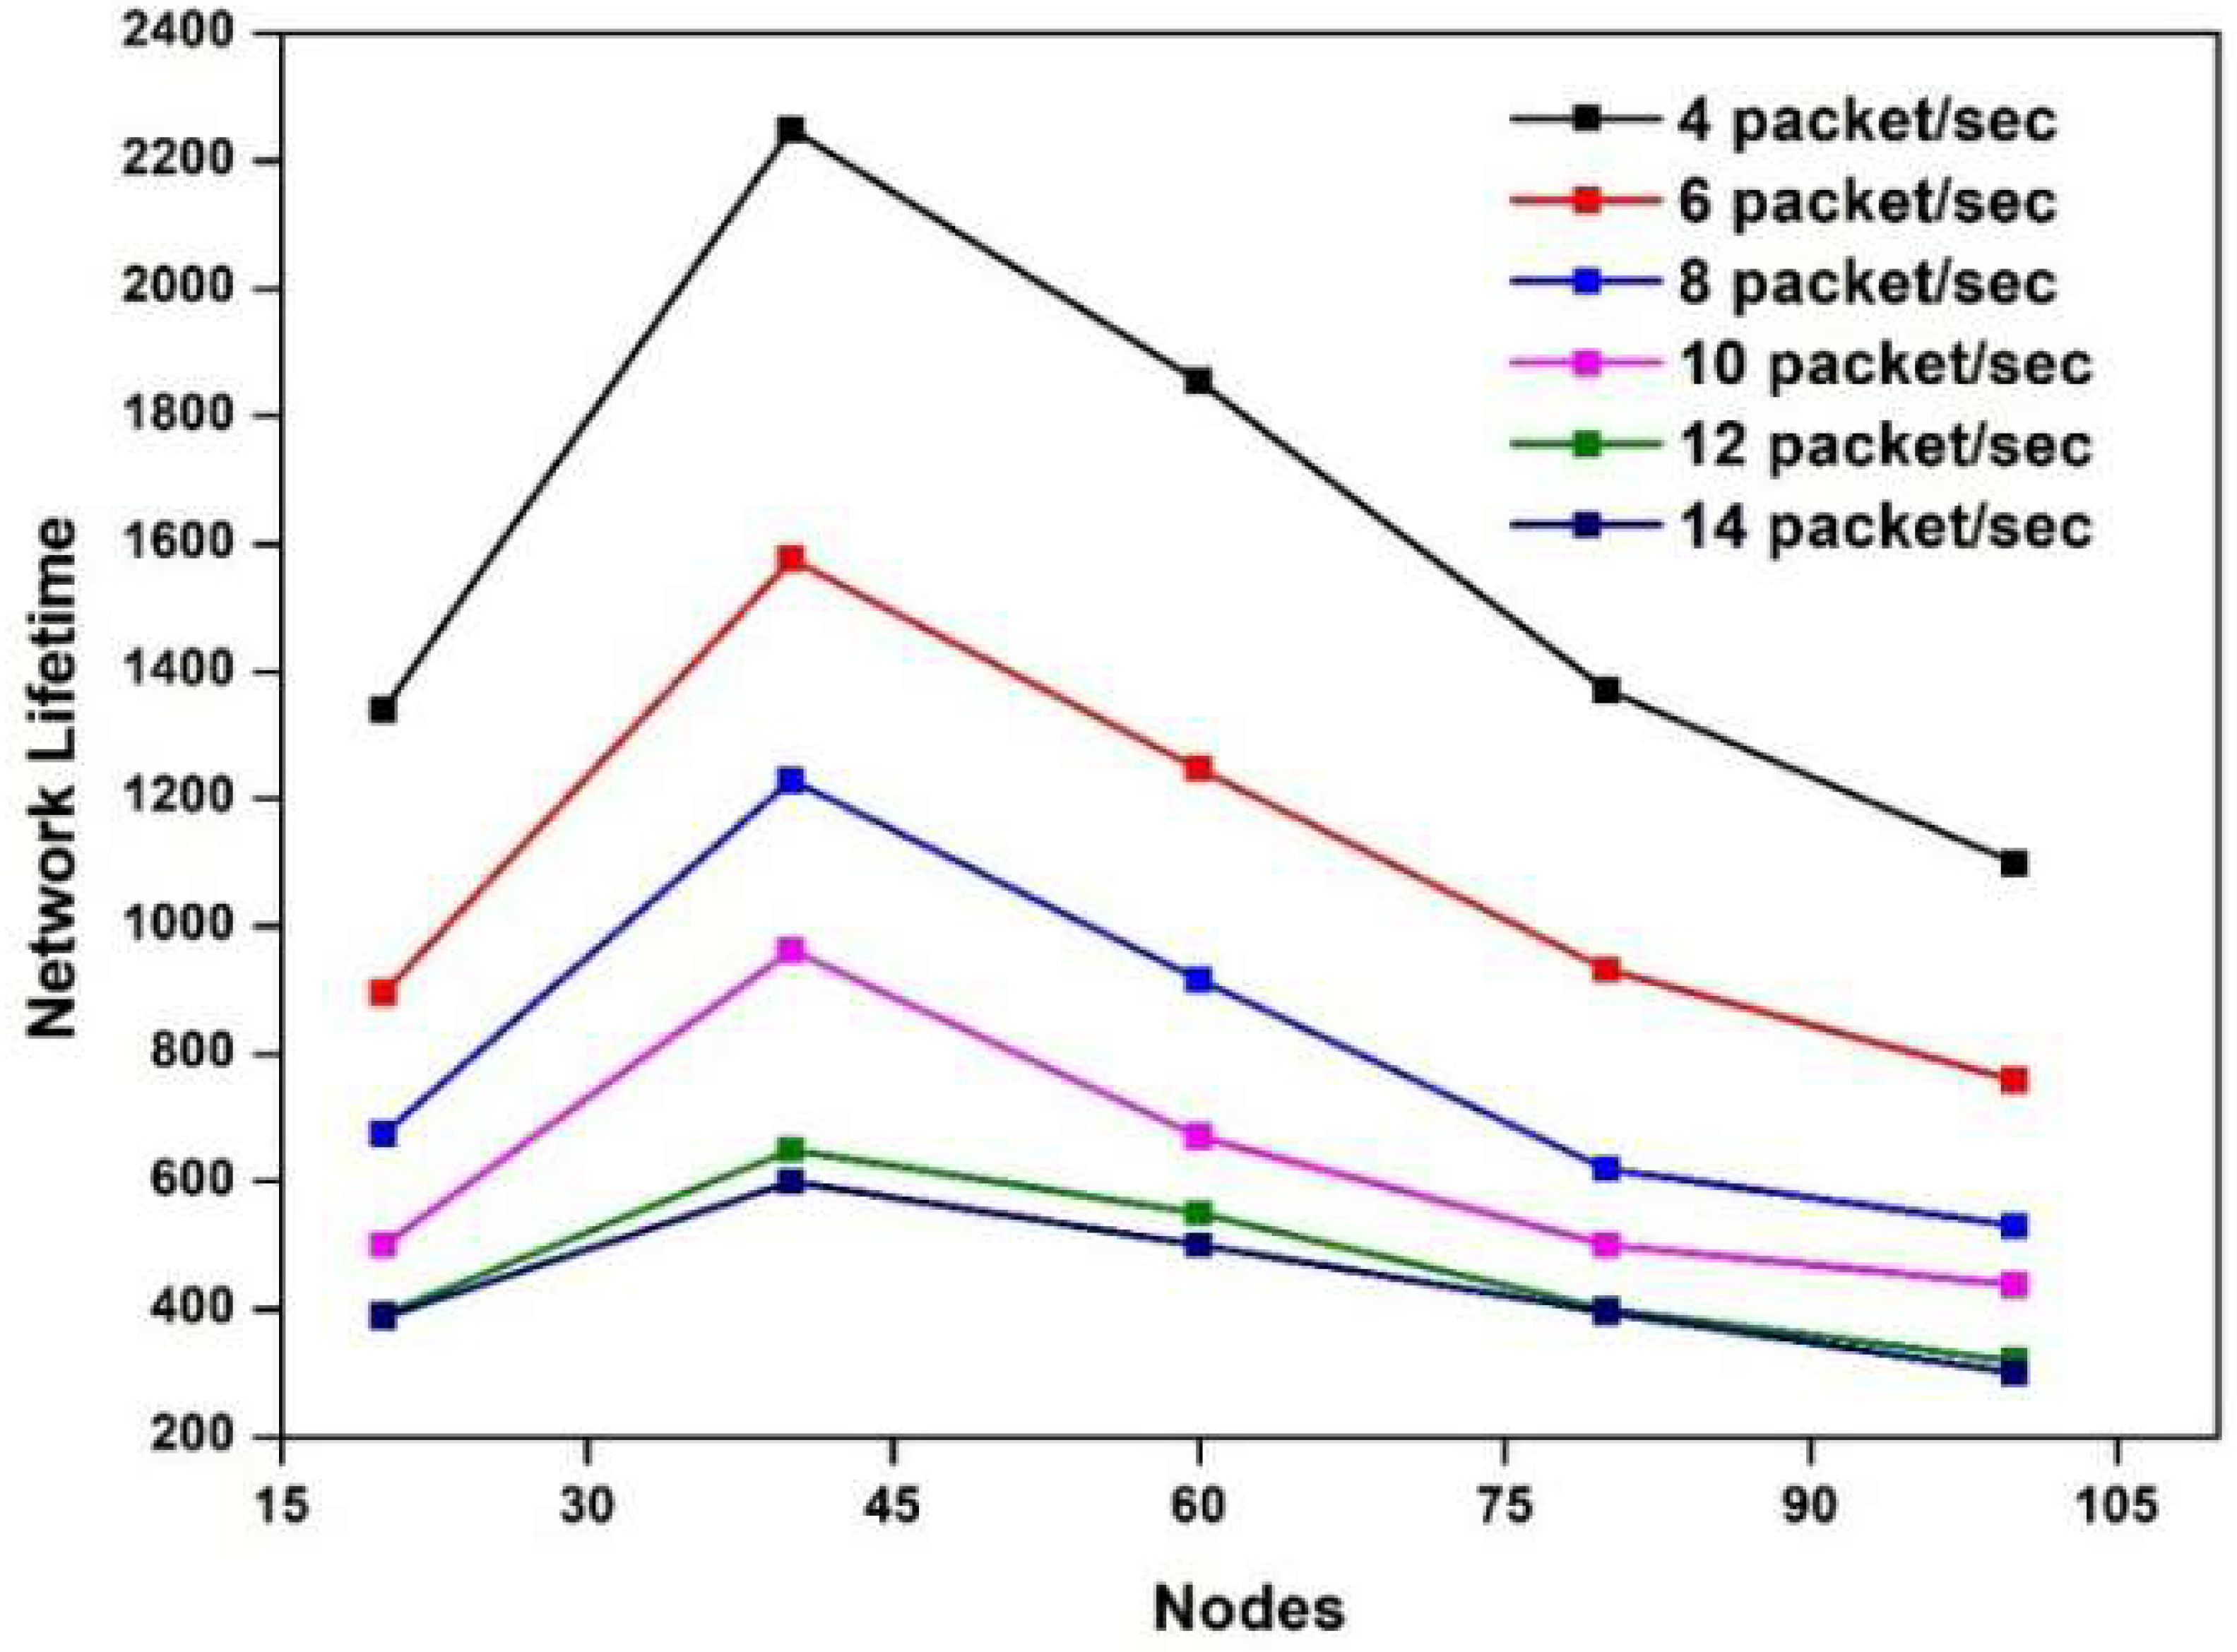
Figure 11 demonstrates the proposed system’s network lifetime. If the data packet rate is low, the network lifetime appears high. From
Table 5, we can see that at node 20, the network lifetime of 1339.5 is obtained at a data rate of 4, 896.1 is attained at a data rate of 6, 675.3 is acquired at a data rate of 8, and 500.2 is accomplished at a data rate of 10. At a data rate of 12, 392.2 is gained, and at a data rate of 14, network lifetime is 388. Similarly, in node 40, the network lifetime is 2250 at a data rate of 4, 1575 at a data rate of 6, 1230.1 at a data rate of 8, 963 at a data rate of 10, 650 at a data rate of 12, and 600 at a data rate of 14. Moreover, at node 60, network lifetime is 1854.2 at a data rate of 4, 1246.5 at a data rate of 6, 916.3 at a data rate of 8, 669.8 at a data rate of 10, 550 at a data rate of 12, and 500 at a data rate of 14. In addition, at node 80, network lifetime is 1370.2 at a data rate of 4, 932.6 at a data rate of 6, 619.1 at a data rate of 8, 500.9 at a data rate of 10, 400.2 at a data rate of 12, and 395.4 at a data rate of 14. Furthermore, at node 100, the network lifetime is 1100 at a data rate of 4, 759 at a data rate of 6, 530.8 at a data rate of 8, 438.5 at a data rate of 10, 318 at a data rate of 12, and 300 at a data rate of 14.
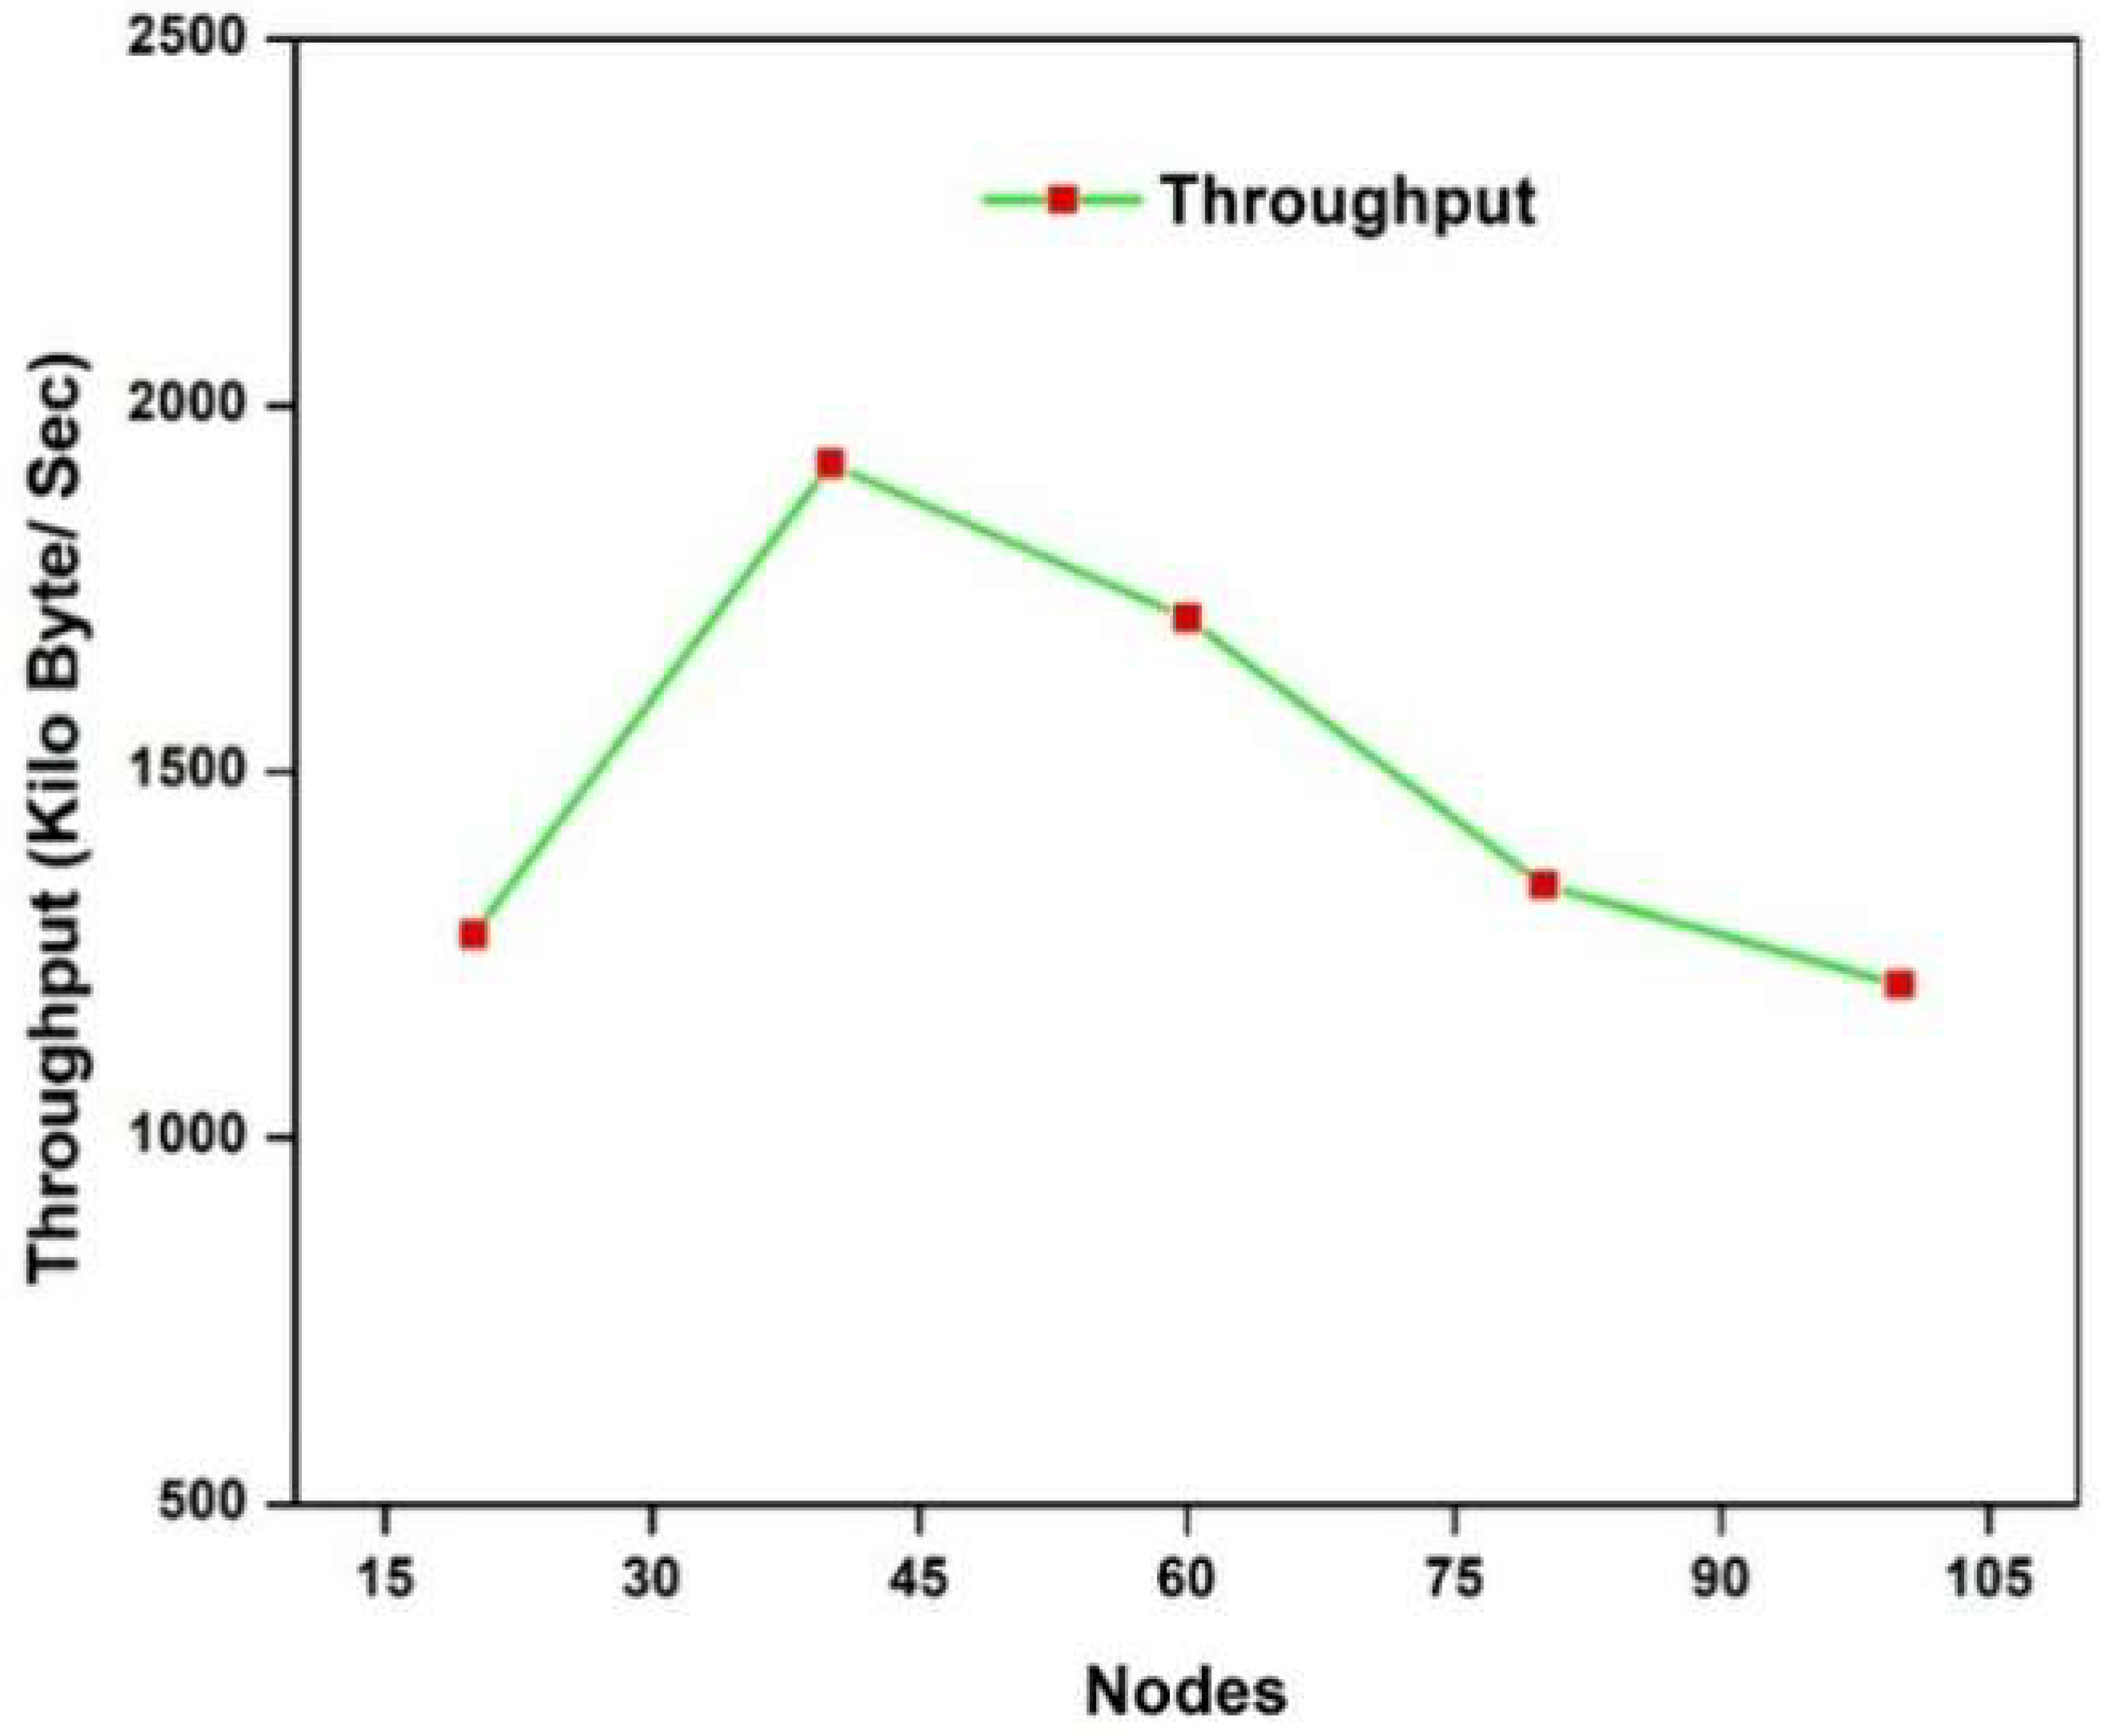
The overall efficiency(throughput) of the suggested approach is shown in
Figure 12. The rate of throughput of each node is noted. At node 100, a throughput of 1209 was habited. An increase in nodes is accompanied with an increase in throughput.
In
Table 6, the throughput of the suggested approach is tabulated at each node with the data set. Nodes with data set values are marked in
Table 6.
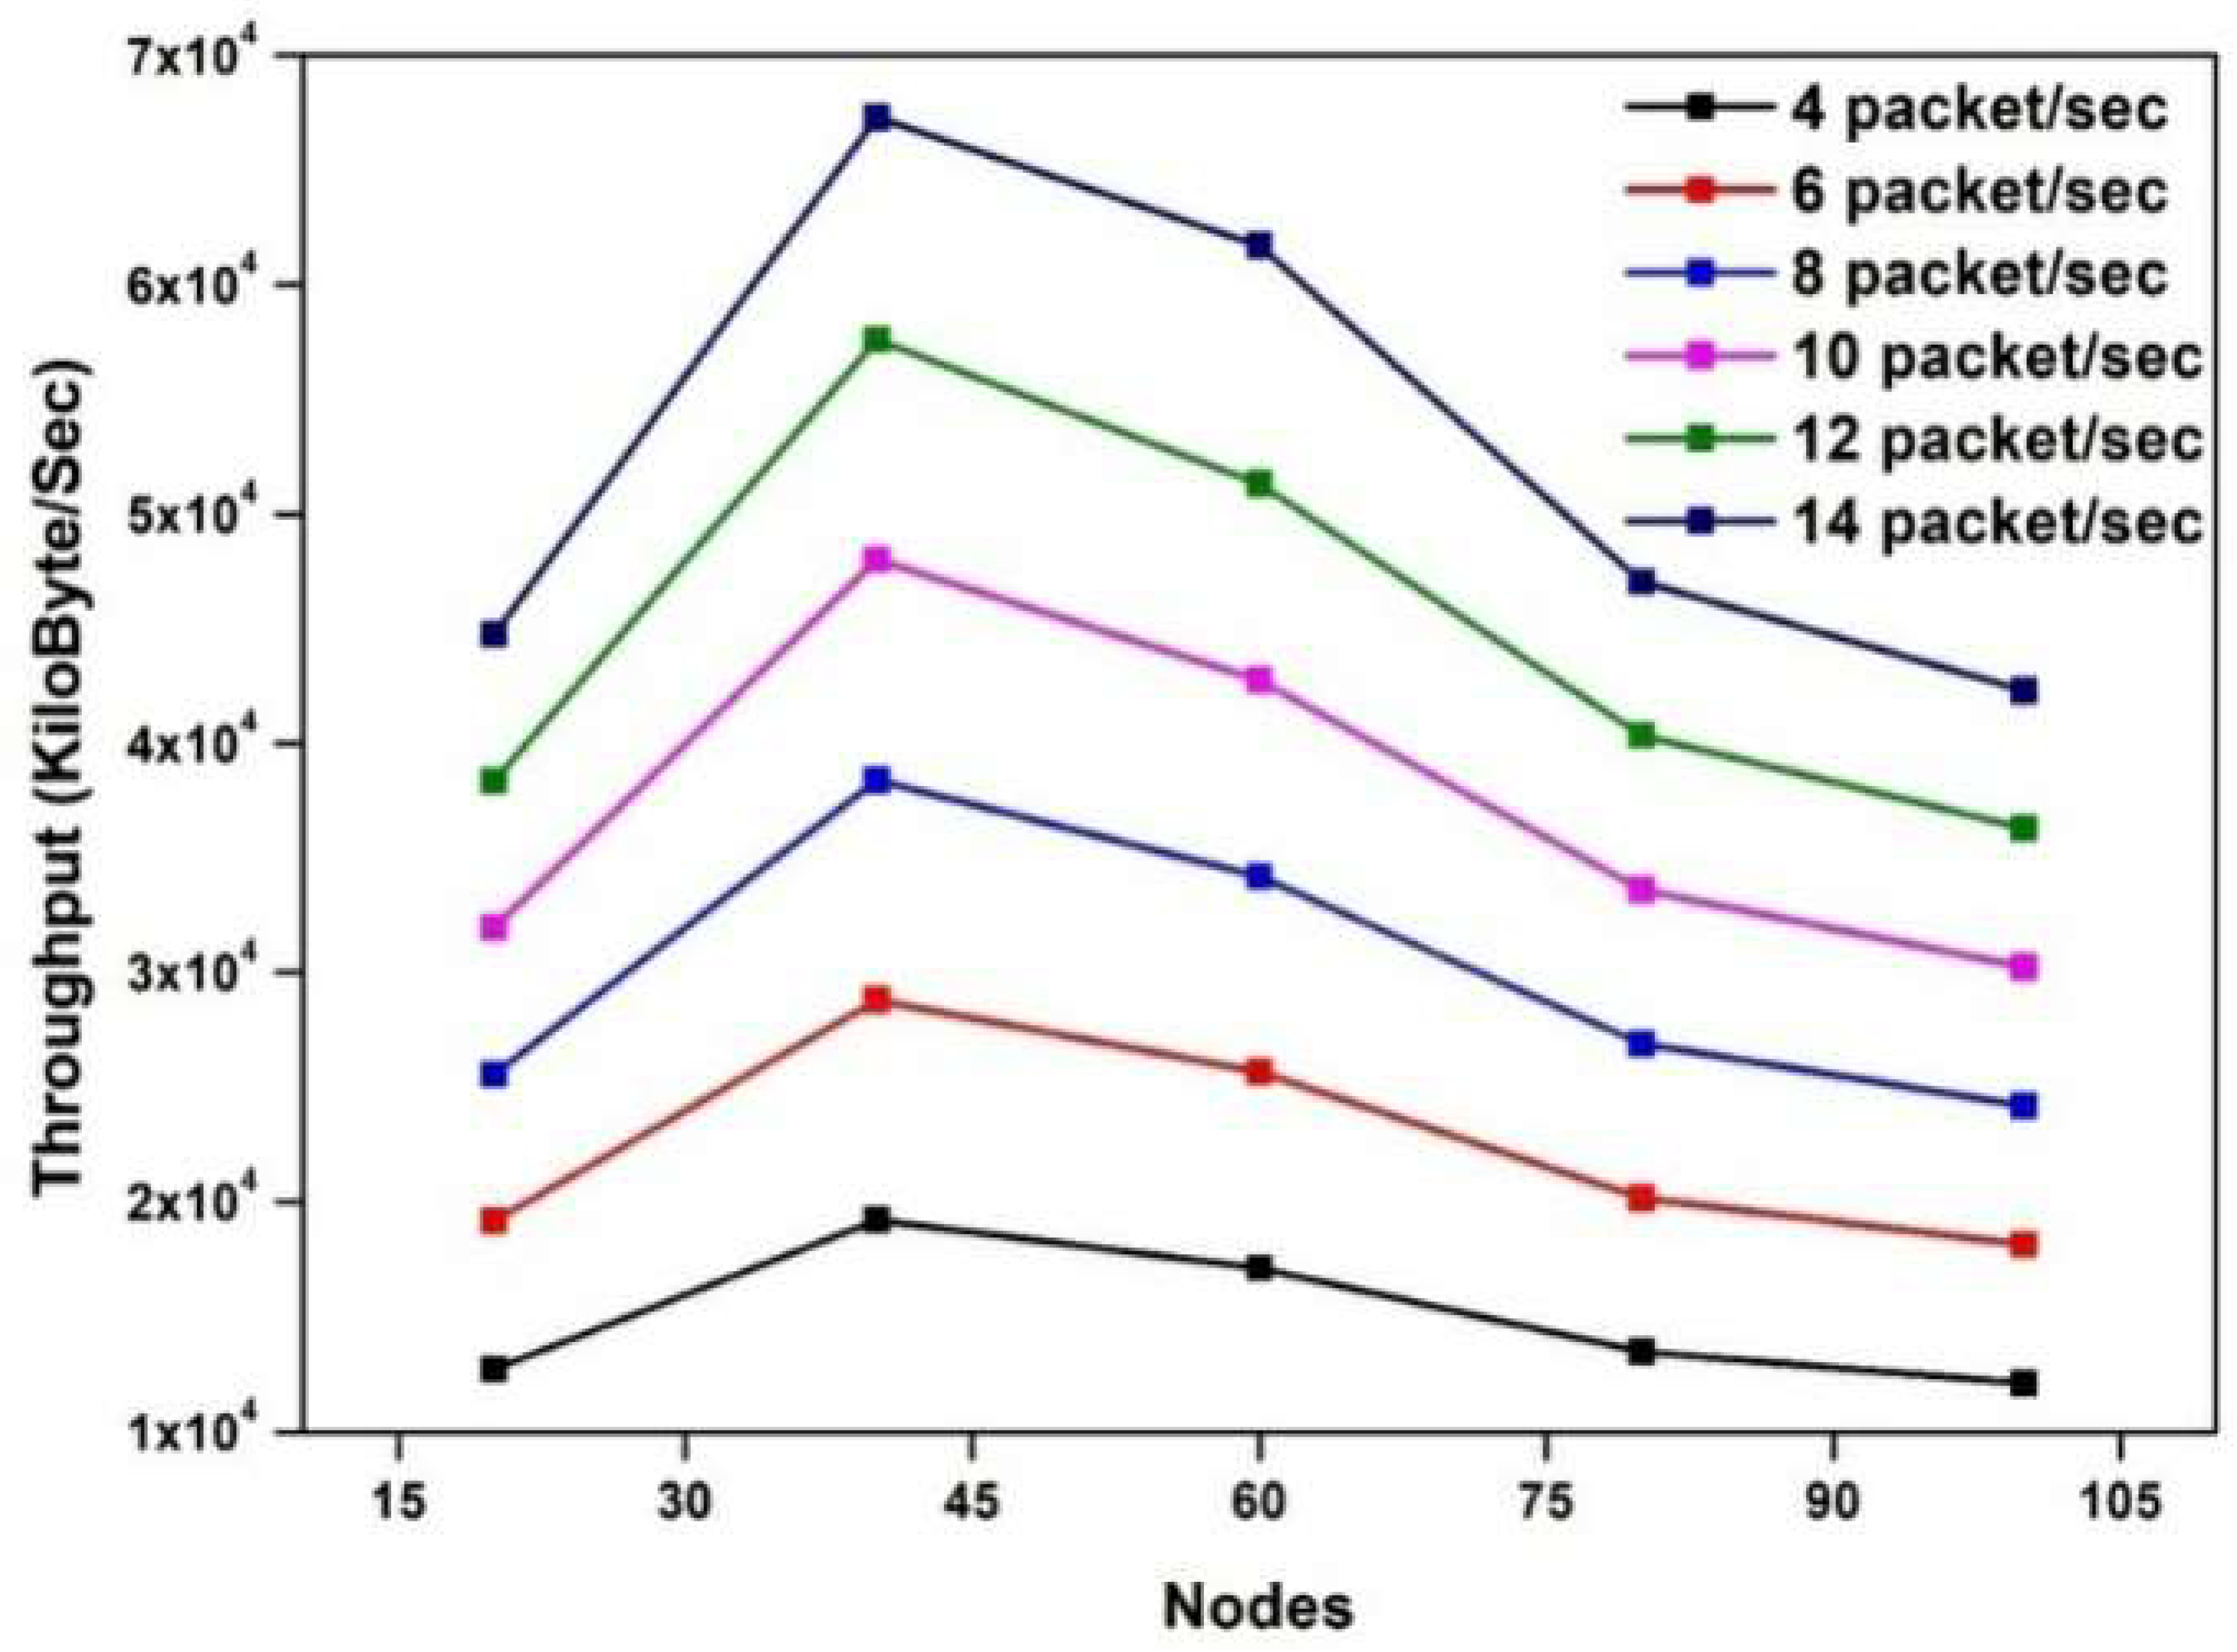
Figure 13 demonstrates the throughput ratio of the proposed system. If the data packet rates were low, then the throughput ratio also decreased. The throughput of the proposed technique was reached by 42,320 in node 100 at a data rate of 14 packets/sec. At node 20, 12,700 throughputs were obtained at a data rate of 4. At node 20, 19,180 throughputs were attained at a data rate of 6. At node 20, 25,570 throughputs were acquired at a data rate of 8. At node 20, 31,960 throughputs were accomplished at a data rate of 10. At node 20, 38,350 throughputs were gained at a data rate of 12. At node 20, 44,740 throughputs were fetched at a data rate of 14. Similarly, in node 40, there were 19,200 throughputs at a data rate of 4, 28,800 throughputs at a data rate of 6, 38,400 throughputs at a data rate of 8, 48,000 throughputs at a data rate of 10, 57,600 throughputs at a data rate of 12, and 67,280 throughputs at a data rate of 14. At node 60, there were 17,100 throughputs at a data rate of 4, 25,650 throughputs at a data rate of 6, 34,200 throughputs at a data rate of 8, 42,750 throughputs at a data rate of 10, 51,300 throughputs at a data rate of 12, and 61,700 throughputs at a data rate of 14. In addition, at node 80, there were 13,450 throughputs at a data rate of 4, 20,170 throughputs at a data rate of 6, 26,890 throughputs at a data rate of 8, 33,620 throughputs at a data rate of 10, 40,340 throughputs at a data rate of 12, and 47,060 throughputs at a data rate of 14. Furthermore, at node 100, there were 12,090 throughputs at a data rate of 4, 18,140 throughputs at a data rate of 6, 24,180 throughputs at a data rate of 8, 30,230 throughputs at a data rate of 10, 36,280 throughputs at a data rate of 12, and 42,320 throughputs at a data rate of 14.
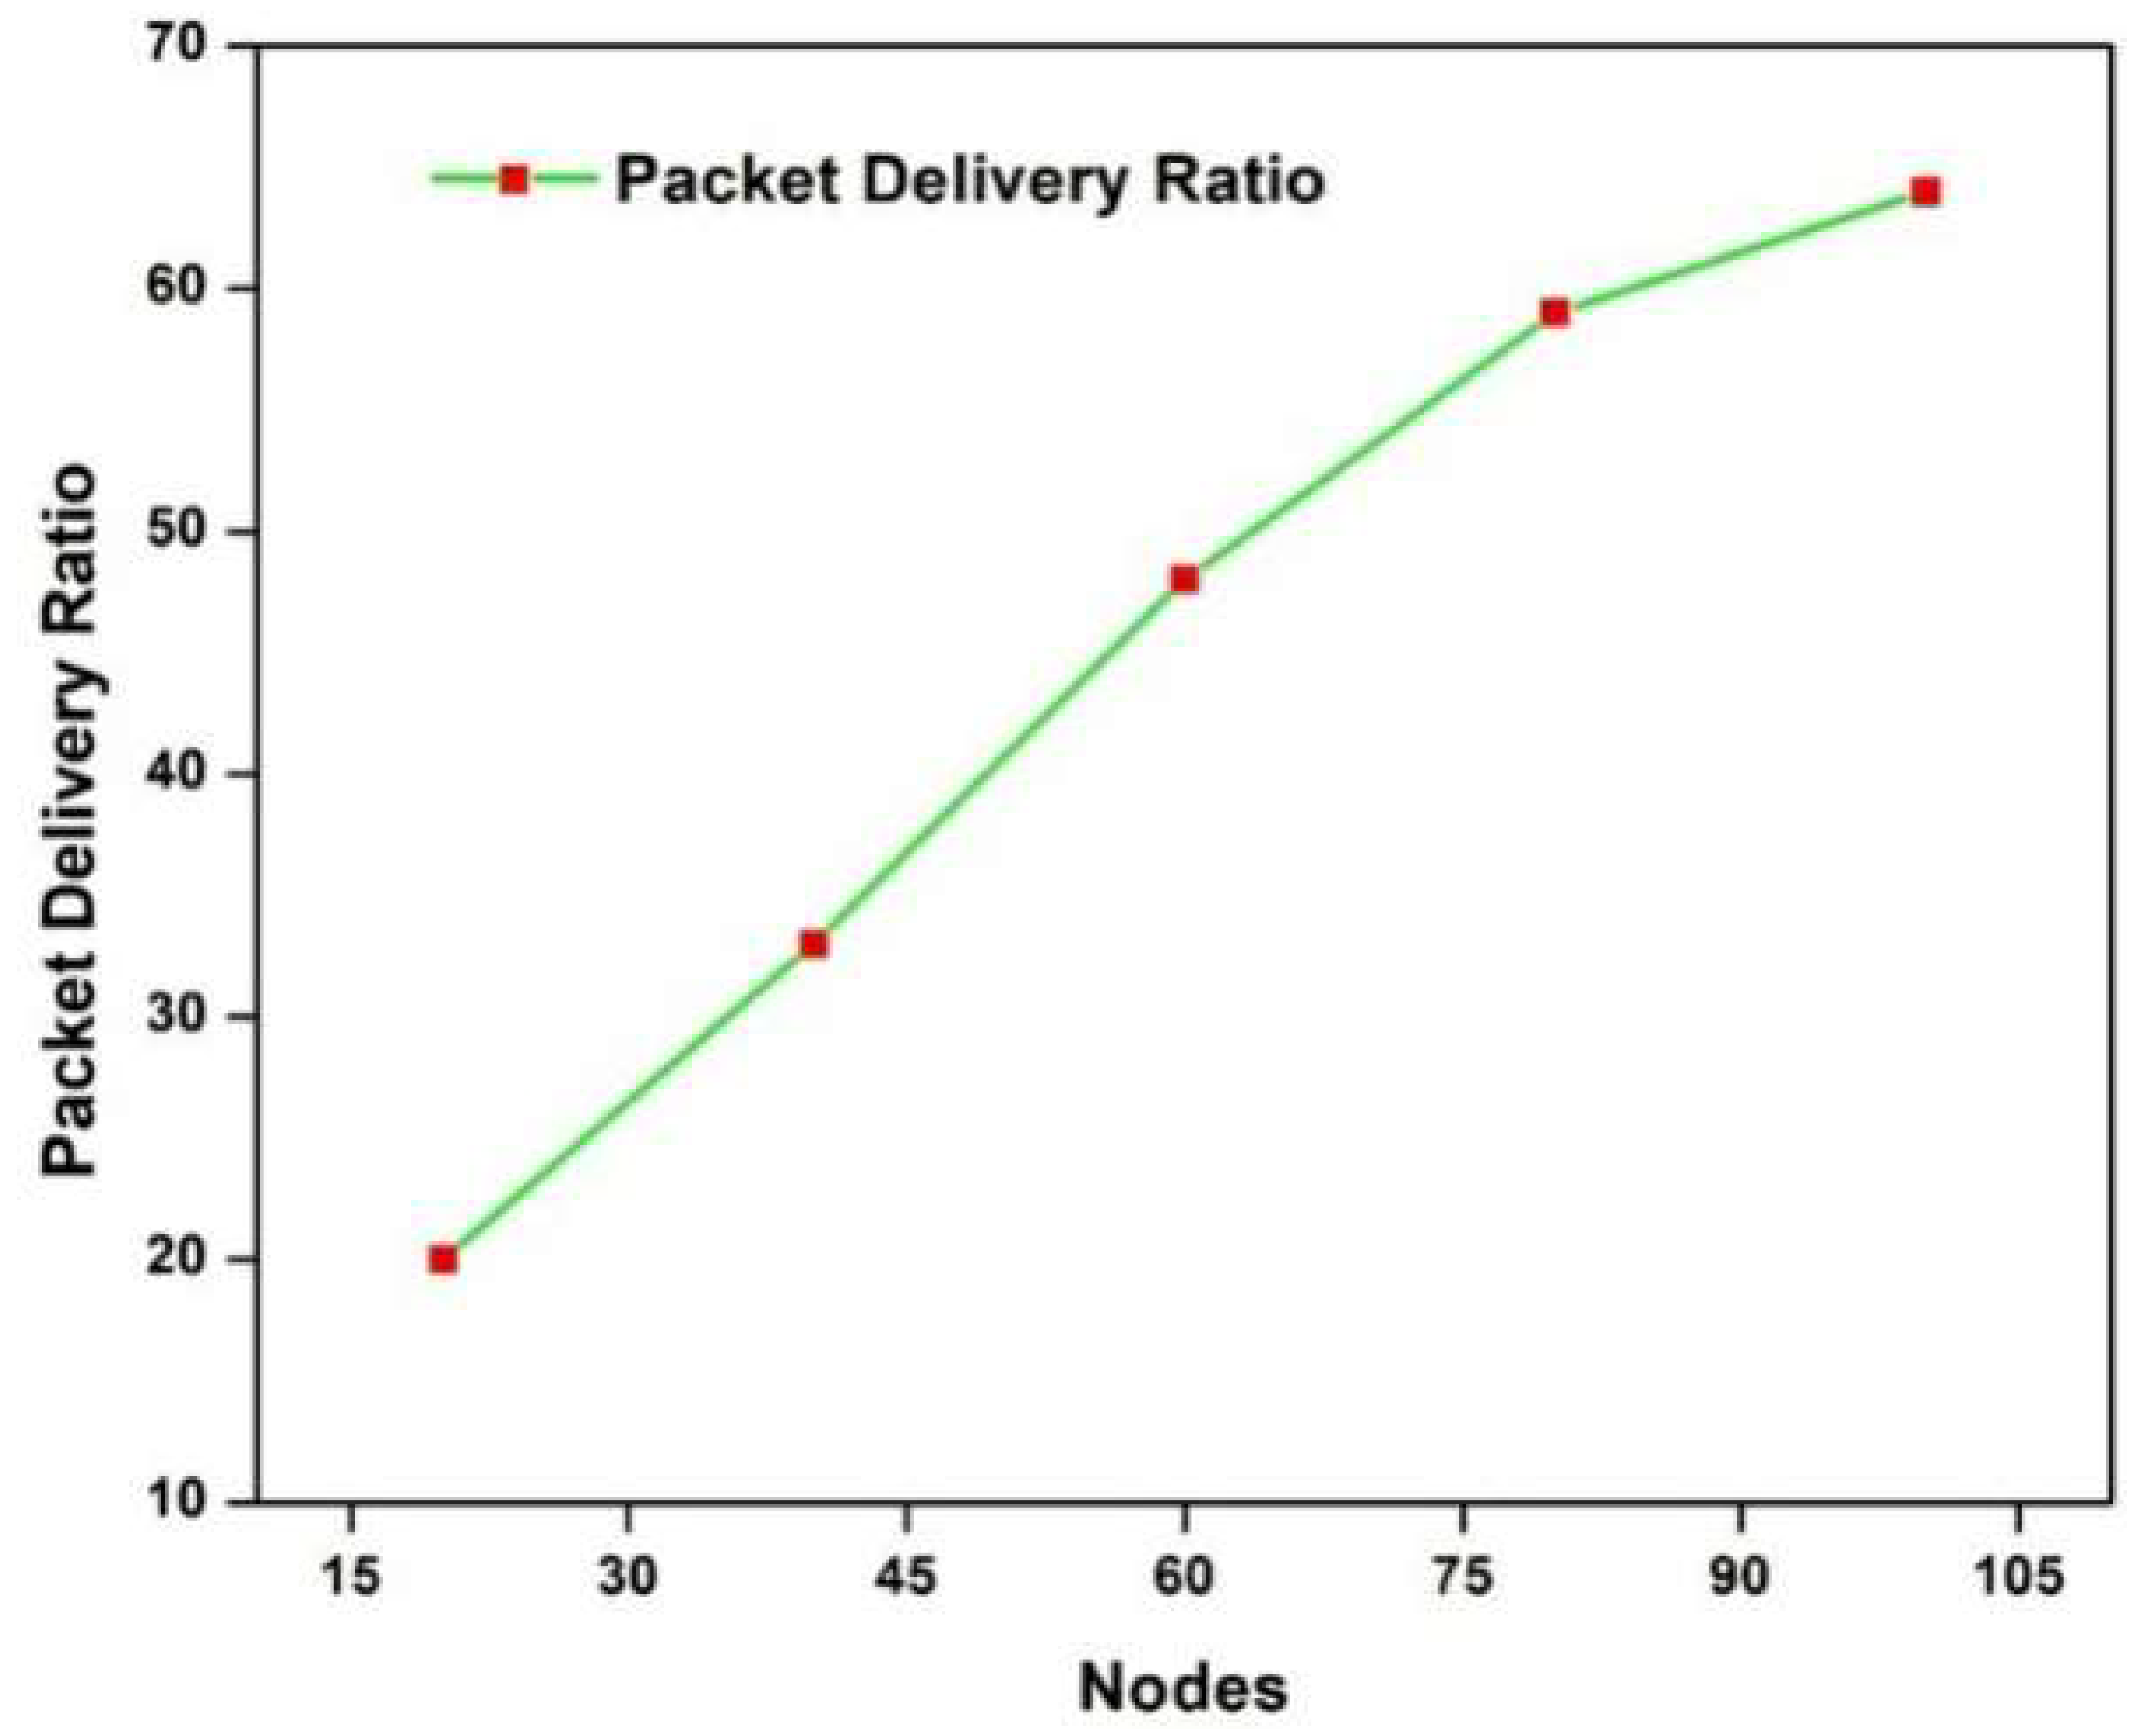
Figure 14 illustrates the packet delivery ratio. To optimize incoming and outgoing network packets, the PDR was evaluated to assess the process. In the VANET scenario, the packet deliver ratio represents the greater presentation of the system.
- (2)
PHASE 2:
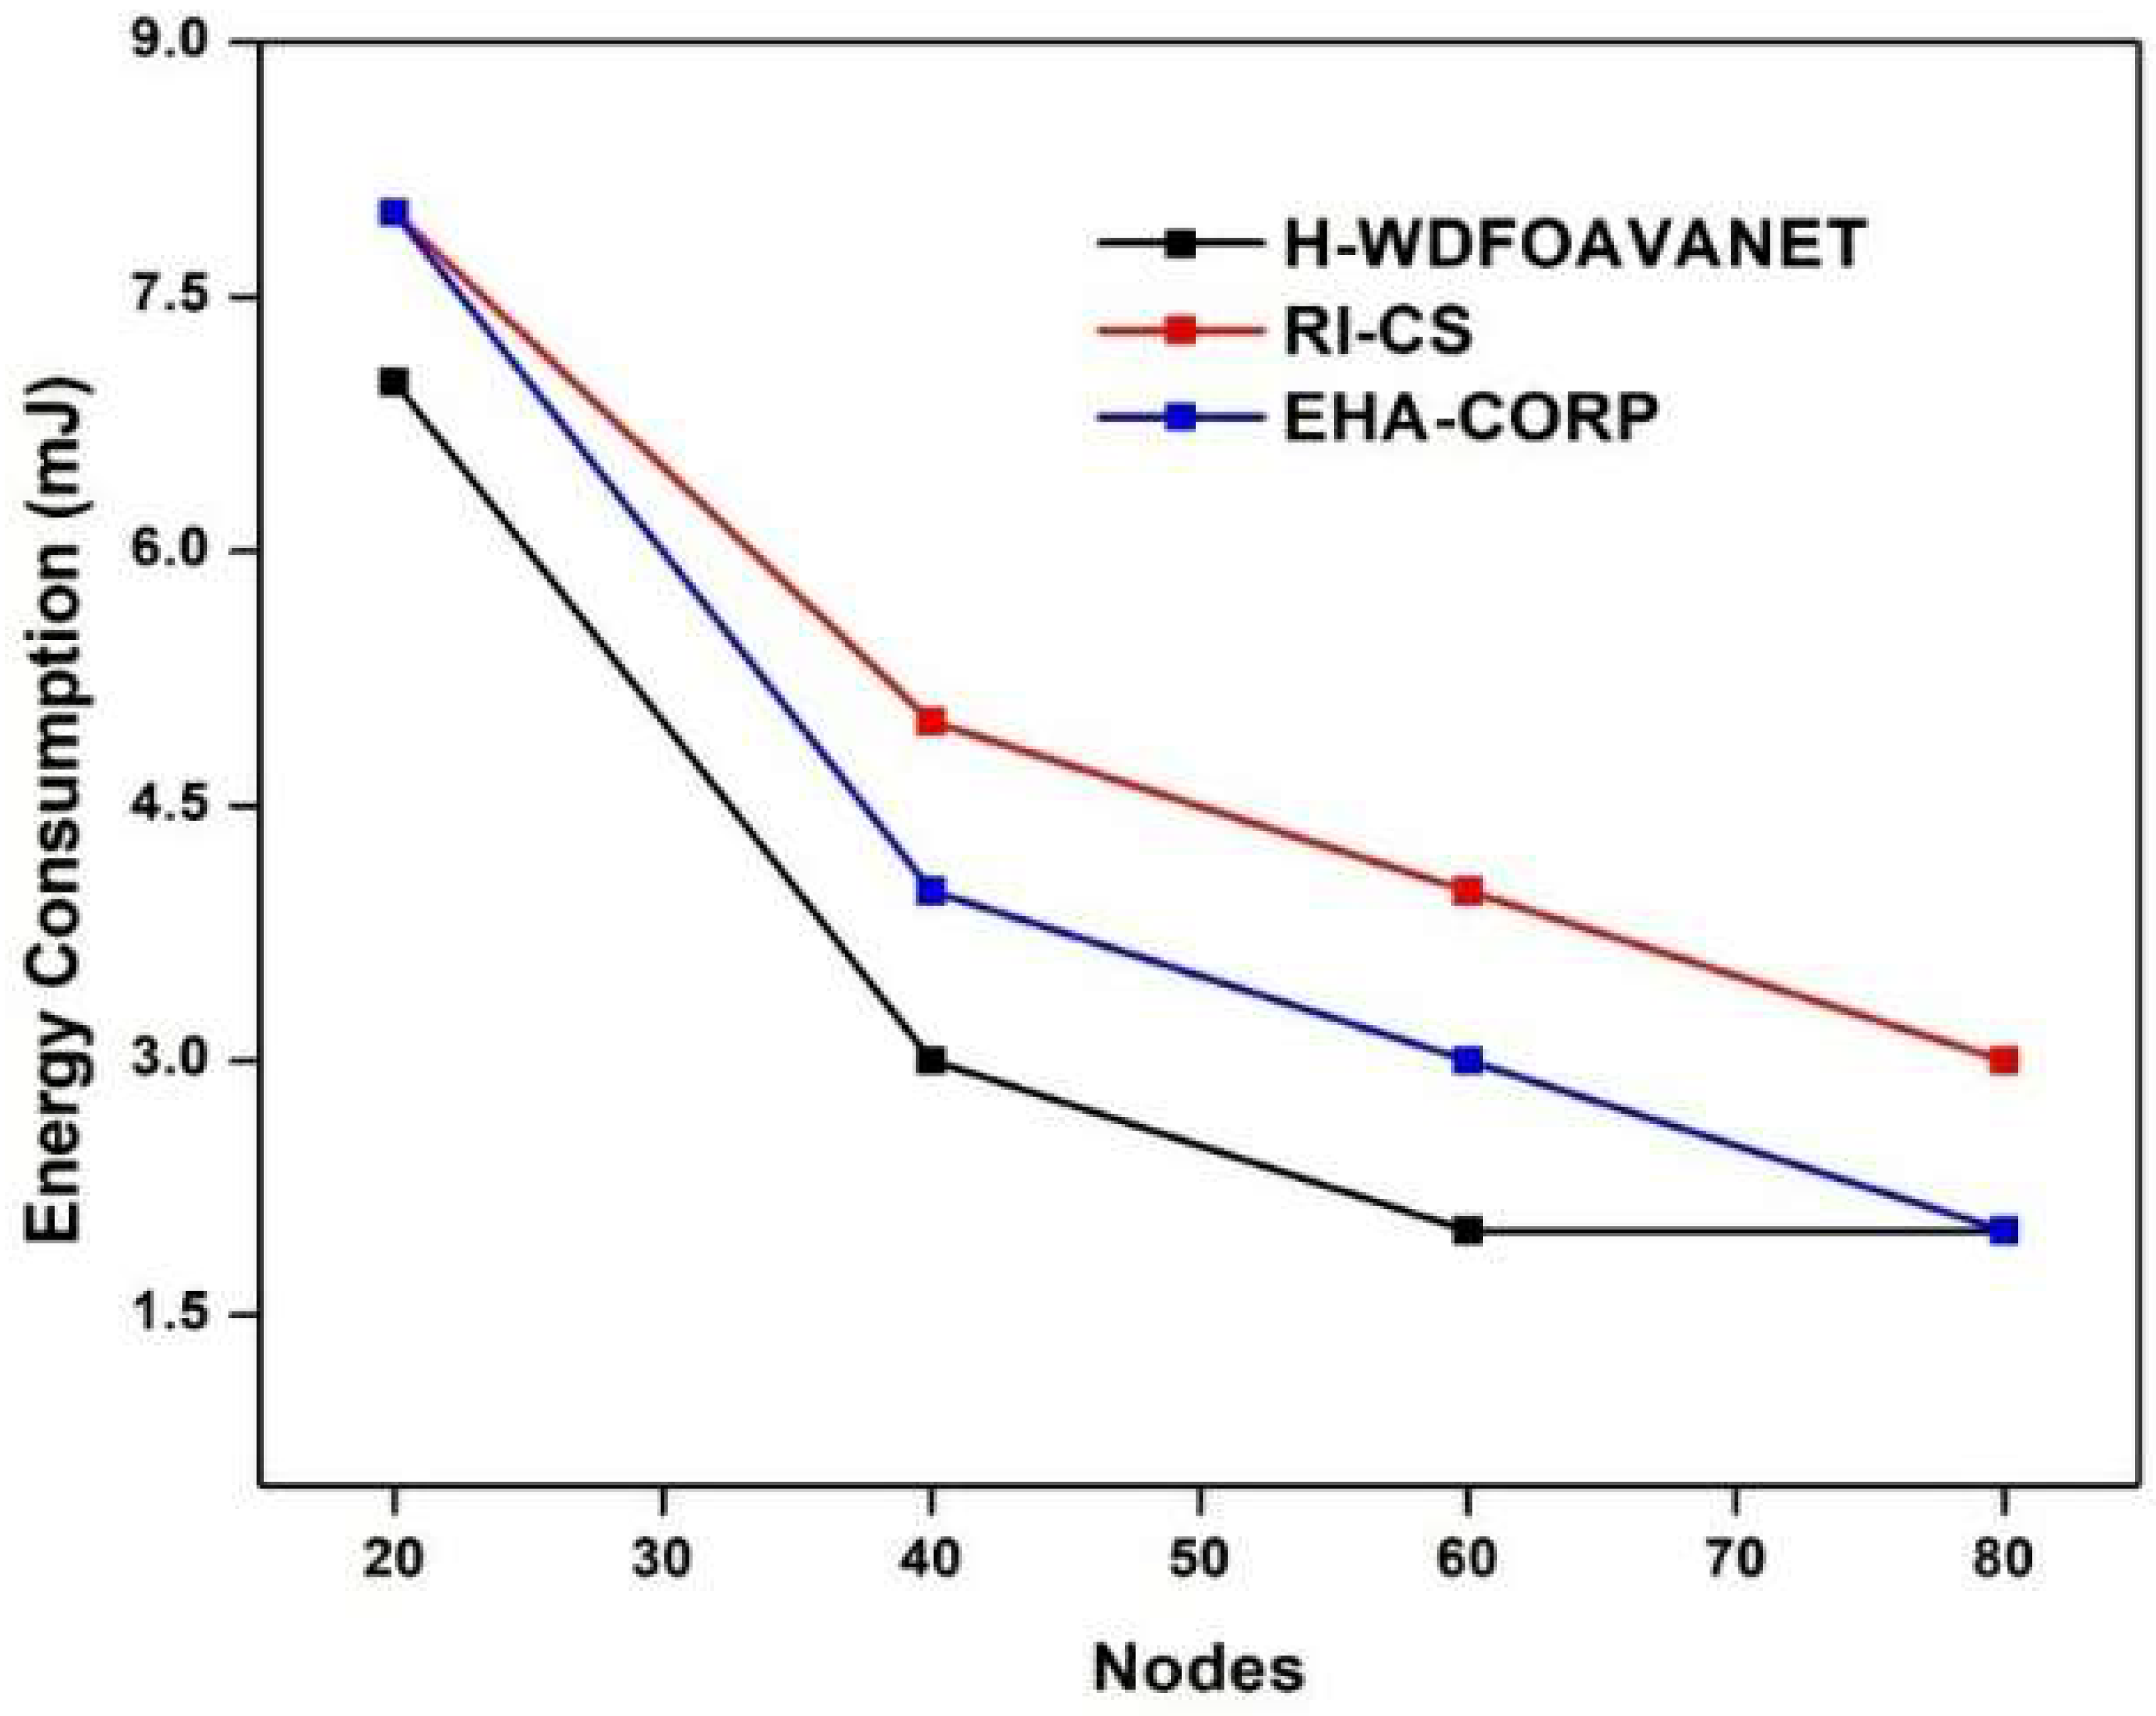
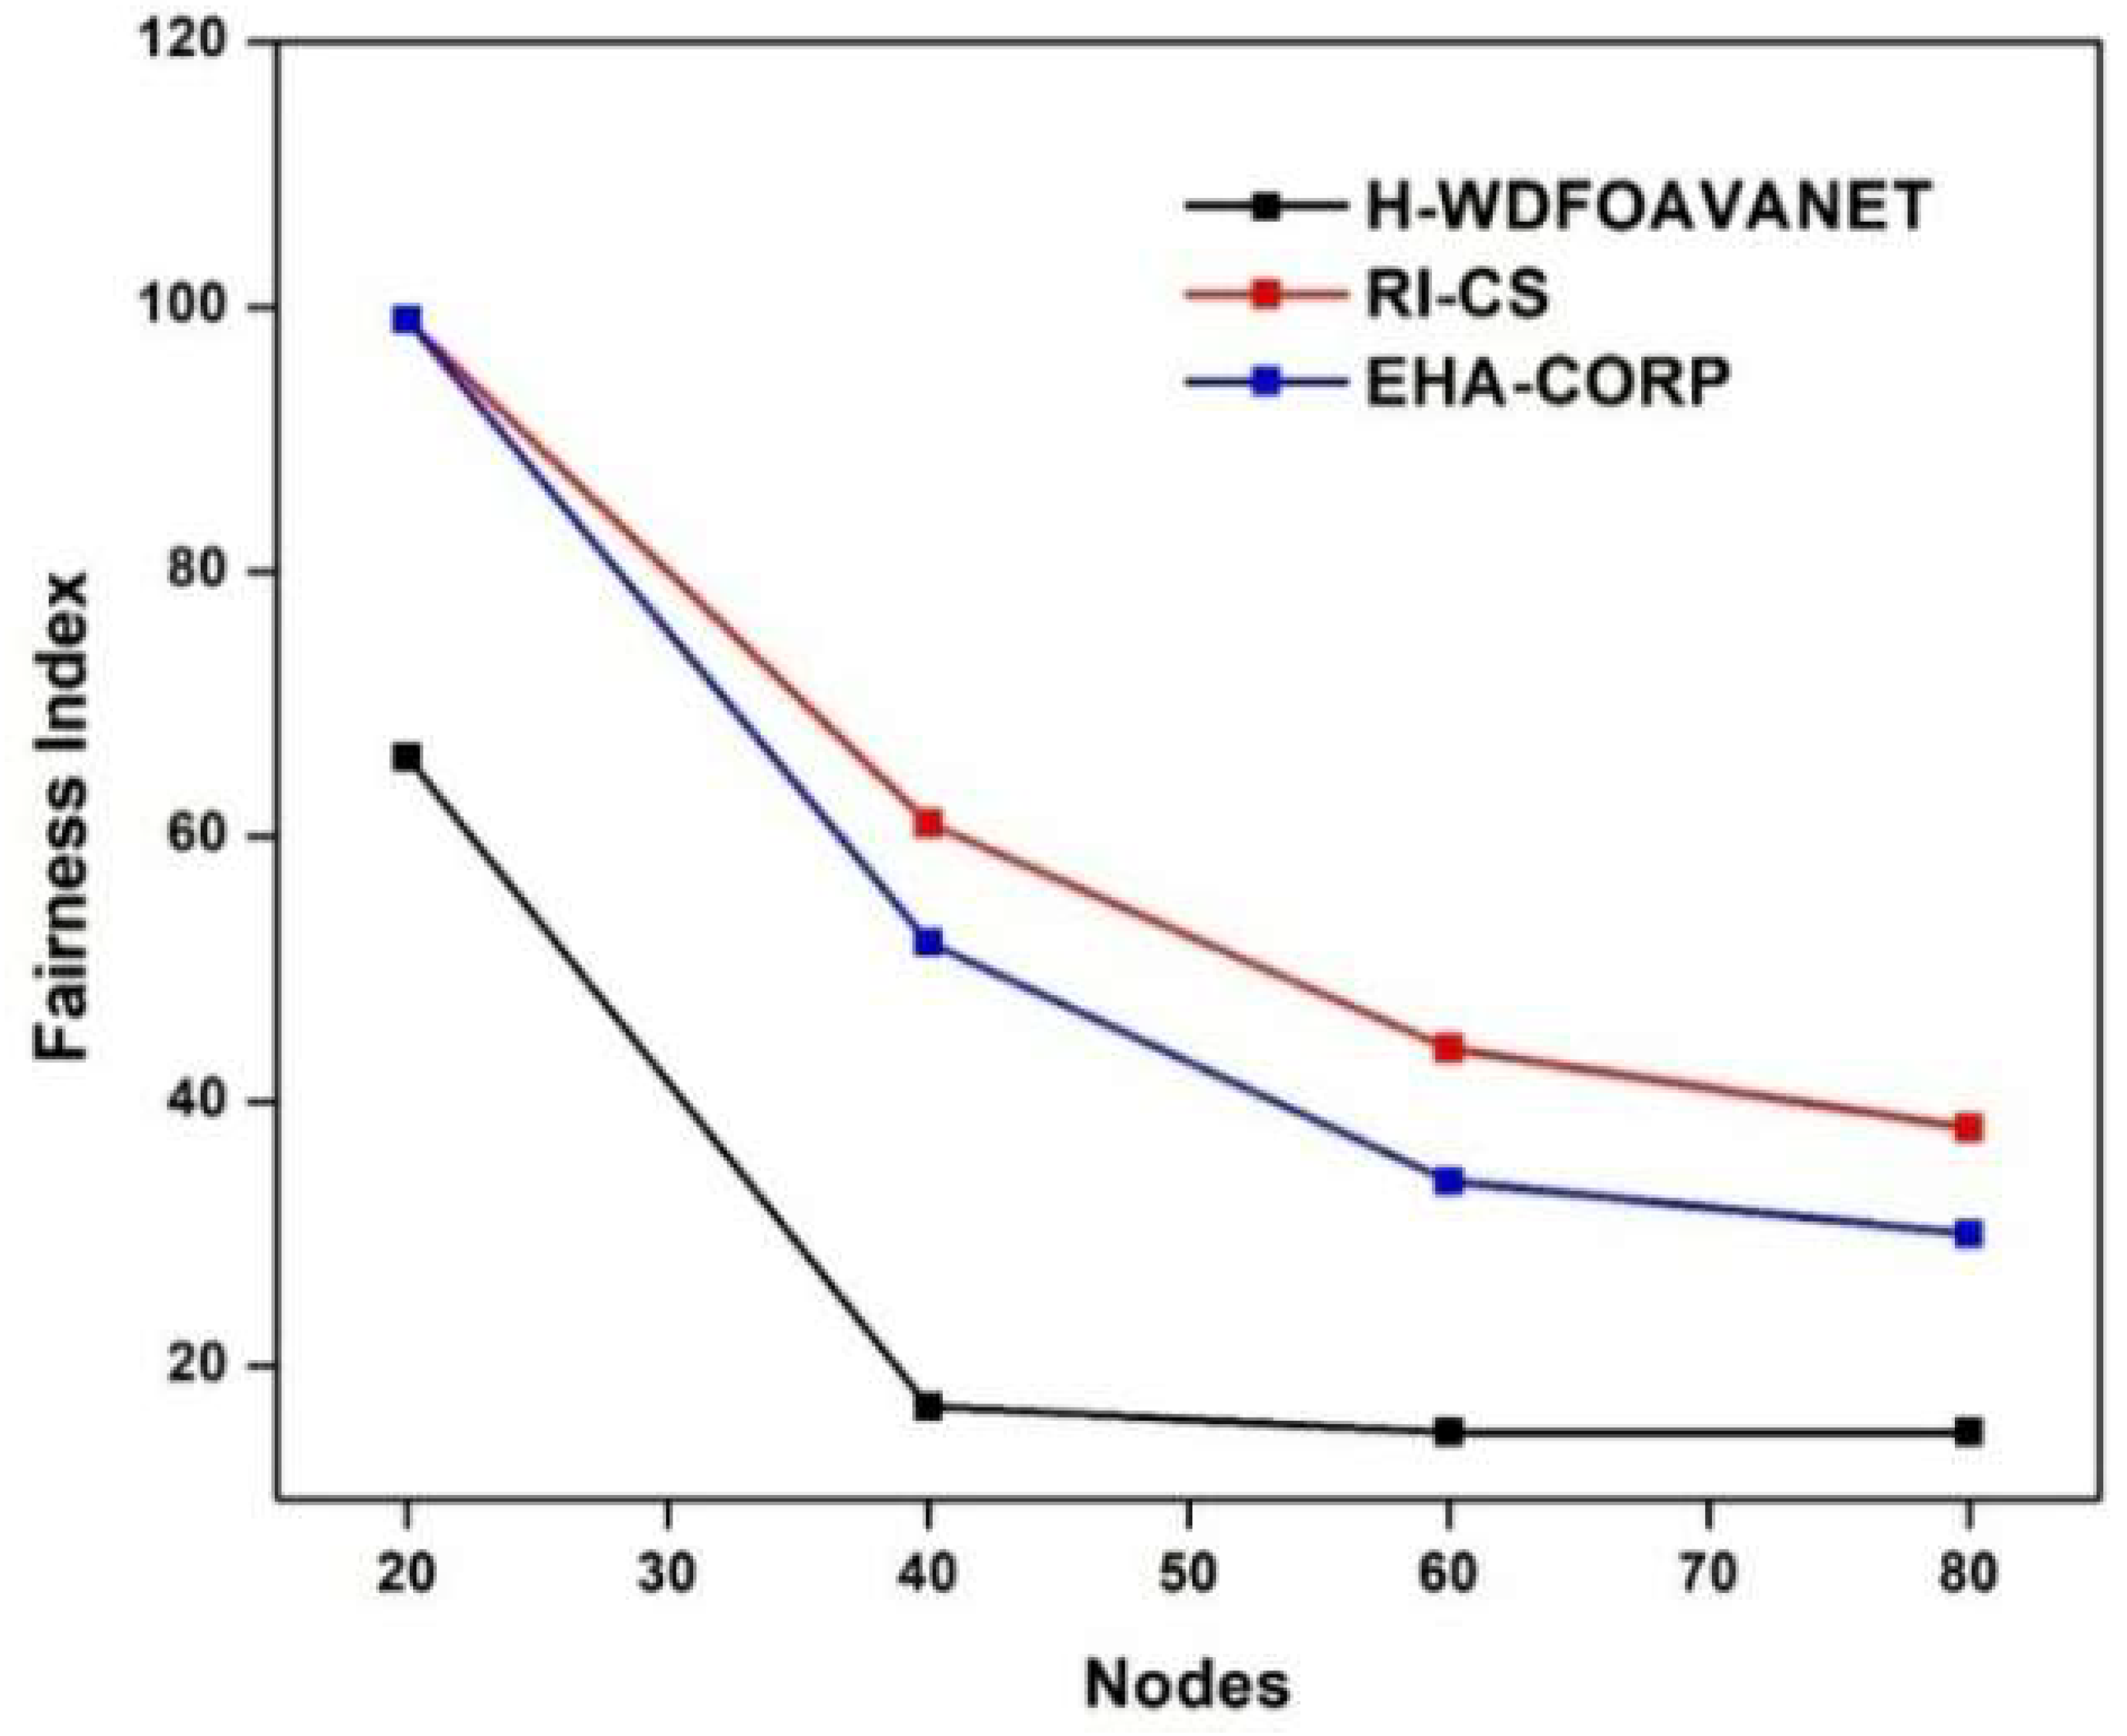
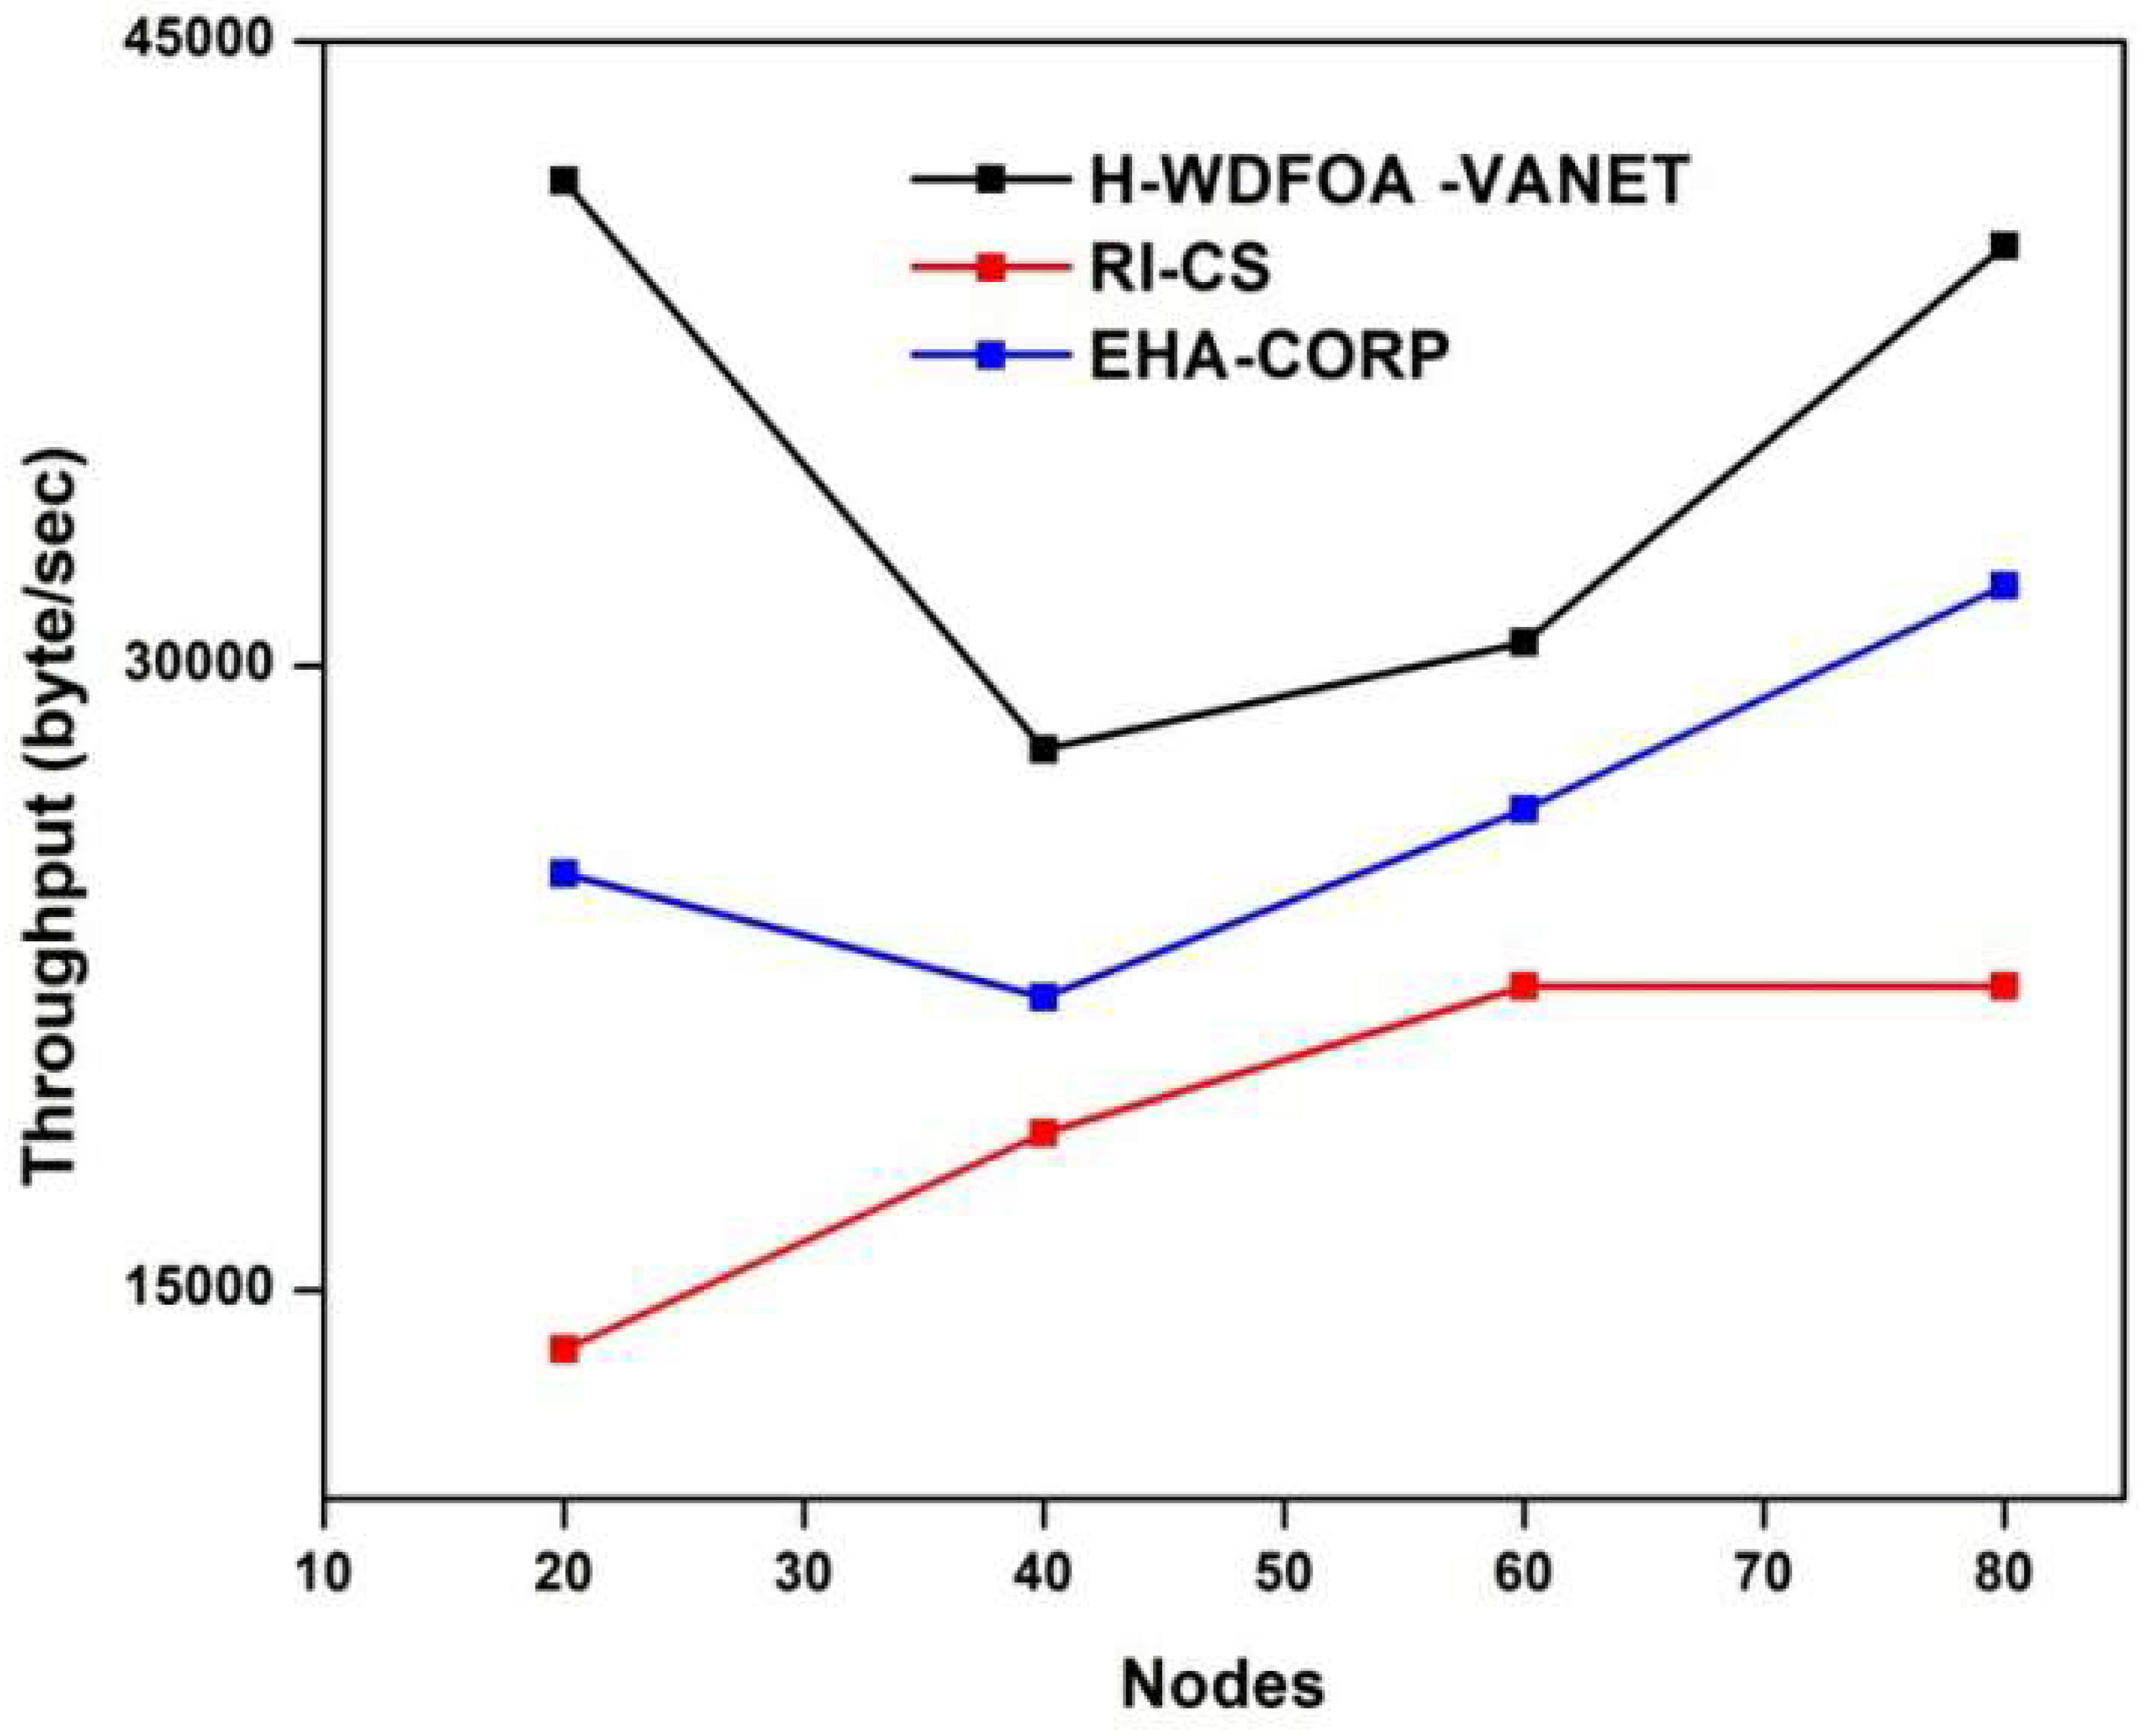
To better anticipate mobility in VANET, a second phase presented the outcomes of the suggested and implemented approaches for enhancing machine learning with a hybrid optimization strategy. The project’s implementation (H-WDFOA-VANET) was analyzed and compared with modern standards (RI-CS, EHACORP). Measured values for the delay, energy consumption, drop, throughput, and fairness index was computed and compared with both proposed (RI-CS) and existing (EHACORP) approaches. In addition, the suggested technique was tested on both the NS2 and MATLAB platforms.
Comparisons were made between the node of the proposed approach and existing techniques in terms of latency, energy consumption, drop, throughput, and fairness index (
Figure 15,
Figure 16,
Figure 17,
Figure 18 and
Figure 19). In the table below, we can see the actual values that were measured. Node values for both existing and proposed methods are displayed in
Table 7. The major purpose of these performance measures was to evaluate the suggested model’s capacity for mobility prediction in VANET. Results from a comparison of the proposed method with state-of-the-art approaches to mobility prediction in VANET are shown in
Table 7, which shows that the proposed approach is superior. As such, the performance metrics indicated the proposed model’s capacity for mobility prediction in VANET.
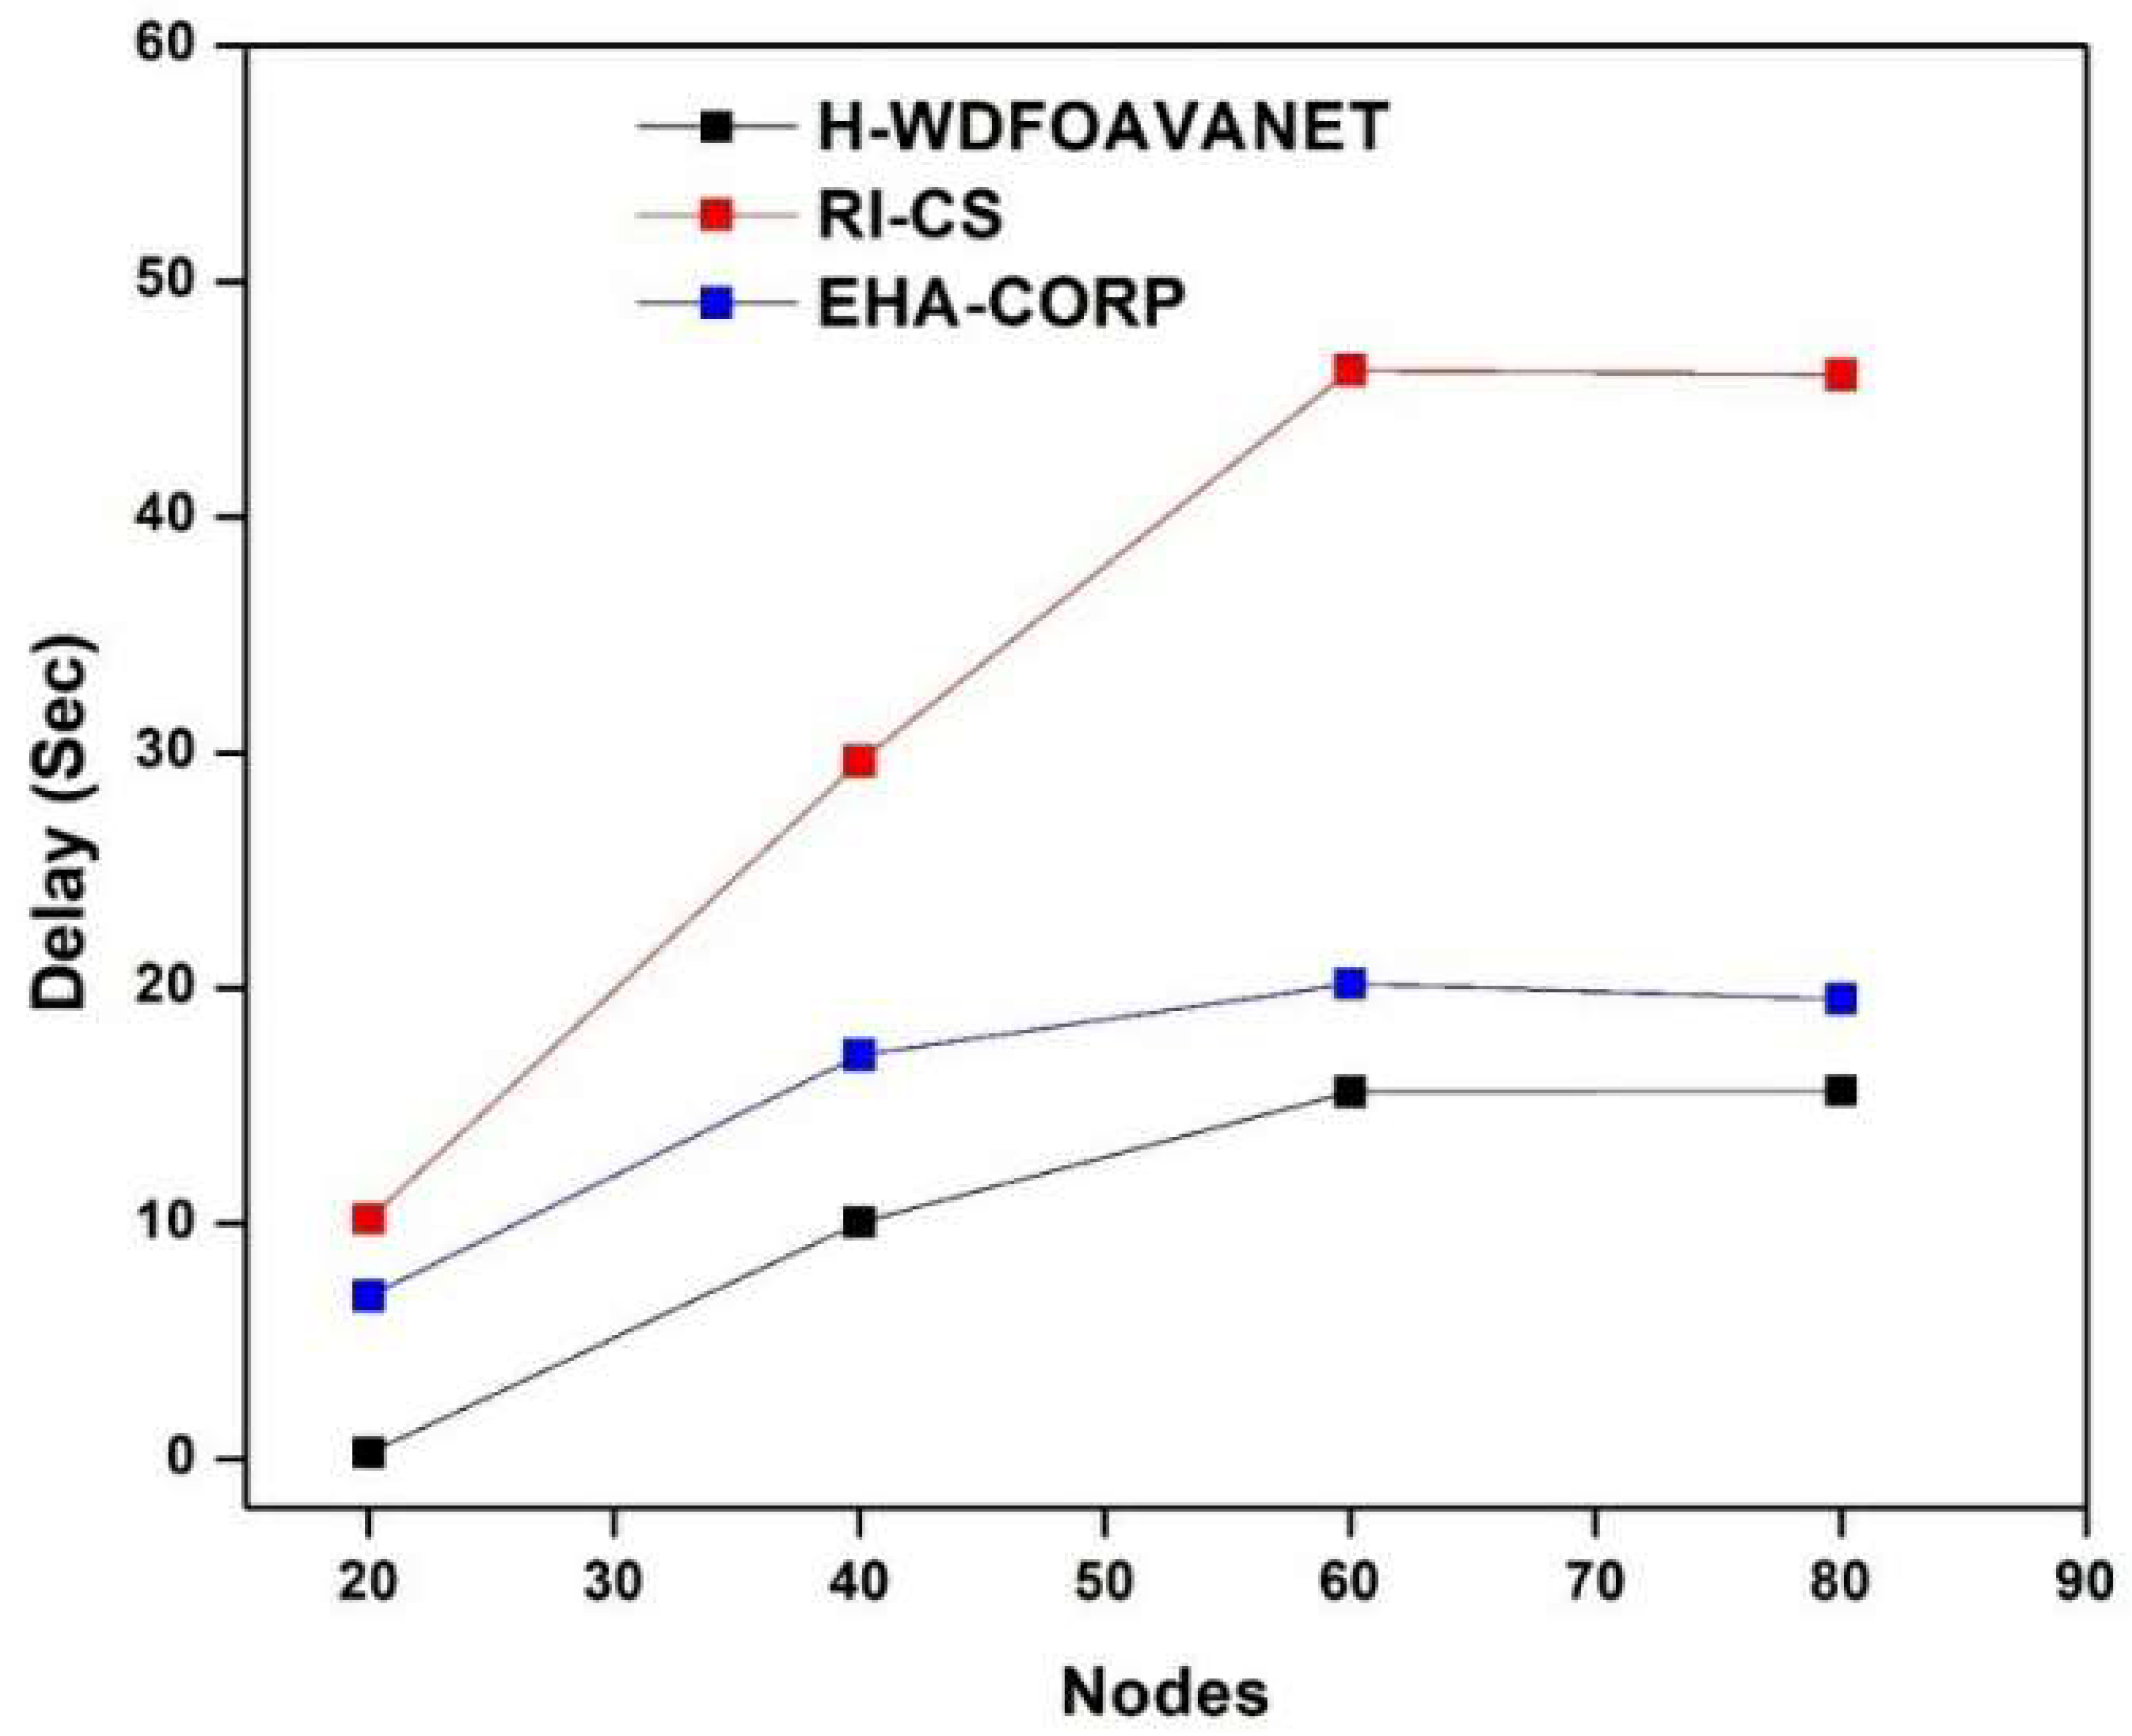
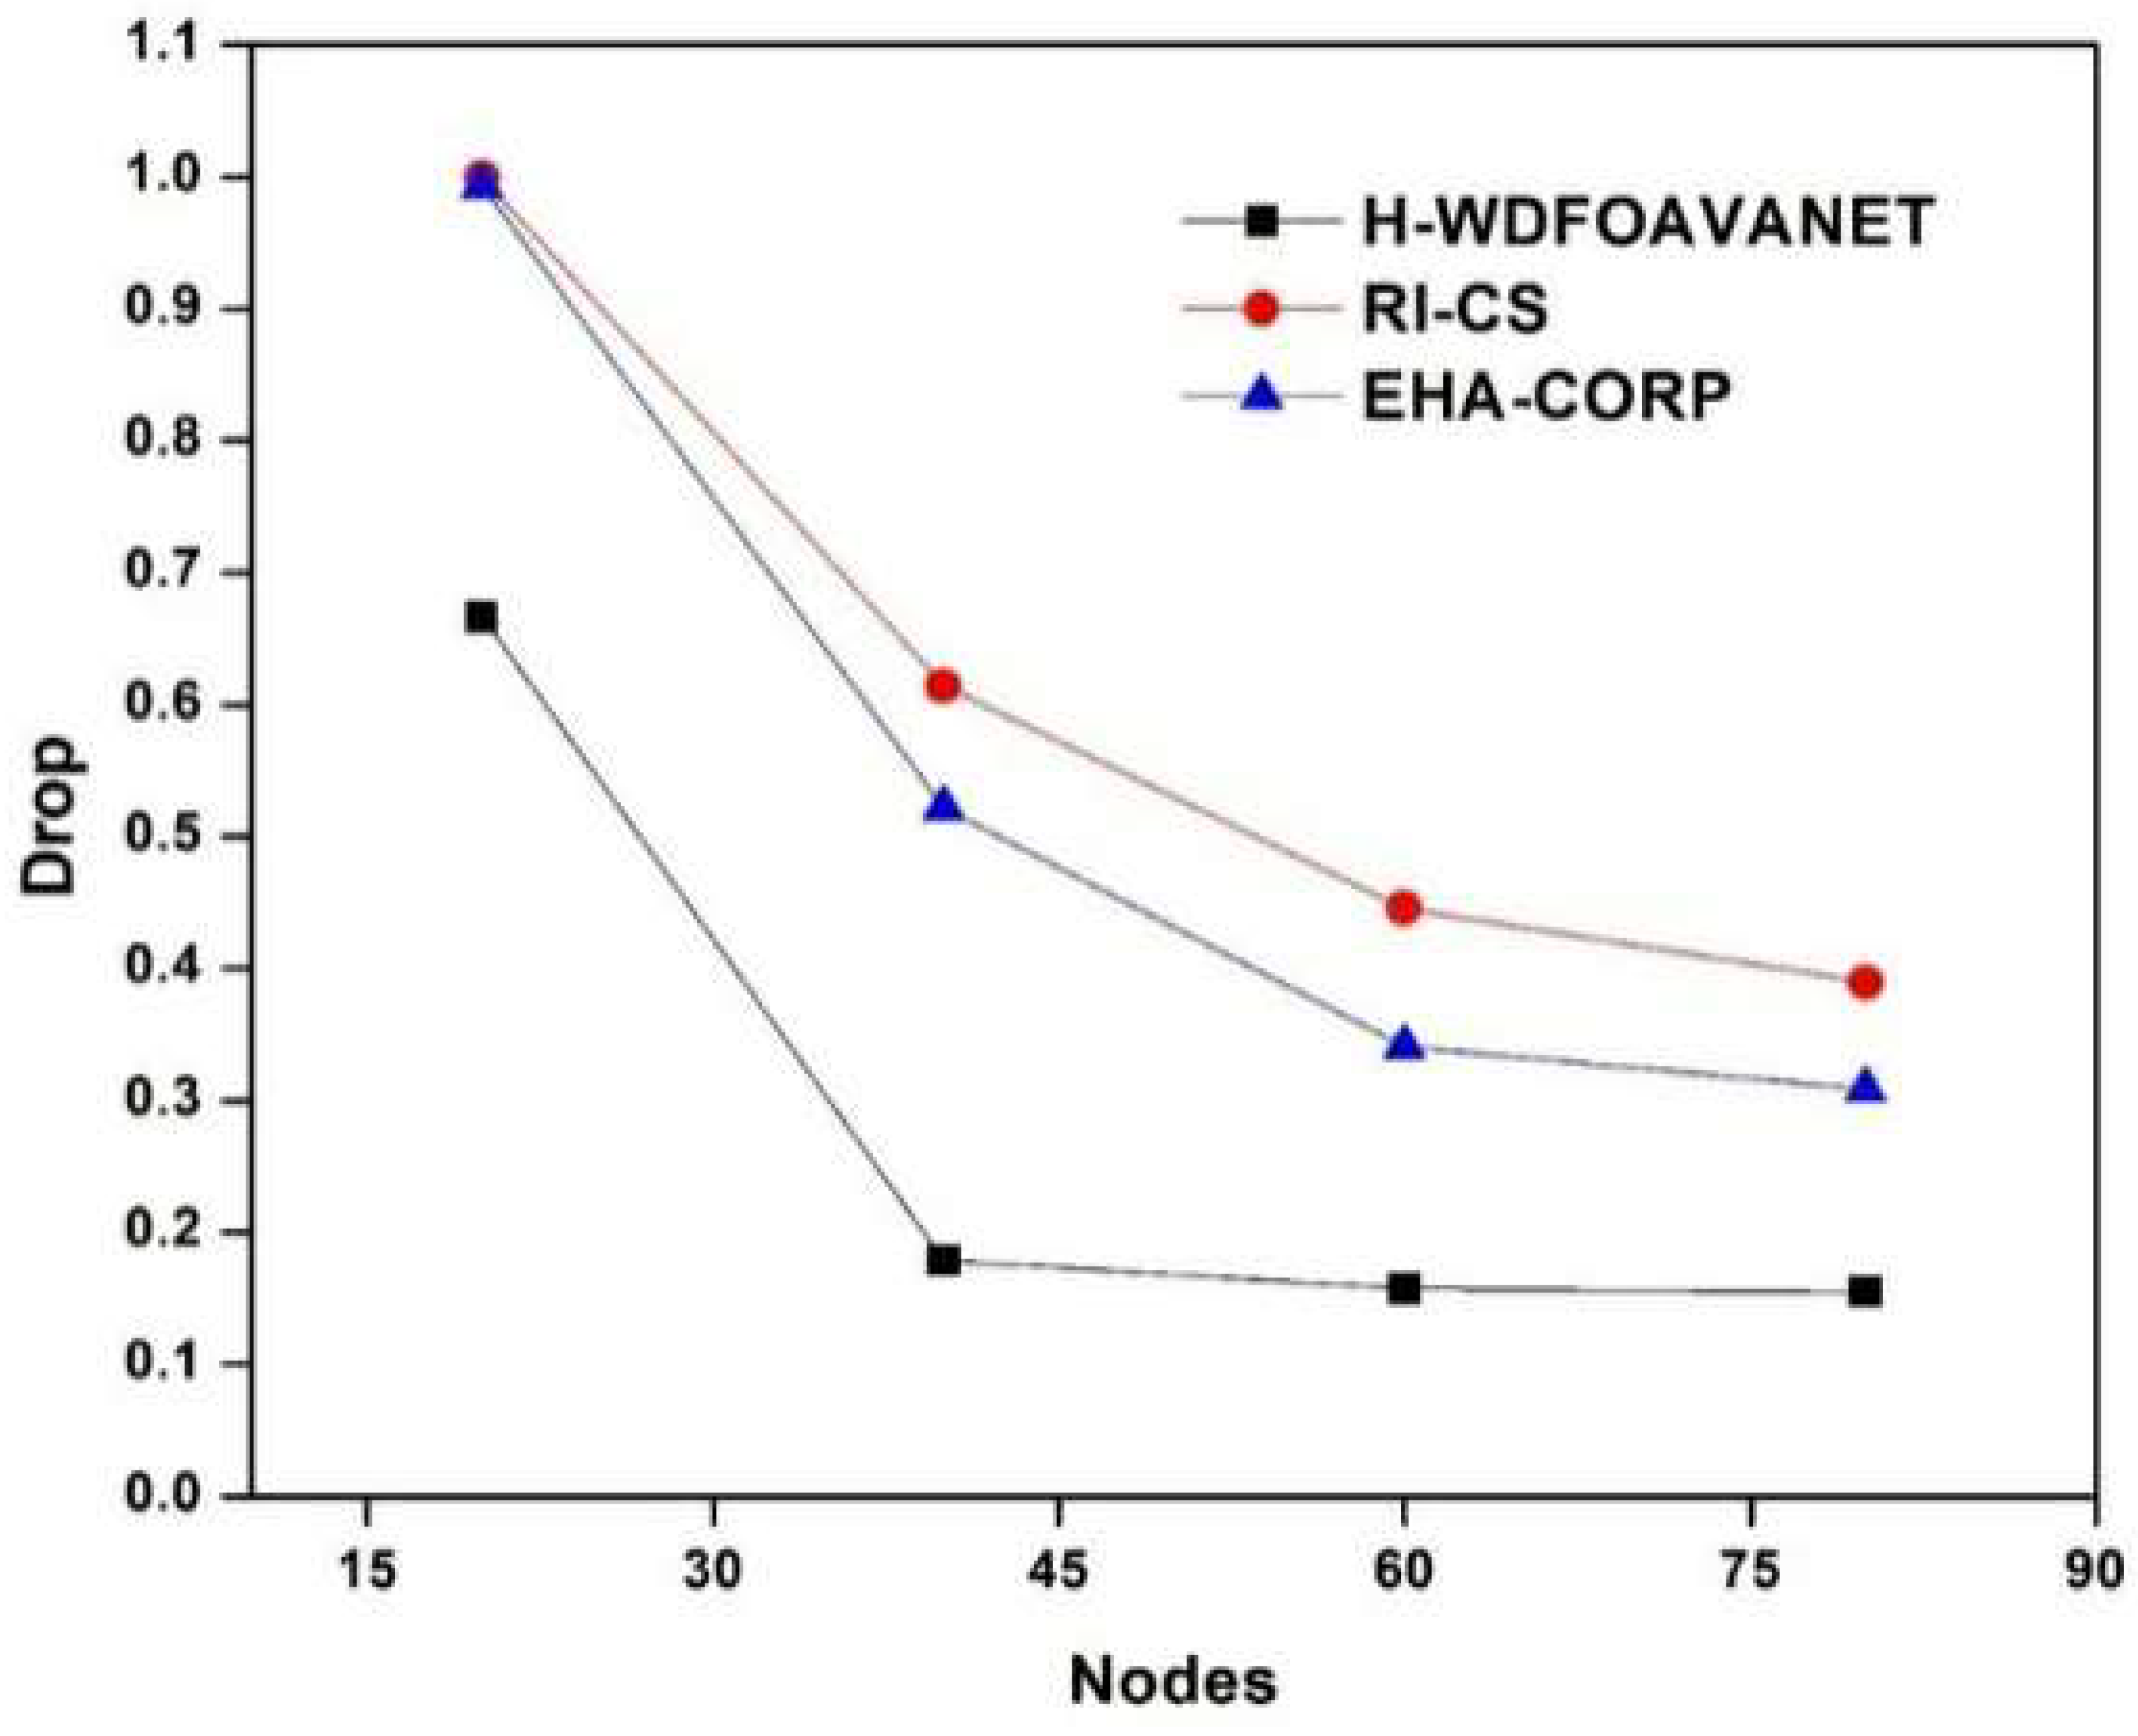
Table 7 shows that, compared with other methods used to predicting mobility in VANET, the suggested technique, which uses a hybrid optimization strategy to improve machine learning, performs better. Better throughput is achieved using the proposed method. The suggested system achieved 2.00000 mJ of energy consumption, 15.61668 s of latency, and 0.15759 drop in node 60. Furthermore, the throughput attained by the new approach was higher than that of existing methods. There was also a reduction in energy use.
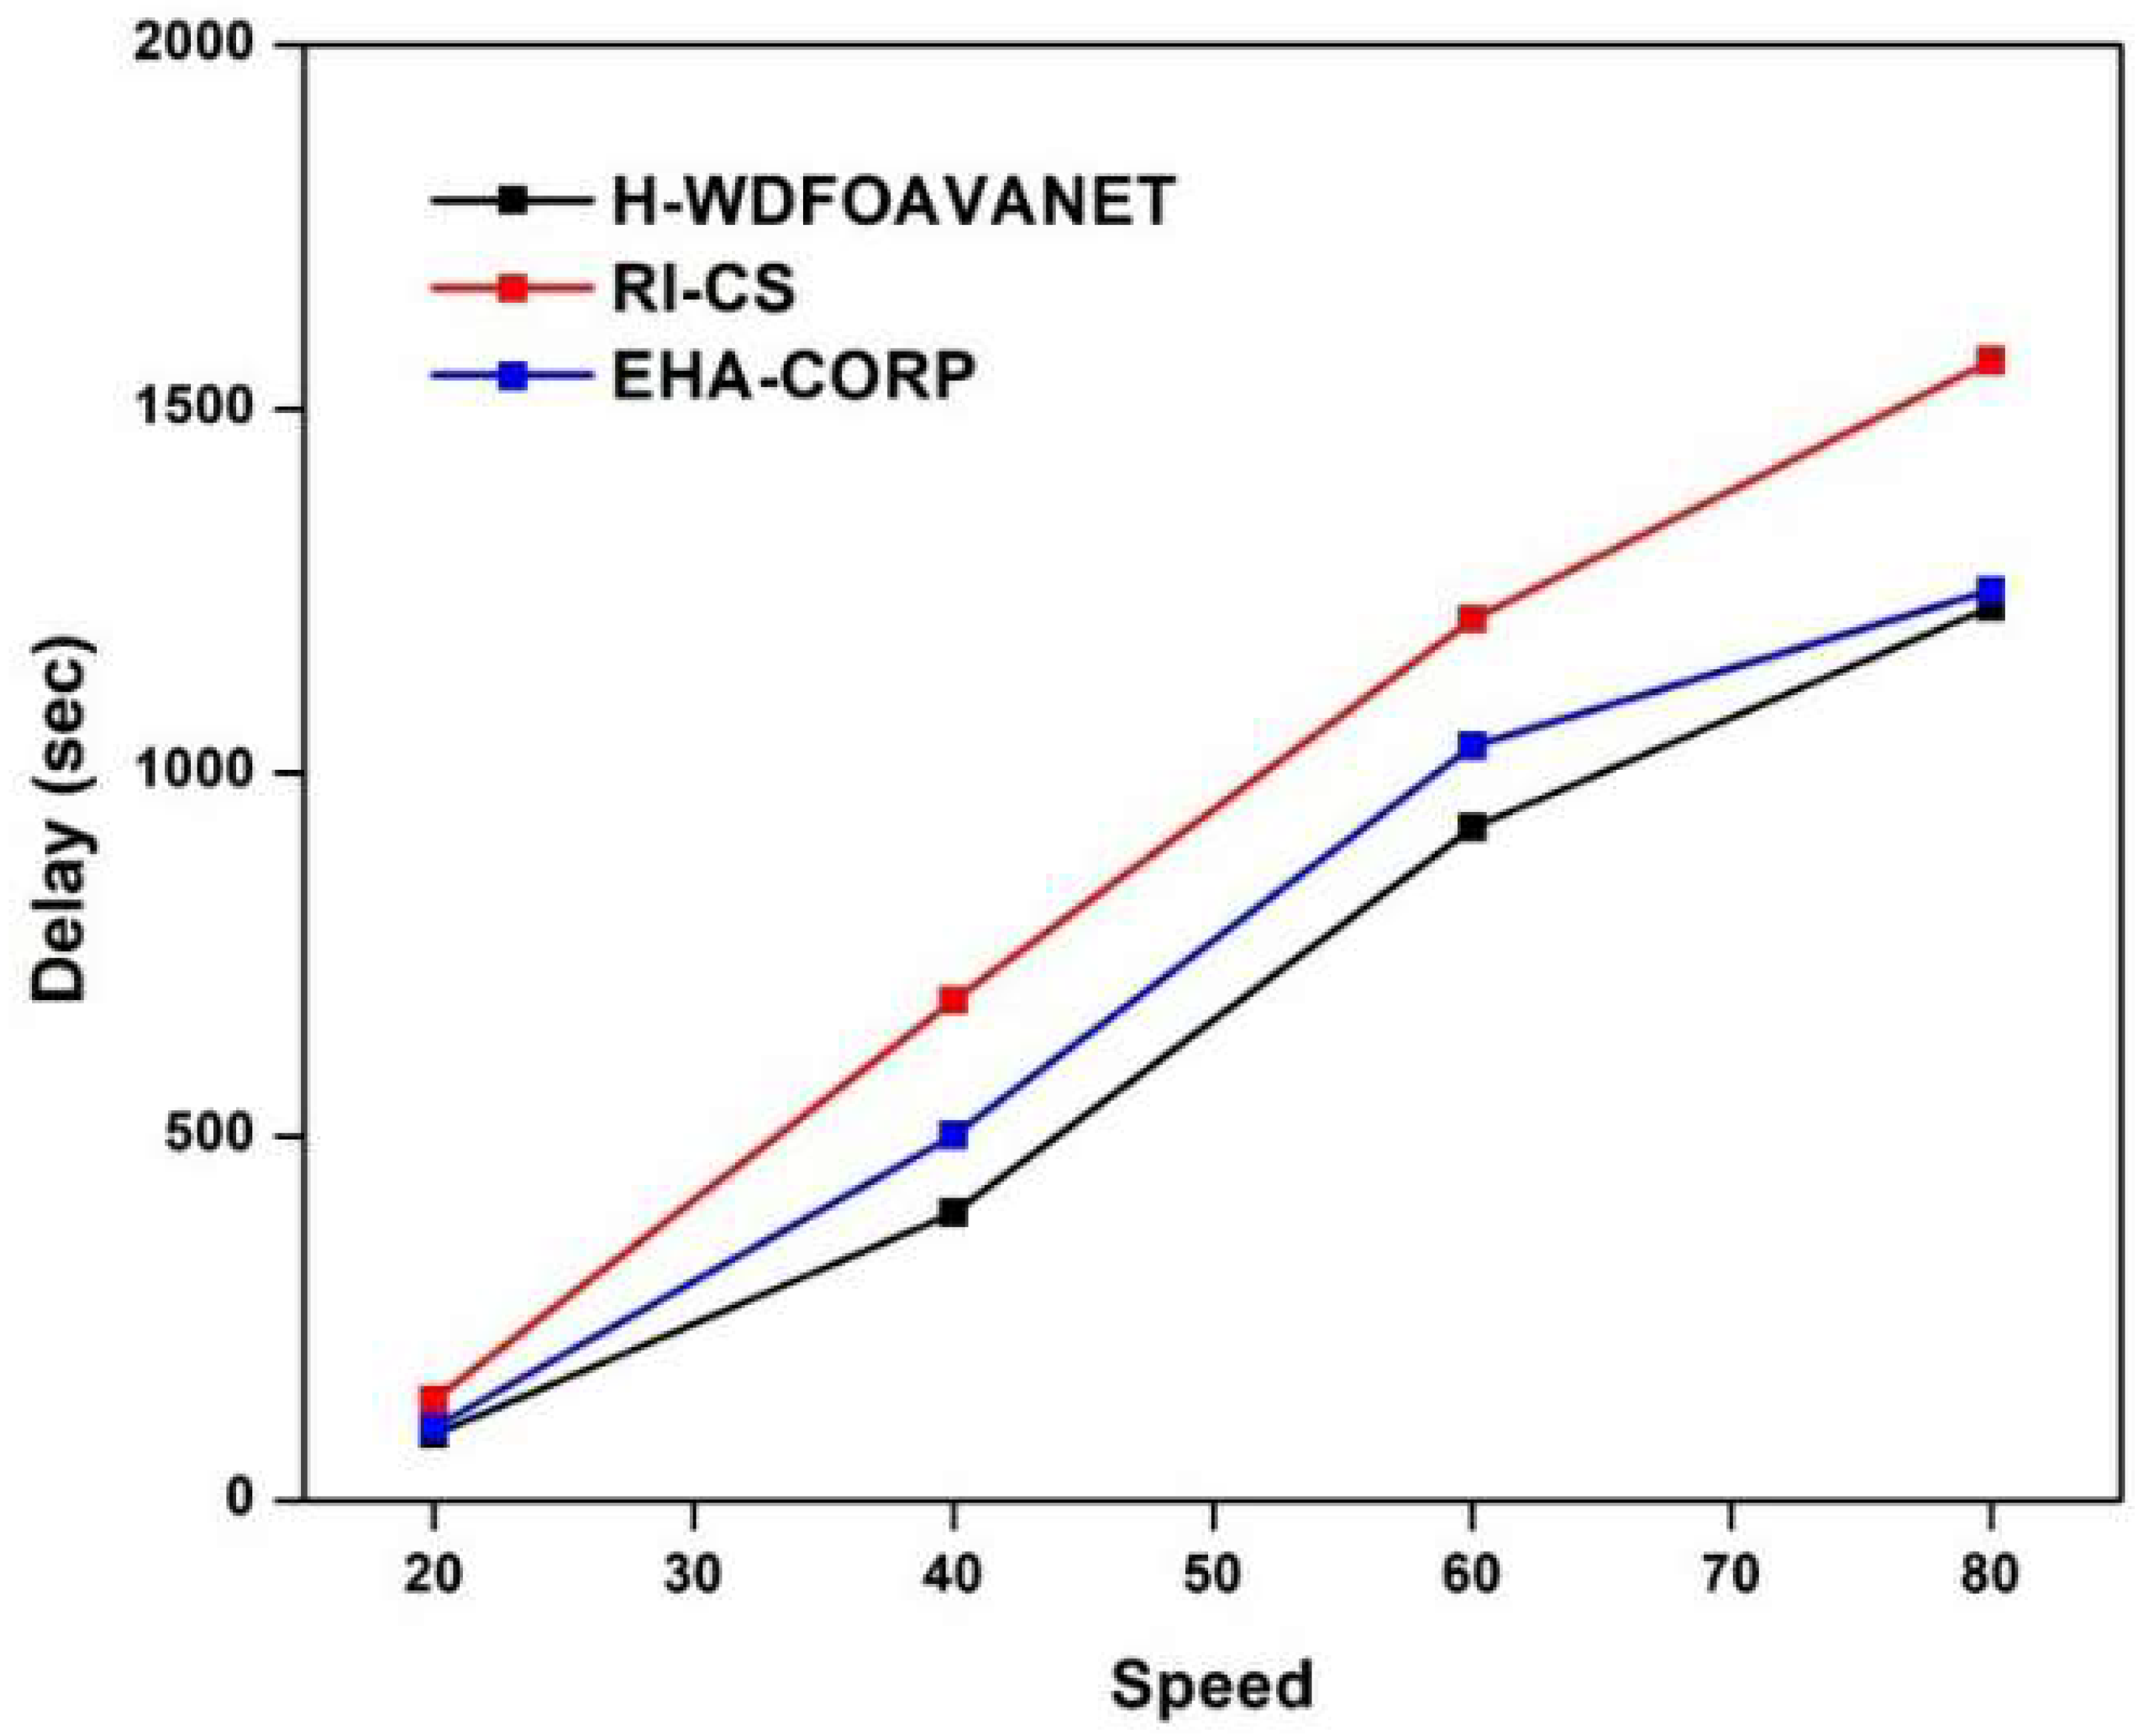
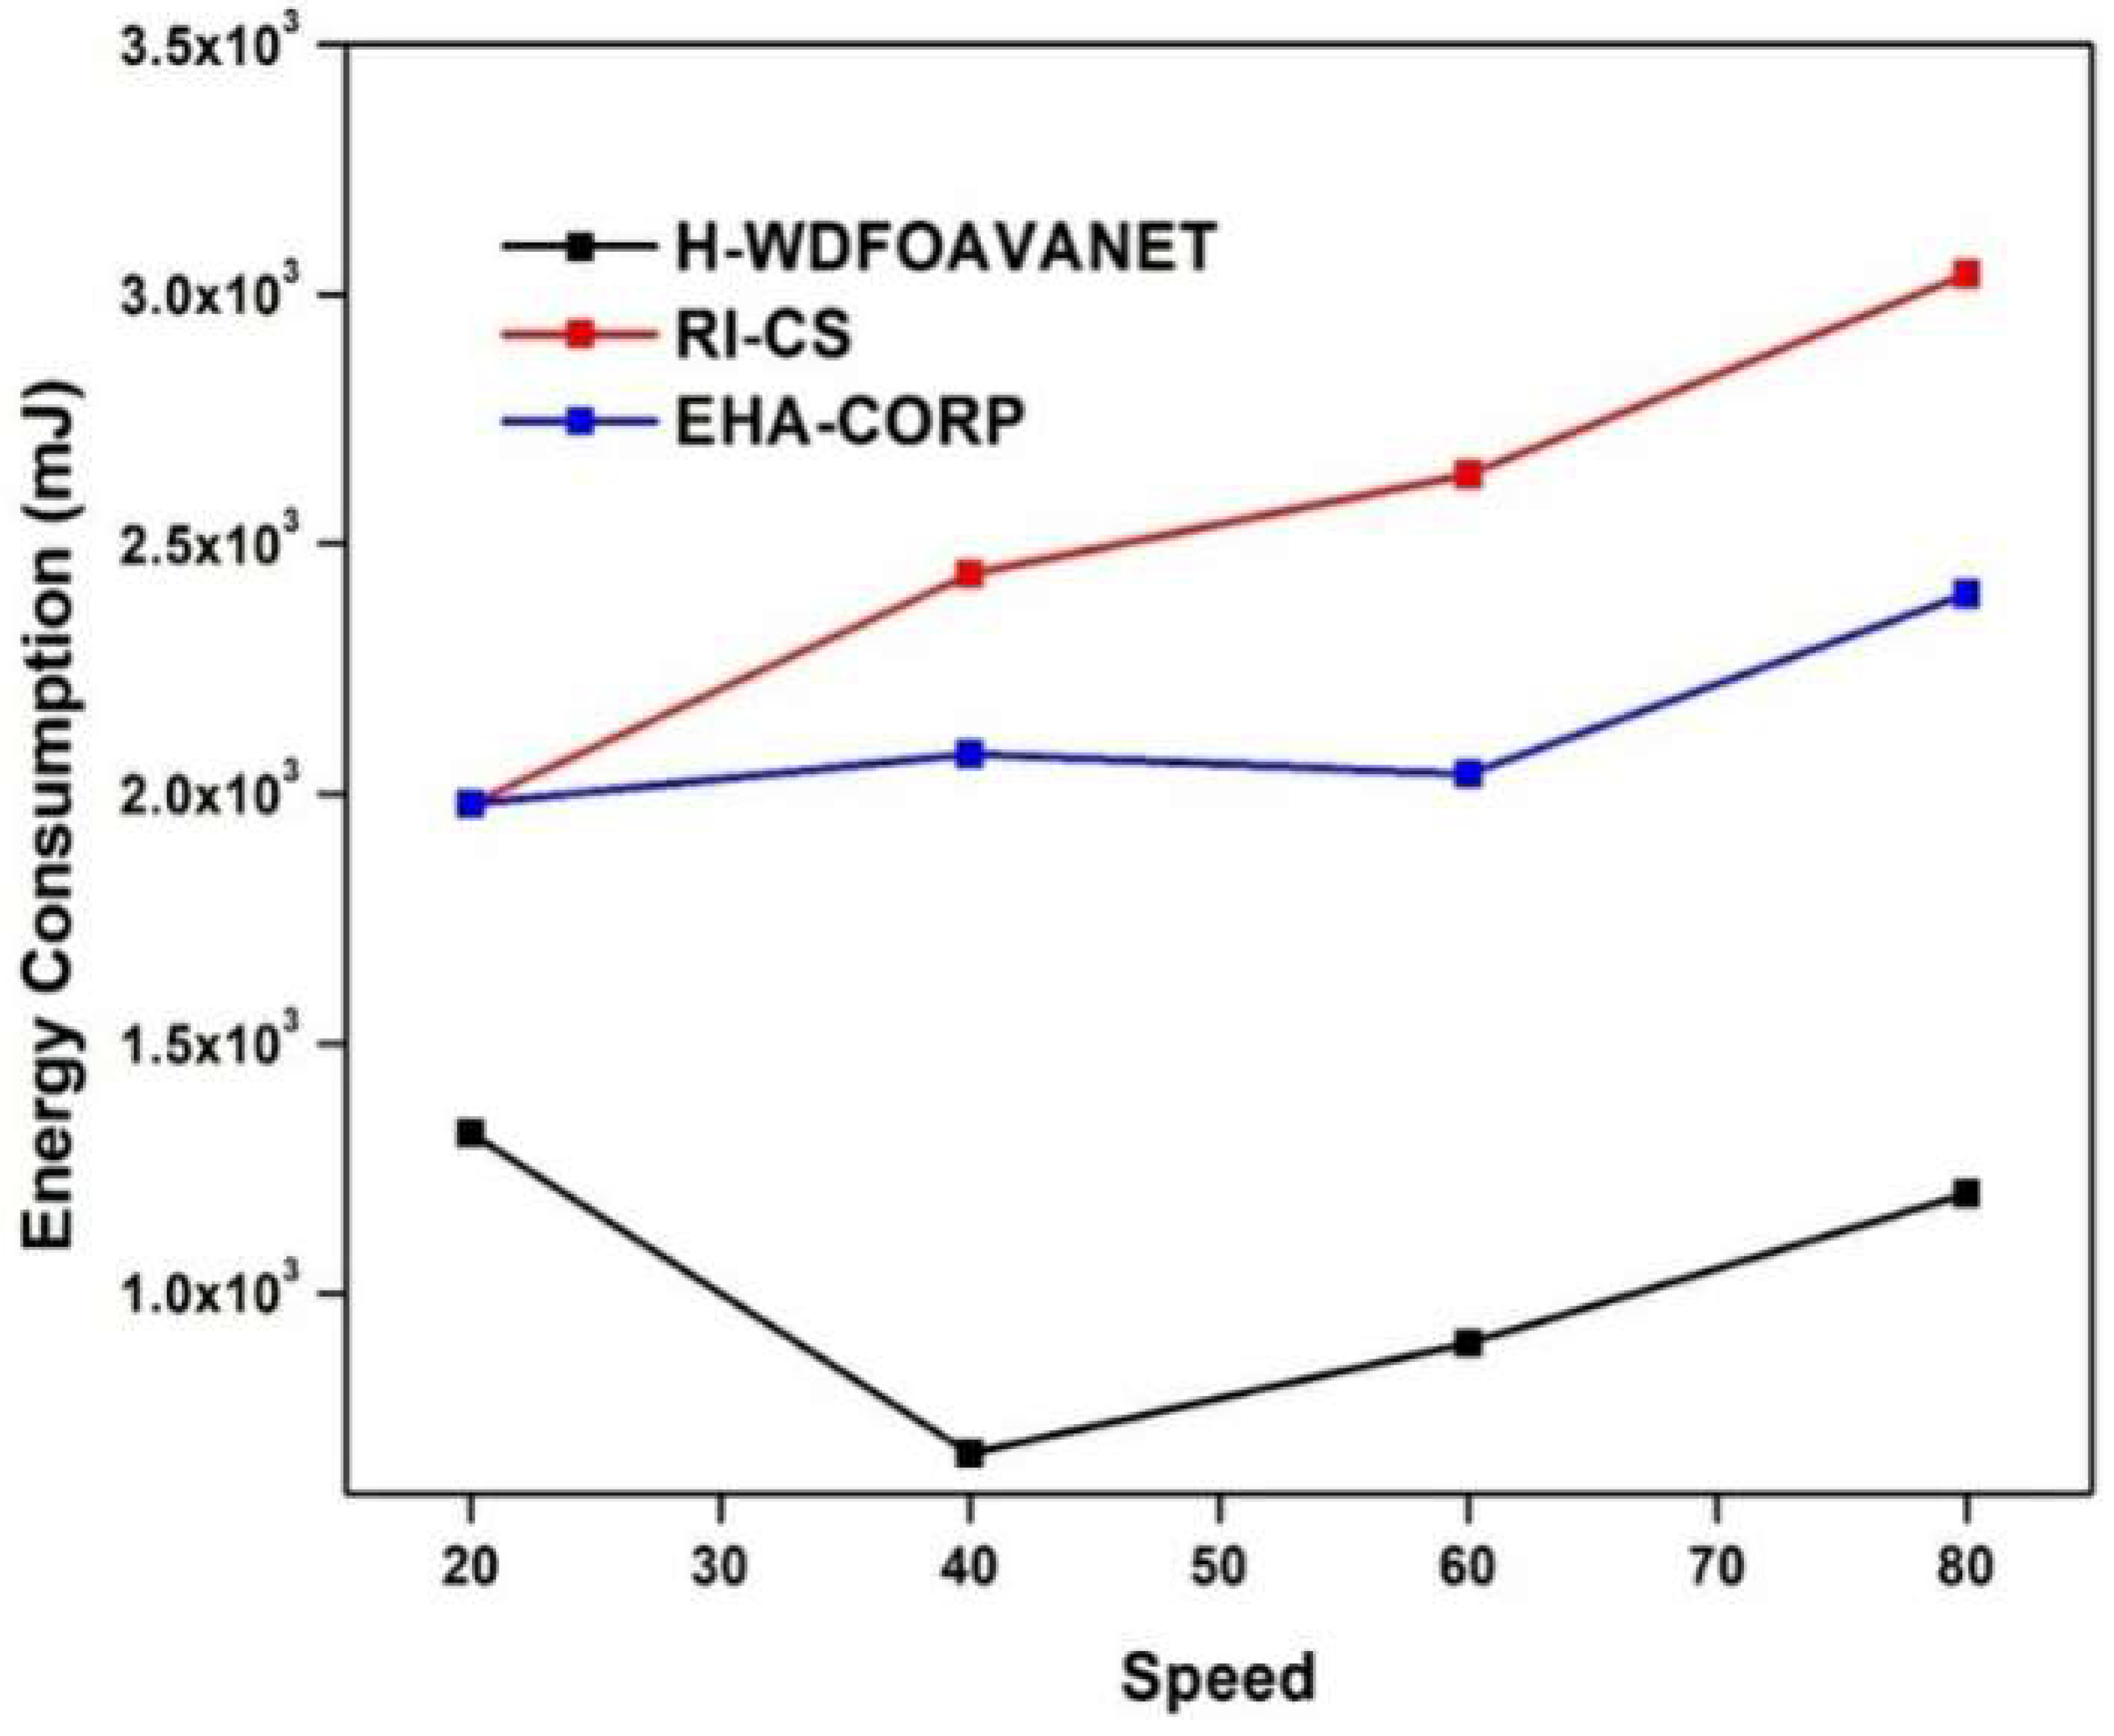
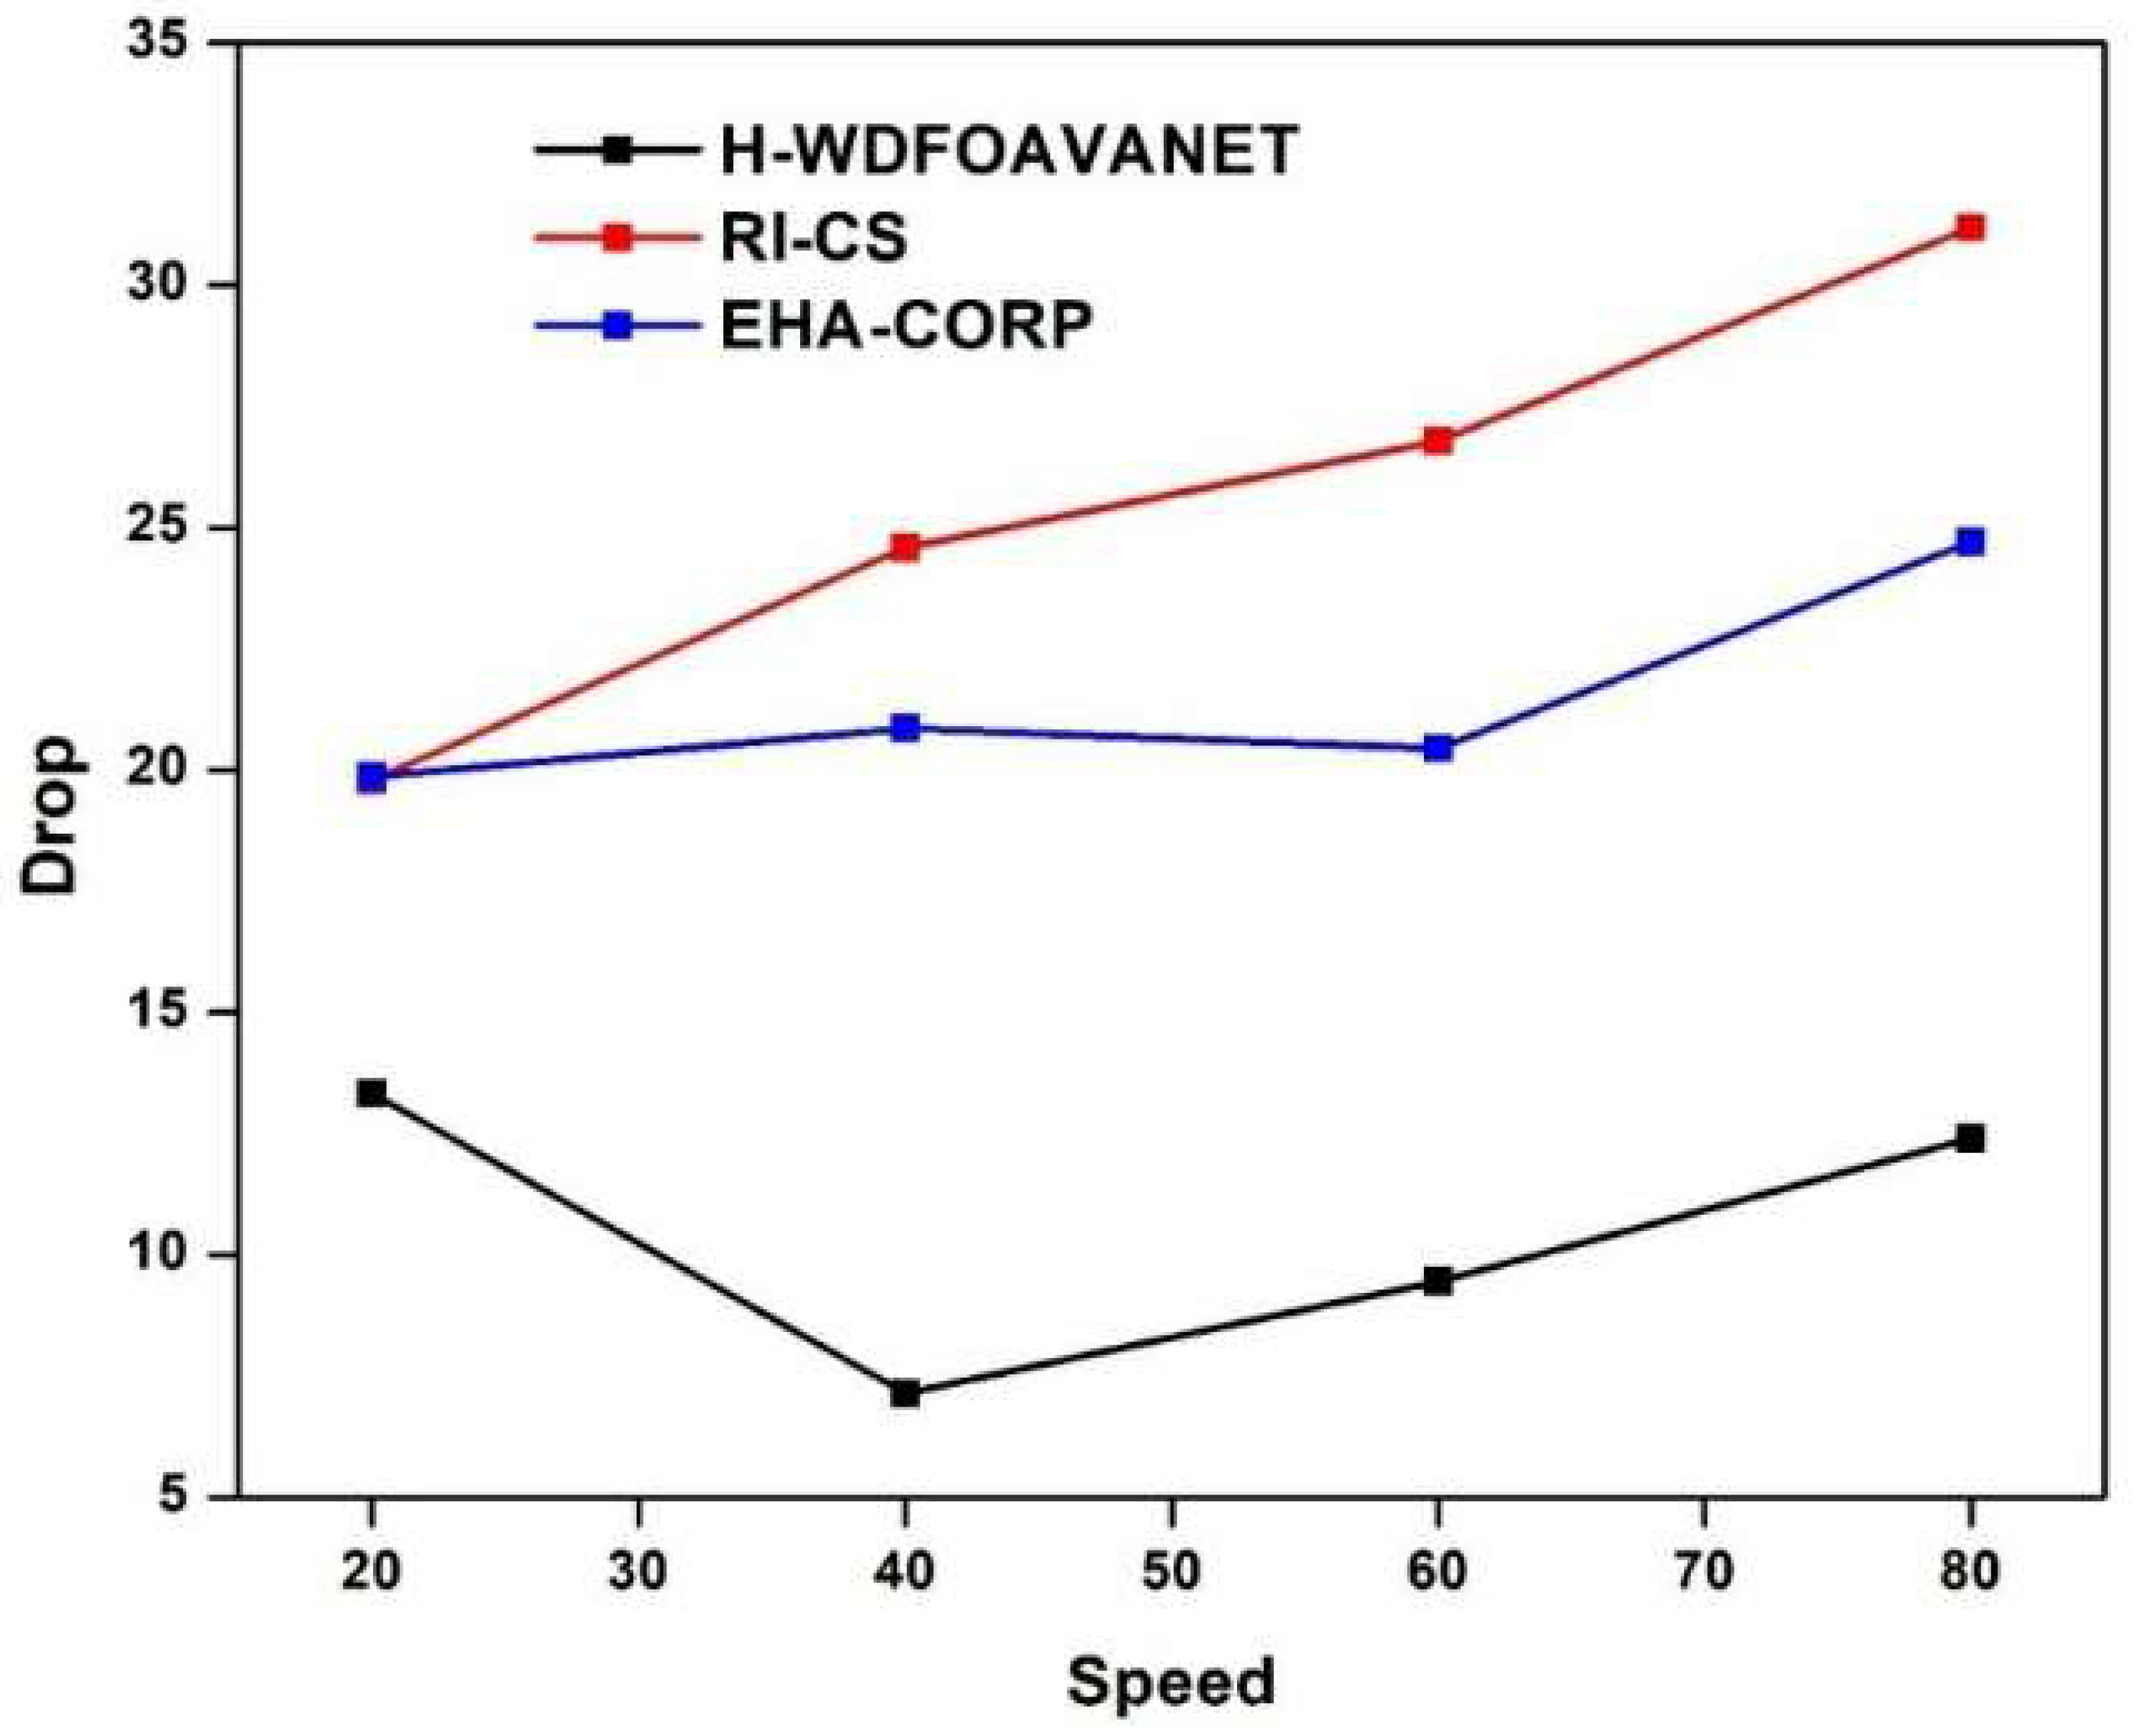
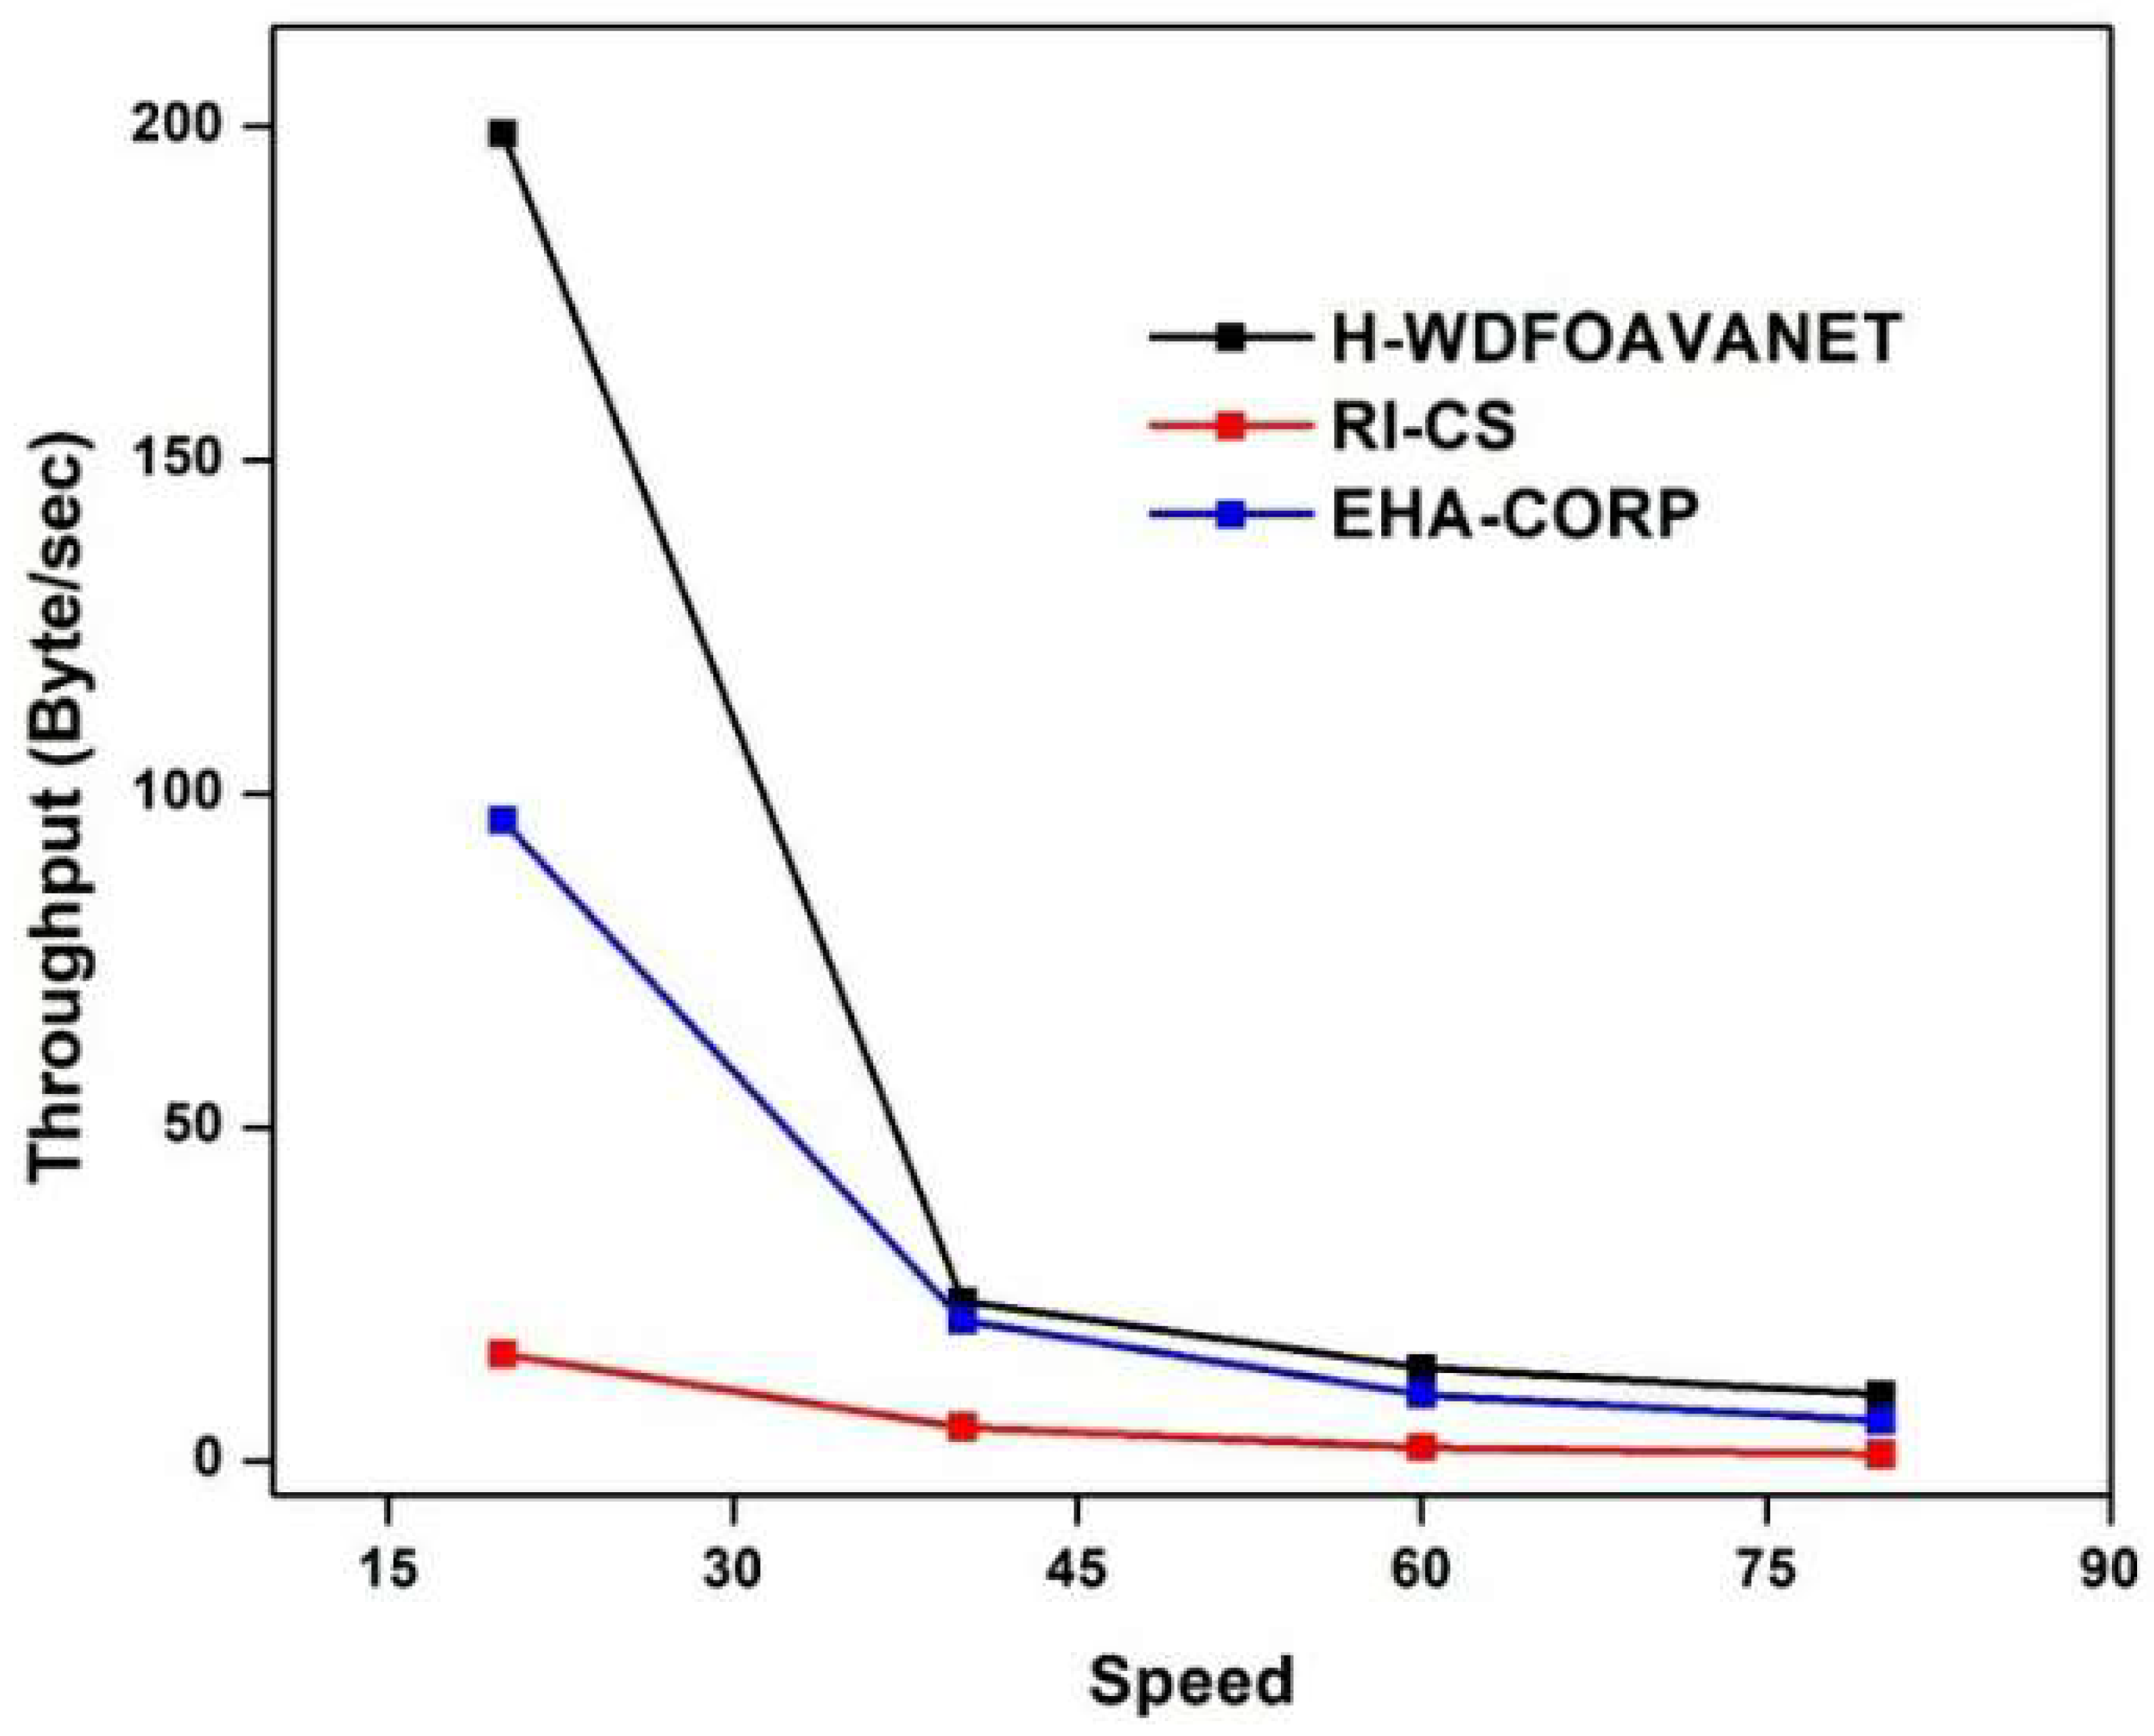
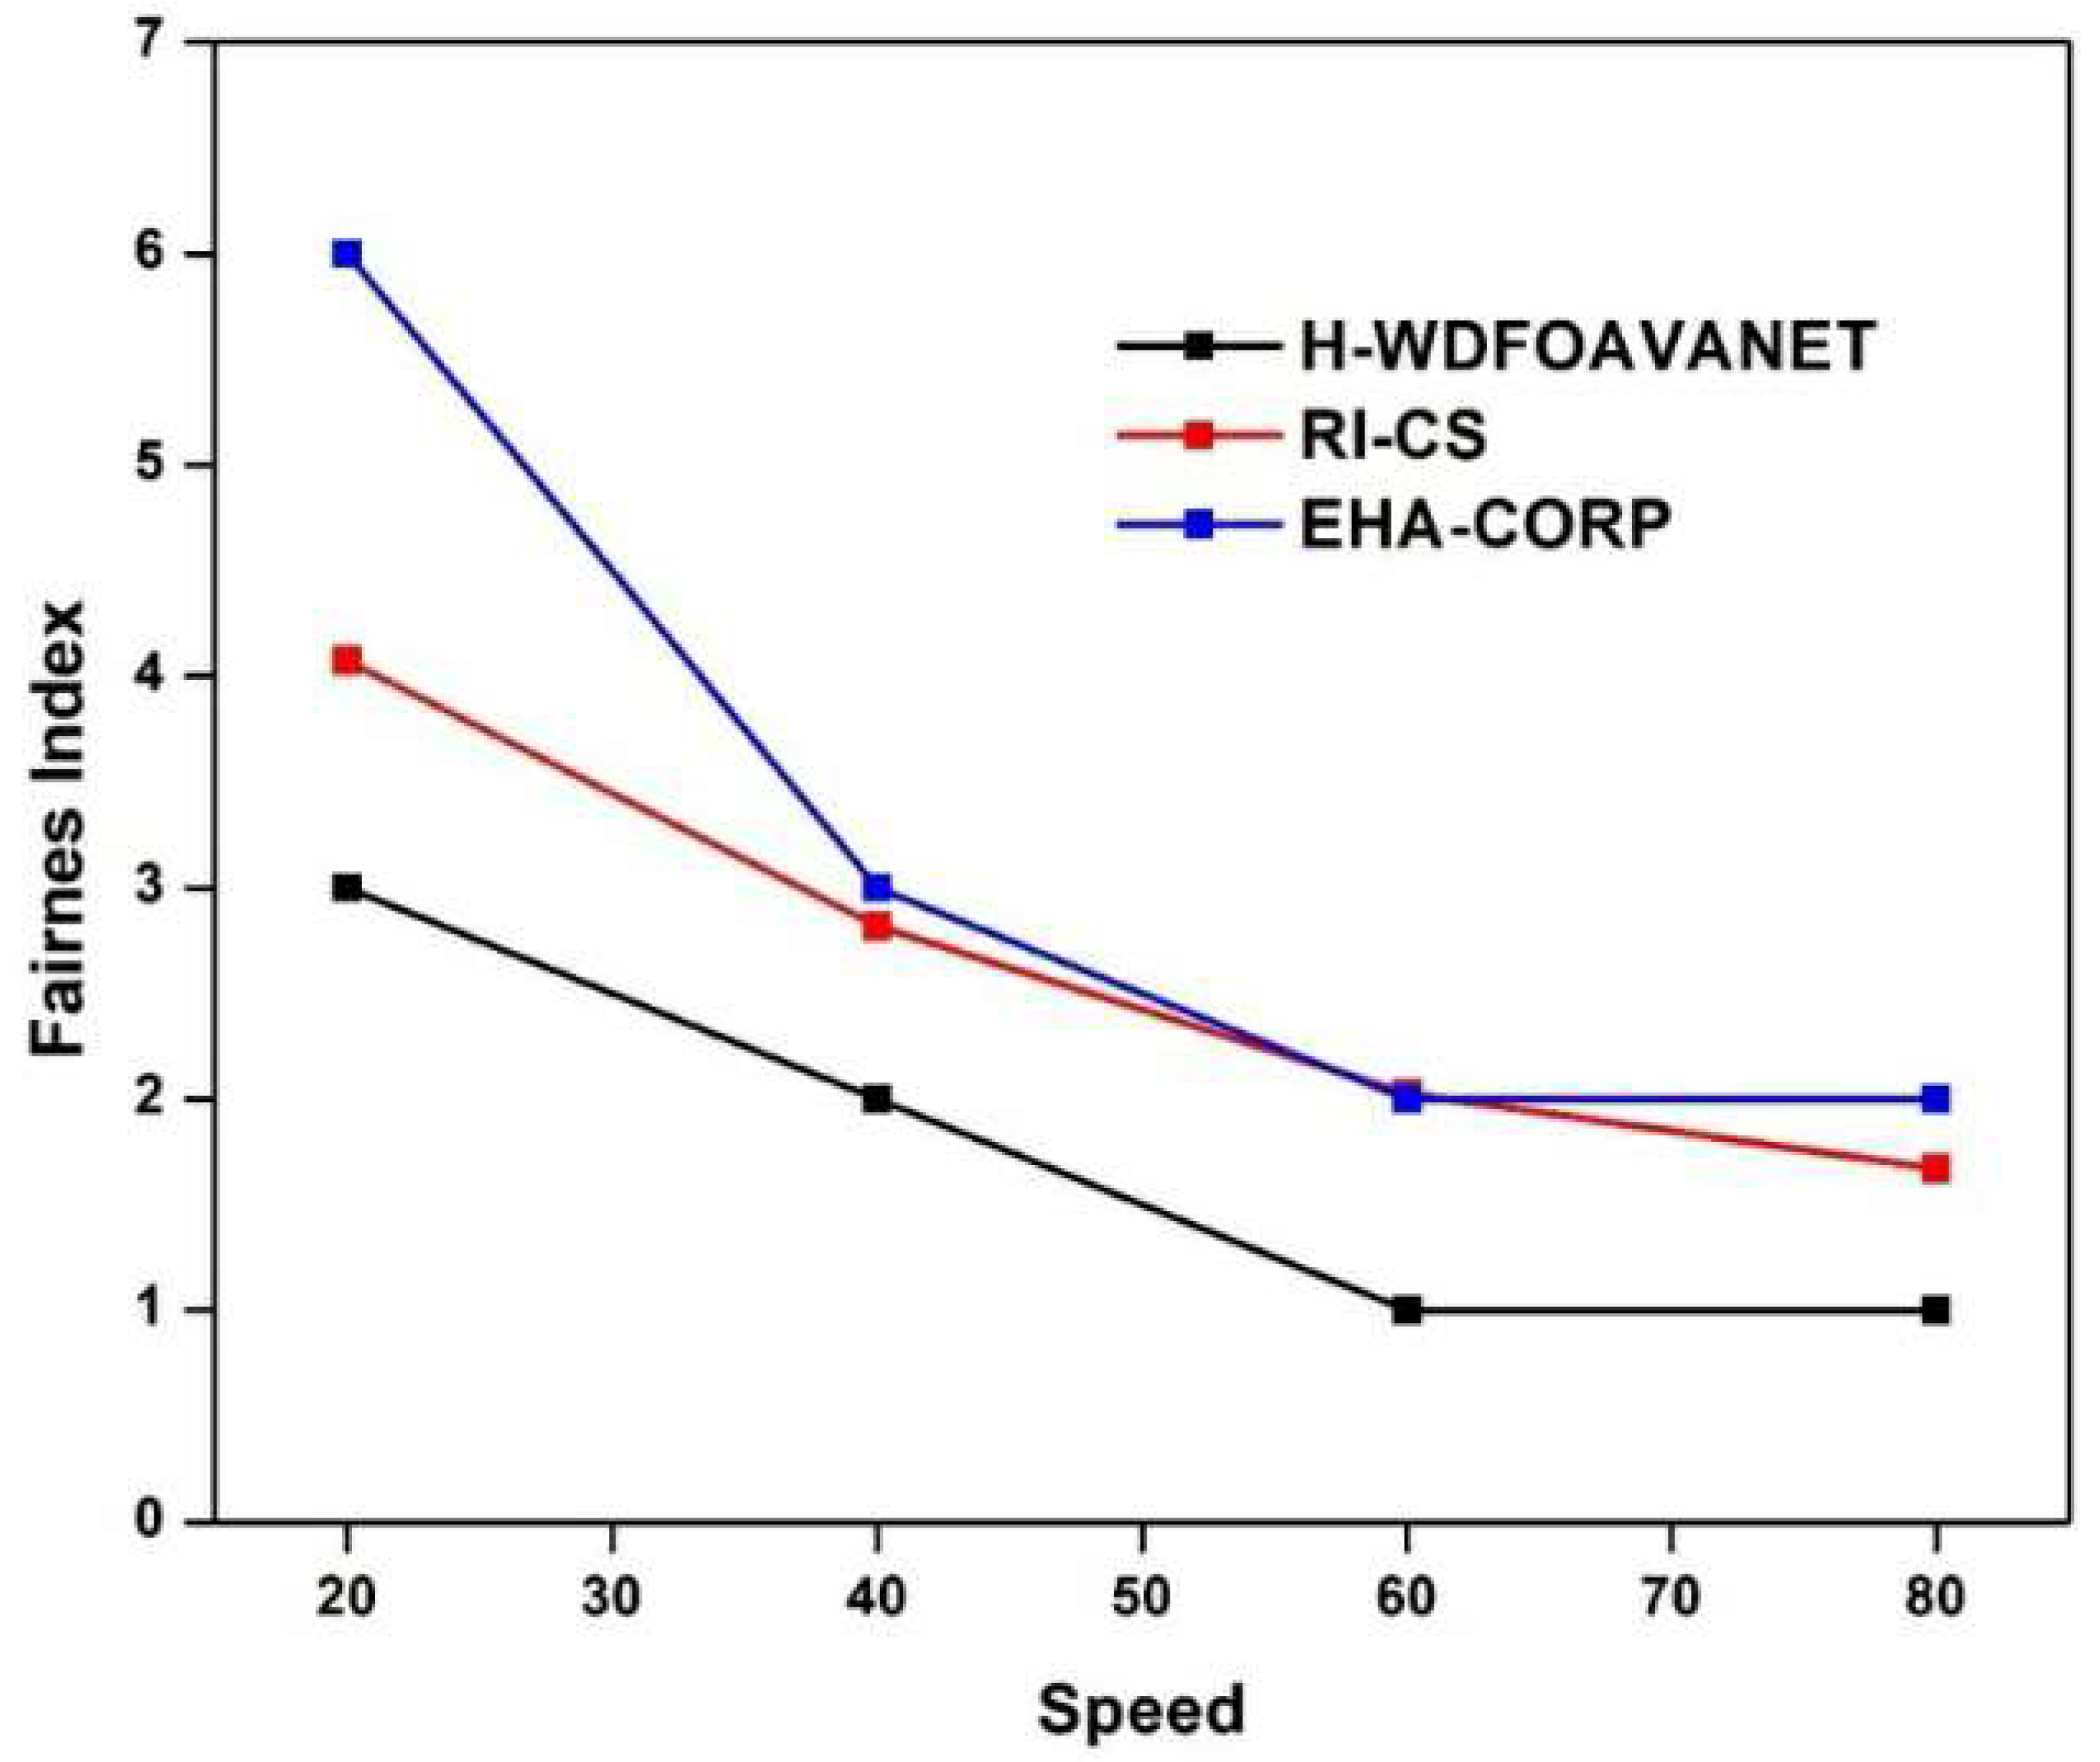
The proposed and existing methods were compared and contrasted in terms of speed with delay, energy consumption, drop, throughput, and fairness index (
Figure 20,
Figure 21,
Figure 22,
Figure 23 and
Figure 24). The measured values are displayed in
Table 8. The estimated speeds of existing and prospective methods are listed in
Table 8. Below is a graphical depiction of the speed of other metrics, such as throughput, drop, energy and fairness index, and delay. An evaluation of the suggested method at speed 20 yielded an energy consumption of 1320 mJ, delay of 90.180295 s, and drop value of 13.334678.
Additionally, the throughput achieved by the new approach is higher than that of the existing approaches. One key difference between the proposed and existing approaches is that the proposed technique includes a fairness score. With the suggested method, the values for energy consumption, delay, and drop at speed 40 were 680 mJ, 395.189005 s, and 7.151254, respectively. In addition, greater throughput could be achieved using the new method than existing methods. The proposed method reduces energy usage to 900 mJ, delay to 924.638246 s, and drop value to 9.450511 when traveling at 60 mph.


 ,
, 


