1. Introduction
The door-to-door strategy is gradually coming to the fore, even with the idea of providing continuous transport services connecting several operators within one digital platform. Promoting door-to-door mobility is a very current topic that is being studied in numerous studies. Research in Dresden focused on identifying the needs and preferences of public transport users for mobile applications to support mobility [
1]. As part of transport planning, the decision of transport routes and the inclusion of private door-to-door services to ensure transport service is taken as a key element [
2]. In Singapore, a public transport routing approach was assessed, including door-to-door shared services [
3]. The option of continuous traffic service also applies to the reduced-mobility population. Research in Barcelona highlighted the importance of door-to-door transportation services even for disadvantaged road users, emphasizing the influence of road characteristics and the need for priority-based trip allocation [
4]. Research in Turkey examined the impact of the availability of transport infrastructure and the attractiveness of the region on regional mobility [
5].
Digitization in general provides a wide range of available data, which makes it possible to understand and link user behavior. Processing data from multiple communication systems and interconnected subsystems helps in the development of smart cities [
6]. In the context of the design of a smart city, the interaction between mobile applications and transport itself is especially important. When setting up a functional system, a process consisting of a sufficient amount of traffic data, map documents, and outputs from real-time sensors or transport operators is considered [
7]. The identification of factors influencing urban tourists’ receptivity as well as citizens traveling for work or school is an important input when assessing mobility [
8]. The effective operation of public transport systems is closely related to a detailed understanding of the behavior of its participants. In Hong Kong, research focused on evaluating spatial, temporal, modal, and targeted user group parameters based on data from smart cards [
9]. Knowing the social demographics of passengers is the basis for the future design of transport services. This topic was addressed by a study that used data extracted from traffic cards to understand and assess the travel habits of different population groups [
10]. A study in Canada focused on assessing the impact of transport mobility benefits on older non-working citizens [
11]. Business trips have a significant impact on the increased demand for transport services. A Swedish study tested the interaction of the application of mobility services with the reservation and implementation of business trips in the context of public transport as well [
12]. Part of the provision of transport is also the offer of shared mobility services in urban areas. Understanding the decision-making process when choosing public transport or alternative shared means plays a significant role in setting up a mobility plan [
13]. A French study evaluated mobility with lower density, and the results showed that it is in such cases that carpooling and walking in conjunction with mobile apps are most applied [
14]. Shifting traffic in cities to public transport services ensuring mobility is also closely related to a properly set parking policy, especially in city centers [
15]. The choice of transport mode is also connected with the assessment of safety. Travel users perceive the provision of safe driving very sensitively and have high expectations for intelligent transport systems [
16,
17].
Cluster analysis is widely used in various areas, including the transport sector. In a Portuguese urban area, cluster analysis was used to investigate the segmentation of public transport users and their perception of satisfaction with transport services, revealing four user segments [
18]. London’s public transport network was an area of research that considered the heterogeneity of commuters and assessed the diversity of urban residents as well as temporal attributes within days and sequences of activities [
19]. Another English study focused on the approach to the analysis of travel workflows based on geodemographic classification [
20]. The recognition of the important predictor was identified through cluster analysis in traffic congestion, while the factors influencing the management, flow, and functioning of traffic were outlined [
21]. The impact of transport on carbon dioxide emissions in Chinese cities was also examined using a two-stage cluster analysis, which was divided into various categories based on the degree of impact of each driver [
22]. Another study focused on traffic from the point of view of motorcyclists, and segmented motorcycle crashes into homogeneous clusters through cluster analysis [
23].
Mobility as a service (MaaS) can be expressed as a tool to achieve sustainable mobility and increase the share of trips by public transport [
24]. It is based on the idea of access to a centralized platform for planning, payment, and travel management along with the combination of several types of transport [
25]. From another point of view, MaaS emphasizes the need to focus on finding the most acceptable way of moving and deciding to make that move [
26]. The term MaaS represents a tool to support mobility. Numerous studies are devoted to this topic. The London study pointed to the potential of the mobility as a service package from the point of view of supporting shared modes. More than half of the respondents confirmed that they would be interested in trying new modes of transport and, thus, supporting travel by shared modes [
27]. MaaS is defined as a user-oriented service concept providing people with door-to-door mobility solutions. The importance of future planned bus transport in the context of MaaS appears to be an essential element in strengthening public transport [
28]. The possibility of unified search, reservation, and payment through a digital platform helps to promote mobility. Even though it focuses more on passenger transport, the idea of integration of freight transport was also investigated, as the means of freight transport affects the capacity of road traffic and, thus, affects mobility [
29]. The MaaS scheme operates in various industries, and it is described in many studies. Another London study focused on examining newly existing mobility services such as car sharing or bike sharing and their impact on urban mobility [
30]. The legislative framework within the digital market in the context of Maas is addressed by research that pointed to the need to harmonize the legal framework for personal multimodal transport [
31]. A Dutch study also addressed the topic of MaaS implementation and its impact on passengers’ transportation, in which five different clusters were identified concerning individuals’ inclinations [
32]. An Australian study assessed consumer preferences, where willingness to use MaaS was shown to be dependent on age and life stage [
33]. A German study addressed MaaS from the perspective of identifying key motivational determinants and their interrelationships [
34].
The Maas initiative provides a comprehensive approach to solving urban mobility through a single interface, with technical support and a journey planner as desirable elements [
35]. From the results of research on the use of MaaS in Metro Manila, it was concluded that the respondents highlighted the reliability and cost savings, and about 80% of them would use the MaaS application [
36]. A Belgian pilot study looked at the possibilities of replacing the car with the effects of MaaS, with findings indicating the impact of MaaS on car ownership and use [
37]. Another study on MaaS focused on mobility as a service preferences in the context of understanding potential demand from the perspective of different subscription options [
38]. The international Delphi study gathered the opinions of experts on the future implementation of MaaS, in which their attitudes and reactions to vulnerabilities as well as opportunities were considered [
39]. The impact of shared mobility on MaaS was addressed in a case study in Madrid, where emerging shared mobility operators and their provided transport services were investigated [
40]. Travel behavior and the connection to MaaS were addressed in another study, where the preference for public transport from the perspective of passengers with a motor vehicle was compared [
41]. The need for innovation and the provision of public benefits to the traveling public was highlighted as a significant prerequisite for the future preference for MaaS [
42].
Solving key social trends such as reducing greenhouse gas emissions or solving problems with congested roads are positive effects that are expected. Shift2Rail IP4 supports MaaS routing to offer transport services and specific route settings directly with individual operators through a digital platform. The IP4MaaS project aimed to support the deployment of MaaS schemes by testing technologies developed under IP4 within Shift2Rail through complementary IP4MaaS projects through demonstration implementation. This project involved 26 participants from eight countries (Belgium, Spain, Greece, Italy, Poland, Croatia, the Czech Republic, and Slovakia) to achieve jointly set goals. Project activities between partners were strengthened by mutual co-creation such as brainstorming, workshops, and imaginative activities with the aim of harmonizing opinions and achieving set goals through project demonstrations [
43].
2. Materials and Methods
The data from our questionnaire survey led to us obtaining the needs and expectations of potential users within MaaS activities. We used a conversational survey using the Coney tool, while the questions were asked via chat. It was easy to answer the list of questions in the form of an online interview through this platform. The original English version was translated into several languages, while our partial survey used the Czech language. The survey was anonymous and took place from 1 March 2022 to the end of April [
43]. The questionnaire was answered by respondents over the age of 18. The questionnaire was divided into two sections: a socio-demographic section (age, gender, social status) and an application section focusing on functionality and user-friendliness. We segmented users using two-step cluster analysis in the statistical analytical program SPSS 26. This program was used to calculate the relative importance of the predictor (see
Figure 1) based on the formula below.
where:
Clustering is a known way of segmentation in many areas, including k-means, hierarchical clusters, and two-step clusters. Two-step cluster analysis is a different algorithm from traditional clustering techniques for handling categorical and continuous variables, determining the automatic selection of the number of clusters, and scalability. In other words, the method uses categorical and continuous variables [
45]. Two-step cluster analysis is useful when the dataset has a complex structure or when there is no clear prior knowledge about the number of clusters. This approach provides a flexible and effective way to uncover the underlying structure in the data and generate meaningful insights.
Distance measures explain how the similarity between two clusters is computed using log-likelihood and Euclidean distance. Euclidean measures only use continuous variables, in contrast to log-likelihood distance. This method assumes that all variables are independent. Moreover, continuous variables should be normally distributed, and categorical variables should be multinomial.
2.1. Log-Likelihood Distance
The log-likelihood distance (also known as the log-likelihood ratio) is a measure of the difference between two probability distributions. It is commonly used in information theory and machine learning to compare the fit of two models to a given set of data. The log-likelihood distance is defined as the difference between the log-likelihood of the observed data using one model and the log-likelihood of the same data using a second model. A smaller log-likelihood distance between two models indicates that the two models are more similar in their predictions for the observed data, while a larger log-likelihood distance indicates that the models are less similar. In other words, a model with a higher log-likelihood is considered to be a better fit for the data, and the log-likelihood distance can be used to compare the goodness-of-fit of different models. Finally, using log-likelihood distance in two-step cluster analysis can provide a more robust clustering method compared to methods that only use Euclidean distance or other measures of similarity. The distance between clusters i and j is defined as
where:
is the total number of continuous variables;
is the total number of categorical variables;
is the number of categories for the kth categorical variable;
is the total number of data records in cluster s;
is the number of records in cluster s whose categorical variable k takes the l category;
is the estimated variance of the continuous variable k;
is the estimated variance of the continuous variables k in cluster j;
is the distance between the i and the j;
is the index representing cluster formed by combining clusters i and j [
45].
2.2. Optimal Cluster Number
The optimal number of clusters is identified by the maximum value of the ratio of distance measures according to [
46,
47] in the statistical analytical program IBM SPSS 26. BIC and AIC are calculated for each number of clusters within a specific range. These indicators identify the optimal number of clusters. AIC (Akaike information criterion) and BIC (Bayesian information criterion) are both measures of the goodness-of-fit of a statistical model used to compare different models and select the best one. Both AIC and BIC balance the model’s goodness-of-fit with its complexity, as a model with too many parameters can easily fit the data too well, but at the cost of overfitting. In general, AIC and BIC provide similar information, but BIC tends to favor simpler models, while AIC is more balanced between fit and complexity. The choice of which measure to use depends on the specific problem and the trade-off between model fit and complexity that is desired. BIC statistics for a partition with R clusters are calculated as:
with
where:
In addition, we also monitored the ratio of BIC changes and the ratio of distance measures. However, the statistical analytical program automatically determines the optimal number of clusters without the author’s decision [
49].
2.3. Cluster Quality
The silhouette coefficient is a measure of the quality of a clustering solution in unsupervised machine learning. It provides a way to assess the similarity of the data points within a cluster and the dissimilarity between different clusters. The silhouette coefficient ranges from −1 to 1, where a value close to 1 indicates that the data points in a cluster are well separated and similar to each other, while a value close to −1 indicates that the data points in a cluster are dissimilar and assigned to the wrong cluster. A value close to 0 indicates that the data points are indifferently similar to their cluster and the neighboring clusters. In other words, the silhouette value identifies poor classification (from −1.0 to 0.2), fair classification (from 0.2 to 0.5), and good classification (from 0.5 to 1.0) [
50]. This coefficient is computed for each data point, and the average silhouette score for all data points provides an overall measure of the quality of the clustering solution. The silhouette score can be used to compare different clustering solutions and to determine the optimal number of clusters for a given dataset. The silhouette value is calculated as
where:
is the silhouette coefficient for the ith object;
SC is the average silhouette coefficient;
is the average of the minimum distance between the ith objects in the same cluster (average intra-cluster distance);
is the average of the minimum distance between the ith objects in a different cluster (average inter-cluster distance);
, are cluster elements;
is the distance;
, are the number of objects in the gth (hth) cluster;
is the total number of observations [
50,
51].
It is a widely used metric for evaluating clustering solutions and is particularly useful for datasets with defined clusters or for datasets with a large number of clusters.
3. Results
Optimal cluster number.
Table 1 reveals important metrics such as BIC, BIC change, ratio of BIC, and ratio of distance measures determining the optimal number of clusters. The maximum value of the ratio of distance measures identifies four clusters as the optimal number.
Cluster quality. The silhouette measure is higher than 0.2. This metric represents the fair zone. These results demonstrate that the behaviors are significantly different from each other, but respondents in individual groups have similar features and preferences.
Cluster structure.
Table 2 shows that the total number of respondents is 350, but all four clusters consist of 261 respondents. Other respondents are excluded due to missing data. As can be seen, clusters consist of different numbers of respondents. We find that the third cluster consists of more than 80 respondents (31.40%). On the other hand, the first cluster includes fewer than 50 respondents (18.00%).
Moreover,
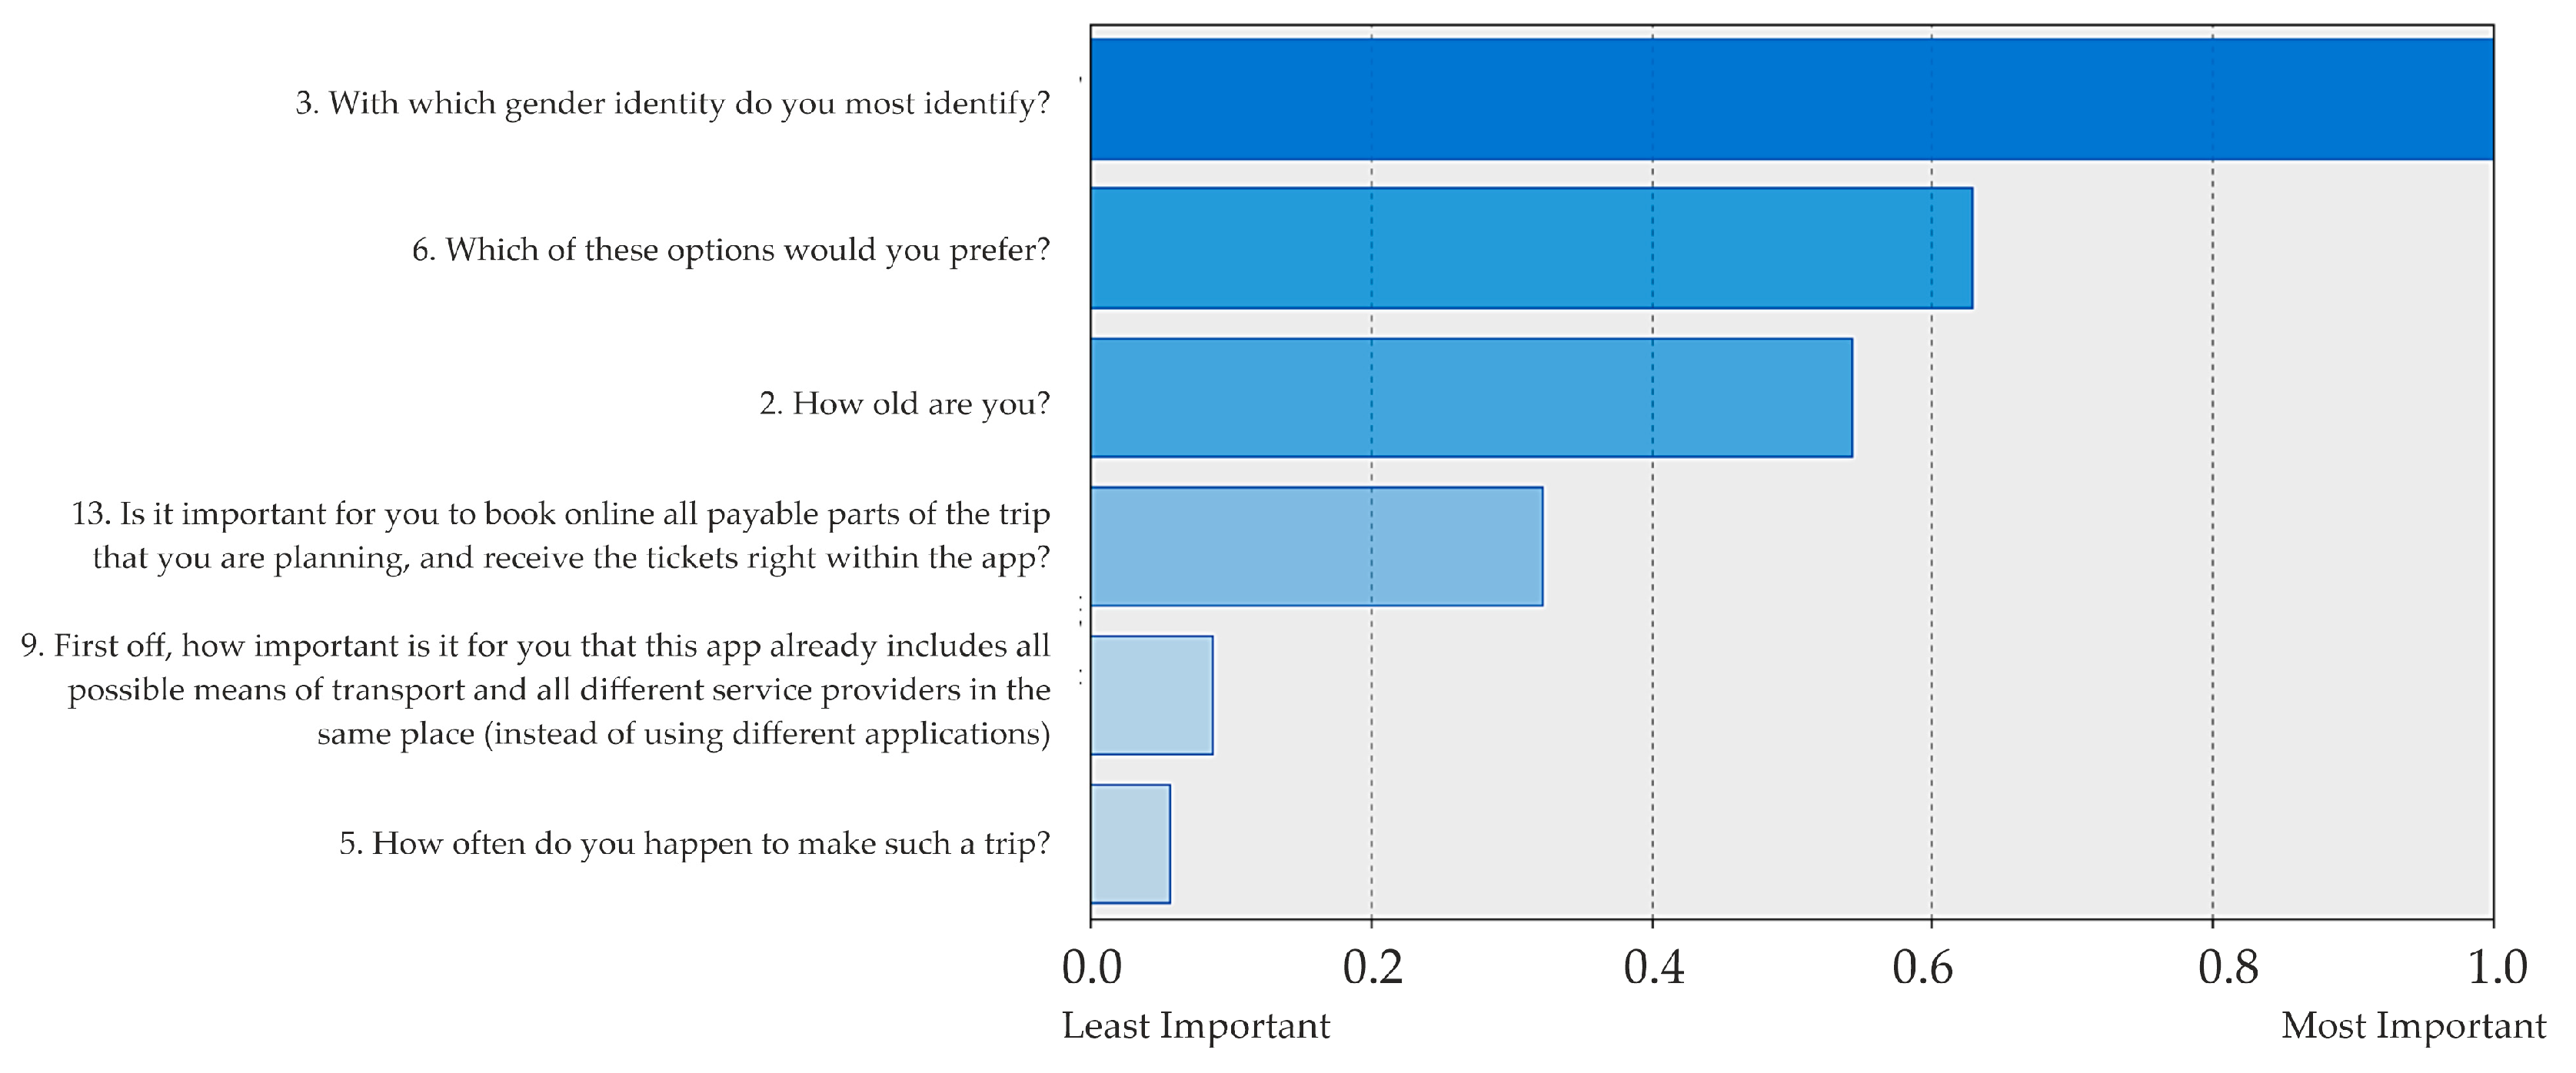
Figure 1 shows that the most significant predictors are gender (100%), user preference focusing on using a website, mobile application, or both (63%), and age category (54%). Other predictors are less significant. Predictor importance explains the relative importance of each predictor.
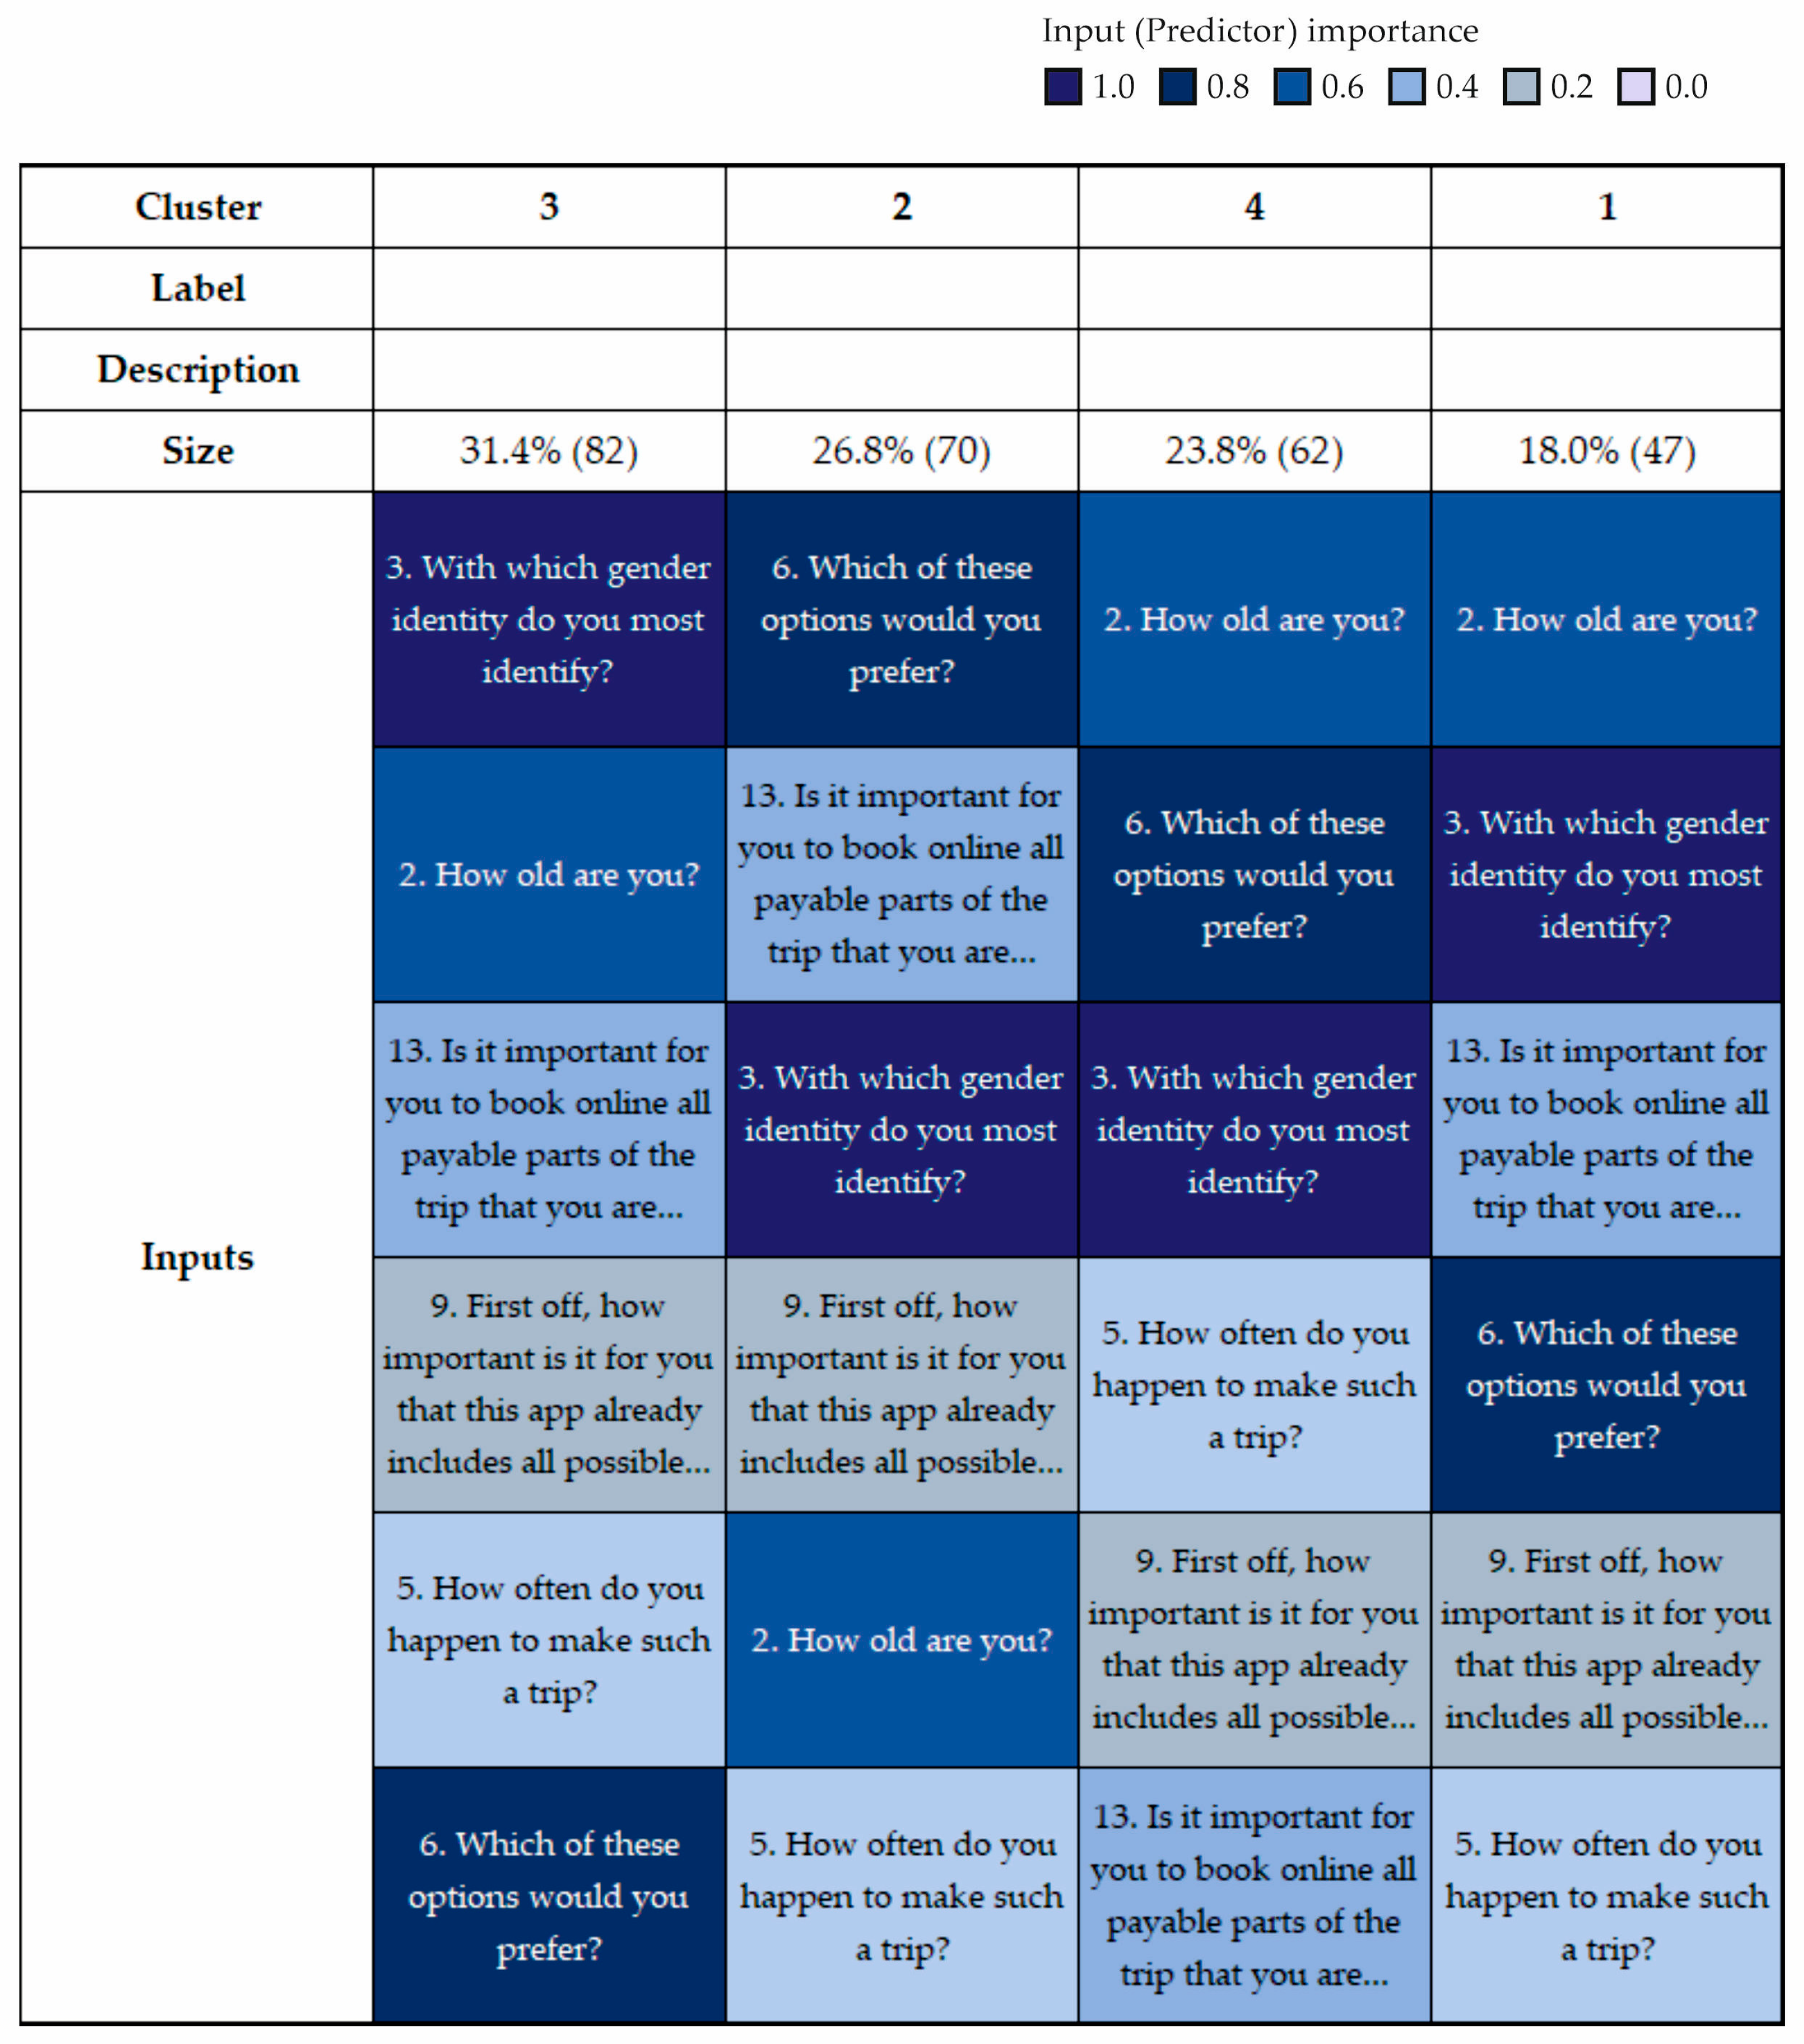
Figure 2 shows that the respondents are divided into four clusters. These clusters are made up of respondents with similar demographic characteristics and preferences for using applications. As can be seen, these clusters are created using six input categorical variables such as gender, age category, trip frequency, and user preferences. The color scale distinguishes predictors by within-cluster importance (see the legend).
Table 3 demonstrates that the first cluster consists exclusively of respondents aged 18 to 24. Other age groups are not represented in this cluster. On the other hand, the fourth cluster consists of respondents from 25 to 64 years old; both age categories from 25 to 44 and 45 to 64 have equal representation. Finally, the second and third clusters have diverse representations in all age categories. We find that the second cluster consists primarily of respondents from 18 to 24 years old, unlike the third cluster. This cluster consists of respondents from 25 to 44 years old (44.80% of this age group).
Table 4 reveals that the first cluster consists only of men, unlike the third group. On the other hand, the second and fourth groups are made up of both sexes, but the majority are men.
Table 5 demonstrates that respondents in the second and third clusters often go on trips, unlike the other groups.
Table 6 shows that mobile applications are popular for three of the four clusters; the exception is the second cluster. This cluster prefers a web application as opposed to a mobile application.
Table 7 demonstrates that access to information about all possible means of transport in the same place is extremely and very important for most users.
Table 8 reveals that respondents substantially prefer online booking and quick access to tickets in the app in all clusters except the second cluster.
Moreover,
Appendix A contains the tables dividing respondents into clusters according to selected variables.
Cluster comparison.
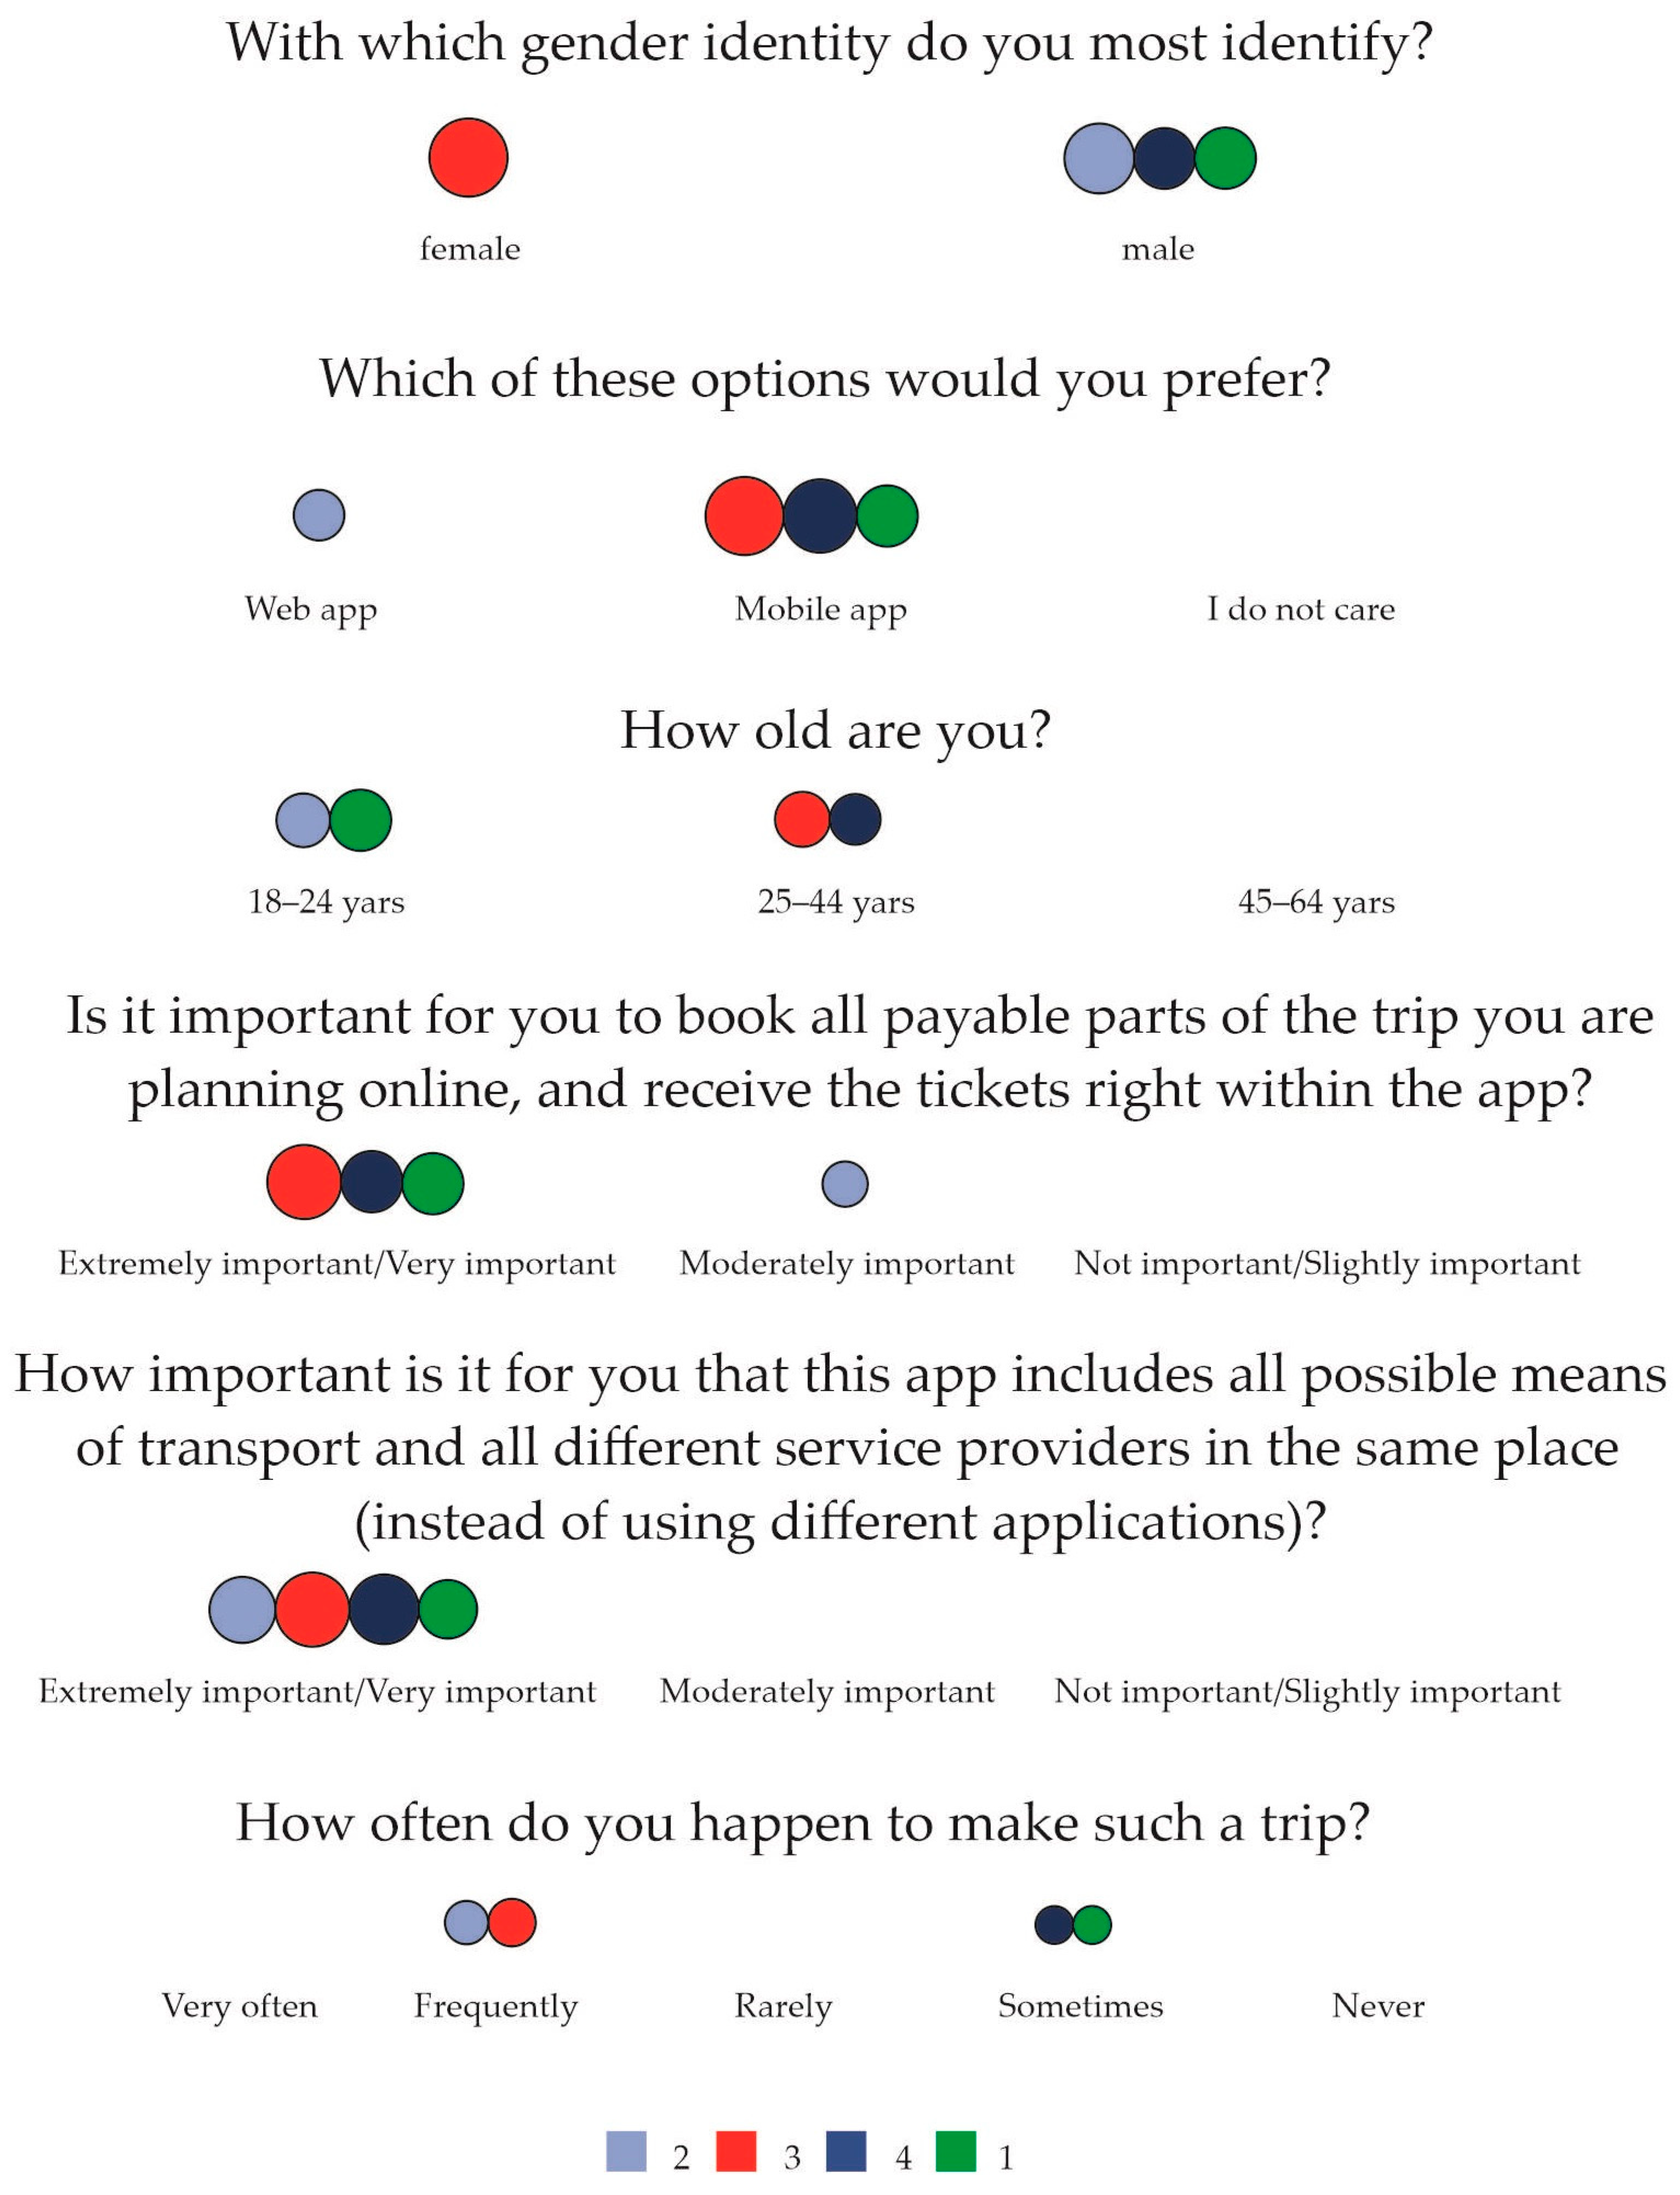
Figure 3 compares all four clusters. We find that the third (red) cluster consists only of women who prefer mobile applications to web applications (almost 83%). Most women are between 25 and 45 years old (47.6%). These women often go on trips, and online booking of all parts of the trip and quick access to transport information in one application is very or extremely important. The other groups include mainly men. Moreover, the first (green) cluster comprises only men. Men prefer the mobile app in all clusters except the second cluster. The results show that most of the men are between 18 and 24 years old. Finally, frequent travel is typical for the second (light blue) cluster, with a lower preference for online booking of all parts of the trip as the only cluster. However, information about all possible means of transport is very or extremely important. Even though the first (green) and fourth (dark blue) clusters travel less often than the other groups, both groups prefer one mobile application with all important information about means of transport and online booking with easy access to tickets.
4. Discussion
The field of transport offers a lot of data, which with proper analysis and interpretation can bring a lot of benefits. The following studies performed cluster analysis for sequencing enormous amounts of traffic data to categorize them according to related characteristics and understand mutual associations [
52,
53]. The cluster segmentation technique made it possible to sort travel attendees based on travel distance and frequency of attendance to present a proposal for market applications [
54]. In our case, the respondents were divided according to similar demographic characteristics as well as preferences for using a web or mobile application. Two-step cluster analysis was used in the selection of transport simulation model parameter values for the rapid processing of enormous amounts of data with both continuous and categorical variables [
55]. Our dataset was also redistributed using a two-step clustering method based on the significance of the variables. Cluster analysis was applied to create homogeneous transport markets, where markets of comparable sizes were combined into one group [
56]. The assignment of our sample resulted from grouping into homogeneous groups according to travel behavior. In another study, passenger demand for public transport services was predicted through the spatial clustering of applications [
57]. Our research focused on comparing the preferences of users using a web or a mobile application. A study in the United States assessed the interaction between travelers and online travel systems using cluster analysis [
58]. Support for spatial planning of transport in cities is related to the efficient processing of traffic data. Cluster analysis evaluated travel data in terms of the interaction of travel flows and spatial structure [
59]. The impact of fares on the status of public transport was investigated by a study in Italy that used cluster analysis to segment passengers [
60]. In our article, we examined the preference for online reservations with easy access to tickets. The prediction of the flow of passenger transport was conducted using cluster analysis, which divided the stations into six categories concerning their patterns of passenger transport [
61].
Our paper focused on identifying differences in passenger needs through a statistical analytical tool. Two-step cluster analysis was applied to a wide range of available data from a survey reflecting traffic behavior within MaaS activities. The sample consisted of approximately 300 respondents divided into four clusters. The most influential predictors were gender, user preferences for using a website or mobile application, and age composition. The third cluster was made up of working-age women who prefer mobile applications to web applications, for whom quick access to online booking information is essential. The other groups were dominated by men, while the first cluster was composed exclusively of men. Even though the second cluster in terms of frequent travel was not extremely interested in online booking, the opposite was true in the other clusters. In the first, third, and fourth clusters, respondents preferred reservations through a mobile application, while they rated the availability of traffic information as extremely important.
The limited sample that was available for analytical purposes can be considered a limitation of our research. As part of further research activities, we would be interested in expanding awareness of MaaS activities among the public as well.
5. Conclusions
Traffic movement prediction is determined by the demand for transport services. Identifying real demand is an essential aspect that is facilitated by constantly advancing and improving intelligent transport systems with designed mobility applications. Profiling public transport users is an important prerequisite for understanding the perception and behavior of passengers using public transport services. Achieving the segmentation of public transport participants with the same or at least related features is possible through cluster analysis.
In recent years, the MaaS initiative has been developed, which focuses on understanding travel behavior and combines the offer of transport services of operators on one global platform. The intention of this direction is the possibility of providing online reservations, payments, and the availability of travel information for business but also private trips by supporting all modes of transport within the framework of public transport.
In this paper, the partial results of the demonstration activities of Shift2Rail IP4 for the Slovak and Czech sides were evaluated. Data reflecting travel attitudes were obtained from the online conversational inquiry tool. Cluster analysis was used to evaluate the sample, in which an optimal number of four clusters was identified. Individual clusters consisted of different numbers of respondents with similar characteristics.
This article aimed to identify the differences in the needs of passengers to determine the direction of the use of the application with a focus on the future development of mobility as a service. The importance of individual predictors was determined based on the attitudes towards the input variables. The three most important predictors were considered in descending order, namely gender, web or mobile application preference, and age category. The results of our research indicated that respondents are interested in timely traffic information and prefer a mobile application for online booking. The benefit of this paper was to highlight the partial demographic results affecting travel activities within MaaS for the Czech and Slovak sides. The results of this research for the Czech and Slovak participation are useful for supplementing the overall evaluation of the perception of MaaS in the world.


