
Microalgae Monitoring in Microscale Photobioreactors via Multivariate Image Analysis


Abstract
:1. Introduction
2. Materials and Methods
2.1. Microalgae Strain and Cultivation Method and Assays
2.1.1. Analytical Procedures
2.1.2. Sample Preparation
2.1.3. Digital Image Acquisition
- ISO: 100;
- diaphragm opening: 6.3;
- exposure: 1/50 s;
- zoom: 3.5×;
- focal length: 15.1 mm.
2.1.4. Fluorescence Measurement Acquisition
- shutter = 1, corresponding to an aperture of 20 μs;
- sensitivity = 5, in a range 0–100;
- actinic light intensity (Act2) = 45, corresponding to 1150 μmol·m−2·s−1;
- pulse intensity (Super) = 35, corresponding to 1300 μmol·m−2·s−1.
- in the first 5 s of the protocol, minimum fluorescence is measured five times by using a measuring light;
- then, a saturating pulse (duration 800 ms) is used to calculate the maximum fluorescence and the variable fluorescence , where ;
- a dark phase of 17 s is used to relax all photosystems;
- actinic light is turned on for 70 s and after this, three saturating pulses (800 ms each) are produced at intervals of 10 s and another two pulses at an interval of 20 s. This allows the identification of the local maxima fluorescence due to progressive light acclimation, which is useful to describe NPQ dynamic (obtaining at different lights and , which is the steady-state value);
- actinic light is then turned off and this dark phase lasts until the end of the experiment. During this dark phase, three saturating pulses (800 ms each) are used at intervals of 30 s, identifying local fluorescence maxima allowing to calculate the relaxation of NPQ.
2.2. Mathematical Background
2.2.1. PLS Regression Fundamentals
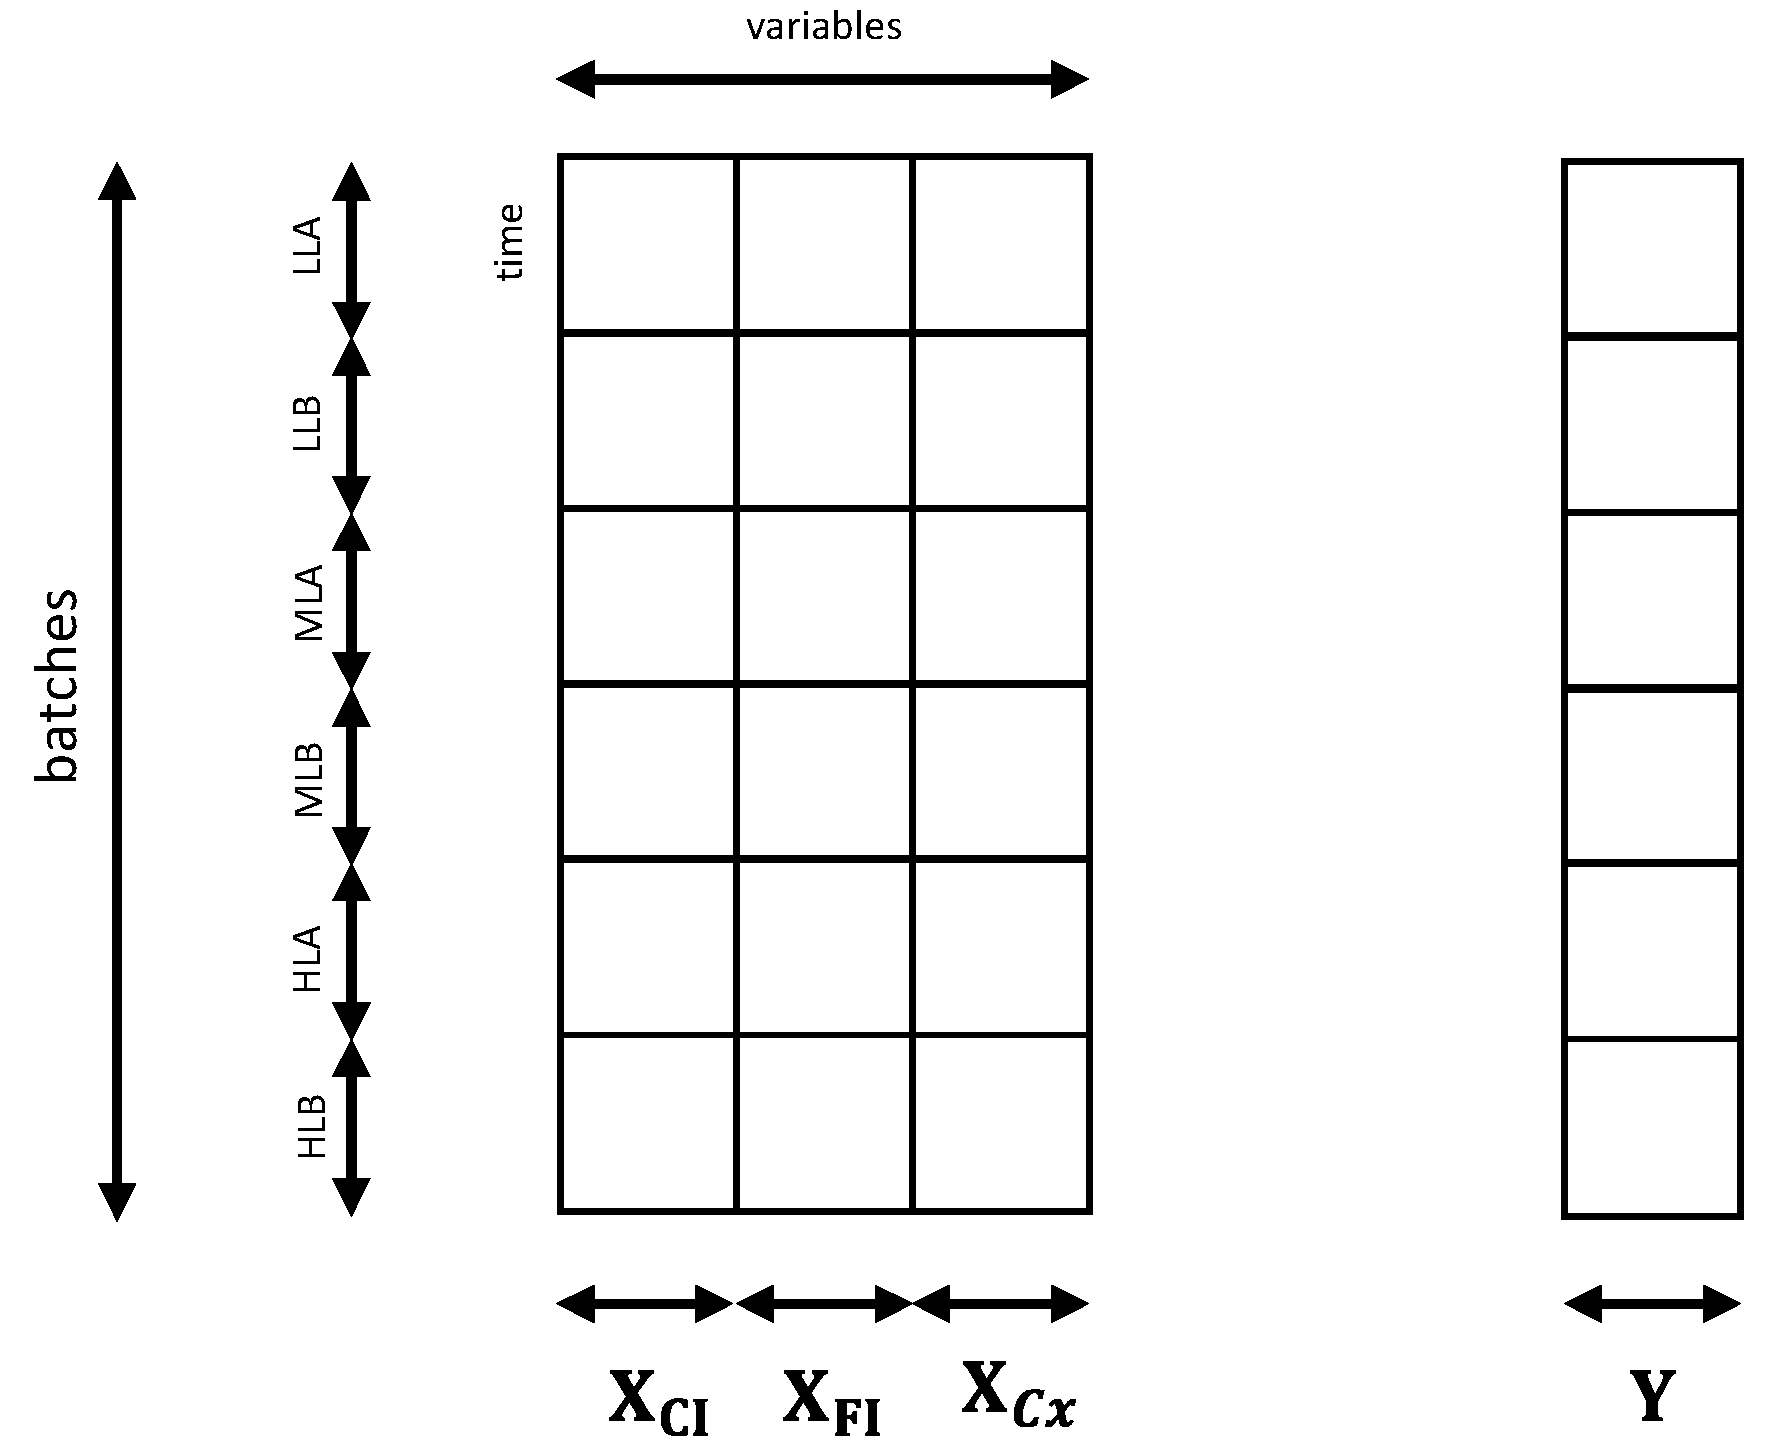
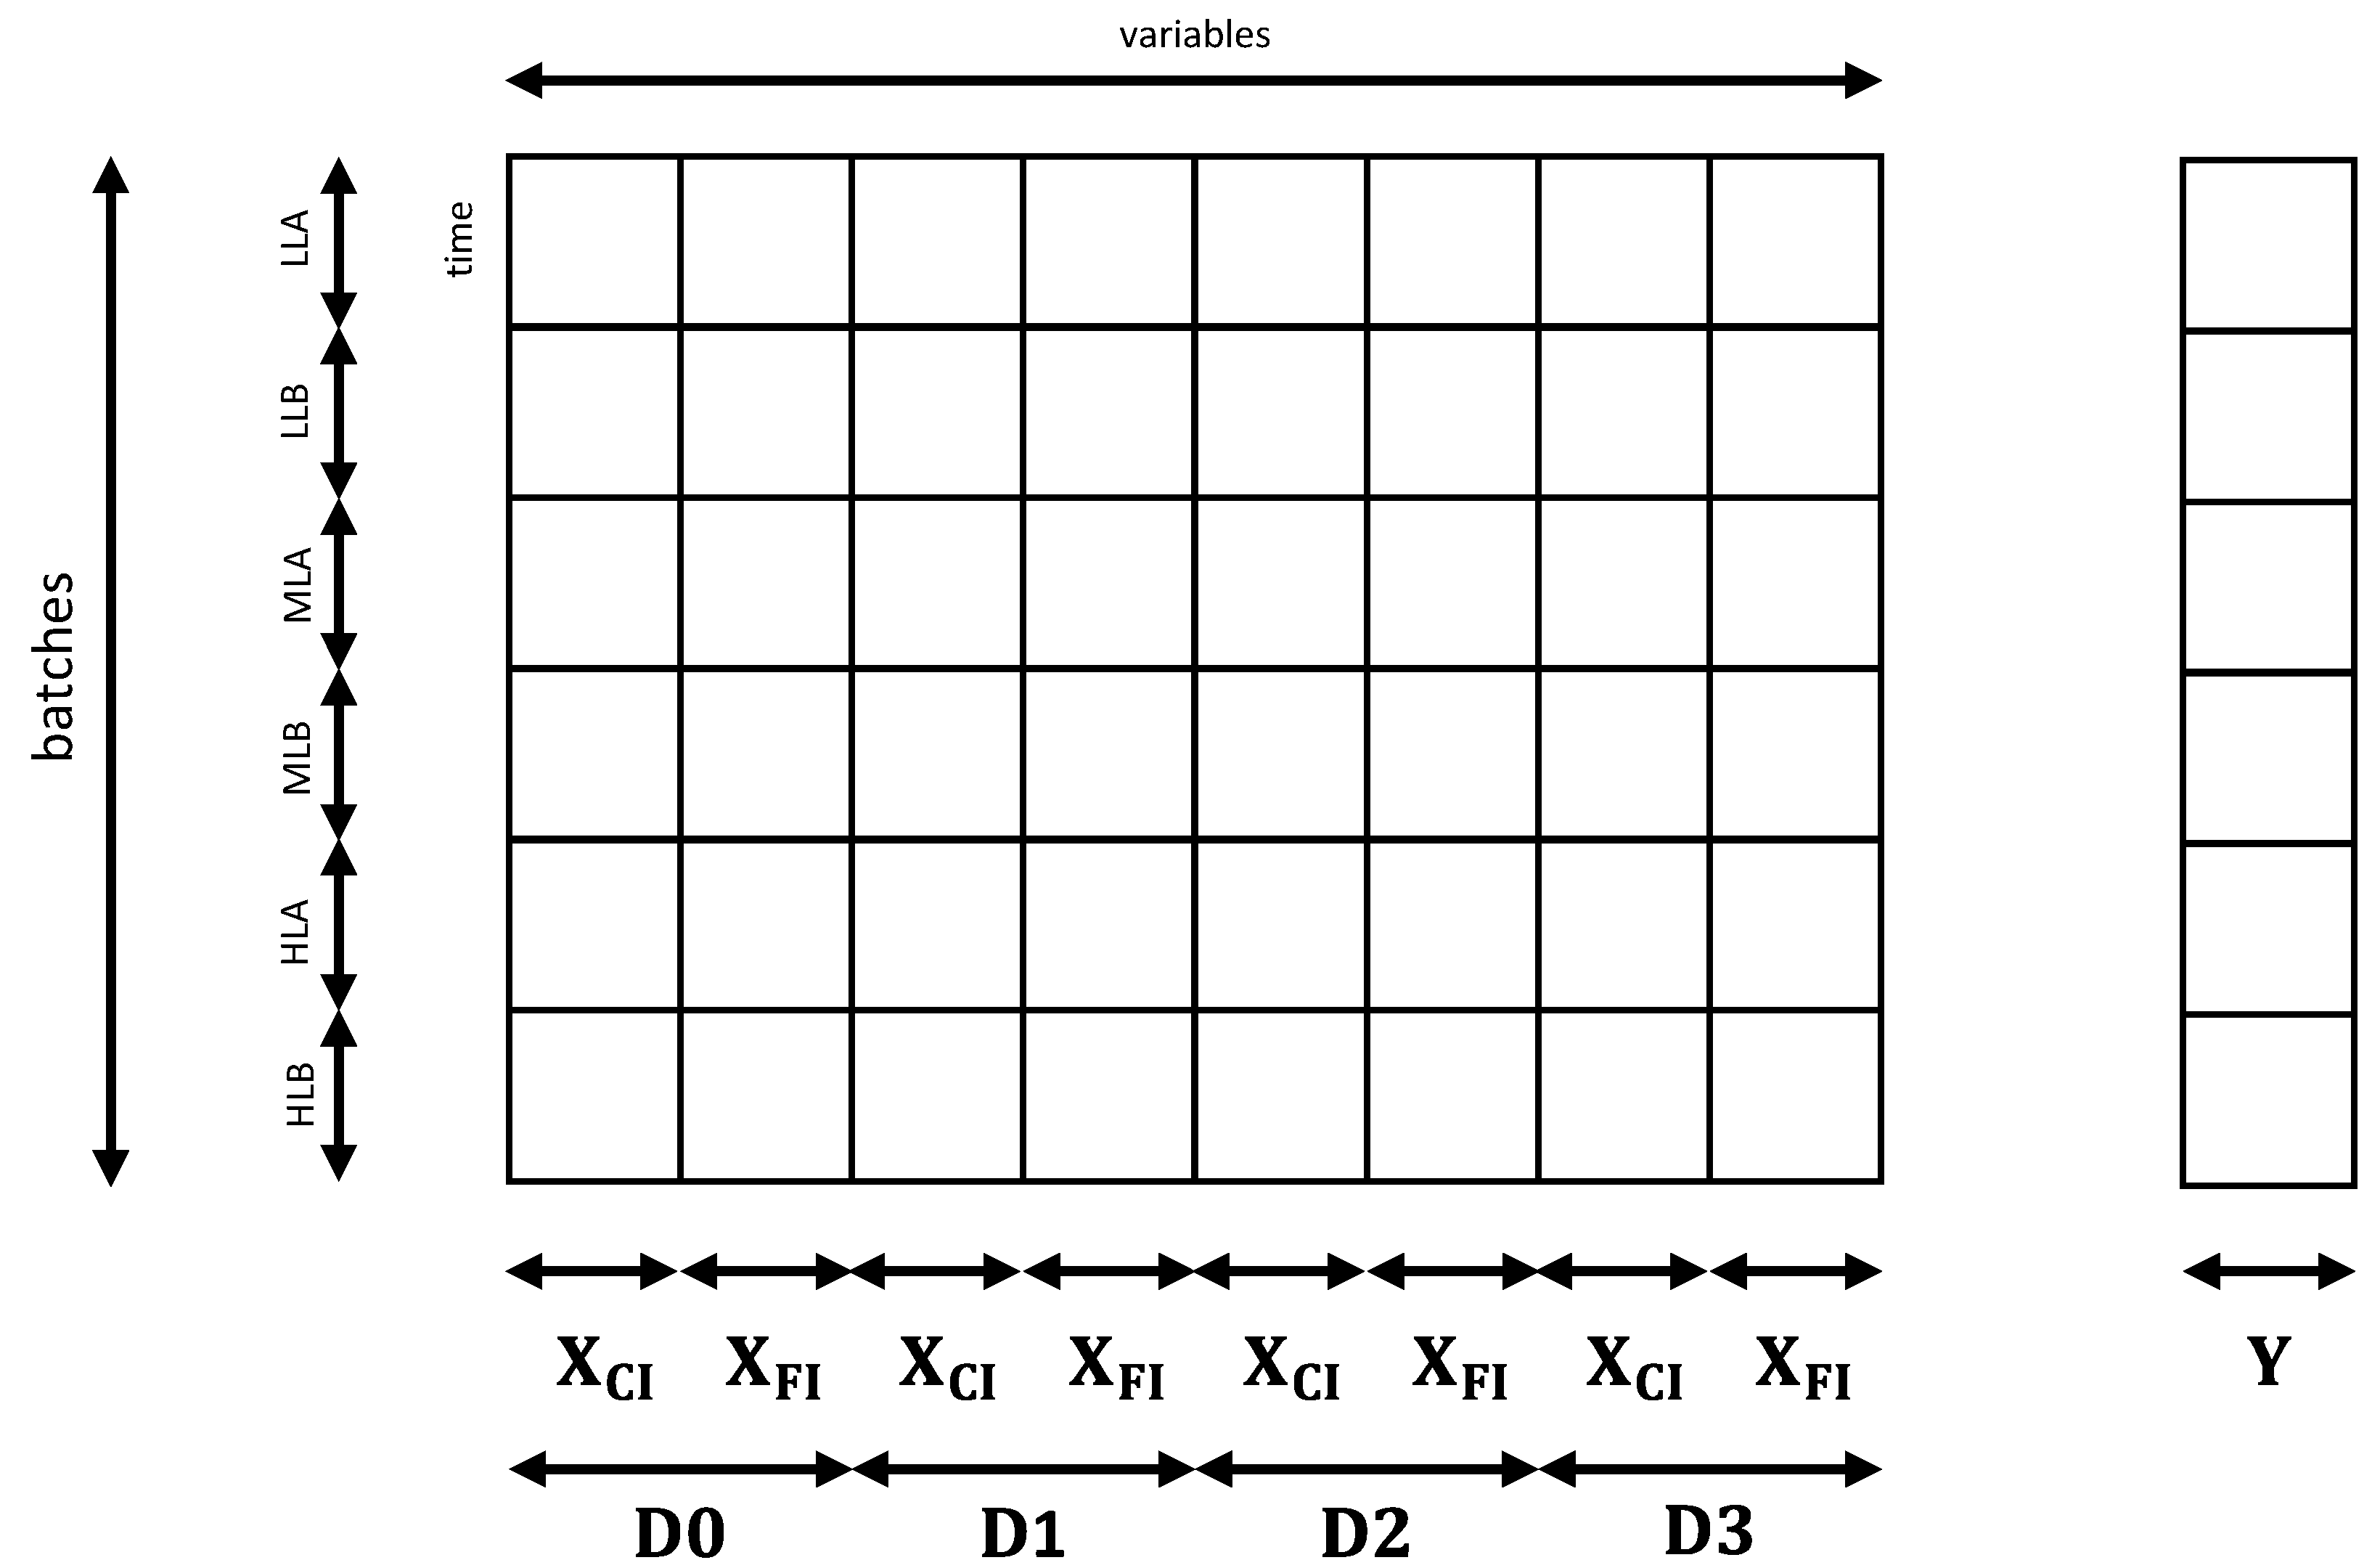
2.2.2. Image Pretreatment and Available Measurements
- 6 color indices (CI) obtained from the digital image
- 7 fluorescence indices (FI) obtained from the PAM-imaging: , , , , , , ;
- biomass concentration obtained with manual count at the microscope: ;
- Chl a content obtained with the spectrophotometric assay: Chl a.
2.2.3. PLS for Biomass Concentration Estimation
- C[Cx]: only color indices were used to predict biomass concentration;
- C[Cx]: CI and FI were used in the prediction of the concentration;
- C[ln(Cx)]: only color indices were used to predict the logarithm of the concentration;
- C[ln(Cx)]: only fluorescence indices were used to predict the logarithm of the concentration;
- C[ln(Cx)]: CI and FI were used in the prediction of the logarithm of the concentration.
2.2.4. PLS for Chlorophyll Content Estimation
- P[Chla]: only color indices were used to predict Chl a content;
- P[Chla]: color indices and biomass concentration were used to predict Chl a content;
- P[|Chla]: color indices, biomass concentration and fluorescence indices were used to predict Chl a content.
2.2.5. Assessing Model Performance
3. Results
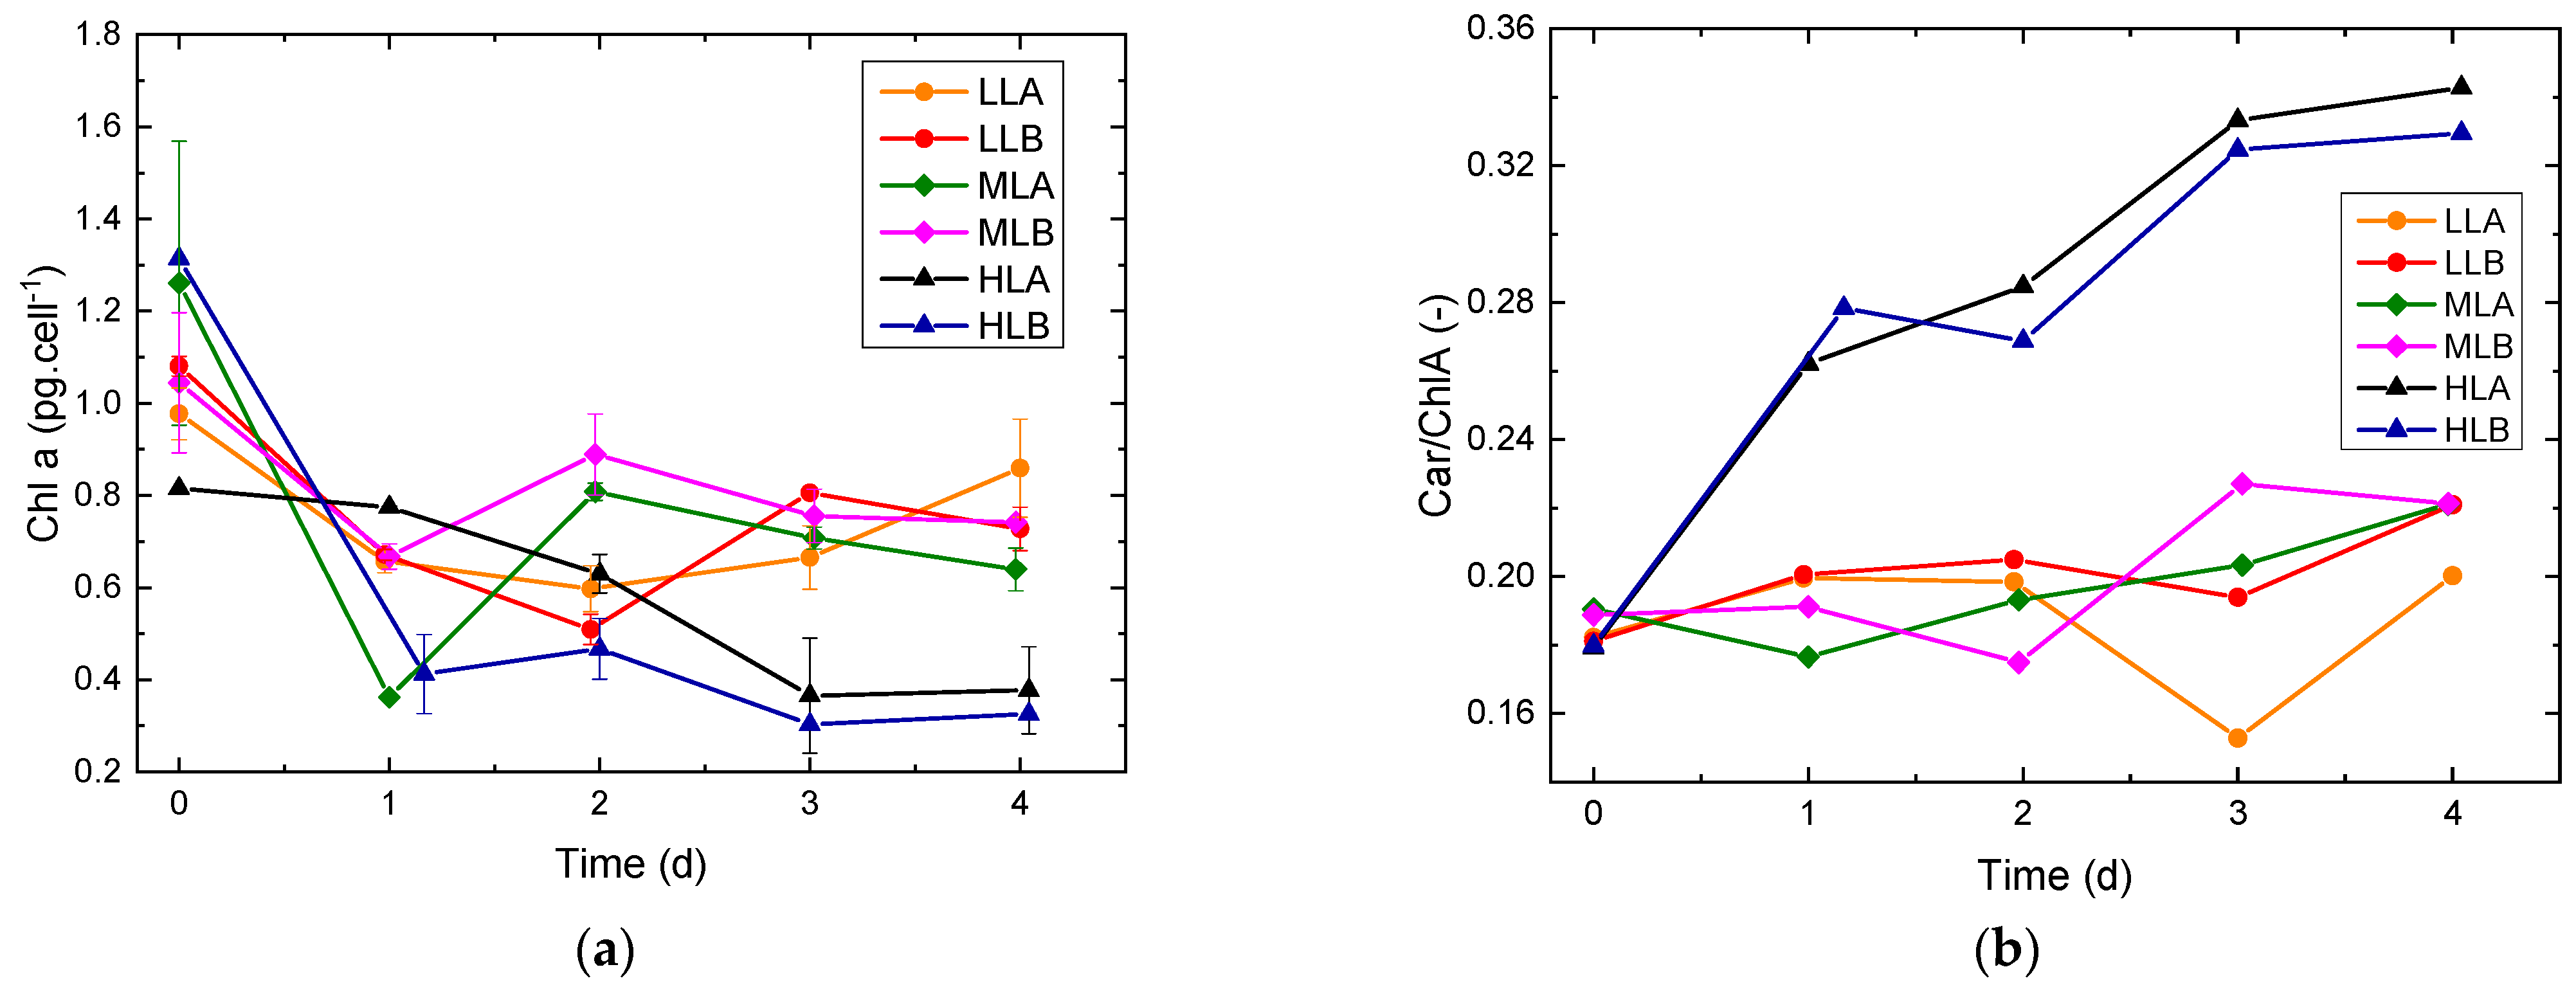
3.1. Batch Culture Evolution
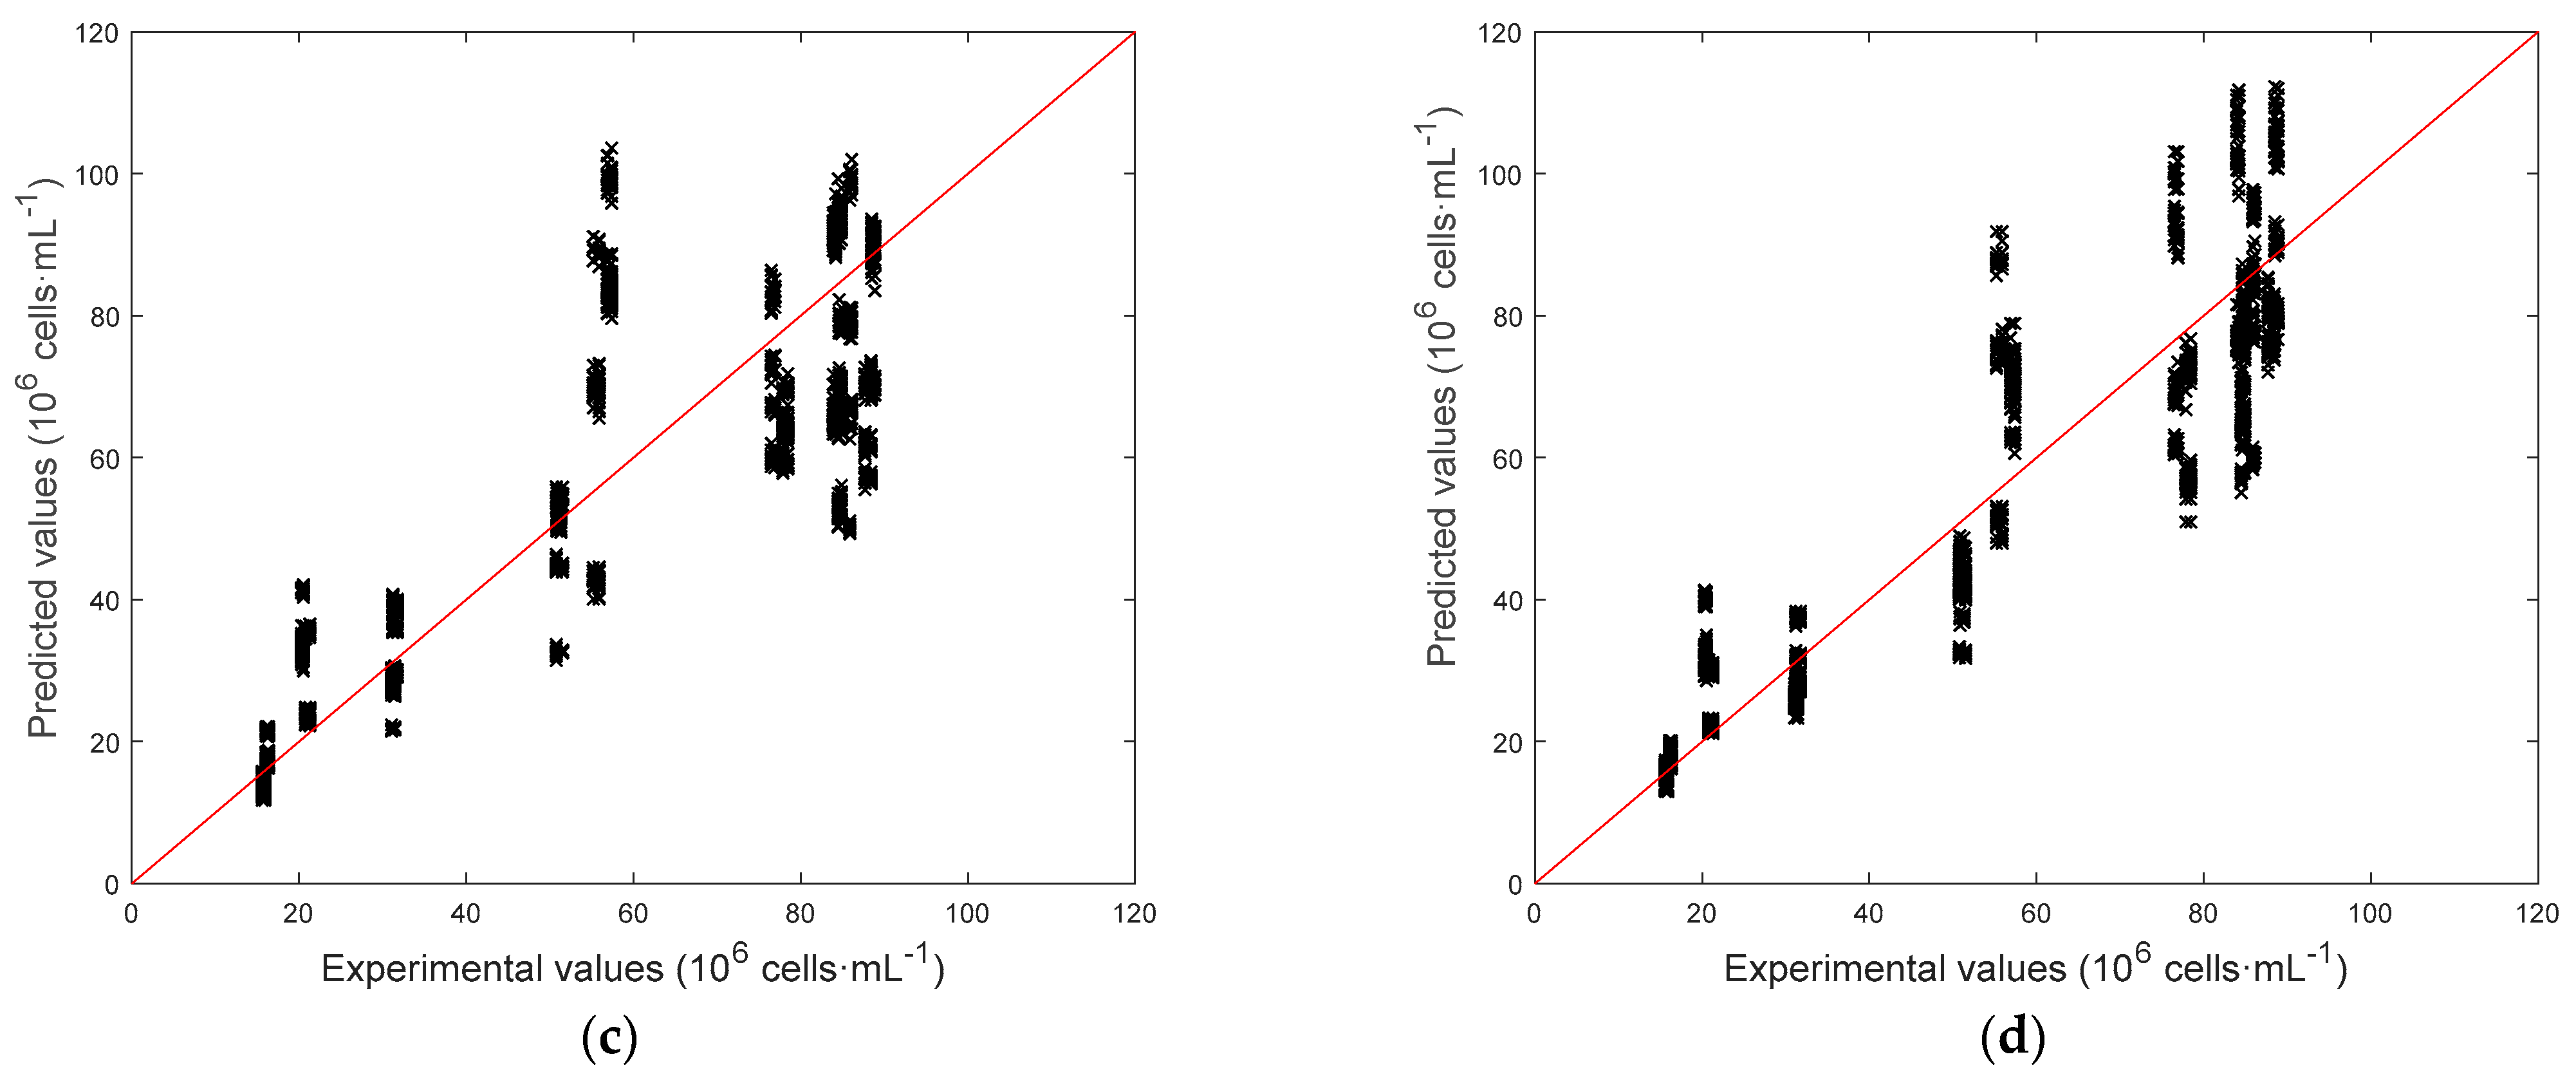
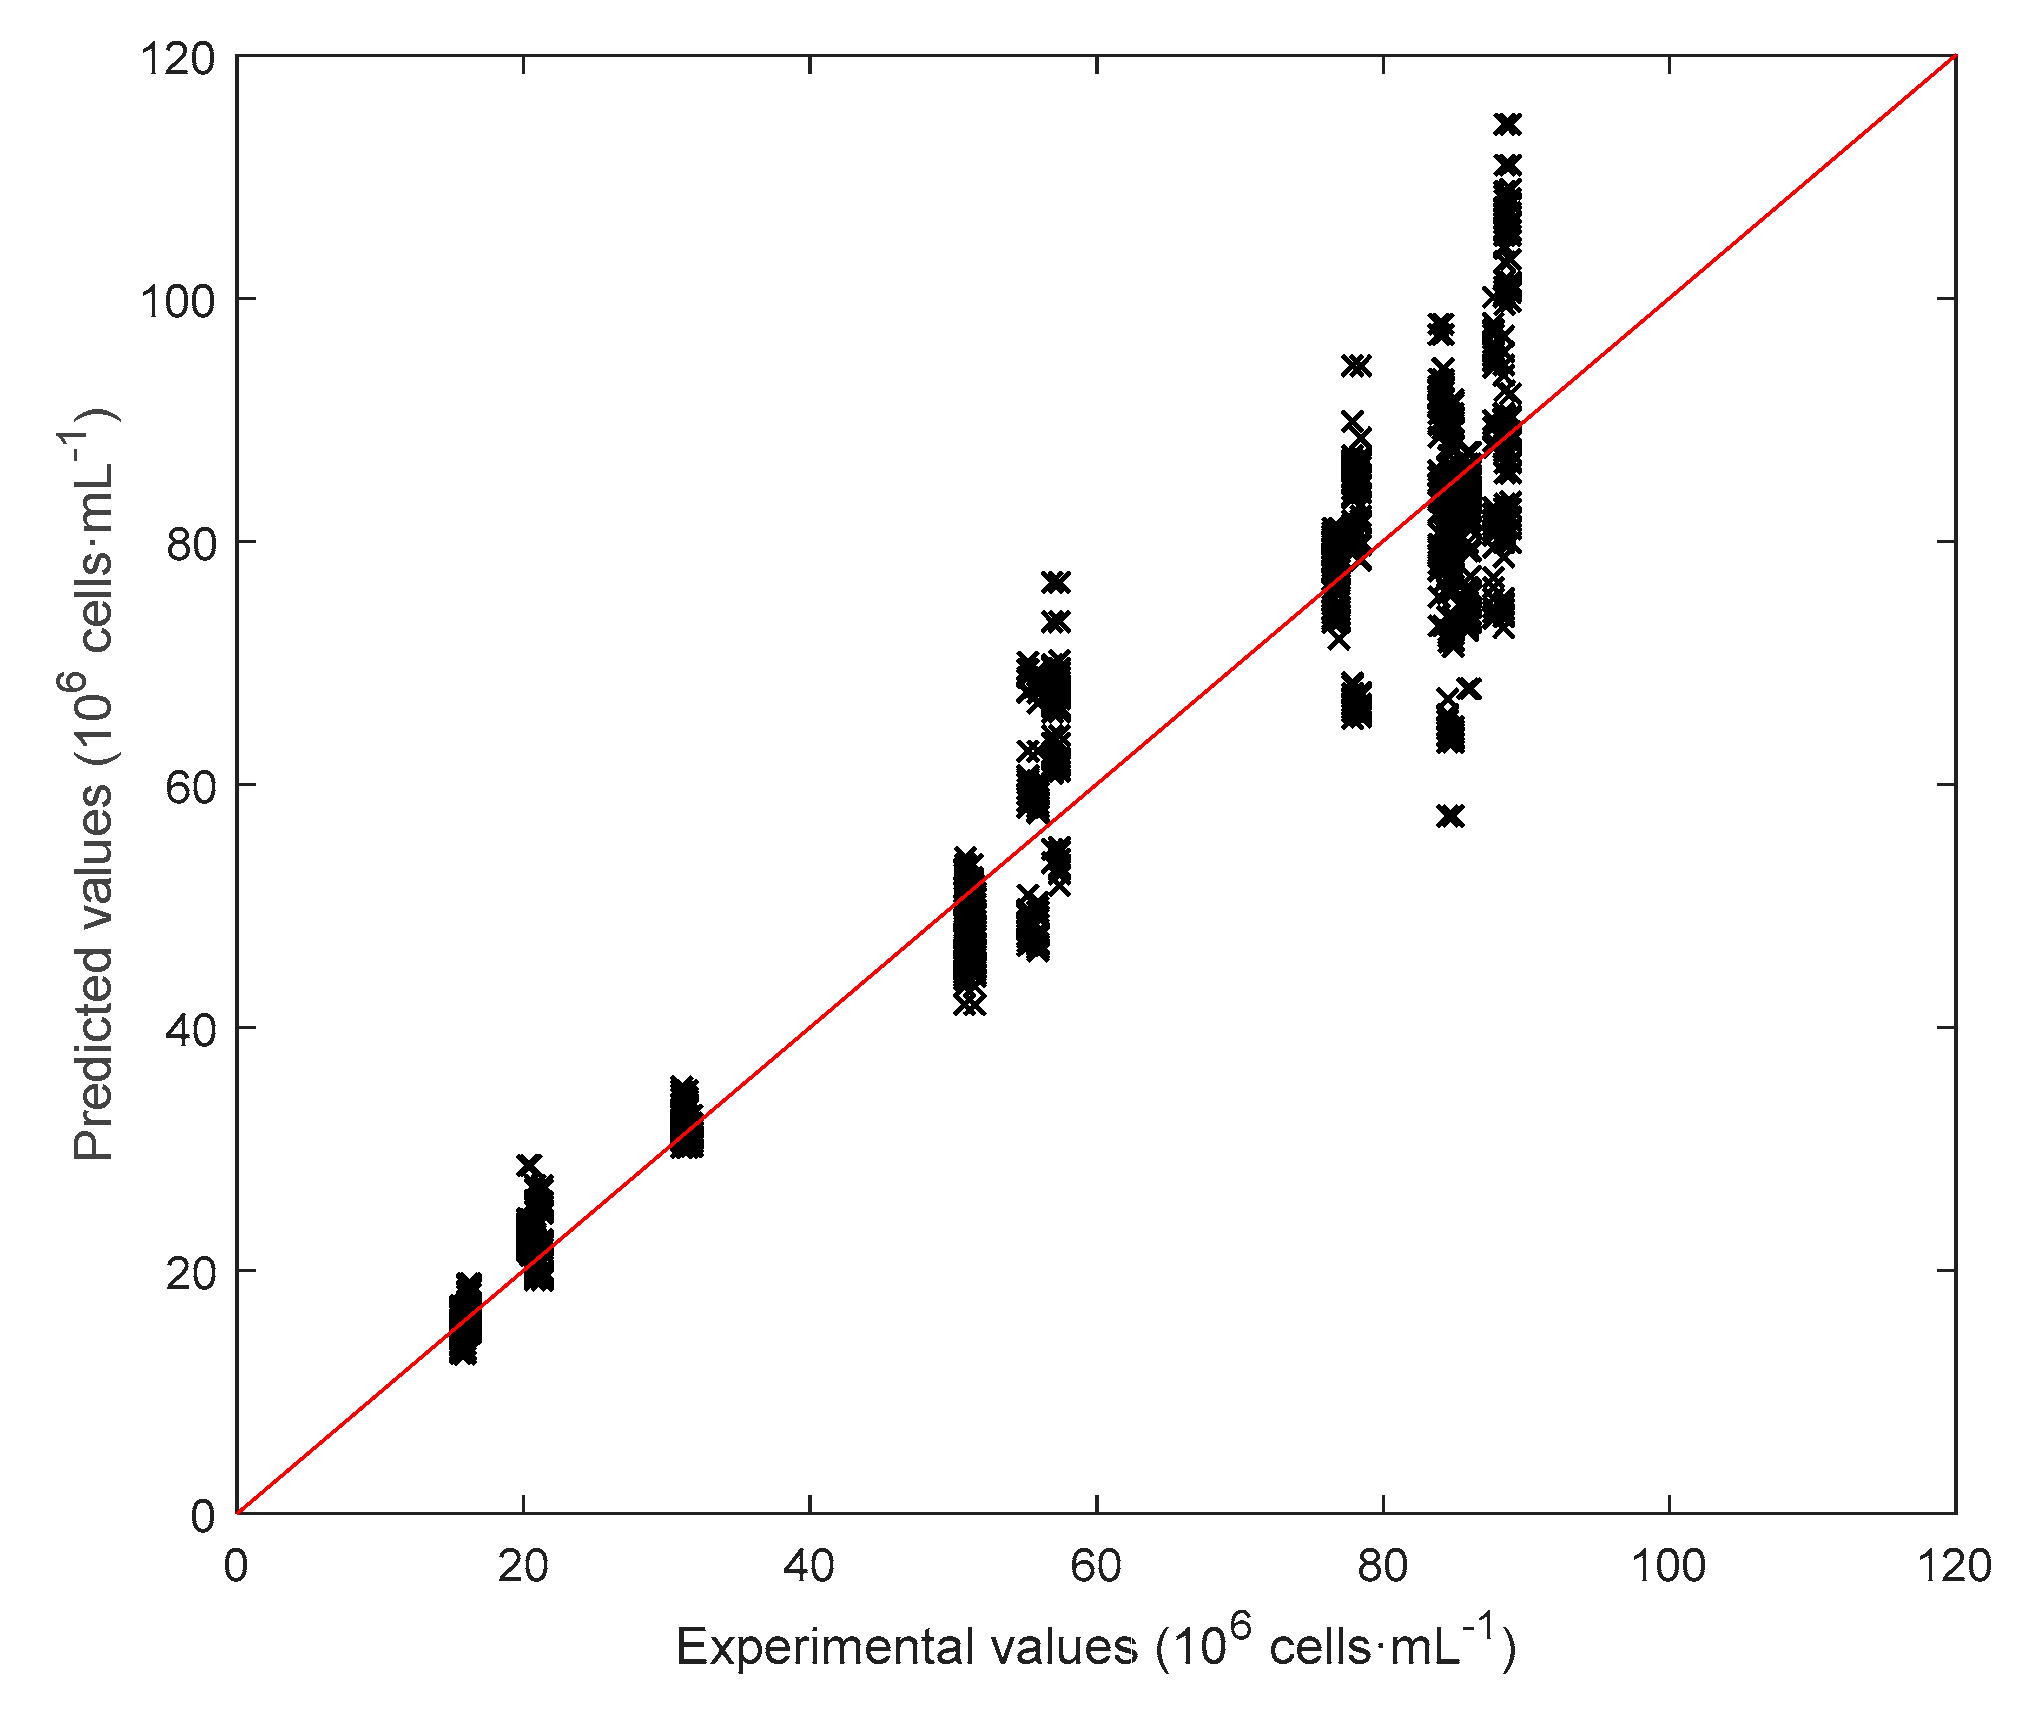
3.2. Results of the Biomass Concentration Estimation
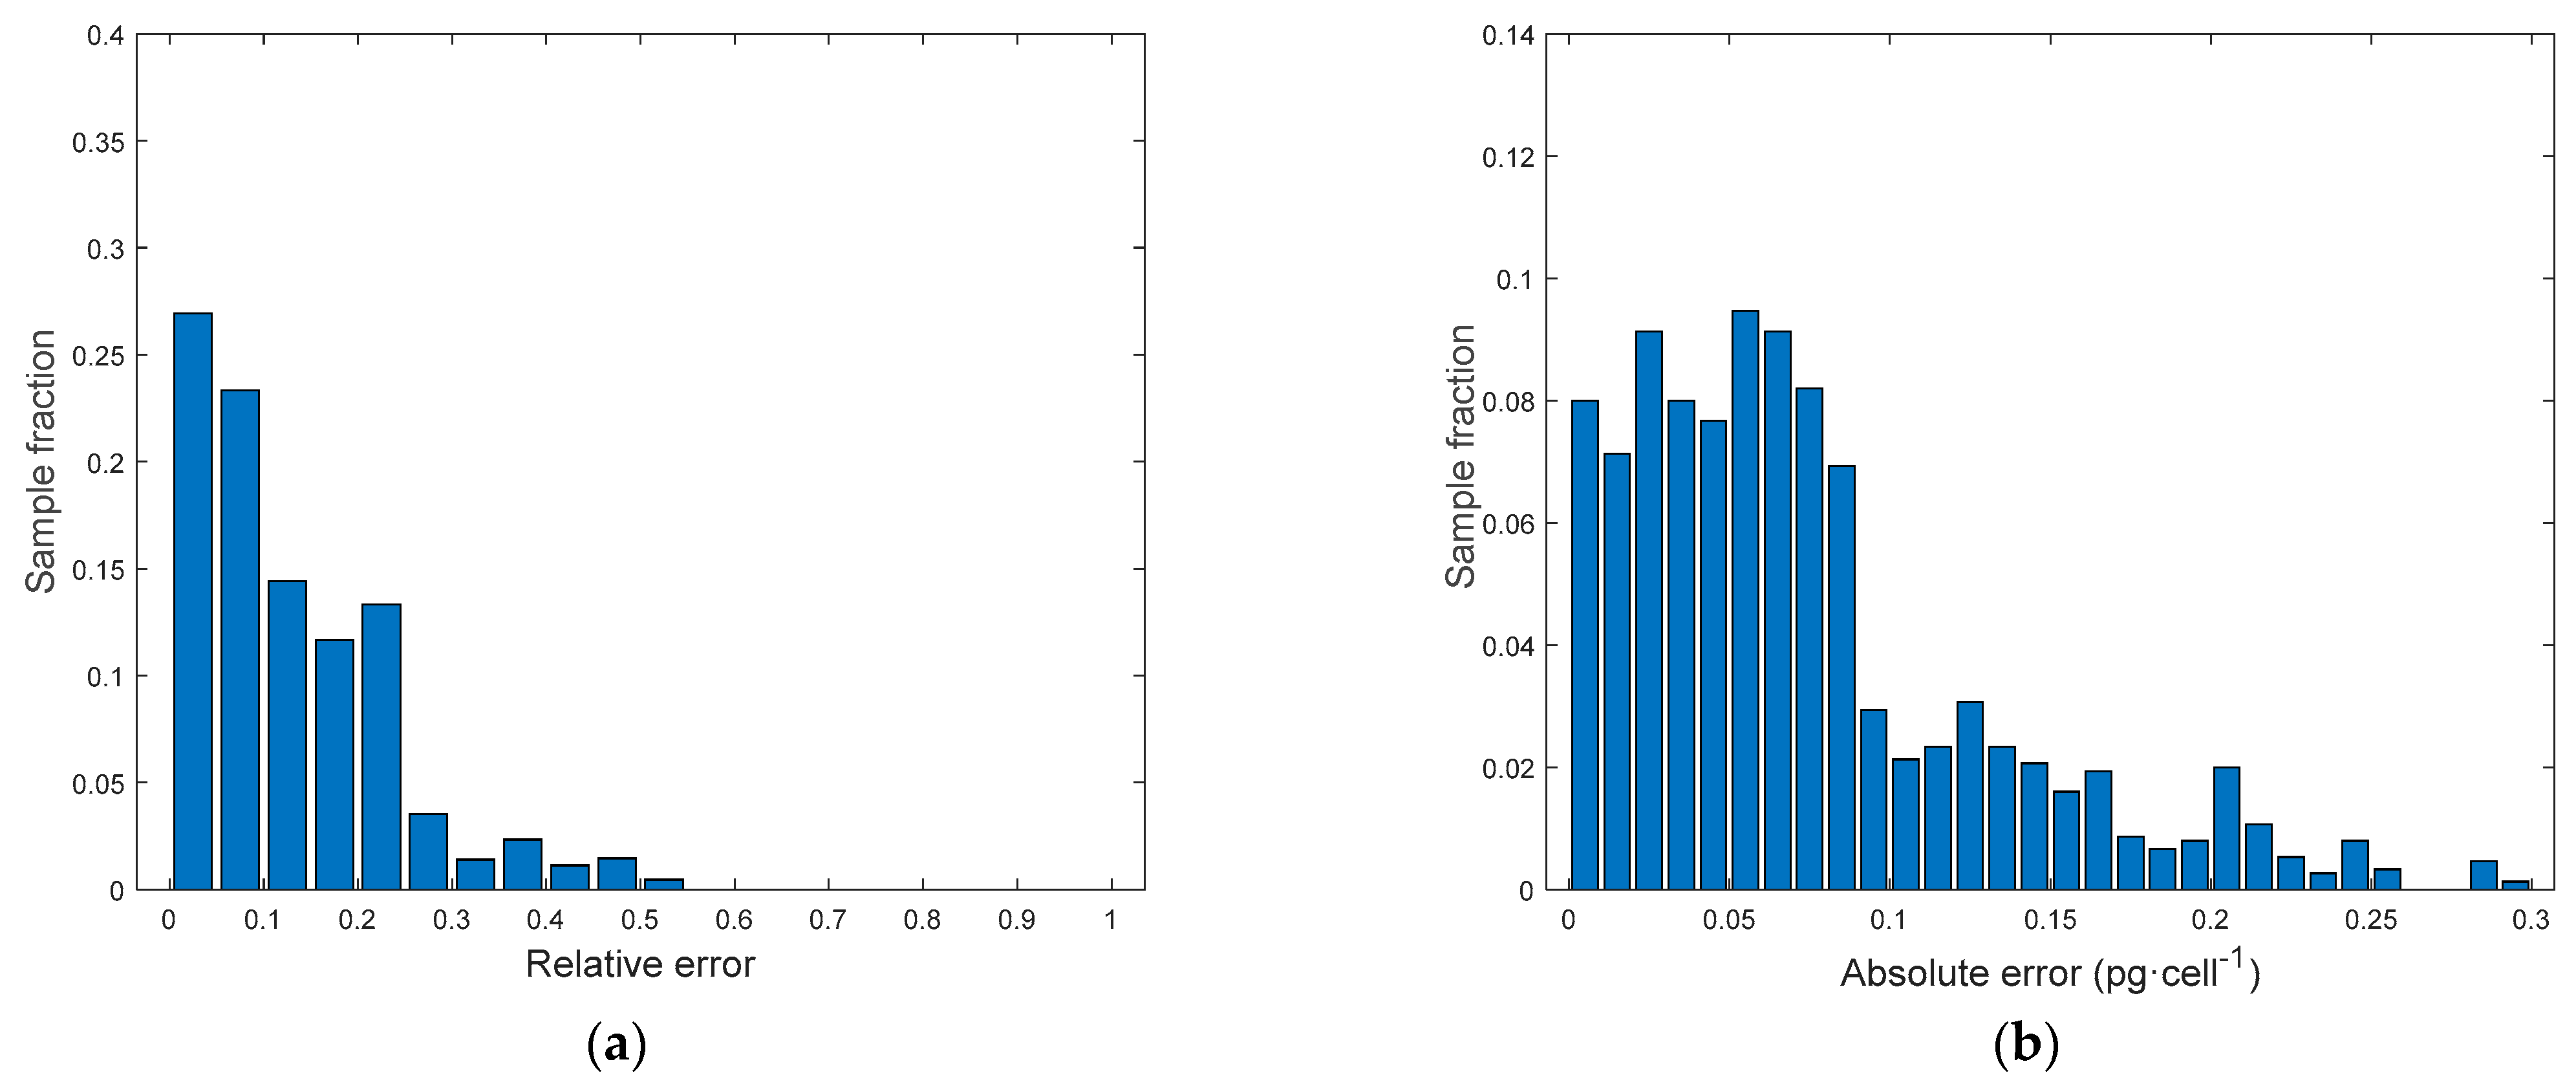
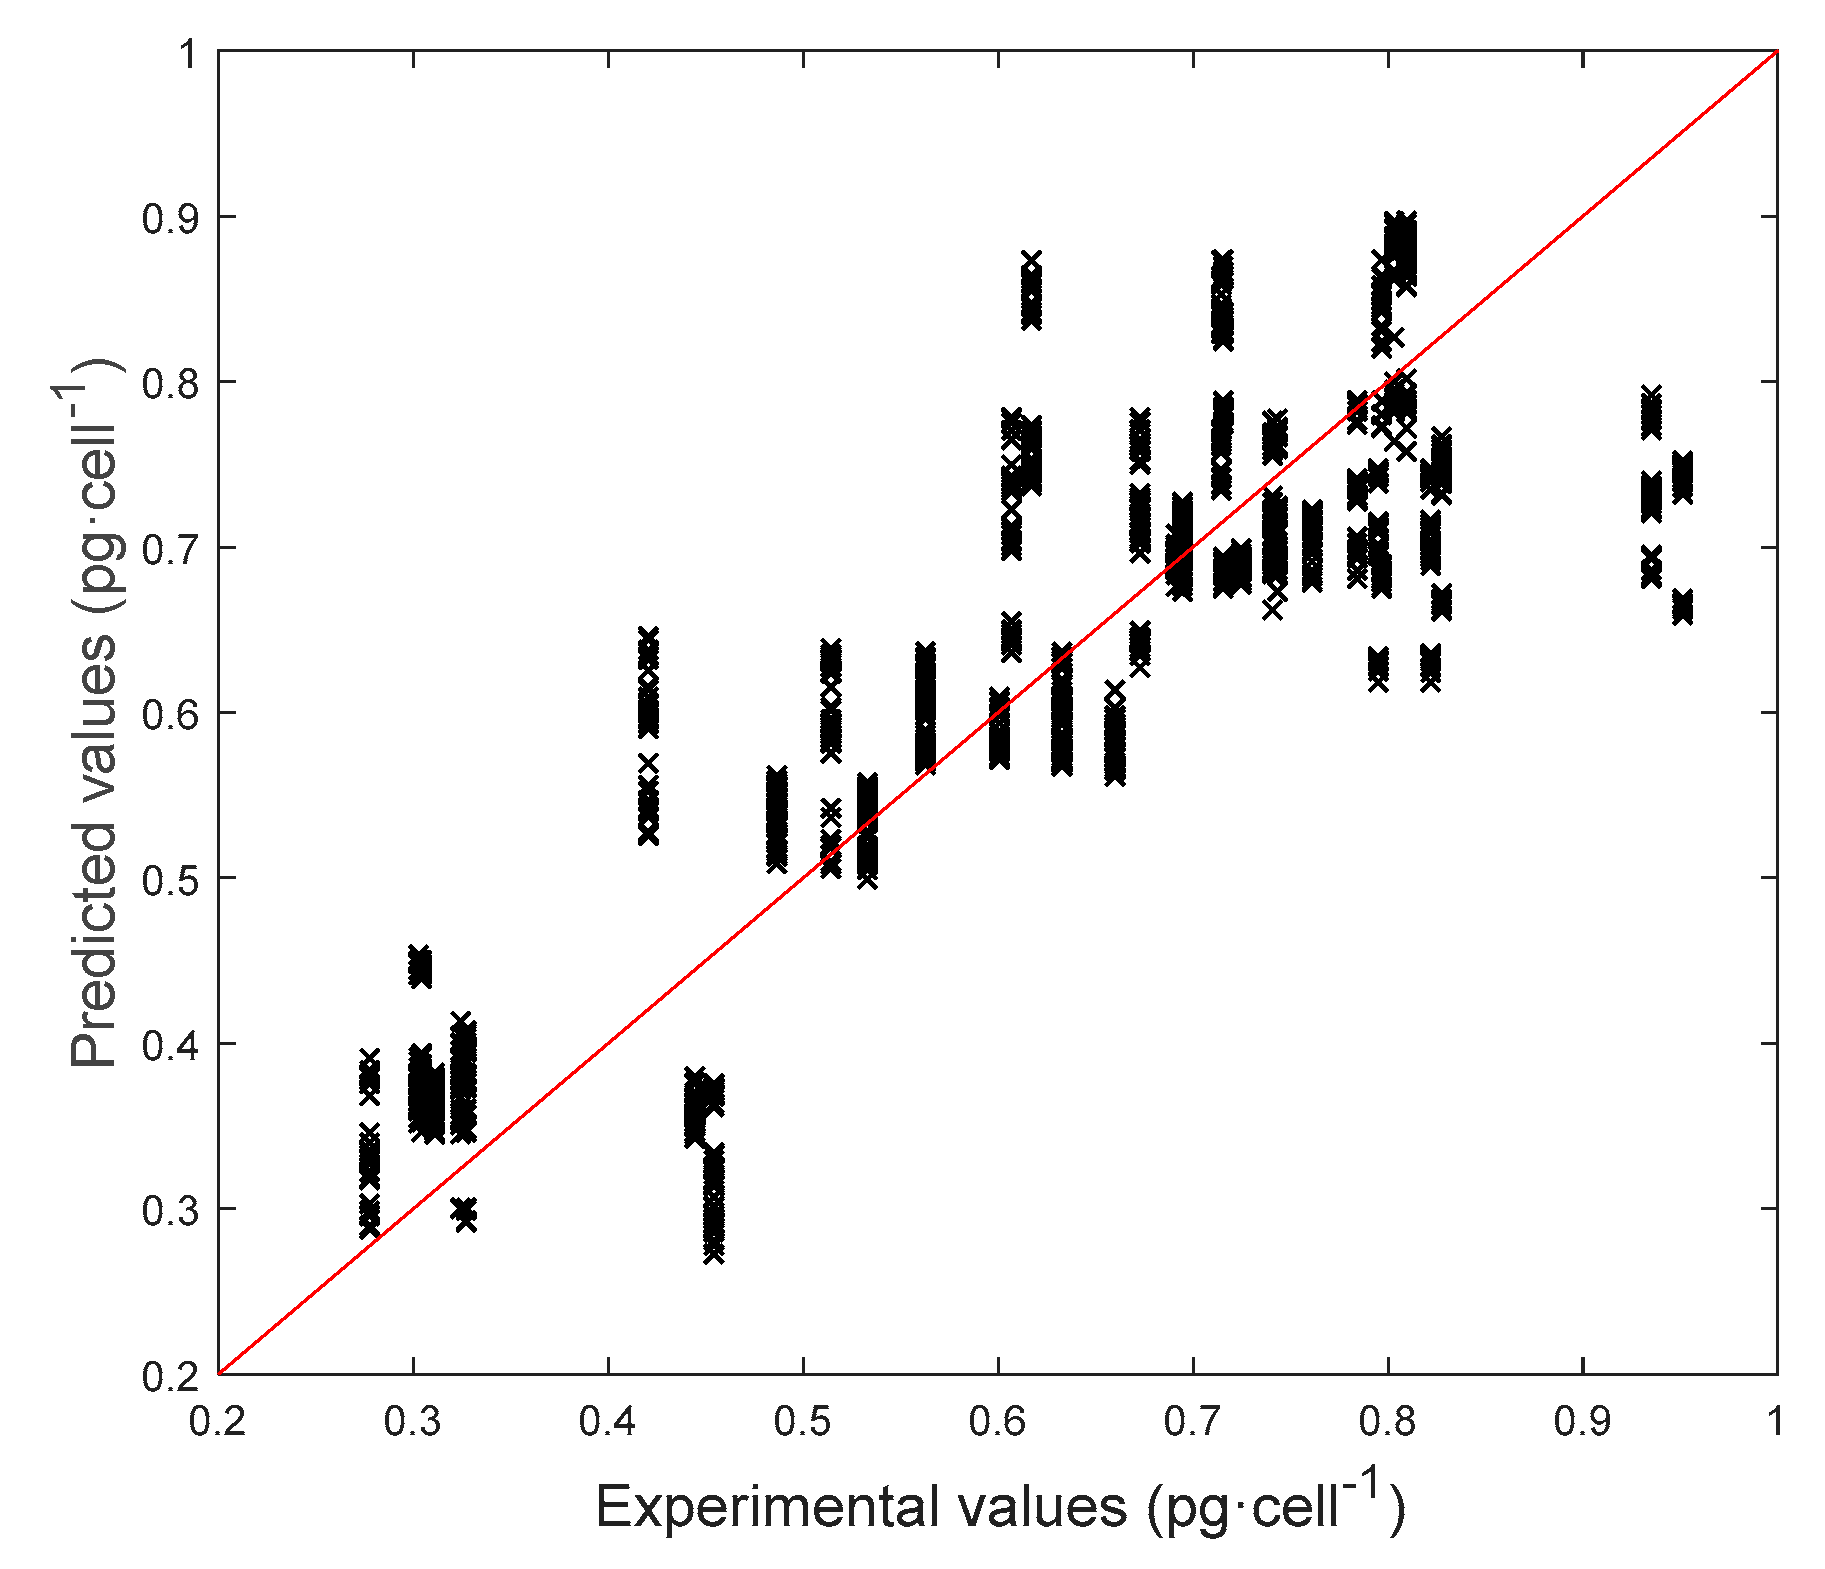
3.3. Results of the Chl a Estimation
4. Conclusions
Author Contributions
Funding
Data Availability Statement
Conflicts of Interest
List of Symbols
| Abbreviations | |
| Car | Carotenoids |
| Chl a | Chlorophyll a |
| Chl b | Chlorophyll b |
| CI | Color indices |
| D0, …, D5 | Dilutions |
| DMSO | Dimethyl sulfoxide |
| DW | Dry weight |
| EMCCD | Electron-multiplying charged-coupled device |
| FI | Fluorescence indices |
| HL | Experiments at high light |
| HSL | Hue saturation lightness color space |
| LHV | Lower heating value |
| LL | Experiments at low light |
| LV | Latent variables |
| ML | Experiments at medium light |
| NPQ | Non-photochemical quenching |
| PAM | Pulse amplitude modulation |
| PAR | Photosynthetically active region |
| PBR | Photobioreactor |
| PDMS | poly-di-methyl-siloxane |
| PLS | Partial least squares |
| PSII | Photosystem II |
| ROI | Region of interest |
| SSR | Sum of squared residuals |
| µPBR | Micro-photobioreactor |
| Roman symbols | |
| Latent variable | |
| Biomass concentration | |
| Average absolute error | |
| Average energy of a mole of photons | |
| Average relative error | |
| Minimum fluorescence | |
| Maximum fluorescence | |
| Variable fluorescence | |
| Incident light intensity | |
| Means of red, green and blue channels | |
| Number of observations | |
| Number of variables | |
| Number of responses | |
| Variances of red, green and blue channels | |
| Greek letters | |
| µ | Growth rate |
| Matrices and arrays | |
| Residual matrices | |
| Loadings matrix of | |
| Loadings matrix of | |
| Scores matrix of | |
| Scores matrix of | |
| Weight matrix | |
| Predictor matrix | |
| Color indices predictors | |
| Biomass concentration predictor | |
| Fluorescence indices predictors |
References
- Juang, Y.-J.; Chang, J.-S. Applications of microfluidics in microalgae biotechnology: A review. Biotechnol. J. 2016, 11, 327–335. [Google Scholar] [CrossRef] [PubMed]
- Kim, H.S.; Devarenne, T.P.; Han, A. Microfluidic systems for microalgal biotechnology: A review. Algal Res. 2018, 30, 149–161. [Google Scholar] [CrossRef]
- Pierobon, S.C.; Cheng, X.; Graham, P.J.; Nguyen, B.; Karakolis, E.G.; Sinton, D. Emerging microalgae technology: A review. Sustain. Energy Fuels 2018, 2, 13–38. [Google Scholar] [CrossRef]
- Zheng, G.; Wang, Y.; Wang, Z.; Zhong, W.; Wang, H.; Li, Y. An integrated microfluidic device in marine microalgae culture for toxicity screening application. Mar. Pollut. Bull. 2013, 72, 231–243. [Google Scholar] [CrossRef]
- Perin, G.; Cimetta, E.; Monetti, F.; Morosinotto, T.; Bezzo, F. Novel micro-photobioreactor design and monitoring method for assessing microalgae response to light intensity. Algal Res. 2016, 19, 69–76. [Google Scholar] [CrossRef]
- Castaldello, C.; Sforza, E.; Cimetta, E.; Morosinotto, T.; Bezzo, F. Microfluidic Platform for Microalgae Cultivation under Non-limiting CO2 Conditions. Ind. Eng. Chem. Res. 2019, 58, 18036–18045. [Google Scholar] [CrossRef]
- Luke, C.S.; Selimkhanov, J.; Baumgart, L.; Cohen, S.E.; Golden, S.S.; Cookson, N.A.; Hasty, J. A Microfluidic Platform for Long-Term Monitoring of Algae in a Dynamic Environment. ACS Synth. Biol. 2016, 5, 8–14. [Google Scholar] [CrossRef]
- Westerwalbesloh, C.; Brehl, C.; Weber, S.; Probst, C.; Widzgowski, J.; Grünberger, A.; Pfaff, C.; Nedbal, L.; Kohlheyer, D. A microfluidic photobioreactor for simultaneous observation and cultivation of single microalgal cells or cell aggregates. PLoS ONE 2019, 14, e0216093. [Google Scholar] [CrossRef] [Green Version]
- Liu, J.Y.; Zeng, L.H.; Ren, Z.H. The application of spectroscopy technology in the monitoring of microalgae cells concentration. Appl. Spectrosc. Rev. 2020, 56, 171–192. [Google Scholar] [CrossRef]
- Córdoba-Matson, M.V.; Gutiérrez, J.; Porta-Gándara, M.Á. Evaluation of Isochrysis galbana (clone T-ISO) cell numbers by digital image analysis of color intensity. J. Appl. Phycol. 2010, 22, 427–434. [Google Scholar] [CrossRef]
- Sarrafzadeh, M.H.; La, H.J.; Lee, J.Y.; Cho, D.H.; Shin, S.Y.; Kim, W.J.; Oh, H.M. Microalgae biomass quantification by digital image processing and RGB color analysis. J. Appl. Phycol. 2015, 27, 205–209. [Google Scholar] [CrossRef]
- Jung, S.K.; Lee, S.B. In situ monitoring of cell concentration in a photobioreactor using image analysis: Comparison of uniform light distribution model and artificial neural networks. Biotechnol. Prog. 2006, 22, 1443–1450. [Google Scholar] [CrossRef] [PubMed]
- Murphy, T.E.; Macon, K.; Berberoglu, H. Multispectral image analysis for algal biomass quantification. Biotechnol. Prog. 2013, 29, 808–816. [Google Scholar] [CrossRef] [PubMed]
- Su, C.H.; Fu, C.C.; Chang, Y.C.; Nair, G.R.; Ye, J.L.; Chu, I.M.; Wu, W.T. Simultaneous estimation of chlorophyll a and lipid contents in microalgae by three-color analysis. Biotechnol. Bioeng. 2008, 99, 1034–1039. [Google Scholar] [CrossRef] [PubMed]
- Prats-Montalbán, J.M.; de Juan, A.; Ferrer, A. Multivariate image analysis: A review with applications. Chemom. Intell. Lab. Syst. 2011, 107, 1–23. [Google Scholar] [CrossRef]
- Gris, B.; Morosinotto, T.; Giacometti, G.M.; Bertucco, A.; Sforza, E. Cultivation of Scenedesmus obliquus in Photobioreactors: Effects of Light Intensities and Light–Dark Cycles on Growth, Productivity, and Biochemical Composition. Appl. Biochem. Biotechnol. 2014, 172, 2377–2389. [Google Scholar] [CrossRef]
- Wellburn, A.R. The Spectral Determination of Chlorophylls a and b, as well as Total Carotenoids, Using Various Solvents with Spectrophotometers of Different Resolution. J. Plant Physiol. 1994, 144, 307–313. [Google Scholar] [CrossRef]
- Watanabe, Y.; Hall, D.O. Photosynthetic CO2 conversion technologies using a photobioreactor incorporating microalgae—Energy and material balances. Energy Convers. Manag. 1996, 37, 1321–1326. [Google Scholar] [CrossRef]
- Sforza, E.; Urbani, S.; Bertucco, A. Evaluation of maintenance energy requirements in the cultivation of Scenedesmus obliquus: Effect of light intensity and regime. J. Appl. Phycol. 2015, 27, 1453–1462. [Google Scholar] [CrossRef]
- Norton, M.; Gracia Amillo, A.M.; Galleano, R. Comparison of solar spectral irradiance measurements using the average photon energy parameter. Sol. Energy 2015, 120, 337–344. [Google Scholar] [CrossRef]
- Velve-Casquillas, G.; Le Berre, M.; Piel, M.; Tran, P.T. Microfluidic tools for cell biological research. Nano Today 2010, 5, 28–47. [Google Scholar] [CrossRef] [Green Version]
- Maxwell, K.; Johnson, G.N. Chlorophyll fluorescence—A practical guide. J. Exp. Bot. 2000, 51, 659–668. [Google Scholar] [CrossRef]
- Murchie, E.H.; Lawson, T. Chlorophyll fluorescence analysis: A guide to good practice and understanding some new applications. J. Exp. Bot. 2013, 64, 3983–3998. [Google Scholar] [CrossRef] [PubMed] [Green Version]
- FluorCam Instruction Manual, version 2.0; Photon Systems Instruments: Drasov, Czech Republic, 2012.
- Geladi, P.; Kowalski, B.R. Partial least-squares regression: A tutorial. Anal. Chim. Acta 1986, 185, 1–17. [Google Scholar] [CrossRef]
- Wise, B.M.; Gallagher, N.B. The process chemometrics approach to process monitoring and fault detection. J. Process Control 1996, 6, 329–348. [Google Scholar] [CrossRef]
- Kourti, T. Application of latent variable methods to process control and multivariate statistical process control in industry. Int. J. Adapt. Control Signal Process. 2005, 19, 213–246. [Google Scholar] [CrossRef]
- Ottavian, M.; Fasolato, L.; Serva, L.; Facco, P.; Barolo, M. Data Fusion for Food Authentication: Fresh/Frozen–Thawed Discrimination in West African Goatfish (Pseudupeneus prayensis) Fillets. Food Bioprocess Technol. 2014, 7, 1025–1036. [Google Scholar] [CrossRef]
- Antonelli, A.; Cocchi, M.; Fava, P.; Foca, G.; Franchini, G.C.; Manzini, D.; Ulrici, A. Automated evaluation of food colour by means of multivariate image analysis coupled to a wavelet-based classification algorithm. Anal. Chim. Acta 2004, 515, 3–13. [Google Scholar] [CrossRef]
- Facco, P.; Masiero, A.; Beghi, A. Advances on multivariate image analysis for product quality monitoring. J. Process Control 2013, 23, 89–98. [Google Scholar] [CrossRef]
- Duchesne, C.; Liu, J.J.; MacGregor, J.F. Multivariate image analysis in the process industries: A review. Chemom. Intell. Lab. Syst. 2012, 117, 116–128. [Google Scholar] [CrossRef]
- Kourti, T. Multivariate dynamic data modeling for analysis and statistical process control of batch processes, start-ups and grade transitions. J. Chemom. 2003, 17, 93–109. [Google Scholar] [CrossRef]
- Meneghesso, A.; Simionato, D.; Gerotto, C.; La Rocca, N.; Finazzi, G.; Morosinotto, T. Photoacclimation of photosynthesis in the Eustigmatophycean Nannochloropsis gaditana. Photosynth. Res. 2016, 129, 291–305. [Google Scholar] [CrossRef] [PubMed]
- Masojídek, J.; Vonshak, A.; Torzillo, G. Chlorophyll a Fluorescence in Aquatic Sciences: Methods and Applications; Suggett, D.J., Prášil, O., Borowitzka, M.A., Eds.; Springer: Dordrecht, The Netherlands, 2010; ISBN 978-90-481-9267-0. [Google Scholar]
- Camacho-Fernández, C.; Hervás, D.; Rivas-Sendra, A.; Marín, M.P.; Seguí-Simarro, J.M. Comparison of six different methods to calculate cell densities. Plant Methods 2018, 14, 30. [Google Scholar] [CrossRef] [PubMed] [Green Version]


| µ | DW | % PAR | |
|---|---|---|---|
| (d−1) | (g·L−1) | (%) | |
| LLA | 0.47 ± 0.04 | 0.72 | 6.18 |
| LLB | 0.46 ± 0.04 | 0.69 | 5.91 |
| MLA | 1.17 ± 0.15 | 2.54 | 5.69 |
| MLB | 1.16 ± 0.18 | 2.50 | 5.60 |
| HLA | 1.22 ± 0.23 | 4.38 | 1.55 |
| HLB | 1.20 ± 0.19 | 4.24 | 1.50 |
| Model ID | X Dim | LV | ||
|---|---|---|---|---|
| C[Cx] | 144 × 6 | 6 | 30.10 | 11.52 |
| C[Cx] | 144 × 13 | 8 | 20.57 | 8.54 |
| C[ln(Cx)] | 144 × 6 | 6 | 22.73 | 11.21 |
| C[ln(Cx)] | 144 × 7 | 6 | 35.10 | 16.78 |
| C[ln(Cx)] | 144 × 13 | 8 | 18.74 | 9.51 |
| Model ID | X Dim | LV | ||
|---|---|---|---|---|
| D[ln(Cx)] | 144 × 52 | 14 | 7.57 | 4.27 |
| Model ID | X dim | LV | ||
|---|---|---|---|---|
| P[Chla] | 144 × 6 | 6 | 19.13 | 0.10 |
| P[Chla] | 144 × 7 | 6 | 12.93 | 0.07 |
| |Chla] | 144 × 14 | 6 | 11.95 | 0.06 |
Publisher’s Note: MDPI stays neutral with regard to jurisdictional claims in published maps and institutional affiliations. |
© 2021 by the authors. Licensee MDPI, Basel, Switzerland. This article is an open access article distributed under the terms and conditions of the Creative Commons Attribution (CC BY) license (https://creativecommons.org/licenses/by/4.0/).
Share and Cite
Castaldello, C.; Gubert, A.; Sforza, E.; Facco, P.; Bezzo, F. Microalgae Monitoring in Microscale Photobioreactors via Multivariate Image Analysis. ChemEngineering 2021, 5, 49. https://doi.org/10.3390/chemengineering5030049
Castaldello C, Gubert A, Sforza E, Facco P, Bezzo F. Microalgae Monitoring in Microscale Photobioreactors via Multivariate Image Analysis. ChemEngineering. 2021; 5(3):49. https://doi.org/10.3390/chemengineering5030049
Chicago/Turabian StyleCastaldello, Christopher, Alessio Gubert, Eleonora Sforza, Pierantonio Facco, and Fabrizio Bezzo. 2021. "Microalgae Monitoring in Microscale Photobioreactors via Multivariate Image Analysis" ChemEngineering 5, no. 3: 49. https://doi.org/10.3390/chemengineering5030049
APA StyleCastaldello, C., Gubert, A., Sforza, E., Facco, P., & Bezzo, F. (2021). Microalgae Monitoring in Microscale Photobioreactors via Multivariate Image Analysis. ChemEngineering, 5(3), 49. https://doi.org/10.3390/chemengineering5030049