Communication

Development of a Passive Spore Sampler for Capture Enhancement of Airborne Crop Pathogens

1
Department of Mechanical, Aerospace and Civil Engineering, The University of Manchester, Manchester M1 3BB, UK
2
Aerospace Engineering Department, Faculty of Engineering, Cairo University, Giza 12613, Egypt
3
Department of Electrical and Electronic Engineering, The University of Manchester, Manchester M1 3BB, UK
*
Author to whom correspondence should be addressed.
Fluids 2020, 5(2), 97; https://doi.org/10.3390/fluids5020097
Submission received: 15 May 2020 / Revised: 12 June 2020 / Accepted: 15 June 2020 / Published: 18 June 2020
(This article belongs to the Special Issue Recent Numerical Advances in Fluid Mechanics, Volume II)

Abstract

:
Yellow rust spores currently blight commercial and domestic wheat production in areas of East Africa such as Ethiopia. Yellow rust is a hazard to crops which appears asymptomatic for a time, but inevitably causes significant losses in yield once symptoms of infection manifest themselves to the point where they can be readily observed by the naked eye. Regionally recurrent losses of up to 5% are common and reach as high as 25% in rare cases. Historically, spore sampling has been undertaken by large, cumbersome devices that require heavy power supplies and significant expertise to reliably operate. Moreover, tools for the design and development of such devices are currently limited. This paper, therefore, proposes design and testing processes to develop a spore sampling device that is compact, passive (requires no power to operate), and can better direct spores onto a biomimetic sensor platform enhancing the capture and detection of pathogens. This represents a novel design context for fluidic devices. Performance of the device has been simulated using Lagrangian particle tracking embedded into computational fluid dynamics (CFD) simulations, demonstrating significant improvements across a range of spore Stokes numbers. Experimental validation of numerical simulations was performed using wind tunnel testing and practical performance such as weathervaning was demonstrated. Results show that that the developed sampler is capable of enhancing the probability of yellow rust spores interacting with an internal sensor by a factor of between 20 and 25; demonstrating the effectiveness of the developed design.

Graphical Abstract

1. Introduction

Wheat yellow rust (Puccinia striiformis f. sp. tritici), also known as wheat stripe rust, is a fungal micro-organism which blights wheat crops worldwide. It is so named due to the yellow striations it forms along venations on leaf blades, which resemble the surface texture and discolouration attributed to oxidation in ferrous metals. Though the spores primarily target leaf blades, leaf sheathes and spikes can also be affected in conditions of high humidity and rainfall, or during epidemics. The onset of disease typically occurs early in the growth season, when the ambient temperature falls within a range of 2 to 15 °C, but can occur up to a maximum of 23 °C [1]. Symptoms include stunted development and weakening of affected crops, reduced numbers of spikes, shriveled grains occurring in fewer numbers per spike than on healthy plants, and losses in grain mass [1]. Temperatures during the time of winter wheat emergence and the coldest period of the year are crucial for the development of epidemics. As such, in countries where wheat is grown during the winter or at high elevations, yellow rust is a common threat.
We consider Ethiopia as an example to highlight how yellow rust affects harvested wheat crops. Ethiopia’s climate is amenable to wheat cultivation all year round, and 81% of its exports are accounted for by agricultural products, which constitute 34.8% of its gross domestic product [2]. In addition, close to 72.7% of its labor force work in the agricultural sector. More specifically, its annual wheat production accounts for the dominant share (41.6%) of that of all Sub-Saharan African (SSA) countries. Yellow rust routinely destroys, or otherwise renders unusable, between 5% and 25% (in rare instances) of wheat crop harvested [3]. Thus, there exists significant scope for developing a low-cost, low-power, user-friendly technological means for early-warning spore detection in the region. Many of the symptoms described earlier are not apparent to the naked eye until after the infection has progressed to a point where intervention is ineffective, leading to inevitable crop degradation or losses. Furthermore, whatever remedial action is taken has deleterious ecological effects and is costly.
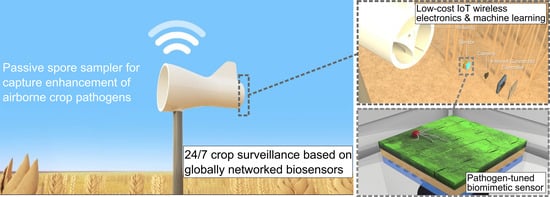
This project, named Sentinel, aims to provide a cheap, reliable, and globally networked “24/7” in-field bio-alarm system to detect, within a matter of hours, fungal and, potentially, bacterial pathogenic attacks on crops. This system would effectively act as a proxy extension worker with an analytical lab, positioned day and night in all susceptible fields. The data then form a reliable dynamic feed into existing mechanistic spore transport models providing a ground-truth and dramatically increasing the temporal and spatial surveillance accuracy for disease outbreak management. The Sentinel sensor-nodes will be located in the “hot spots” as identified by those models [4]. Parallel ongoing research by the authors has demonstrated that a disposable 1 cm2 biomaterial structure and volatile release mechanism can be produced for volume manufacture, with extended-life (i.e., a full growing season), within a biosensor film cartridge. The roadmap being to deliver, within each sub-US10¢ film cartridge, an array of independently addressable “biomimic” detection elements that are “tuned” to specifically trigger the germination, directional growth, and hyphae penetration mechanism of specific fungal species and families. In this way one small coin-sized cartridge can simultaneously detect multiple spore germination events, minimizing false positives, and enabling the Sentinels to identify numerous fungal and bacterial diseases. The resulting wireless Sentinel networks, and data services, can then be developed for delivery as a sustainable SSA business model initially exemplified in Ethiopia against Puccinia striiformis f. sp. tritici (Pst) followed by P. graminis f. sp. tritici (Pgt), i.e., wheat yellow and stem rusts, respectively.
Due to the limited number of tolerant cultivars to Pst and Pgt, the use of triazole fungicides remains the most widely used solution in SSA, following crop infection, with some alternates, such as succinate dehydrogenase inhibitor (SDHI) and strobilurin fungicide, which have varying degrees of cost and effectiveness which reduce their suitability for use in lower-to-middle income countries (LMIC). Of particular concern is the prospect of rust tolerance developing to single and mixed combinations of triazoles, and other fungicides, through genetic mutation of the pathogens, which is exacerbated by their over usage [5]. As the curative and preventative modes of actions of the range of fungicidal treatments are both highly dependent on the accurate spatial and temporal application on affected or susceptible crops, respectively, the Sentinel network, in combination with spore transport forecasting, enables precision optimized application of the crop protection chemistries. For all farming nations, and in particular LMICs, the reduced usage of fungicides enables inventory control to be effectively managed such that adequate chemical and labor resources are available to effect the treatments. The quantitative monetary value and yield security, per growing region, from such a policy may be projected but will be highly dependent on a range of factors such as seasonal variations in climate, giving rise to pathogen growth, as well as the nature of daily spore transport giving rise to acute or chronic disease development. Suffice to say in Ethiopia alone, the partner country for this research, over a quarter of a million smallholder farming families are reliant on their wheat production for subsistence and livelihood security and government-funded text messaging system had to be introduced as an interim measure to attempt to stem the potential for a major disease event [6]. In partnership, this research underpins the future strategy for crop protection and supports the introduction of traceable integrated pest management (IPM) policies to minimize the likelihood of genetic tolerance of the pathogens to the limited suite of regulatory-approved fungicidal actives.
A recent example design for a spore sampler is the so-called “Spornado” device [7]. The sampler aims to detect fungal disease such as late blight, sclerotinia, fusarium head blight, and powdery and downy mildews. The sampler has a funnel like shape with a vane to allow weathervaning. Spores are trapped into specialised filters hosted in the sampler which can then be removed and sent to a lab for targeted DNA testing [7]. This is different from our proposed Sentinels which can provide faster and more representative information on spores, as described above. Another example is the latest model of spore traps manufactured by Burkard Manufacturing Ltd. operating using 25 W vacuum pumps running on either a 240 V alternating current supply or 12 V batteries [8]. This Burkard spore trap is shipped within a case measuring 570 × 650 × 650 mm, where its nominal working area is 0.89 m2 through a 530 mm radius, with an overall height of 940 mm once fully constructed and installed [9]. It is evident that this approach requires large power supplies, maintenance of moving machinery, and training of users to operate reliably. A key objective, therefore, is to eliminate these requirements by designing a system that can operate with little-to-no human intervention beyond simple installation within a crop to be monitored, whilst requiring considerably less input power.
This communication will focus on the design and testing processes involved in the development of a passive particle sampler in order to increase the probability of spores interacting with an artificial biomimetic surface. This passive sampler will act as an air multiplier, increasing the effective number of spores impinging on the measurement area. This constitutes a novel design objective as most of fluidic devices are usually designed to modulate flow behavior such as tailoring adverse pressure gradient along a device [10]. A prototype preliminary design was developed and simulated using computational fluid dynamics (CFD) with additional Lagrangian particle tracking and the performance was validated using wind tunnel testing. Particle interaction probabilities with the biomimetic sensor for different Stokes number values were estimated to evaluate the added value of employing the developed sampler design.
It is anticipated that this developed sensing technology would bring about a sizable positive impact, both to East Africa and beyond. Possible benefits of the successful application of this technology include easing economic and commercial hardship in nations whose markets and development are underpinned by exports of agricultural products, reducing the deleterious ecological impact of spraying fungicide through more effective targeting by limiting use to crops which require such intervention, as well as improving the overall quality and amount of crop harvested, increasing food stocks and availability to populations worldwide. Moreover, such sensing technology could also be generalized to detect many forms of airborne pathogen, even those which are harmful to humans. As a result, one possible future application beyond that which is currently being pursued is monitoring of bacterial, fungal, or viral illnesses in enclosed environments such as hospital wards that spread via airborne transmission.
The rest of the communication is organized as follows: Section 2 explains the methods used; results are then presented and discussed in Section 3; and, finally, some concluding remarks are highlighted in Section 4.

2. Materials and Methods

2.1. Sampler Configuration

A schematic of the complete spore detector system is shown in Figure 1. The main design requirement for the sampler (i.e., housing device including funnel and cylinder) of the spore sensor is to improve the rate of particle capture when compared with the sensor being placed in affected areas alone. Additionally, the biomimetic sensor surface needs to always point into the direction of the incoming wind. This is achieved by adding a guide vane at the rear, such that the sensor freely rotates on a bearing and weathervanes into prevailing winds at all times. The sensory part of the system contains the biomimetic sensor chip to detect pathogens and the camera system. The camera system employed is the Sony Spresense™ (edge computer) coupled to a low power wide area (LPWA) sub-system (Sony ELTRES™). The microcontroller and electronics of the system can be housed within the vane whereas the coin-size sensor chip and camera are mounted at either end of a short cylinder known as the “bullet” section in reference to its resemblance to the drive section of some wind tunnels. The bullet section has a length of 125 mm and a diameter of 15 mm. Note that the sampler involves the “cylinder” and “funnel” geometries. The sampler cylinder wraps the bullet section, hence has the same length of 125 mm and a radius equal to the outlet radius of the funnel. The sampler funnel precedes the cylinder and involves radius variation designed to enhance spore capture as will be described in the following sections. It should be noted that the funnel-like layout together with the weathervaning vane represents an intuitive starting point for configuring a spore sampler device. As such, our presented sampler external configuration shares some similarities with the external configuration of the Spornado sampler [7]; however, the details of our configuration are unique for our design requirements. More importantly, throughout this work, we provide a design framework together with testing and verification tools that form the basis to develop this class of devices.

2.2. Numerical Simulation

Numerical simulations were conducted using the finite elements method-based COMSOL Multiphysics software package through which a combination of computational fluid dynamics and Lagrangian particle tracking techniques has been employed. A cubic domain with a side edge length of 500 mm representing an open field of air around the sampler was simulated. As a baseline reference, we used meteorological data for Ethiopia which experiences average wind speeds up to 5.4 m/s (12 mph) [11]. As such, an inflow velocity of 5 m/s at the cube inlet was set as the inlet boundary condition. On the outlet face of the cubic computational domain, a zero-pressure gradient outlet boundary condition was implemented. The remaining faces enclosing the domain utilised open boundaries, where the exterior walls behave as zero-shear stress boundary layers. The sampler geometry was then inserted in the centre of the cubic domain. The sampler was suspended in mid-air and represented by solid walls. The decision to have the geometry hover was made consciously, as the supporting rod upon which it will rest in reality will not have a major effect on either the internal or external flow of the sampler. Moreover, inclusion of this rod would have large repercussions from the perspective of mesh complexity without any expected effect on the intended fluid simulations.
The sampler funnel geometric shape was developed based on creating the 3D geometry from a 2D work plane. A Bézier curve was used to define the funnel cross-sectional shape in the 2D plane. A cubic Bézier curve is defined based on four control points P 0 , P 1 , P 2 , and P 3 as follows [12]:
B ( t ) = ( 1 t ) 3 P 0 + 3 ( 1 t ) 2 t P 1 + 3 ( 1 t ) t 2 P 2 + t 3 P 3 ,    ( 0 t 1 ) .
The control points are taken as P 0 = ( 0 ,   R o ) ,   P 1 = ( L f 3 ,   R o ) ,   P 2 = ( 2 L f 3 ,   R i ) ,   P 3 = ( L f ,   R i ) in sequence, where L f is the funnel length,   R i is the inlet radius of the funnel, and R o is the outlet radius of the funnel. The 3D geometry is then constructed by using a simple revolve operation along the central axis.
The finite element mesh used is an unstructured tetrahedral mesh for simplicity of set-up. A mesh-independence study was completed for all simulations using three mesh densities labelled “coarse”, “normal”, and “fine”. Figure 2 shows example mesh densities with their corresponding number of elements. These mesh densities are tested to ensure that the obtained solution is independent of the mesh resolution (as demonstrated in Section 3.2). The velocity field is solved for using a stationary incompressible flow solver. The solver is based on the Reynolds-averaged Navier-Stokes (RANS) equations for conservation of mass and momentum. The flow equations are solved in conjunction with the k-ω turbulence model known to give a good compromise between accuracy and numerical stability [13]. The k-ω turbulence model used is based on the Wilcox revised model with realizability constraints whose equations could be found in [14]. As for the wall treatment, the model applies an automatic wall treatment, meaning that it switches between low-Reynolds-number treatment and wall function based on how the flow near to the wall is well resolved. This allows a good compromise of the benefits of the two treatments including accuracy of the low-Reynolds-number treatment and robustness of the wall function.
With regards to particle treatment (representing spores) in the flow domain, a number of approaches can be taken. These options include making particles attach themselves to solid surfaces upon collision, disappear upon touching them, or be reflected off. Here, we employed reflective boundary conditions on the walls. The particles were seeded into a static, averaged velocity field. Seeding was performed using a random dispersion across the inlet face of an average number of particles for the area. Analogous to a light gate, an internal face located at the sampler outlet was implemented using an accumulator boundary condition, which allows particles to pass through it while tallying up their aggregate number over the course of the simulation. In total, 5000 particles were seeded into the flow domain orthogonally through the inlet face. This is a conservative estimate based on the 1012 urediniospores released per hectare on a diurnal basis [15] and the mass flux of inlet air through the 500 × 500 mm2 area of the inlet face. Studies have historically focused more on the brown wheat and wheat stem rust spores, rather than the yellow rust (Pst) spores under investigation here, but prior work suggests that the spores of individual species are similar enough that their atmospheric dispersal characteristics are comparable [16].
Numerical simulations were implemented to quantify the effect of changing the sampler geometry on particle capture performance (including for the case in which no sampler is present). A parameter sweep exercise was conducted permitting a sensitivity analyses on simulation inputs. This allowed us to iterate the sampler geometry in terms of inlet and outlet radii as well as funnel length, all of which were varied independently, until acceptable geometric dimensions were reached that allow convenient enhancement in the capture of particles. Once the sampler geometry was decided, the bullet section was then introduced so that its center-line is coincident to the sampler cylinder center-line. Particle interaction probability was then estimated using another internal accumulator boundary to assess the effect of this bullet section on particle capture performance.

2.3. Experimental Testing

The aim of experimental testing is to validate the findings obtained through simulation and assess the weathervaning performance of the sampler due to the guide vane. A half-scale version of the identified geometry from numerical simulations was prototyped through 3-D printing in polylactide (PLA) thermoplastic using in-house facilities. This smaller scale was deemed appropriate because it minimizes the tunnel blockage ratio whilst ensuring a scaled Reynolds number to the CFD simulation. A second half-scale model, allowing for the placement of a bullet section at the rear of the sampler using an interference fit, was also constructed to evaluate the effects of the bullet section on the flow.
Figure 3 shows the wind-tunnel setup used for experimental measurements. The model was mounted to an overhead bearing plate using a 10 mm threaded rod, allowing free rotation in yaw as would be experienced in field tests. The angular position was measured using an incremental optical encoder (incremental shaft encoder type RI 58 by Hengstler). The encoder was then connected to a National Instruments myRIO data acquisition card running LabVIEW software, recording the angular time-histories of the model with respect to the freestream velocity vector through the test section. The model was placed at the centerline of a 455 × 455 mm2 cross-section low-speed open-circuit wind tunnel that can be driven up to 20 m/s by a centrifugal fan.
A wake traverse was employed 60 mm downstream of the sampler outlet to examine the velocity profile of flow at the rear region. The traversing pressure probe was connected to a pressure transducer (SENSIRION SDP600, measurement range ± 500 Pa) that was also connected to the same wind tunnel static pressure as that measured by the pitot-static probe upstream of the model. The wake traverse data was recorded continuously as the traverse was moved slowly in a manual fashion.

2.4. Spore Capture Assessment

The question of assessing the interaction probability of a given spore captured by the sampler with the inserted bullet section is a key aspect to be addressed. This is somewhat analogous with attempting to quantify the fouling and deposition mechanisms of particulate matter ingested by aero-engines [17], where Stokes number is used to characterise the aerodynamics of particles suspended in the fluid. The tendency of particles to follow a flow’s streamlines is determined by their Stokes number, S t k , which is defined as [17]:
S t k = ρ P d P 2 U 18 μ f L ,
where ρ P is the particle density, d P denotes particle diameter, μ f is the dynamic viscosity of the fluid in which the particles are suspended, U is a characteristic velocity, L is a characteristic length of the overall system, chosen here to be the funnel inlet diameter following [18]. Note that particles with Stokes numbers less than unity tend to follow fluid streamlines, whilst those of Stokes numbers larger than unity have more significant inertial characteristics.
To assess the capture efficiency of the sensor surface of interest within the sampler, a new accumulator boundary is placed at the face of the sensor in order to detect the number of particles which impacted it, so that a capture efficiency (similar to that defined in [17]) could be quantified based on:
η i n t = N i m p a c t N r e l e a s e d ,
where η i n t denotes the capture interaction efficiency, N i m p a c t and N r e l e a s e d denote the number of particles interacting with the face of the surface and the total number released, respectively. As mentioned in Section 2.2, the total number of particles released is set at 5000. As will be shown in Section 3.3, this evaluation permits insights into how well the device performs in capturing particles that actually interact with the biomimetic surface of the sensor.

3. Results and Discussion

3.1. Sampler Geometry

The sampler main function is to act as an air multiplier concentrating the airborne particles through the sampler contraction. To demonstrate this functionality of the sampler, Figure 4a–c show the normalized rates of particle capture compared with a baseline case of particles passing through an equivalent area at the sampler outlet (without the presence of the sampler). For given average wind speeds and particle counts (as defined in Section 2.2), a parameter sweep was conducted for the inlet radius, outlet radius, and funnel length changing one parameter at a time whilst keeping the other two parameters at constant values. Note that these parameter sweeps were conducted with no bullet section included. However, the starting point for this parameter sweep exercise was the known dimensions for the bullet section as these dimensions were imposed by the sensory system requirements. Each parameter was varied over an extended range until no significant enhancement in performance could be obtained.
A parameter sweep was conducted for the inlet radius whilst fixing the outlet radius and overall length to baseline values of 37.5 and 200 mm, respectively. Figure 4a shows the result of this sweep exercise where an inlet radius value of 90 mm provided the best improvement giving a six fold increase in particles captured compared to the case without sampler. It is worth re-iterating that we employed reflective boundary conditions on the walls of the sampler. As such, for sampler geometries with drastic curvature, particles may bounce around and escape the sampler. This explains why as the inlet sampler radius increases, particle capture increases up to a point beyond which increasing the inlet radius does not necessarily increase particle capture.
An outlet radius parameter sweep was conducted whilst fixing the inlet radius to the 90 mm dimension obtained from the previous sweep and the overall length to the baseline value of 200 mm. Figure 4b shows the result for this sweep exercise. There is a slow increase in the particle capture improvement as the outlet radius increased above its base line value (i.e., 37.5 mm) and a small improvement could be achieved going from six fold to seven fold improvement in particle capture for an outlet radius of 50 mm. The funnel length parameter sweep exercise held the inlet and outlet radii values to the 90 and 50 mm values obtained from the previous two sweep exercises. Results of this parameter sweep are shown in Figure 4c. There is very little variation in terms of the particle capture improvement for the different lengths simulated, and the increase in particle capture performance (occurring at a funnel length value of 225 mm) is minimal compared to the previous two sweep exercises.
Following the aforementioned parameter sweep exercises, the final sampler geometry is set to 90 mm for the inlet radius, 50 mm for the outlet radius, and 225 mm for the funnel length. Figure 4d shows the main geometric dimensions of the whole sampler device including the dimensions for the adopted vane whose weathervaning performance will be highlighted in Section 3.4. It is understood that the inlet radius, outlet radius, and funnel length were not determined based on a full optimization exercise where all variables are allowed to vary in a simultaneous fashion. Whilst not ideal, this was considered acceptable within the current context as the conducted sweep exercises showed that an additional significant increase in the number of particles that could be captured is unlikely, hence not justifying the computational cost for a full optimization exercise.

3.2. Comparison between Simulation and Experimental Results

Figure 5a,b show the simulation results for the x-velocity field map for the sampler device without and with the bullet section, respectively. More importantly, Figure 5c,d show the combined results for a mesh-independence study for the simulation and the experimental findings from wake traverse measurements. In this demonstration, the horizontal axis shows the velocity profile ratio (i.e., velocity normalized by the freestream value). The vertical axis represents the normalized position from the sampler centerline, using the outlet radius as reference. The case of an empty outlet with no bullet carrying sensor instrumentation is shown in Figure 5c. Comparison of numerical and experimental wake profiles is shown 60 mm behind the sampler outlet where the traverse experimental measurements were taken. Mesh independence is broadly achieved with the normal mesh, though the fine mesh agrees more closely in the mid region with the values obtained experimentally. For the fine mesh, the overall wake profile from the simulation agrees well with that obtained experimentally showing a deviation of less than 5% throughout, validating the methodology adopted.
Figure 5d shows the effect of the bullet section on the flow at the rear of the sampler. There is a generally acceptable agreement between the velocity profiles obtained from simulation and those obtained from the experiment. All simulation results appear to corroborate the locations of maximized and minimized velocity. There is a very good agreement between results from all meshes at the center-line. The normal and fine meshes both capture the peaks of velocity ratio in the unobstructed regions of flow through the sampler outlet to within 5% difference. The maximum difference between simulation and experiments is 20% but that only happens in the locations close to the sampler wall (i.e., y R 0 ). These discrepancies may be due to the simplified setup within the simulations (e.g., no bullet supports or model supports), experimental set-up imperfections, errors in experimental measurement, or a combination of these. Nevertheless, given that our aim is to conduct a preliminary assessment of the performance of the device, this discrepancy is considered to be of minor concern for practical applications.
To assess the effect of the computational domain size, Figure 5e,f show the numerical simulation results when employing a cube solution domain with edge lengths of 500, 550, and 600 mm. All these simulations were conducted whilst using a fine mesh setup. It could be seen that for both cases, with and without the bullet section, the length of the computational domain edge (and hence domain size) has a minor effect on the obtained results, providing confidence in the simulation results obtained with a domain edge length of 500 mm.

3.3. Spore Capture Performance

Once numerical simulations of the underlying velocity field were completed and validated using experimental testing, Lagrangian particle tracking was then introduced to model the spore trajectories and hence the sensor interaction efficiency. As the velocity field and particle Stokes number are the relevant factors for particle tracking, it was important to ensure the validity of the velocity field in the numerical simulations as demonstrated in the previous section.
Numerical particles Stokes numbers were changed by varying their diameter and simulations were repeated numerous times allowing the evaluation of the interaction efficiency,   η i n t , defined in Section 2.4. This evaluation permits insights into how well the sampler performs in capturing particles that actually interact with the biomimetic surface. Figure 6 shows the interaction efficiency percentage against particle Stokes number for the cases where the sampler is used and where the bullet section is allowed to hover without the sampler. The Stokes number range considered was S t k = [ 0.01 ; 0.05 ; 0.1 ; 0.5 ; 1 ; 5 ; 10 ; 50 ; 100 ] . It is evident from Figure 6 that when no air multiplier (i.e., sampler) is used, the probability of interaction is relatively insensitive to Stokes number (note that the y-axis is plotted using a logarithmic scale). This insensitivity suggests that those particles whose streamlines at the inlet are aligned with the sensor surface will strike it, and that these make up approximately 0.1–0.2% of those initially released. On the other hand, when the sampler is deployed, the odds of interaction significantly improve to between almost 3% to 3.5% before sharply increasing to 7.4% and 14% for Stokes numbers of 50 and 100, respectively. Note that, Pst spores are known to be almost spherical and to possess a Stokes number of approximately 0.15 [19] (green line in Figure 6) suggesting that the interaction probability odds can be improved by a factor between 20 and 25 times, demonstrating the effectiveness of the developed device.
The results in Figure 6 show an increase in sensor interaction efficiency with increasing Stokes number. Particles with higher Stokes number are more inertial in nature and less accurate in following the streamlines of the flow, particularly where these streamlines are highly curved. The gradual curvature of the funnel contraction helps effectively direct particles toward the stagnation region in front of the sensor. In this area the particles with higher Stokes number will not be able to follow the strong velocity gradients in the stagnation region and are more likely to impact onto the surface. Particles with lower Stokes number will be less likely to impact the surface of the sensor as they are less inertial in nature and are capable of accurately following highly curved streamlines and strong velocity gradients. This phenomenon is well known amongst the aerosol flow community and is known as deposition by inertial impaction [20,21].

3.4. Weathervaning Performance

Figure 7 documents the angular time history measured for the sampler to assess its weathervaning performance. The blue lines track the movement of the sampler from initial setting angles relative to the oncoming flow in the range of 130 ° θ 170 ° , with the maximum considered, highlighted in bold and dashed. Red lines indicate the cases where the funnel was initially set in the range of 70 ° θ 110 ° , and green lines document those cases where the initial angle falls between 10 ° θ 50 ° . Note that θ denotes the sampler angular position relative to the free stream velocity. It was found that during the start-up process of the wind tunnel, as the sampler gets subjected to cross-flows between 3.5 and 4 m/s, it will re-orient itself to face the oncoming flow typically within 2 to 3 s in all cases, demonstrating a convenient response time.
Figure 7 also shows that the sampler has a tendency to overshoot the set-point at high setting angles; however, the vane generates sufficient restoring force to return it to the zero angle as desired within 1 to 1.5 s. In summary, the system exhibits a high degree of sensitivity to oncoming flow, due to its low rotational inertia and lightweight characteristics. In fact, definitively identifying a minimum flow speed below which no rotation occurs is challenging, as reorientation begins even while the tunnel is spooling up.

4. Concluding Remarks

This study considered the design and testing processes for a passive spore sampler device to enhance the ability to capture airborne spore pathogens. The aim of the designed sampler device is to direct the spores onto a sensor platform ensuring a sufficient increase in the interaction probability which, in turn, improves the chances of detection for these pathogens by the sensor. Baseline CFD simulations were conducted and validated using wind tunnel tests showing consistent velocity profiles. Lagrangian particle tracking demonstrated that interaction probability, assessed over a range of spore diameters representing different Stokes numbers, increased by a factor of 20 for a Stokes number of 0.01 up to a factor of 70 for a Stokes number of 100. This increase in interaction probability demonstrates an enhanced ability to sample spores passively whilst providing a robust structure within which to mount a sensor device, leading to a reduced complexity and cost of the overall sampling system.

Author Contributions

Conceptualization, M.R.A.N., M.K.Q., and B.D.G.; methodology, J.L.B., J.W., M.R.A.N., and M.K.Q.; software, J.L.B. and J.W.; validation, J.L.B., J.W., M.R.A.N., and M.K.Q.; investigation, J.L.B., J.W., M.R.A.N., M.K.Q., and B.D.G.; writing—original draft preparation, J.L.B. and M.R.A.N.; writing—review and editing, M.R.A.N., M.K.Q., and B.D.G.; visualization, J.L.B., J.W., and M.R.A.N.; supervision, M.R.A.N., M.K.Q., and B.D.G.; project administration, M.R.A.N., M.K.Q., and B.D.G.; funding acquisition, B.D.G. All authors have read and agreed to the published version of the manuscript.

Funding

This research was funded by the Bill & Melinda Gates Foundation, grant number OPP1199463.

Acknowledgments

This study warmly acknowledges the assistance of the Department of MACE’s Experimental Officer, Andrew Kennaugh, along with the helpful contributions of department technicians, Andrew Morris and Michael Wilkins.

Conflicts of Interest

The authors declare no conflict of interest. The funders had no role in the design of the study; in the collection, analyses, or interpretation of data; in the writing of the manuscript, or in the decision to publish the results.

References

  1. Aslanov, R.; El Jarroudi, M.; Gollier, M.; Pallez-Barthel, M.; Beyer, M. Yellow rust does not like cold winters. But how to find out which temperature and time frames could be decisive in vivo? J. Plant Pathol. 2019, 101, 539–546. [Google Scholar] [CrossRef]
  2. Central Intelligence Agency. The World Factbook. Available online: https://www.cia.gov/library/publications/the-world-factbook/geos/et.html (accessed on 8 May 2020).
  3. Wellings, C. Global status of stripe rust: A review of historical and current threats. Euphytica 2011, 179, 129–141. [Google Scholar] [CrossRef]
  4. Meyer, M.; Cox, J.A.; Hitchings, M.D.T.; Burgin, L.; Hort, M.C.; Hodson, D.P.; Gilligan, C.A. Quantifying airborne dispersal routes of pathogens over continents to safeguard global wheat supply. Nat. Plants 2017, 3, 780–786. [Google Scholar] [CrossRef] [PubMed]
  5. Jørgensen, L.N.; Matzen, N.; Hansen, J.G.; Semaskiene, R.; Korbas, M.; Danielewicz, J.; Głazek, M.; Maumene, C.; Rodemann, B.; Weigand, S.; et al. Four azoles’ profile in the control of Septoria, yellow rust and brown rust in wheat across Europe. Crop. Prot. 2018, 105, 16–27. [Google Scholar] [CrossRef]
  6. Allen-Sader, C.; Thurston, W.; Meyer, M.; Nure, E.; Bacha, N.; Alemayehu, Y.; Stutt, R.O.J.H.; Safka, D.; Craig, A.P.; Derso, E.; et al. An early warning system to predict and mitigate wheat rust diseases in Ethiopia. Environ. Res. Lett. 2019, 14, 115004. [Google Scholar] [CrossRef]
  7. Sporando. Early Alert System for Crop Disease. Available online: https://spornadosampler.com/ (accessed on 5 June 2020).
  8. Lacey, M.E.; West, J.S. The Air Spora: A Manual for Catching and Identifying Airborne Biological Particles, Chapter 4: Using a Burkard Trap; Springer Science & Business Media: Berlin/Heidelberg, Germany, 2017. [Google Scholar]
  9. Hirst, J.M. An Automatic Volumetric Spore Trap. Ann. Appl. Boil. 1952, 39, 257–265. [Google Scholar] [CrossRef]
  10. Ward-Smith, A.J. Internal Fluid Flow-The Fluid Dynamics of Flow in Pipes and Ducts; Oxford University Press: Oxford, UK, 1980. [Google Scholar]
  11. Wheadr Speak. Available online: https://weatherspark.com/y/100668/Average-Weather-in-Addis-Ababa-Ethiopia-Year-Round (accessed on 8 May 2020).
  12. Vince, J. Mathematics for Computer Graphics; Springer Science and Business Media LLC: Berlin/Heidelberg, Germany, 2010. [Google Scholar]
  13. Nabawy, M.R.A.; Elnomrossy, M.M.; Abdelrahman, M.M.; Elbayoumi, G.M. Aerodynamic shape optimisation, wind tunnel measurements and CFD analysis of a MAV wing. Aeronaut. J. 2012, 116, 685–708. [Google Scholar] [CrossRef] [Green Version]
  14. Wilcox, D.C. Turbulence Modeling for CFD, 2nd ed.; DCW Industries, Inc.: La Canada, CA, USA, 1998. [Google Scholar]
  15. Rowell, J.B.; Roelfs, A.P. Evidence for an unrecognized source of overwintering wheat stem rust in the United States. Plant Dis. Rep. 1971, 55, 990–992. [Google Scholar]
  16. Meyer, M. Modelling Atmospheric Dispersal of Fungal Pathogens on Continental Scales to Safeguard Global Wheat Production. Ph.D. Thesis, University of Cambridge, Cambridge, UK, 2018. [Google Scholar] [CrossRef]
  17. Bojdo, N.; Ellis, M.; Filippone, A.; Jones, M.; Pawley, A. Particle-Vane Interaction Probability in Gas Turbine Engines. J. Turbomach. 2019, 141, 091010. [Google Scholar] [CrossRef] [Green Version]
  18. Belyaev, S.; Levin, L. Techniques for collection of representative aerosol samples. J. Aerosol Sci. 1974, 5, 325–338. [Google Scholar] [CrossRef]
  19. Kim, S.; Park, H.; Gruszewski, H.A.; Schmale, D.G.; Jung, S. Vortex-induced dispersal of a plant pathogen by raindrop impact. Proc. Natl. Acad. Sci. USA 2019, 116, 4917–4922. [Google Scholar] [CrossRef] [PubMed] [Green Version]
  20. Ranz, W.E.; Wong, J.B. Impaction of Dust and Smoke Particles on Surface and Body Collectors. Ind. Eng. Chem. 1952, 44, 1371–1381. [Google Scholar] [CrossRef]
  21. Rama-Rao, B.V.; Tien, C. Aerosol deposition in two-dimensional laminar stagnation flow. J. Aerosol Sci. 1989, 20, 775–785. [Google Scholar] [CrossRef]
Figure 1. Schematic of the spore sampler configuration adopted in this study. A cross-section of the sampler is shown in the side view for better clarity of components.
Fluids 05 00097 g001
Figure 2. Visualization of the mesh densities employed in the current study: coarse, normal, and fine. The meshes shown are for the simulations of the sampler without the bullet section. The number of elements is 231514, 321569, and 454247 for the coarse, normal, and fine meshes, respectively.
Fluids 05 00097 g002
Figure 3. Wind tunnel set-up used for experimental testing; (a) real set-up, and (b) schematic of the set-up.
Fluids 05 00097 g003
Figure 4. Normalized particle capture rates with varying (a) inlet radius, (b) outlet radius, and (c) funnel length. (d) Geometric dimensions of the sampler and vane in mm.
Fluids 05 00097 g004
Figure 5. (a,b) Simulation results of the x-velocity field (velocity component in centre-line direction) together with streamlines demonstration for the sampler device without and with the bullet section, respectively. (c,d) Normalised velocity profiles at a station located 60 mm behind the sampler outlet obtained from simulation (demonstrating mesh independence) and from pressure transducer experimental measurements for the cases without and with the bullet section, respectively. (e,f) Demonstration for the effect of the computational domain size on the obtained numerical simulation results for the cases without and with the bullet section, respectively.
Fluids 05 00097 g005
Figure 6. Percentage of interaction efficiency plotted against the Stokes number of particles in both cases where a sampler was and was not present.
Fluids 05 00097 g006
Figure 7. Measured angular position of the sampler relative to the freestream velocity vector against time. The inset shows the sampler during testing in the wind tunnel.
Fluids 05 00097 g007