All of the experiments used in this study were conducted at the same freestream Mach number of 0.1, which corresponded to Rec = 0.94 × 10⁶. In addition, all the experiments were performed in the same wind tunnel with the same hump model where the actuator streamwise location is fixed. As a result, this study enables the assessment of the AFC actuator performance by removing any uncertainty in the experimental configuration. This section is divided into three subsections to present the flow control results over the NASA hump model. The first subsection describes the baseline, uncontrolled flow over the hump model. Since the centerline pressure distribution is critical in assessing the experimental data, the two-dimensionality of the flow was confirmed by the leading and trailing edge spanwise pressure distributions as well as oilflow visualizations. The second subsection investigates the flow separation control with fluidic oscillators together with the effect of momentum coefficient. Finally, the third subsection compares the fluidic oscillators and their performance to the existing AFC methods using the quality metrics.
3.3. Performance Assessment of Fluidic Oscillators
In order to assess the performance of the fluidic oscillators, first, the effect of existing AFC methods are compared in controlling the separated flow over the hump model at two momentum coefficients. Note that the streamwise location of the AFC actuator was fixed at
x/
c = 0.65 for all AFC cases. As stated by Greenblatt et al. [
14], these flow control amplitudes were chosen to exert substantial control over the separation region without entirely eliminating the bubble for a successful evaluation of AFC methods. In the first test case, the momentum coefficient was set to
Cµ = 0.11%. In the momentum coefficient calculations (Equation (5)),
Aj is the number of actuators times the actuator throat area (17 × 1 × 2 = 34 mm
2), and the jet velocity at the throat,
Uj, is estimated from the flow rate and the total jet area (
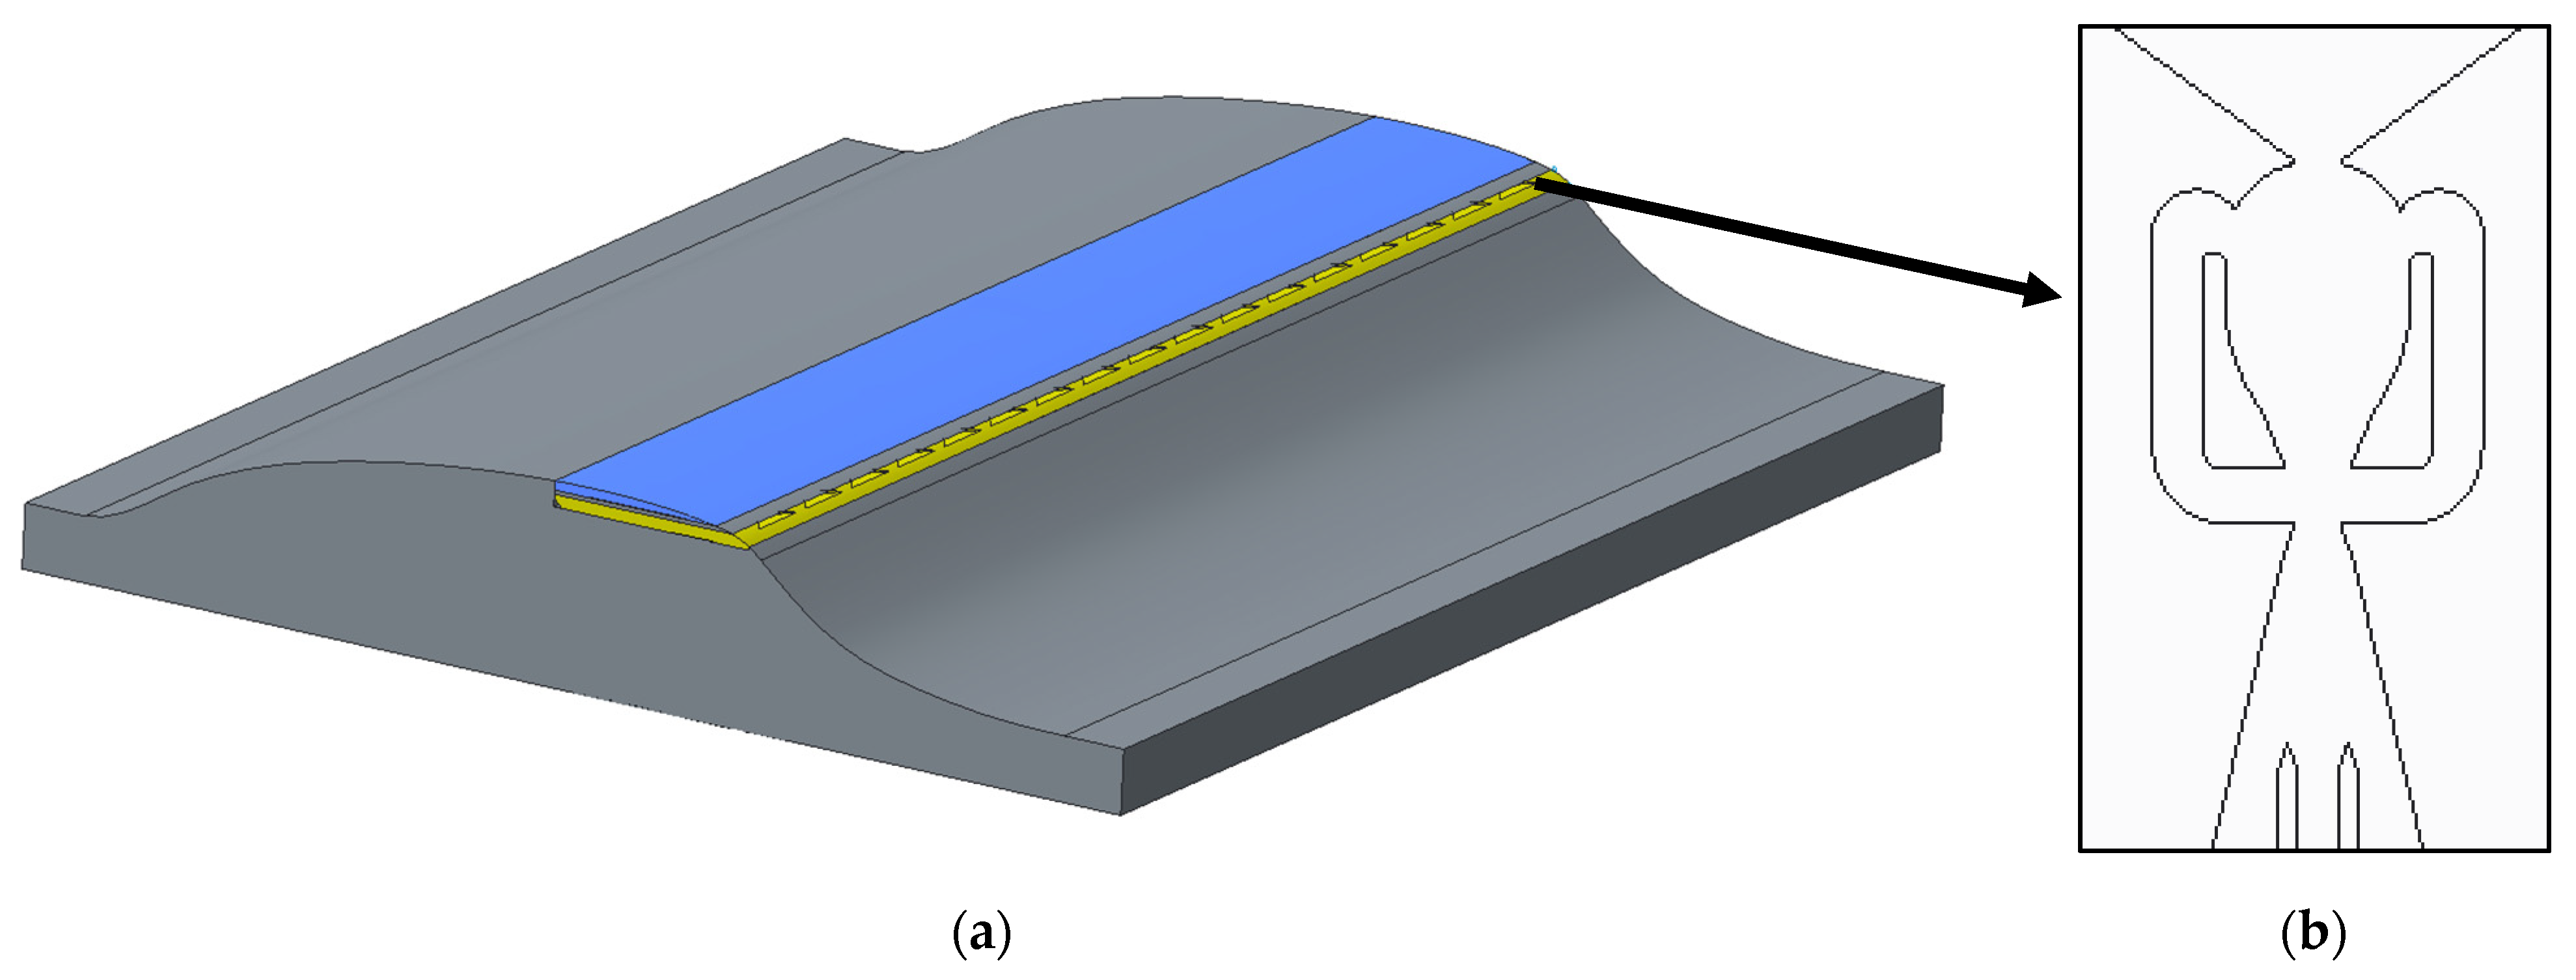
) as 69 m/s. Note that the actuator throat was slightly upstream of the actuator exit as shown in
Figure 1b. For this particular momentum coefficient (
Cµ = 0.11%), the flow rate to the fluidic oscillator array was measured as
Q = 2.4 L/s, which resulted in a mass flow coefficient (
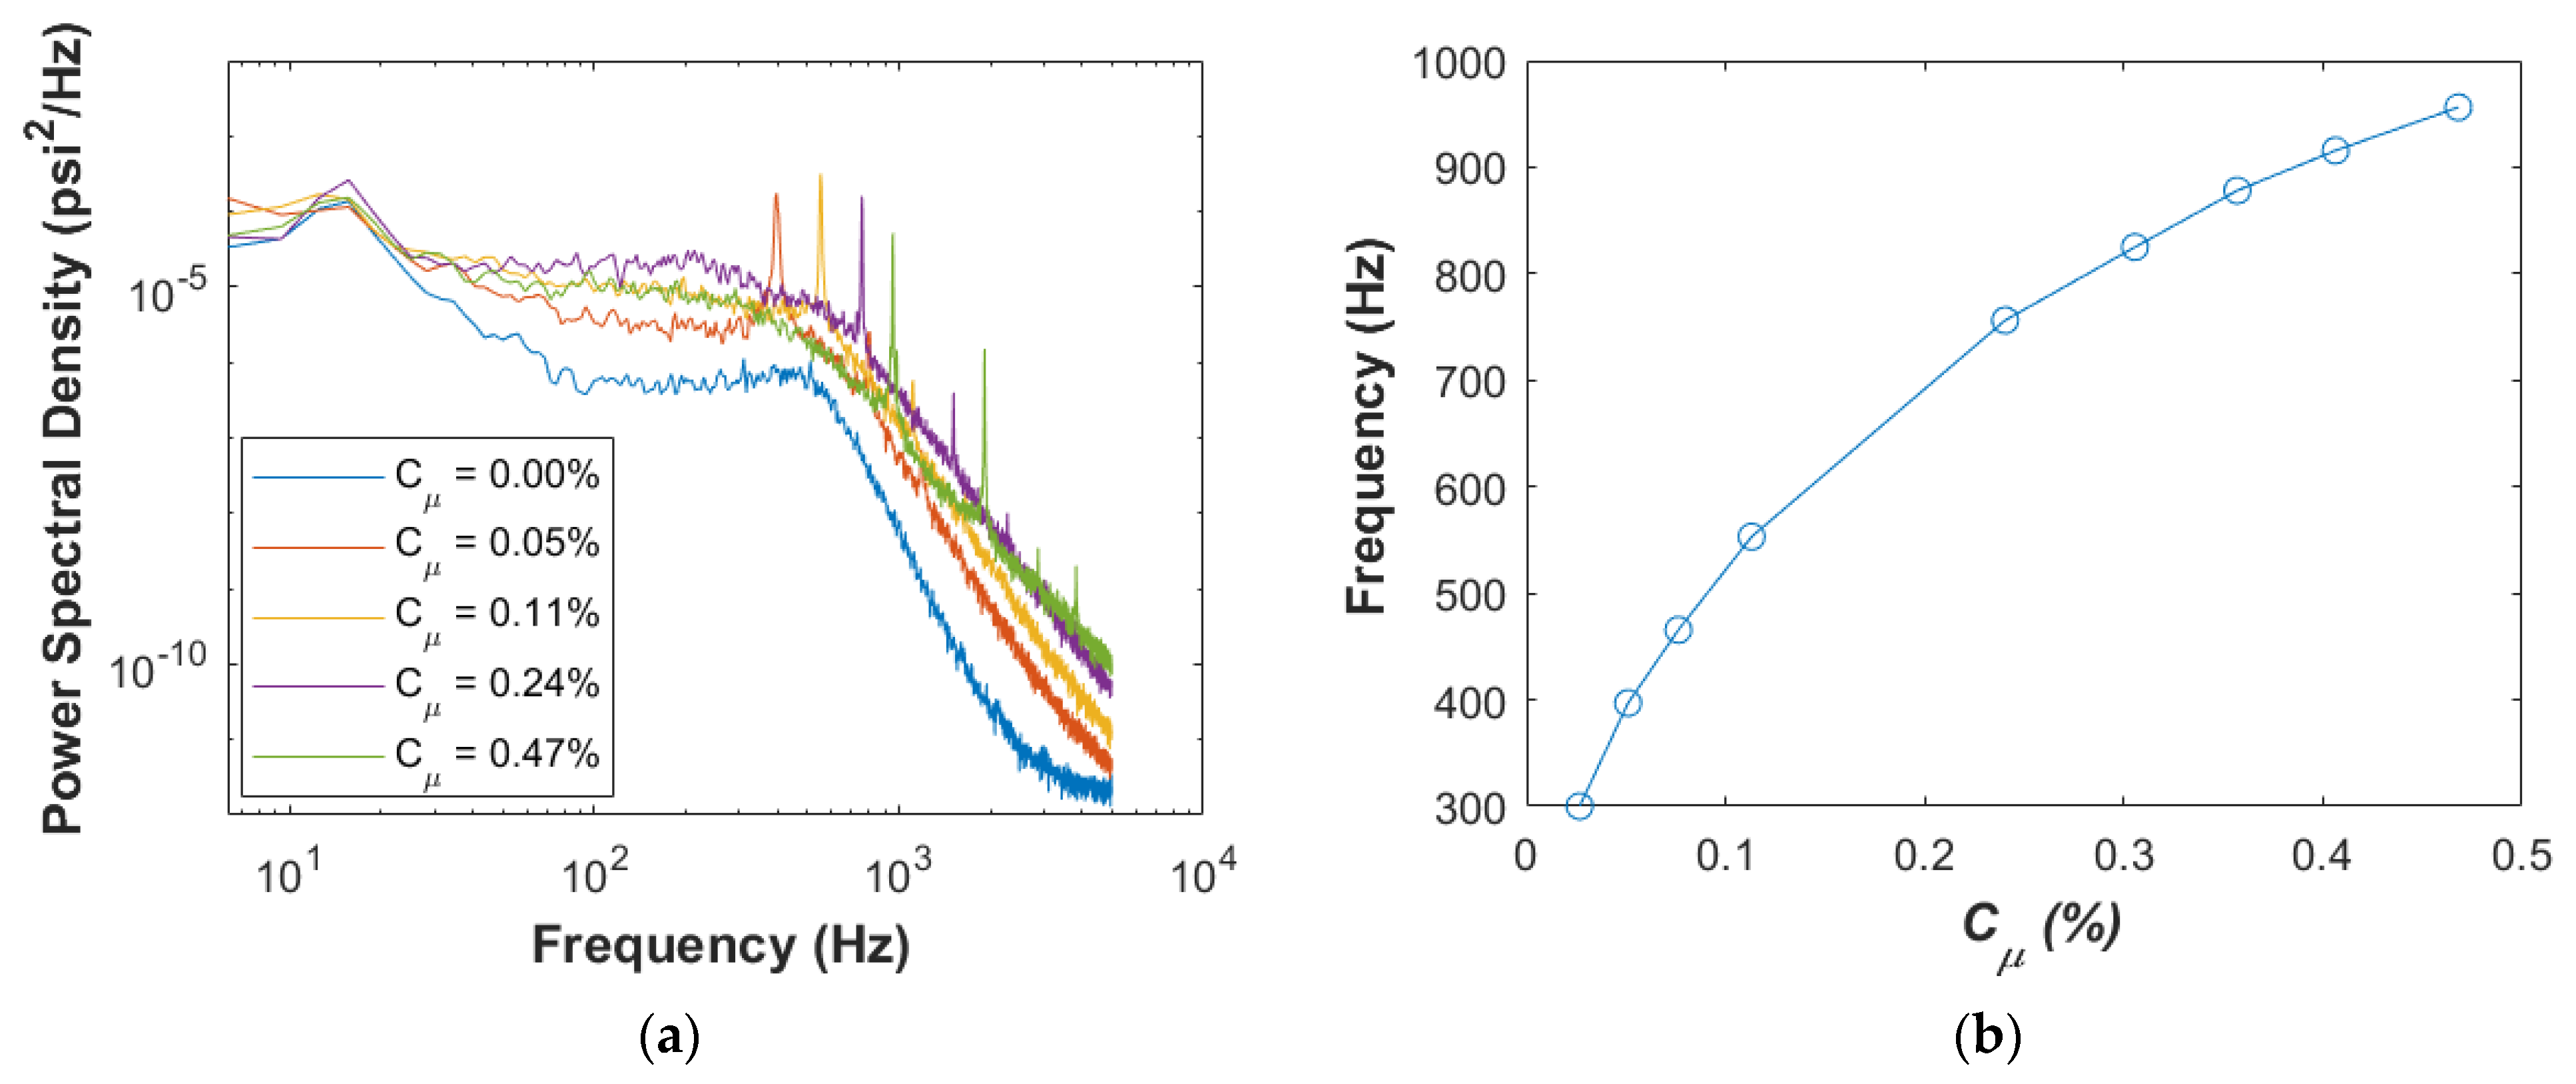
) of 0.028%. The actuator oscillation frequency was 550 Hz, as measured from the nearest unsteady pressure port. Since the flow rate to the actuator plenum (not to the individual actuators) was monitored during the experiment, the uniformity of flow distribution to each fluidic oscillator was checked prior to the wind tunnel test. The flow uniformity was verified by measuring and comparing the frequency of the individual actuators in the actuator array on a bench top. Since the frequency of a fluidic oscillator is usually proportional to the flow rate, the uniformity of the measured frequencies also implies the uniformity of the actuator flow rate and hence the individual actuator exit velocity. The bench top test with the fluidic oscillators showed that the actuator frequencies, and hence the flow rates, deviate by a maximum of 2.5%.
The second AFC method used in this performance assessment is steady blowing from discrete nozzles, which were reported in Ref. [
20] for the same experimental configurations. There were 31 discrete nozzles with 16.5 mm spacing spanning the model width. The discrete nozzles had 1 mm × 5.6 mm cross section where the total jet area is
Aj = 31 × 1 × 5.6 = 173 mm
2. This requires a flow rate of
Q = 5.32 L/s (
CQ = 0.062%) to maintain the same momentum coefficient. The jet velocity at the actuator exit is calculated as
Uj = 30 m/s.
The third AFC method compared is the steady suction from a two-dimensional slot. The experimental results were reported in Ref. [
14] as part of the CFD validation workshop. The two-dimensional slot had a nominal slot width of 0.78 mm (
Aj = 455 mm
2). Steady suction was achieved via a vacuum pump that was connected to the suction manifold and to the two-dimensional slot. The momentum coefficient for the steady suction used in this comparison is slightly lower than the rest (
Cµ =0.076%). This required
Q = 7.14 L/s (
CQ = 0.08%) of flow rate from the suction unit, which generated a suction jet velocity of
Uj = 15.5 m/s at the slot.
The last AFC method used in this comparison is the zero-net-mass-flux (ZNMF) actuators, which were reported in Ref. [
15] as the second part of the CFD validation workshop. The ZNMF actuators were voice-coil based actuator modules that produced unsteady (synthetic) jets in and out of the two-dimensional slot. The ZNMF actuators used the same two-dimensional slot, where total jet area,
Aj, is 455 mm
2. Since the ZNMF actuators were assumed to produce zero net mass during one operation cycle,
Uj is due to the oscillatory component of the ZNMF excitation as explained in Ref. [
15]. The same momentum coefficient (
Cµ = 0.11%) resulted in a peak jet velocity of 26.6 m/s at 138.5 Hz actuation.
It should be noted that none of the AFC actuators used in this study were optimized to deliver the most effective/efficient flow control, and the comparison shown here should be viewed in this context. There are various parameters that can be optimized to achieve a better or the best performance. The most obvious one is the geometry of the AFC actuator to minimize internal losses and/or to increase flow control output. For pneumatic type actuators, flow chocking at higher nozzle pressure ratios is known to reduce the actuator efficiency; therefore, the geometry should also be optimized to reduce the adverse effects of flow chocking. The other parameters that can be optimized are: actuator orientation (skew and pitch angles), the actuator spacing (both spanwise and streamwise distance), and the actuator location. Note that the actuator streamwise location is the same for all AFC methods in this study. For unsteady AFCs, the actuator design can be optimized to operate at certain frequency, which increases the AFC efficiency, especially in controlling unsteady flow phenomena. Last, but not least, the system that provides power (pneumatic or electrical) to the AFCs, such as compressor, suction pump, electrical units, etc. should be optimized to increase overall system efficiency.
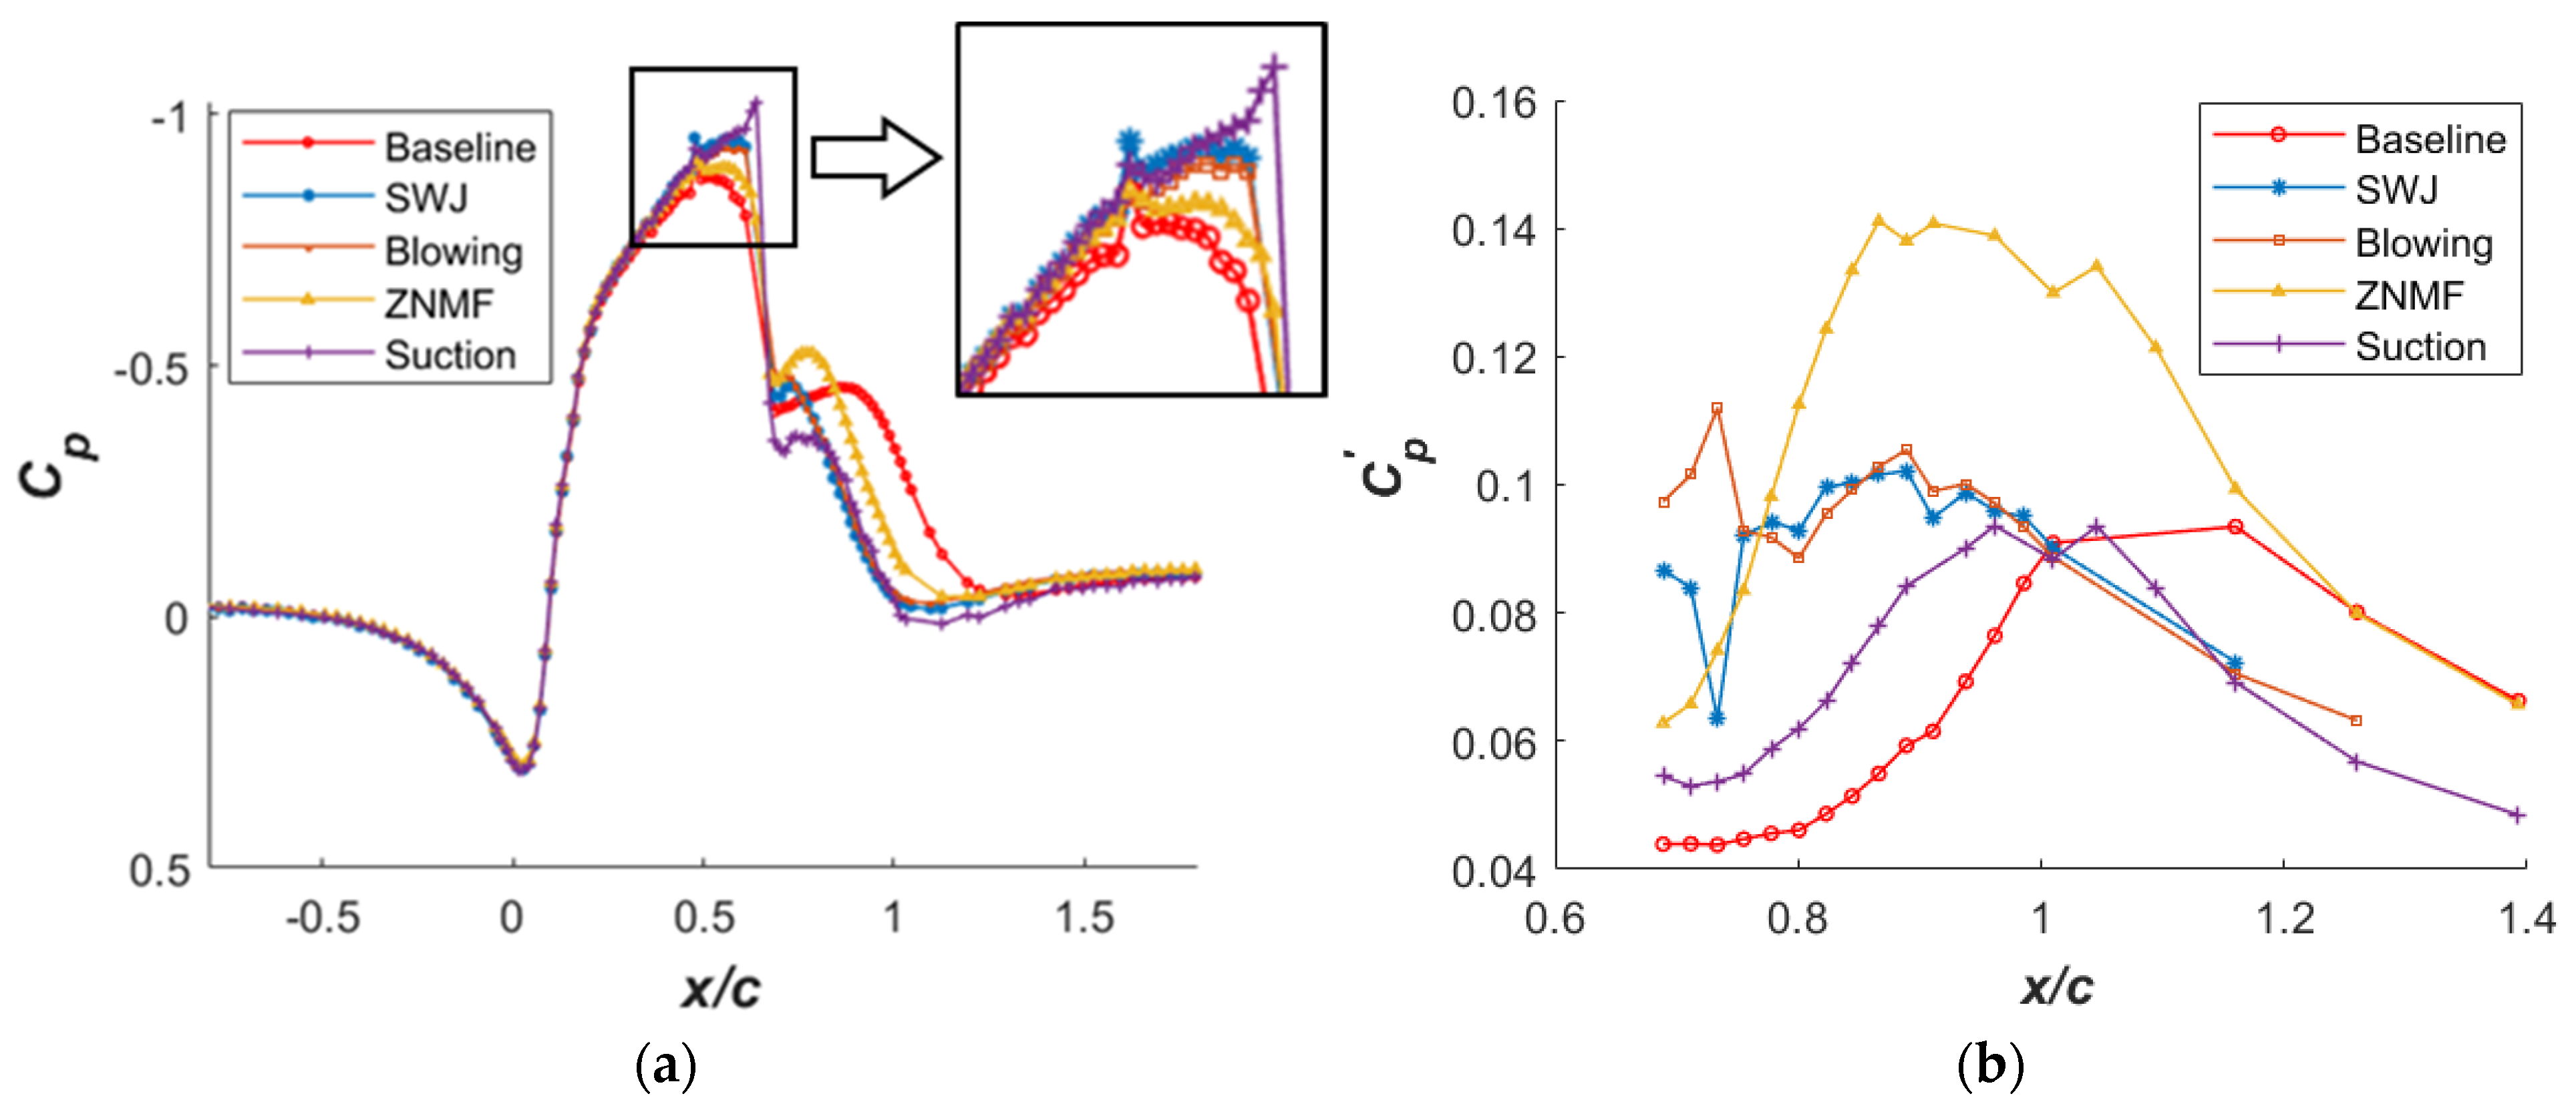
Figure 11a compares the centerline
Cp distributions for different AFC methods at the low momentum coefficient (
Cµ = 0.11%). The pressure distribution of the baseline case is also given for comparison. As shown in this figure, all AFC methods produced increased suction pressure upstream and pressure recovery in the separated flow region. They have similar trends in controlling the separated flow, but the momentum coefficient is not enough to eliminate the separation. All AFC methods produced similar
Cp distributions except for the ZNMF actuators, which generated less improvement both in the upstream suction pressures and downstream pressure recovery. The main difference between different AFC methods is in the vicinity of the actuator exit. Except for the steady suction, the other AFC methods appear to promote flow separation immediately downstream of the actuators as indicated by the sudden decrease in the pressure. The
Cp distributions in this region are shifted up—indicating flow reacceleration over the separation bubble. Although the flow separation is controlled (i.e., bubble size is reduced) by AFC, this flow reacceleration indicates strengthening of the bubble circulation. On the other hand, the steady suction not only reduces flow separation but also weakens the bubble circulation.
The fluctuating pressures (
Cp’) are displayed in
Figure 11b for all four cases. Note that the
Cp’ distributions presented in this figure are random fluctuations for the fluidic oscillators (SWJ) and ZNMF actuators. The
Cp’ distributions appear to have comparable magnitudes, whereas the ZNMF actuators generated consistently higher pressure fluctuations. The
Cp’ peak moves upstream due to the shorter separation bubble compared to the baseline case. Although the baseline case has a peak, the
Cp’ distributions for the AFC methods are more broad, and it is difficult to determine the peak
Cp’ location as an indication of reattachment location. The effect of two-dimensional versus discrete actuation can be seen in this figure. While the two-dimensional slot actuations with the ZNMF actuators and the steady suction provided smooth data for the first four unsteady pressure ports, the discrete actuation with the fluidic oscillators and steady blowing resulted in drastic changes in the slope of the curves. These drastic changes indicate the presence of three-dimensional unsteady flow structures near the actuator exits for the steady blowing and fluidic oscillator cases. The
Cp’ distributions of the steady blowing and fluidic oscillators show the same trend consistent with similar levels of pressure recovery in
Figure 11a. Similarly, the ZNMF actuators and steady suction have the same trend but differ in magnitude. This is also in line with the pressure recovery in
Figure 11a for these two actuators (i.e., similar trend but different magnitudes).
The overall performance of the AFC methods is presented in terms of quality metrics (
Table 2). The baseline and inviscid cases are also given for comparison. All three quality metrics agree with each other. Based on these quality metrics, it is evident that the steady suction produced the largest normal force and the least pressure drag. It is also the closest to the ideal case based on the
Cinv coefficient. The steady suction is followed by the fluidic oscillators (SWJ), which reduce the pressure drag coefficient slightly and increase the normal force coefficient compared to the baseline. As expected from
Figure 11a, the ZNMF actuator is the least effective at this momentum coefficient. Although the
Cp and
Cp’ distributions clearly denoted separation control, the ZNMF actuators increased the pressure drag coefficient. As mentioned before, the increase in the pressure drag at low momentum actuation is attributed to the increase in the suction pressures in the aft region of the model, which generated additional drag that is similar to the drag-due-to-lift in airfoil applications. In addition, according to Greenblatt et al. [
15], the magnitude of the jet exit velocity also plays role in this initial adverse effect. When the jet exit velocity is too low (
Uj <<
U∞), the slower jet retards the boundary layer flow resulting in lower near-wall momentum, and the boundary layer is more susceptible to separation. Therefore, the pressure drag coefficient alone can lead to misleading conclusions especially at low momentum excitations. Consistent with the pressure drag increase, both
Cinv and
Cnp quality metrics denote that the ZNMF actuator is the least effective AFC method in controlling flow separation.
Another performance comparison was made at a higher momentum coefficient (
Cµ = 0.24%). As stated in Ref. [
14], this momentum coefficient is still not enough to eliminate flow separation. To maintain this momentum coefficient, the flow rate to the actuators was set to
Q = 3.5 L/s, (
CQ = 0.04%),
Q = 7.84 L/s (
CQ = 0.092%),
Q = 12.75 L/s (
CQ = 0.15%) for the fluidic oscillators, steady blowing, and steady suction, respectively. The calculated jet velocities at the actuator exits are,
Uj = 100 m/s,
Uj = 146 m/s, and
Uj = 28 m/s, for the fluidic oscillators, steady blowing, and steady suction, respectively. The ZNMF actuator experiments reported in Ref. [
15] were performed at a slightly higher momentum coefficient (
Cµ = 0.27%), which produced a peak jet velocity of 42 m/s at 138.5 Hz actuation.
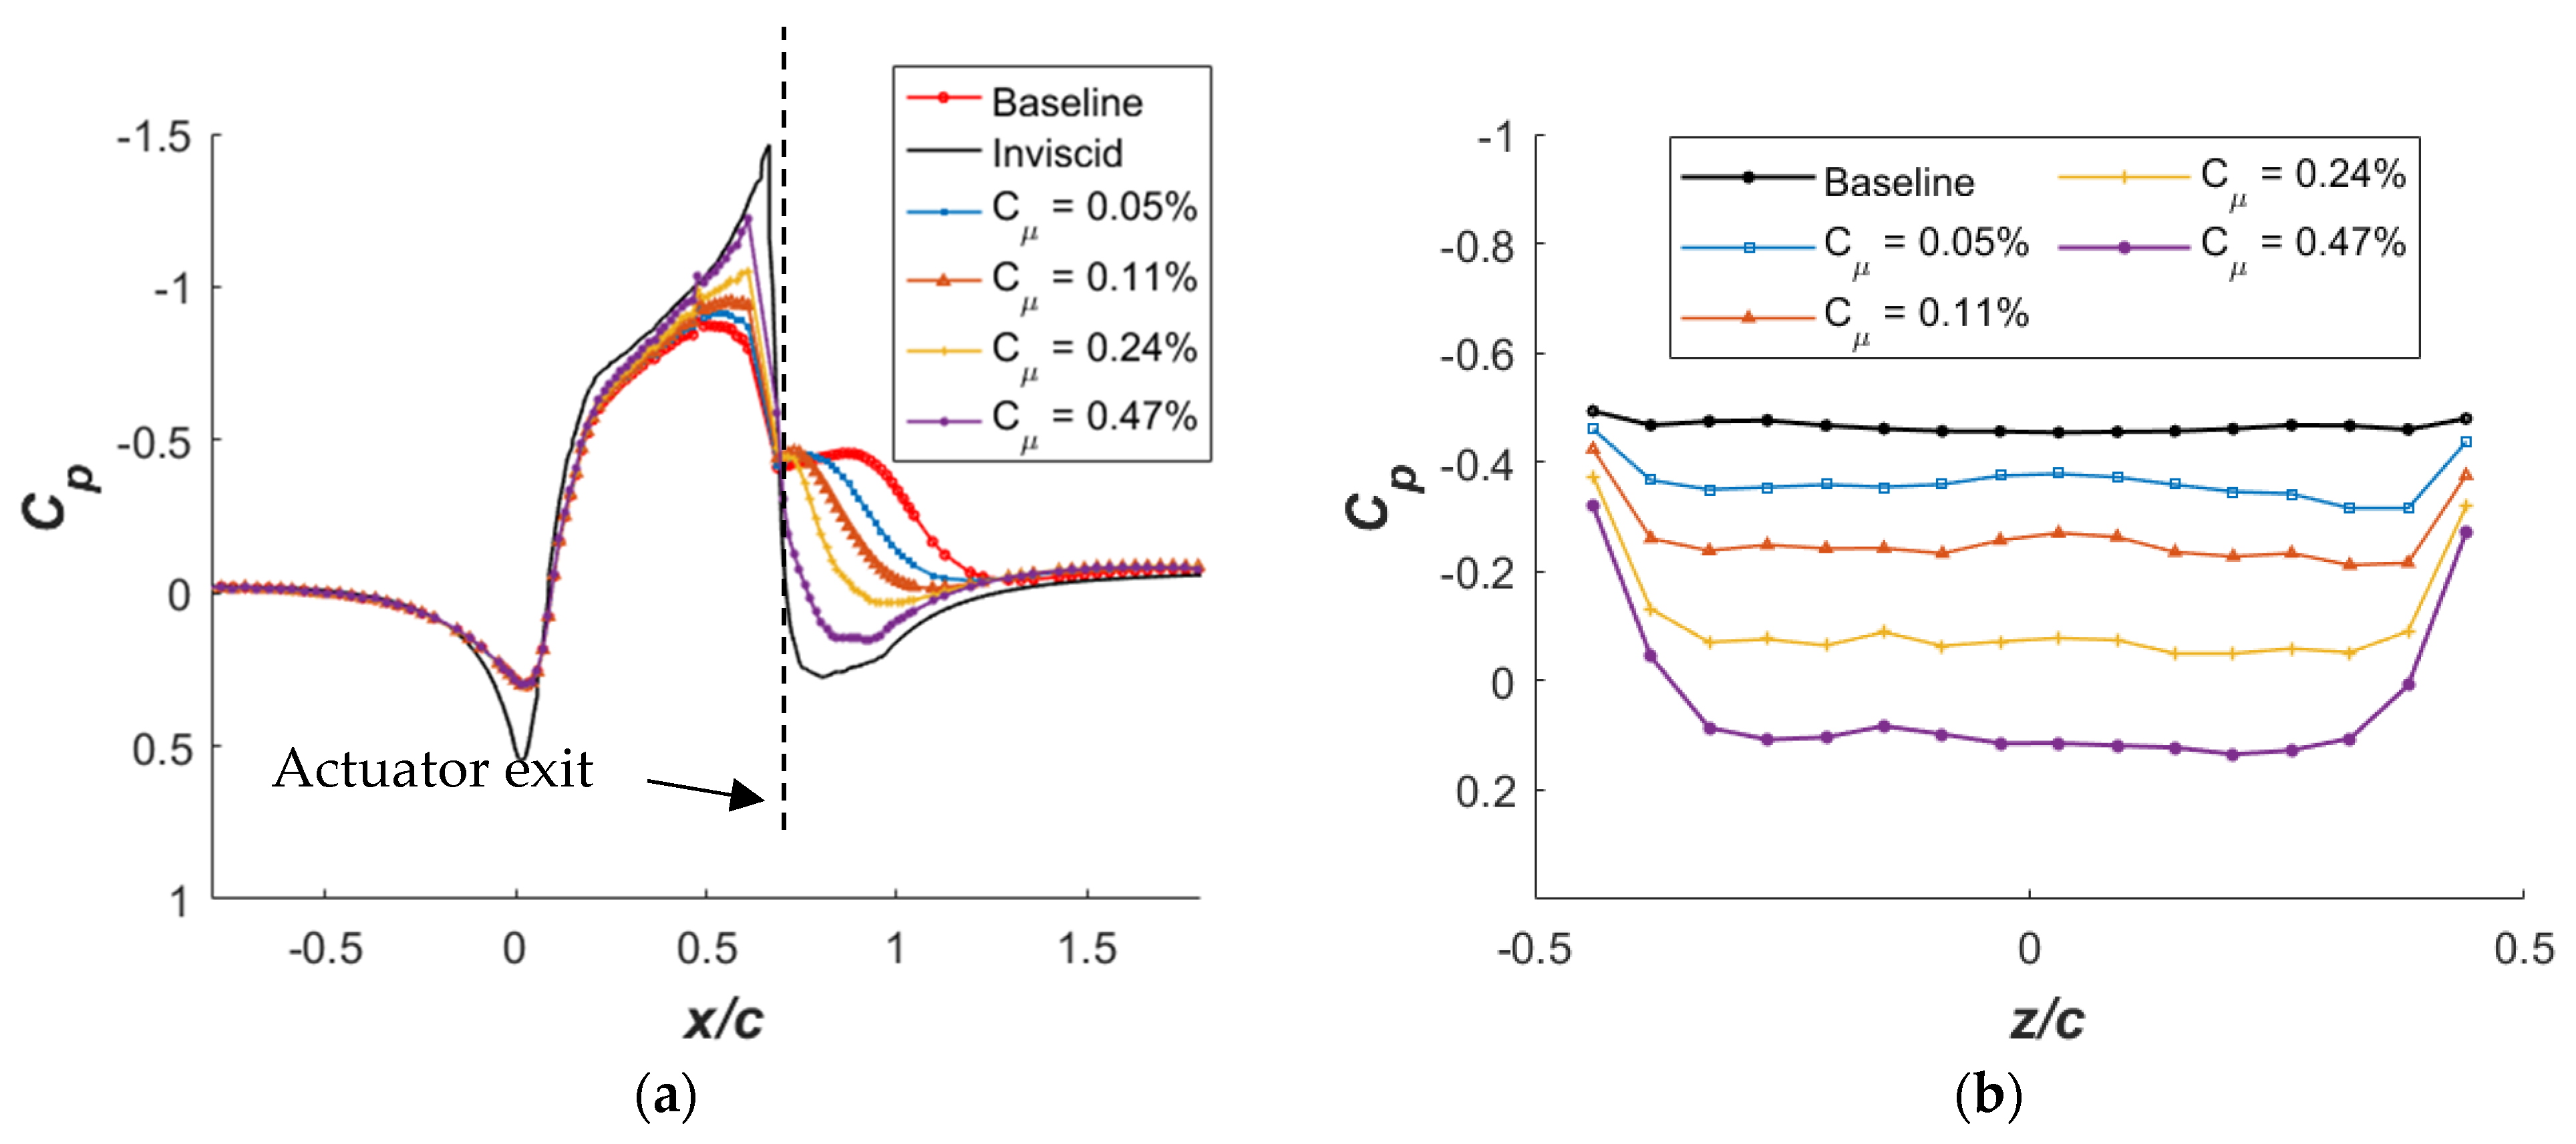
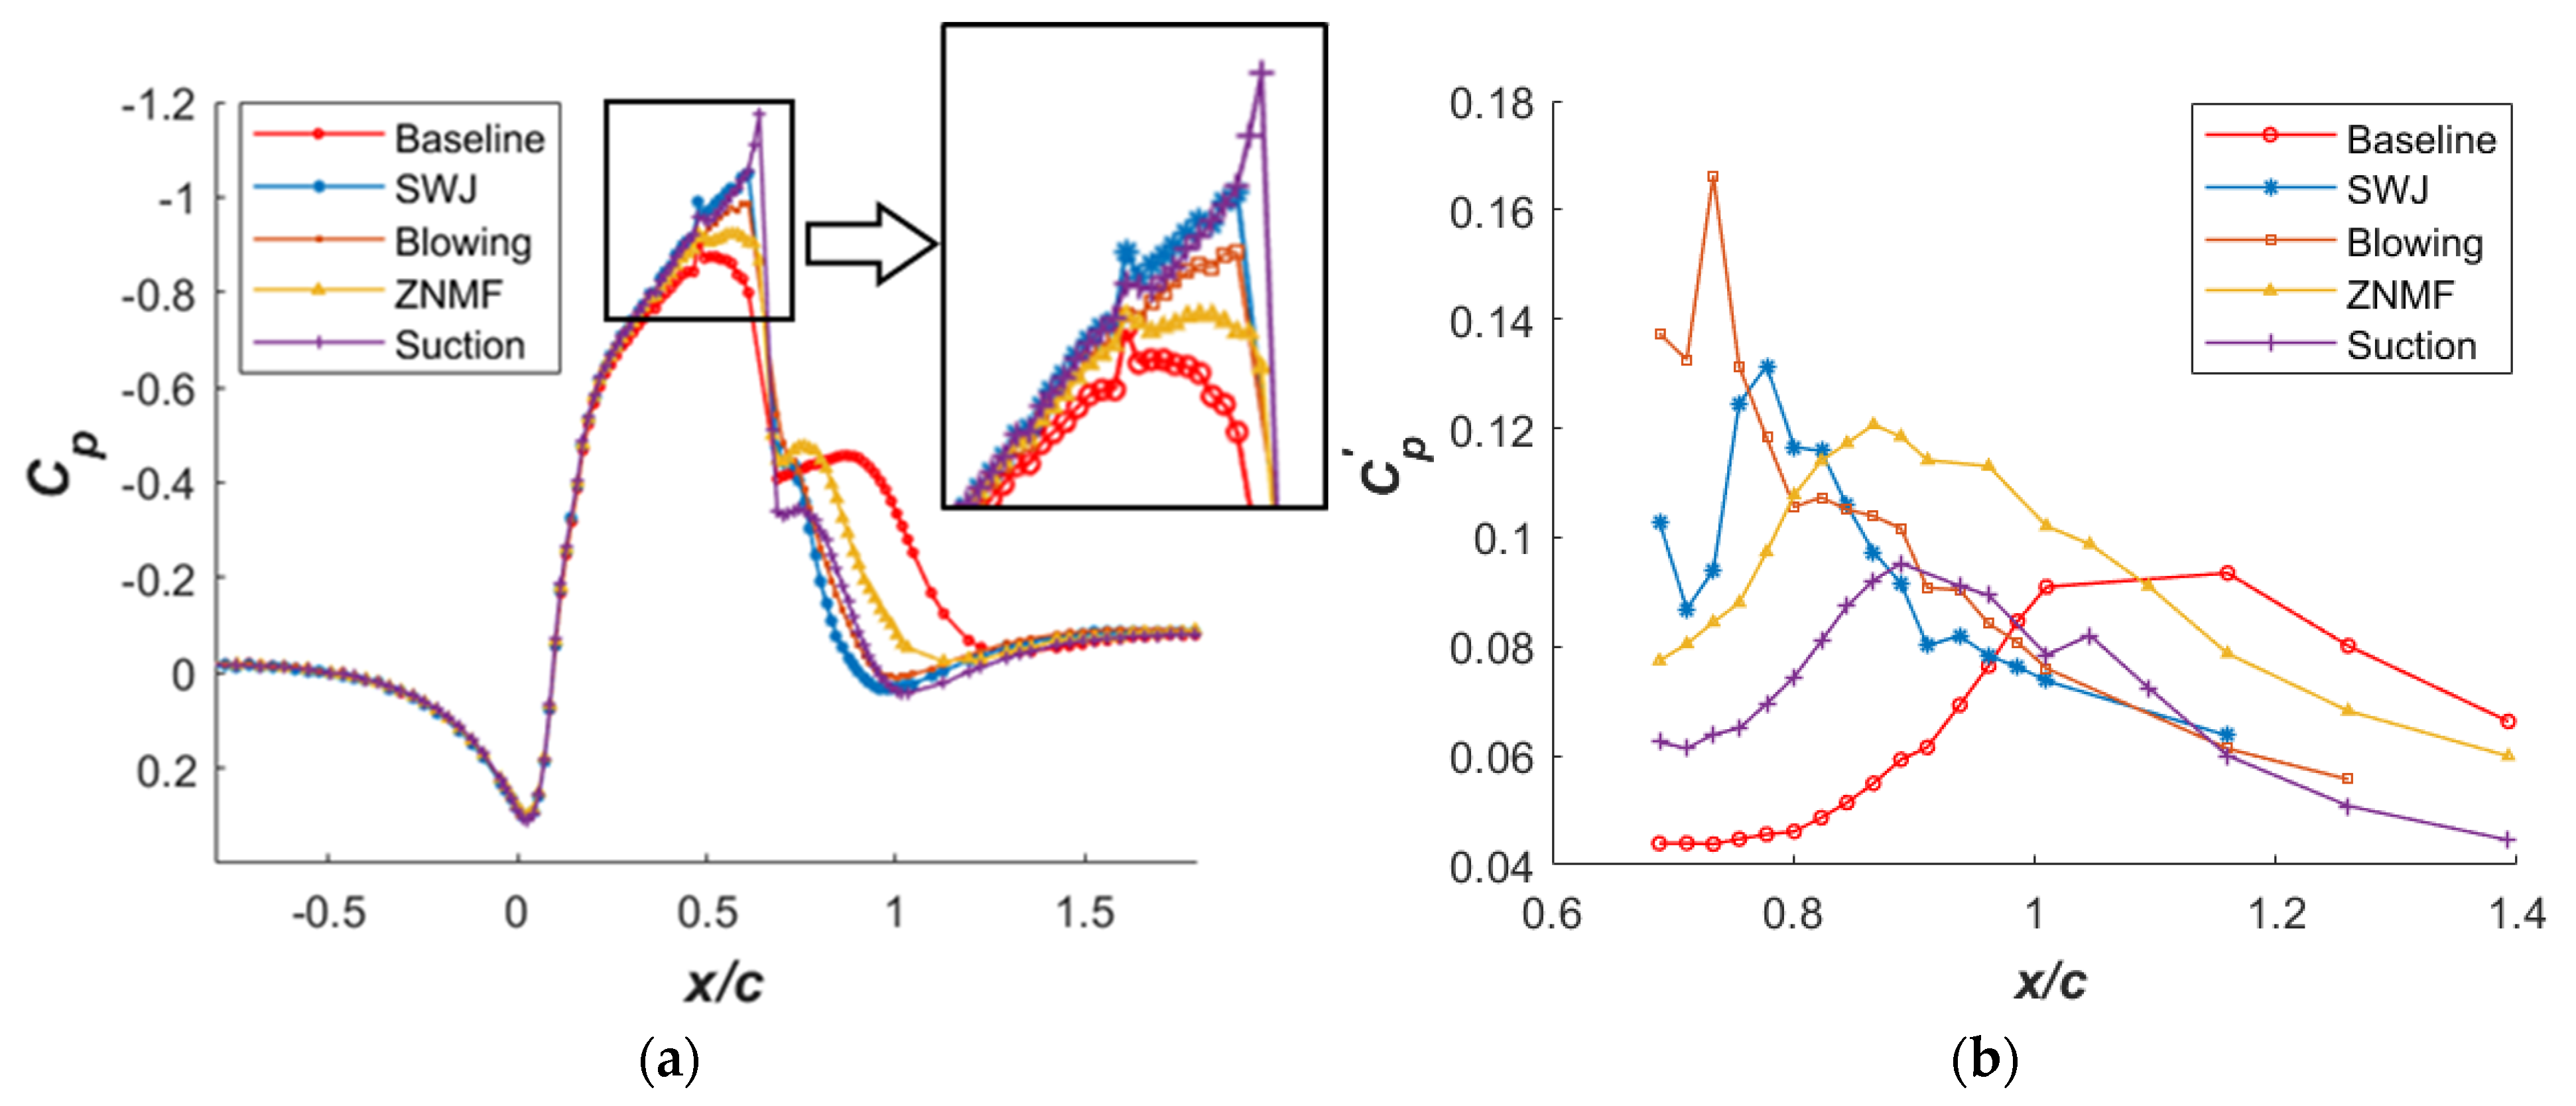
The comparison of the centerline pressure distributions for the momentum coefficient of
Cμ = 0.24% is presented in
Figure 12a. The pressure distributions are identical to that of the lower
Cµ case (
Figure 11a) but with increased flow control authority. The pressure distribution of the fluidic oscillator (SWJ) case matches well with that of the steady suction case, indicating both AFC methods provide similar flow acceleration upstream. These two AFC methods are followed by the steady blowing and the ZNMF actuators, where the ZNMF actuators produced the least upstream suction pressures. In the pressure recovery region, the pressure distributions of the fluidic oscillators, steady blowing, and steady suction are close; however, the ZNMF actuators produce substantially less pressure recovery similar to the lower
Cµ case. The main disparity between different AFC methods is again in the region immediately downstream of the actuator exits. In this short region, the fluidic oscillators and steady blowing provide slightly lower pressures compared to the baseline case. Although the ZNMF, fluidic oscillators, and steady blowing still cause flow acceleration in this region, it is considerably reduced in size compared to the low
Cµ cases. This indicates flow separation is further reduced, but AFC still strengthens the bubble circulation. On the other hand, the steady suction is shown to reduce the size and circulation of the separation bubble.
Fluctuating pressures for different AFC methods at
Cµ = 0.24% are given in
Figure 12b. The
Cp’ peaks move further upstream compared to lower
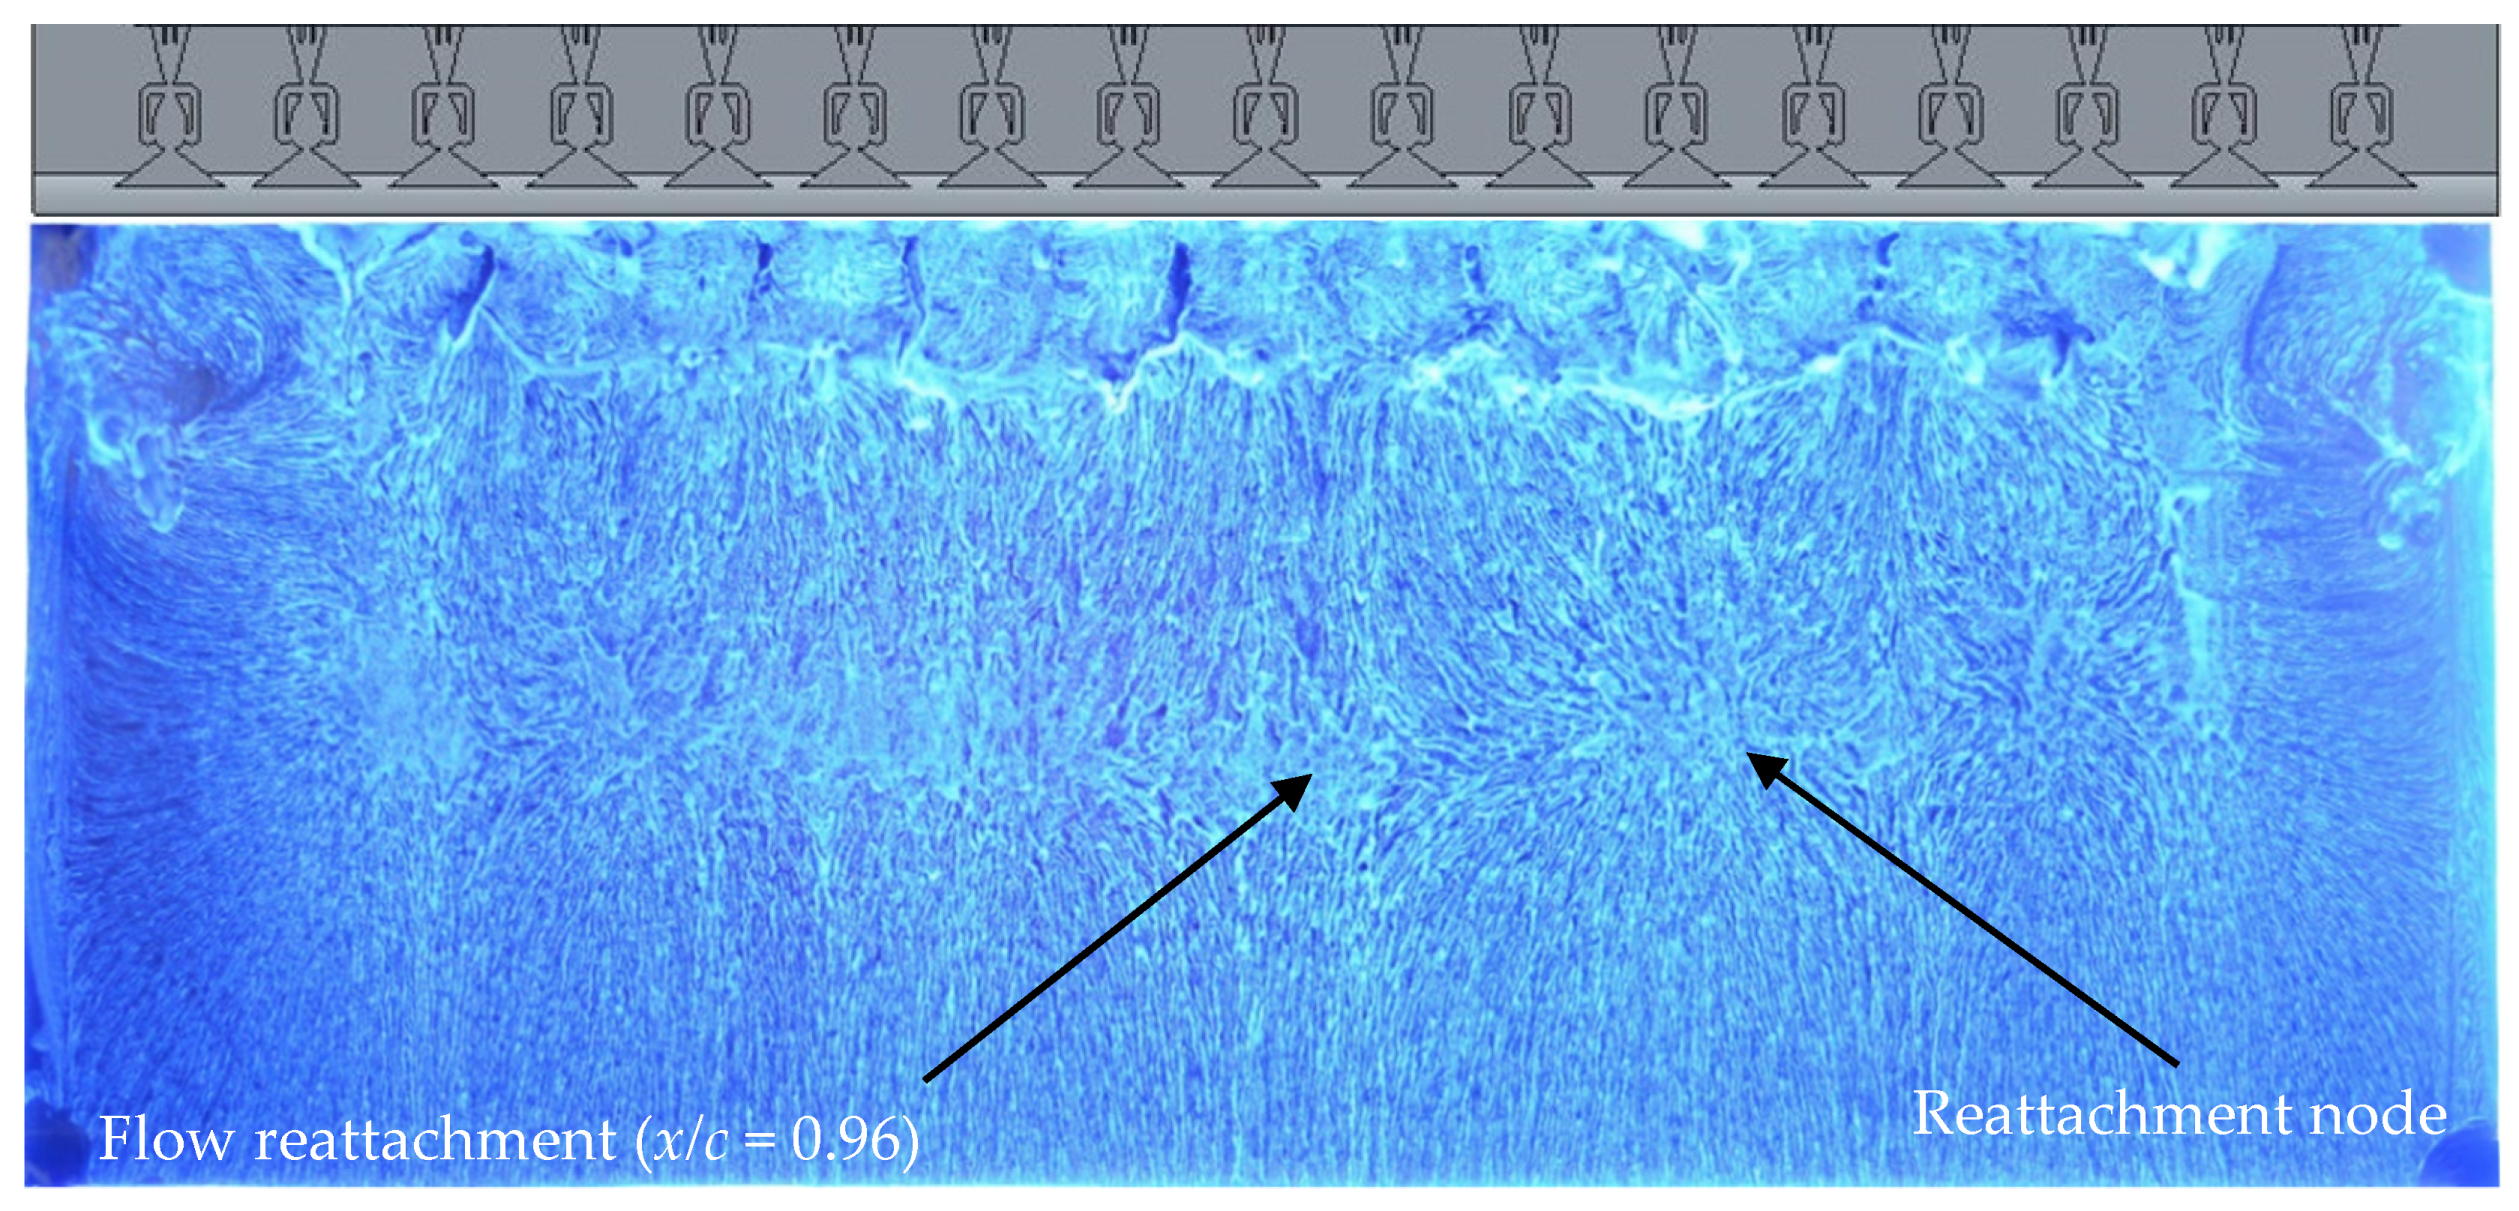
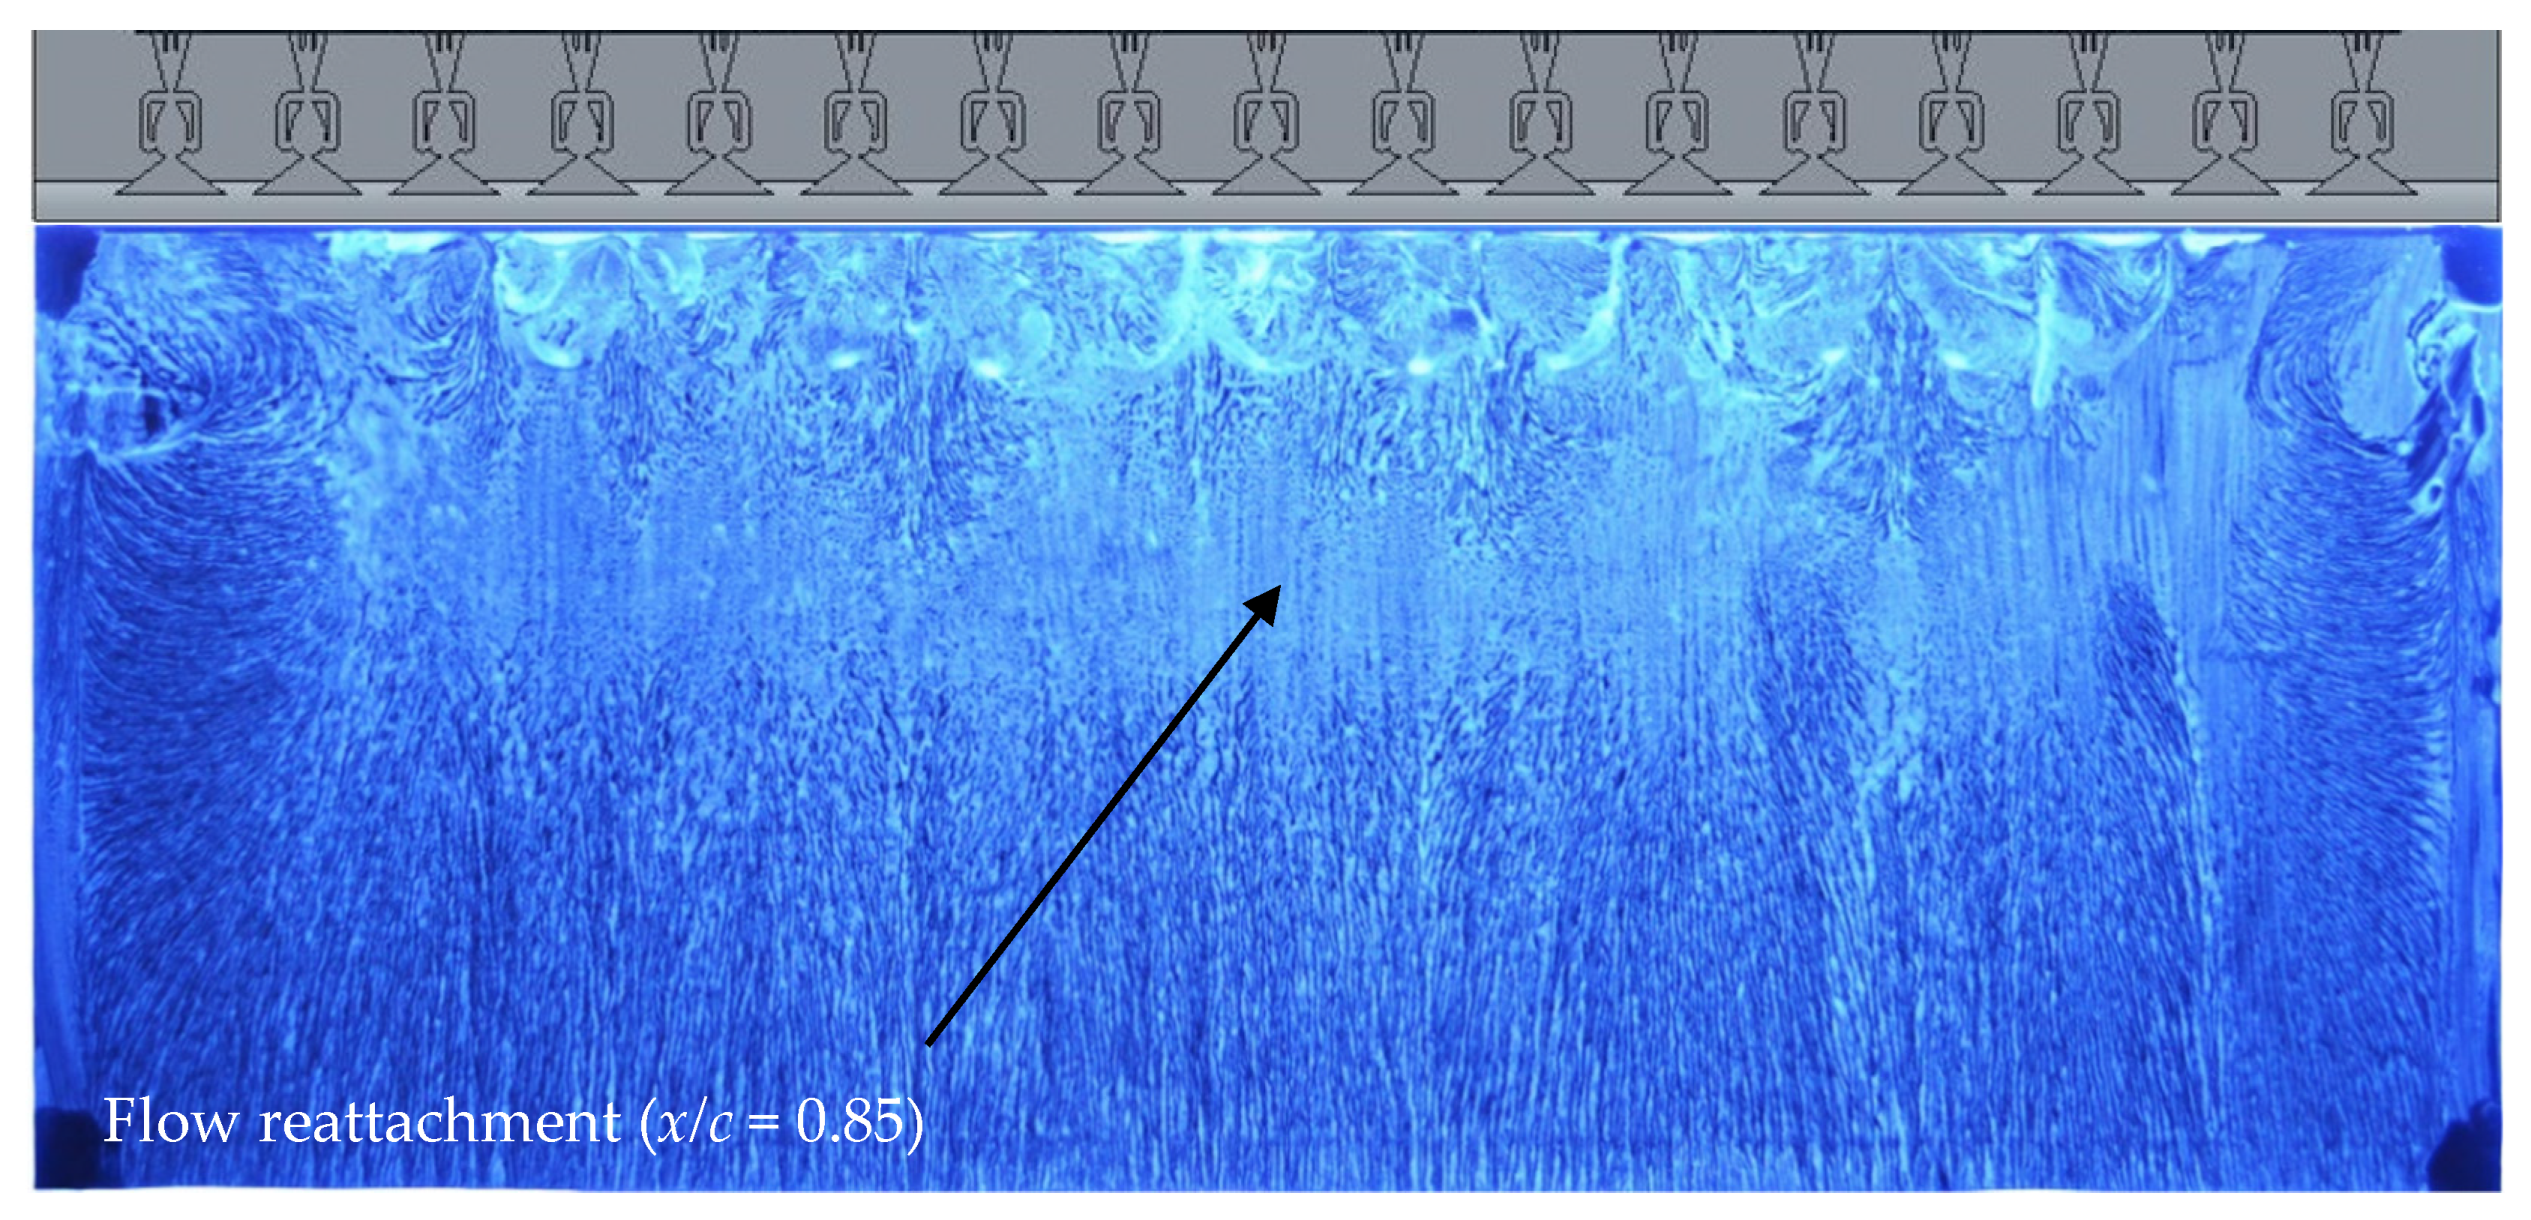
Cµ case as the separation bubble size reduces with the momentum coefficient. The effect of two-dimensional versus discrete actuation is still shown as drastic changes in the
Cp’ values for the first four unsteady pressure ports, which indicates three-dimensional flow structures shown in oilflow visualization (
Figure 7). The resemblance (but different magnitude) of the steady suction and ZNMF
Cp’ distributions still exist.
The quality metrics given in
Table 3 summarize the overall comparison of the AFC actuators at the higher excitation amplitude. As expected, the steady suction provides the best control by reducing the pressure drag coefficient by 50% and doubling the normal force coefficient. The steady suction is closely followed by the fluidic oscillators (SWJ) that reduce the pressure drag and increase the normal force coefficients considerably. In fact, the
Cinv metric identifies the fluidic oscillator as the best AFC method at this momentum coefficient. Consistent with the low amplitude case (
Figure 11a,
Table 2), the ZNMF actuator appears to be the least effective out of four AFC actuators as indicated by all quality metrics. At this momentum coefficient, all AFC methods are shown to reduce the pressure drag coefficient.
The variation of these quality metrics with respect to the momentum coefficient is presented next.
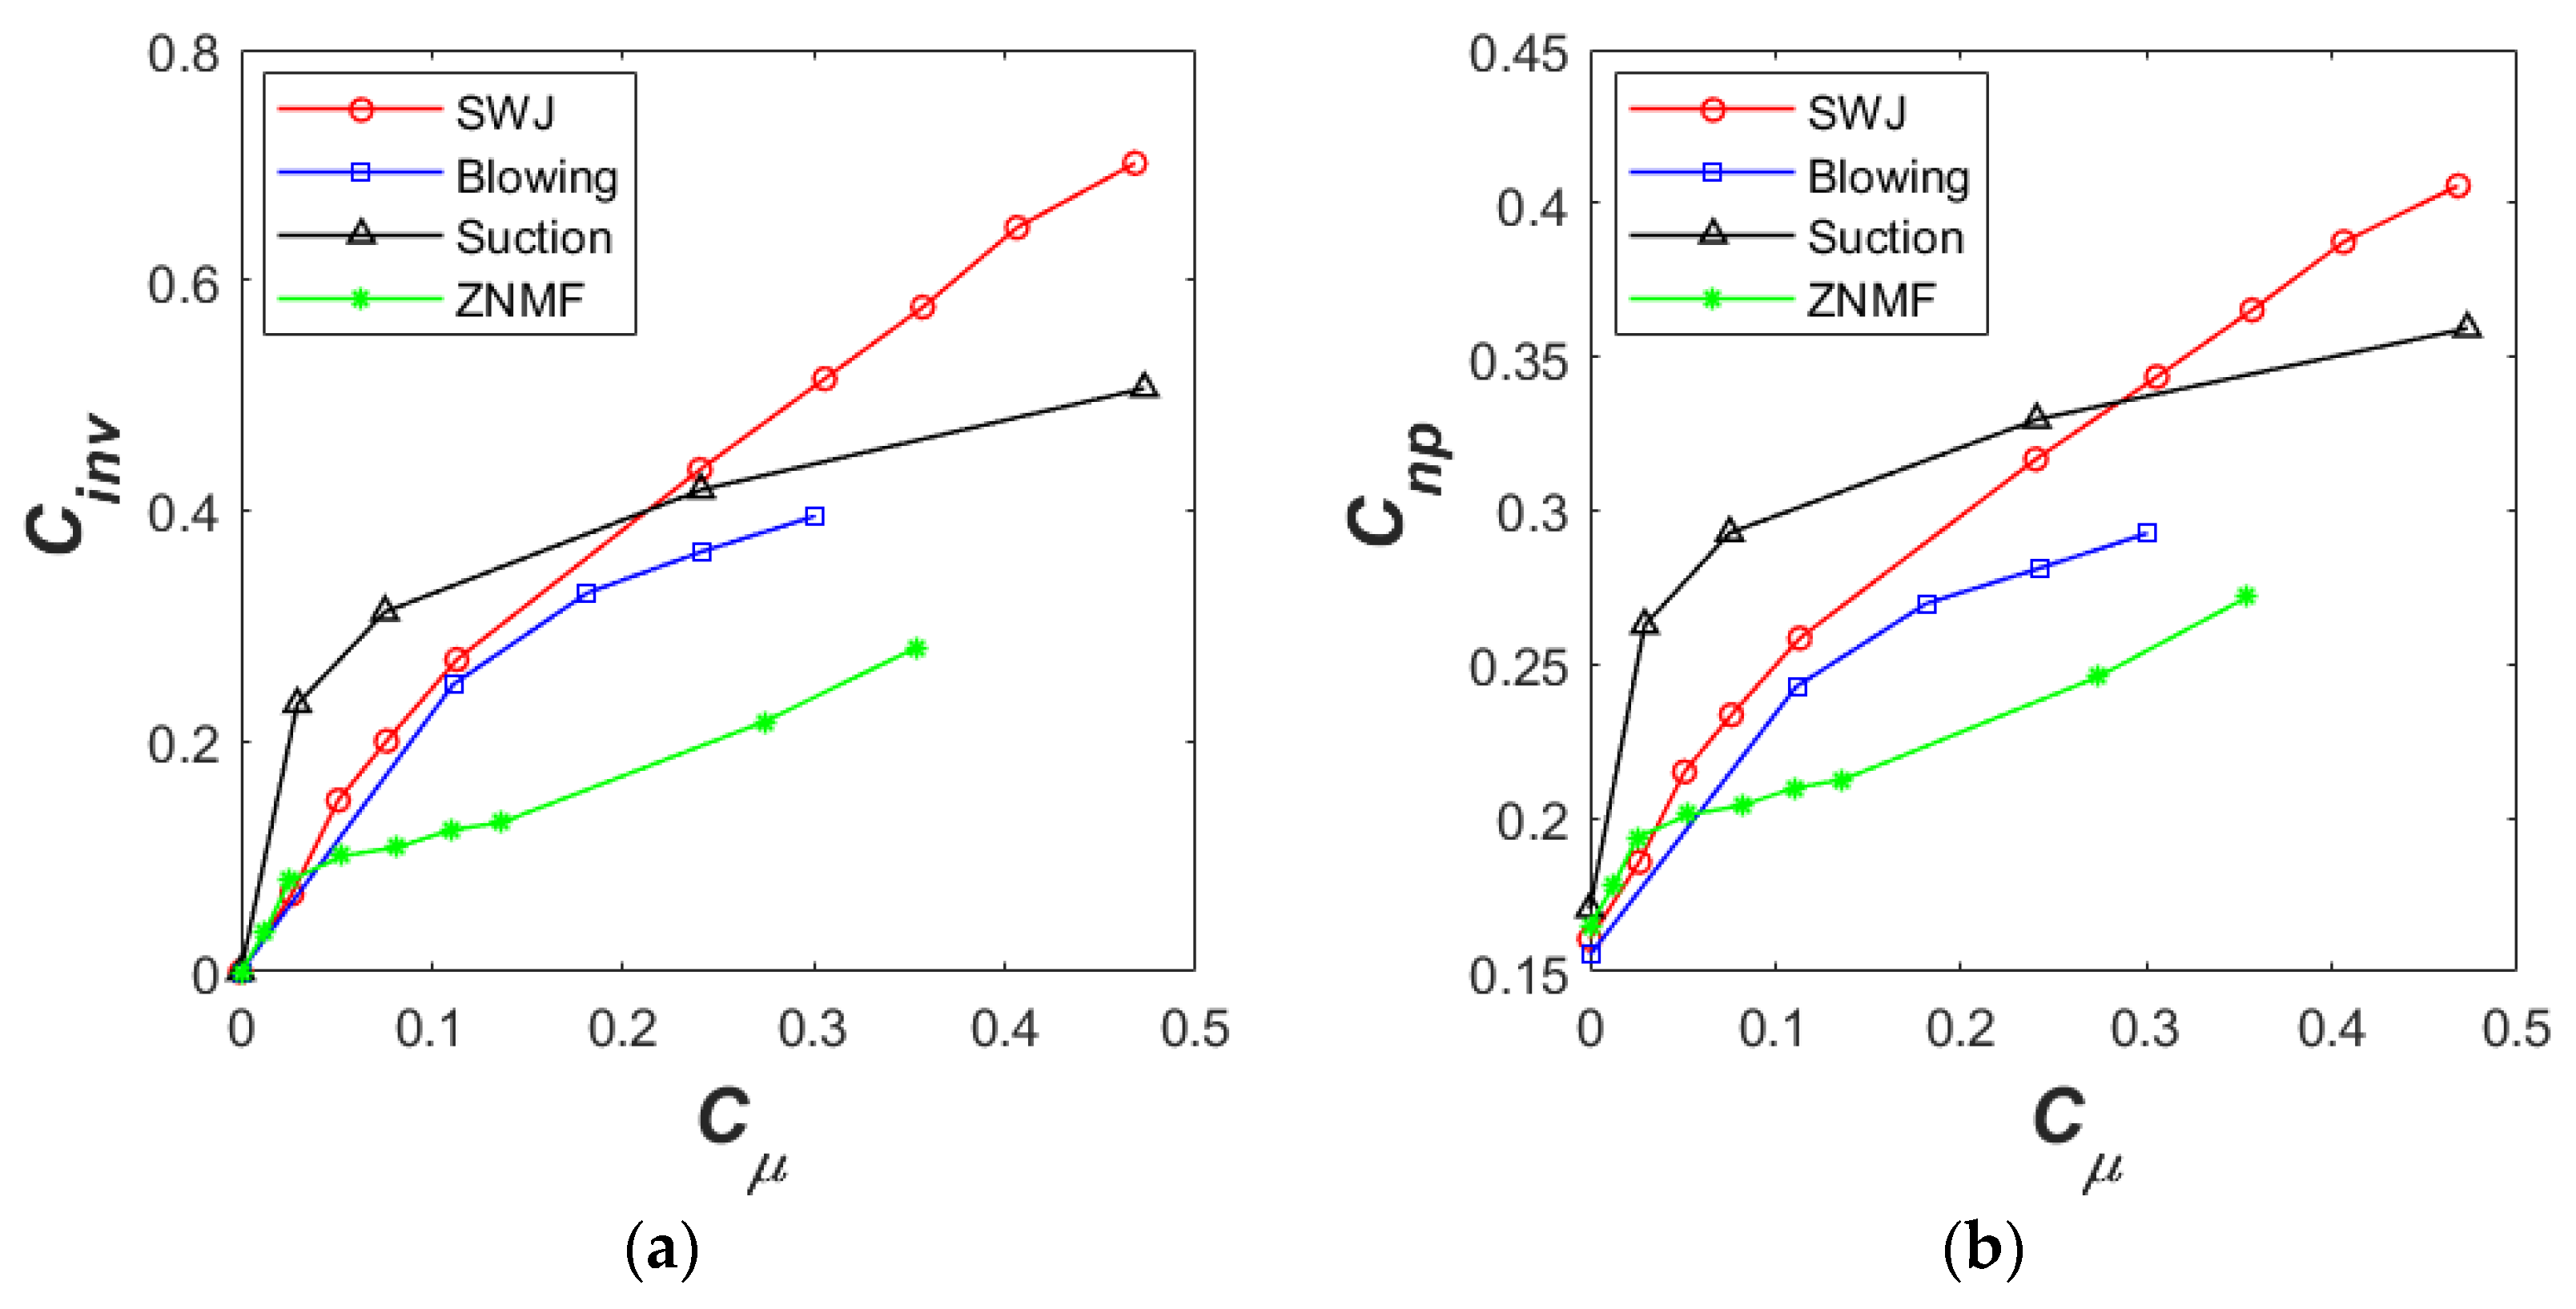
Figure 13a shows the comparison of different actuators based on the quality metric,
Cinv. As mentioned before,
Cinv indicates closeness to the inviscid flow solution, where
Cinv = 0 corresponds to baseline, and
Cinv = 1 corresponds to the inviscid flow pressure distributions.
Figure 13a shows the characteristics of different AFC methods in achieving an inviscid-like pressure distribution by controlling flow separation. Consistent with
Table 2 and
Table 3 and the
Cp distributions, the ZNMF actuator is the least effective AFC method in achieving an inviscid-like pressure distribution. On the other hand, the steady suction appears to be the best AFC method at low momentum applications,
Cµ < 0.2%. It has a logarithmic trend with
Cµ but loses its superiority as
Cµ increases. The fluidic oscillators (SWJ) have a linear-like relation with
Cµ. As shown in this figure, the fluidic oscillator is the best AFC method for higher momentum coefficients,
Cµ > 0.2%. Note that the range investigated in this study is
Cµ < 0.5%. The fluidic oscillator (or any pneumatic actuator) loses its effectiveness when the jet inside the actuators becomes chocked at higher
Cµ. The fluidic oscillators at higher
Cµ is discussed in Refs. [
11,
12]. The steady blowing also has a logarithmic trend; however, it is less effective than the steady suction or the fluidic oscillators for the entire
Cµ range.
The fluidic oscillators in this study appear to achieve better
Cinv values compared to that of [
11] (see
Figure 7) for the range tested. Note that the baseline pressure distributions are slightly different, but the
Cinv coefficient takes different baselines into account as presented in Equation (1). Although there are some differences in the experimental configurations (such as incoming boundary layer, model aspect ratio, jet inclination angle, actuator spacing, etc.), this superiority is conjectured to be due to the internal design. The current fluidic oscillator is the improved version that was reported in [
18] to provide better performance in flow control applications. The other reason may be the aspect ratio of the actuators. The throat dimension of the current actuators is 1 mm × 2 mm compared to 1.4 mm × 1.4 mm in Ref. [
11]. Although the actuator throat area is close (2 mm
2 vs. 1.94 mm
2), the current actuator is larger in size, which was shown to provide better performance [
9].
The second quality metric is the modified normal force coefficient,
Cnp. The
Cnp coefficient can be perceived as similar to the lift coefficient for wall-mounted wind tunnel models. As mentioned before, the
Cnp coefficient is modified to account for the upstream suction pressure and downstream pressure recovery (Equation (4)). Interestingly, the
Cnp vs.
Cµ plot is qualitatively similar to the
Cinv vs.
Cµ plot. This allows the performance assessment of an AFC method without requiring the baseline and inviscid solutions. Although it is possible to compare the
Cnp values to those of the baseline or inviscid cases, the
Cnp coefficient itself is not a comparison (i.e., relative) coefficient. Returning to
Figure 13b, the same conclusions can be drawn for the
Cnp metric to that of
Cinv. The ZNMF actuator is the least effective AFC method, and the steady suction is the most effective especially for lower
Cµ excitations. The fluidic oscillator (SWJ) is the second most effective for lower
Cµ, but it becomes the best AFC method for higher momentum coefficients,
Cµ > 0.3%. Both the steady blowing and steady suction have a logarithmic trend, where AFC loses its effectiveness as
Cµ increases.
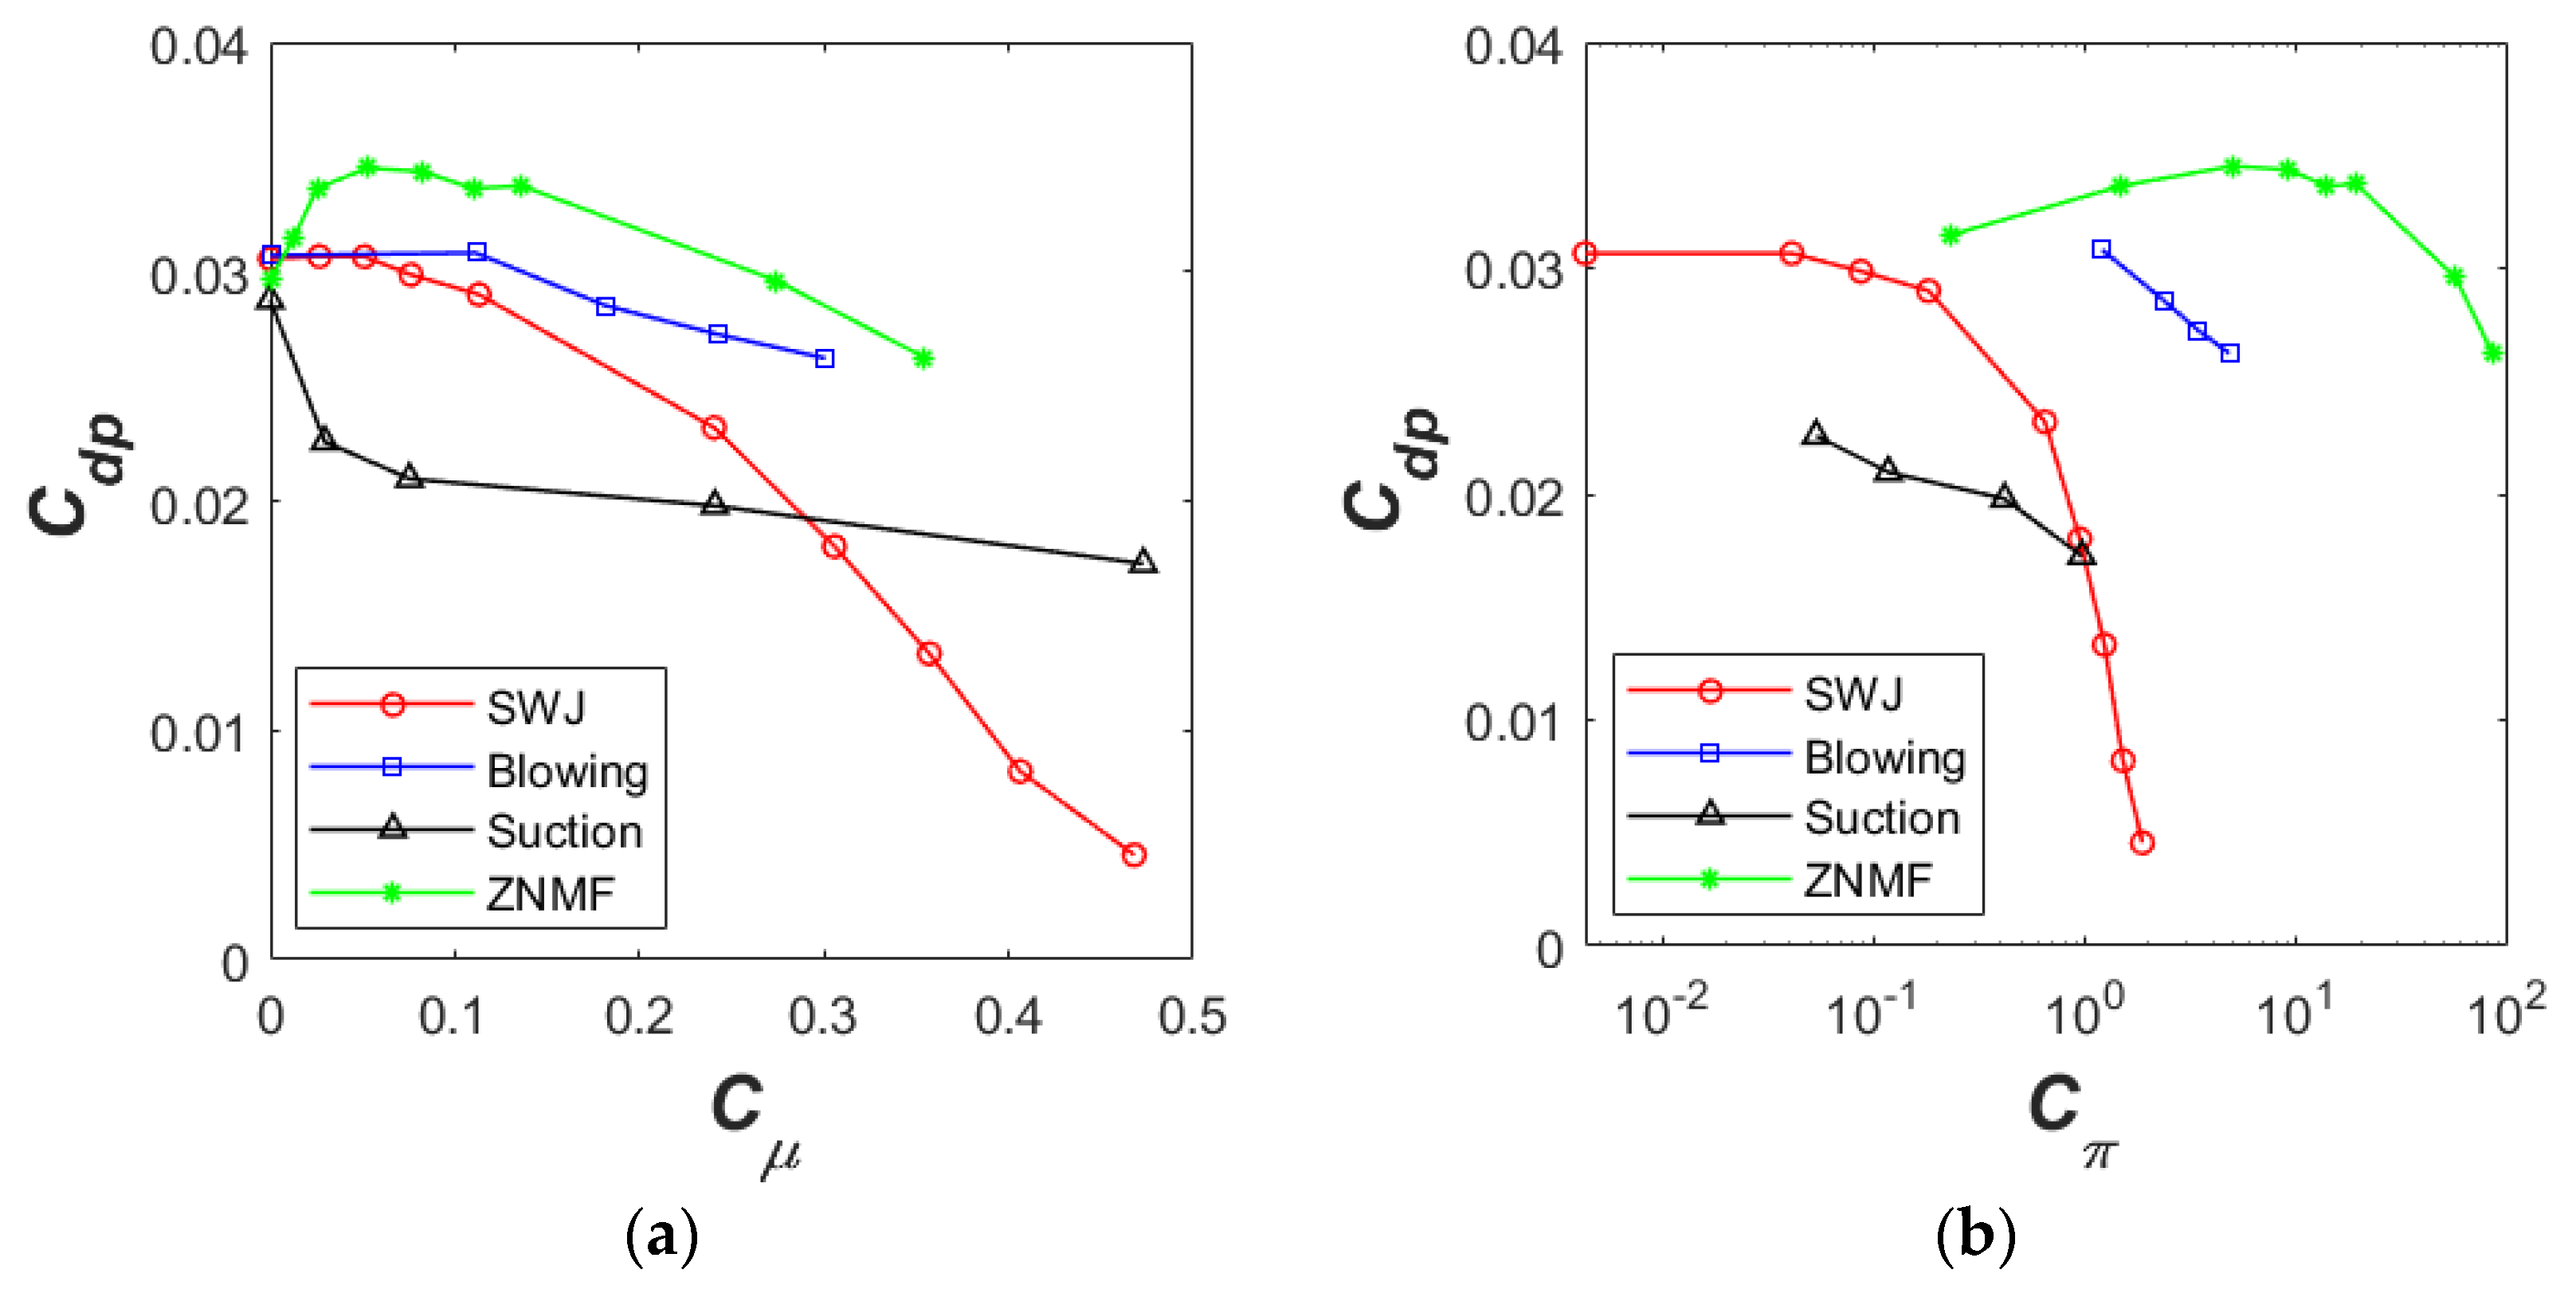
Figure 14a presents the variation of the pressure drag with respect to
Cµ for different AFC methods. The pressure drag coefficient implies the drag caused by separated flow and directly shows the effect of AFC on the separation bubble. As shown in this figure, the steady suction is highly effective in reducing the pressure drag coefficient and hence the separated flow. On the other hand, the ZNMF actuator is shown first to increase and then to decrease the pressure drag. It is only after
Cµ > 0.27% that the ZNMF actuators actually reduce the pressure drag compared to the baseline case. The initial increase in
Cdp is attributed to the suction pressure increase in the aft region
x/
c >
xm (i.e., near the suction peak) and over the separation bubble (see
Figure 11a), which generated additional drag similar to drag-due-to-lift. The suction pressure increase over the separation bubble indicates the strengthening of the bubble circulation although its size is reduced by flow control. Similar to the ZNMF actuator, both the steady blowing and fluidic oscillators have little or no effect in reducing
Cdp at low
Cµ. The pressure drag coefficient commences to decrease for
Cµ > 0.05% and
Cµ > 0.11% for the fluidic oscillators and steady blowing, respectively. The fluidic oscillators (SWJ) appear to be the second best AFC method in reducing
Cdp for lower
Cµ, and the most effective for
Cµ > 0.3%. For the highest momentum case (
Cµ = 0.47%), the separation bubble is almost eliminated reaching a
Cdp close to zero (
Cdp = 0.005).
In the previous figures and tables, the AFC actuator performance is compared based on the momentum coefficient. The momentum coefficient is a well-known scaling parameter and points out the momentum injection by the AFC actuators to the flow field. The momentum coefficient is the ratio of the jet momentum (
ρu2) times the reference jet area (
Aj) to that of the freestream. However, the momentum coefficient does not inform about the flow rate that an actuator requires or the pressure needed to drive the flow rate. As mentioned at the beginning of this section, different AFC methods require different flow rates to keep the same momentum coefficient. For example, while the fluidic oscillators required
Q = 2.4 L/s of flow rate, the steady blowing required more than two times (
Q = 5.3 L/s) flow rate for the same momentum coefficient of 0.11%. To account for the required power (pneumatic or electrical) by the AFC actuators, another non-dimensional parameter (i.e., power coefficient) is used. The power coefficient,
Cπ, is associated to the power usage of an AFC system, and allows one to evaluate the efficiency of an AFC method in terms of power usage [
19,
27].
where
W is the power input to the AFC actuators. For the pneumatic actuators (steady blowing, steady suction, and fluidic oscillators), the AFC power input is proportional to the flow rate and the plenum pressure (i.e.,
W =
Q ×
Pact). On the other hand, the ZNMF actuators are made of voice-coils, and the electrical power input is proportional to the square of the input voltage and inversely proportional to the impedance of the voice coil (i.e.,
W =
V2/
R). The actuator with the lowest power coefficient at a given condition is considered to be the most efficient.
Figure 14b shows the efficiency of AFC actuators in reducing the pressure drag that was shown in
Figure 14a. Similar to the previous results, the steady suction is the most efficient AFC method when the actuator power input is considered. Steady suction has a logarithmic trend in reducing the pressure drag with respect to the power coefficient. Note that the power consumption of the vacuum pump was not included in the power calculations of the steady suction. Usually, generating steady suction requires a large vacuum pump that might be inefficient to install on a vehicle. The ZNMF actuators appear to be the least efficient. It should be noted that the ZNMF actuators used were designed to deliver high jet velocities over a wide frequency range without the need for cooling. The power efficiency was not the primary goal; therefore, a ZNMF actuator that is designed to minimize the power consumption may result in better efficiency. The steady suction is followed by the fluidic oscillators (SWJ) in terms of power efficiency. The fluidic oscillators’ power efficiency curve crosses the power efficiency curve of the steady suction near
Cπ = 1. By looking at the trend, the fluidic oscillators appear to be more efficient than the steady suction after the crossover power coefficient. The steady blowing also has a logarithmic trend with
Cπ, and its power coefficient is at least an order of magnitude larger than the steady suction.
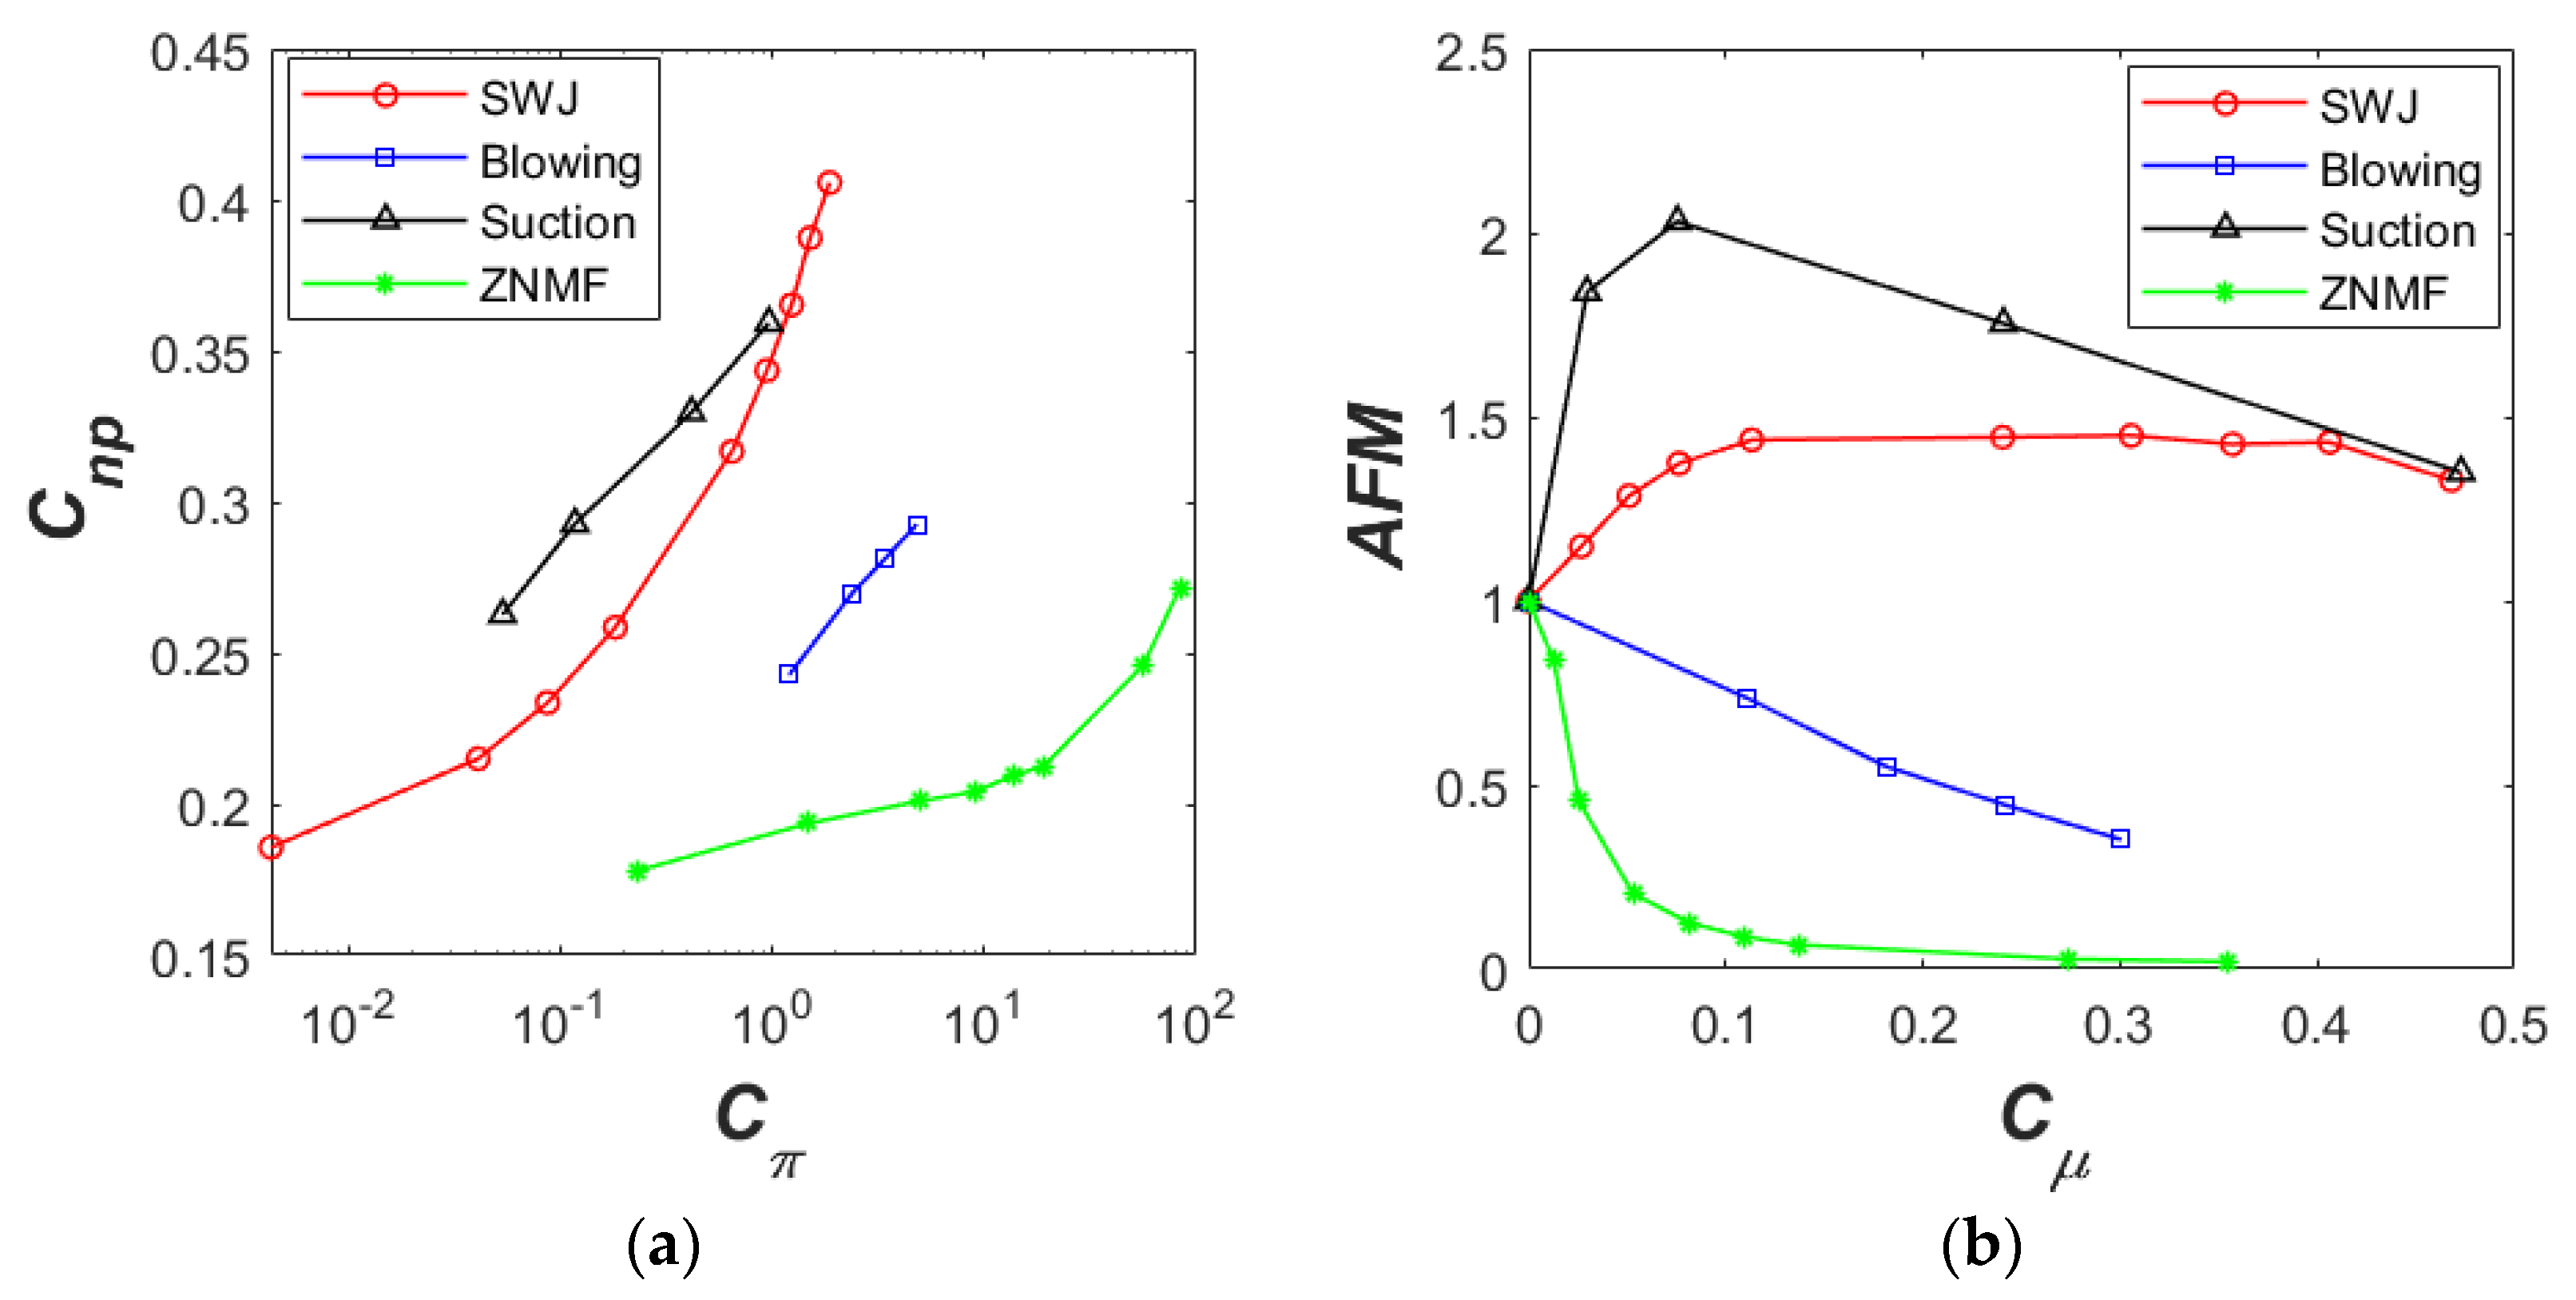
Similar conclusions can be drawn for the normal force coefficient when the actuator power usage is considered (
Figure 15a). The steady suction is the most efficient AFC method to generate a required normal force, closely followed by the fluidic oscillators (SWJ). The steady blowing requires about an order of magnitude more power than the fluidic oscillators or the steady suction. The ZNMF actuators are the least efficient AFC method. They require an order of magnitude more power than the steady blowing and about two orders of magnitude more power than that of the fluidic oscillators or steady suction.
The previous figures only looked at the actuator efficiency in terms of achieving a normal force coefficient or a pressure drag coefficient. Another quality metric is the aerodynamic figure of merit [
19,
28]. This metric is mostly used for three-dimensional models where the lift and drag coefficients are available. For our two-dimensional wall-mounted model, the normal force coefficient,
Cnp, can be perceived as the lift coefficient because the tunnel flow is parallel to the chord (i.e., angle of attack is zero). Note that
Cnp is slightly modified (see Equation (4)) to account for the pressure recovery effect too. On the other hand, we are only interested in the separation control (i.e., not in the viscous effects), so the pressure drag coefficient,
Cdp, can be perceived as the drag coefficient. The normal force, the pressure drag, and the power coefficients can be used to calculate the power efficiency of a wind tunnel model [
28]:
By comparing the power efficiency of the controlled flow to that of the baseline case, one can find the aerodynamic figure of merit (AFM):
AFM metric takes into account both the lift and drag coefficients as well as the actuator power input and indicates whether the AFC actuators have a net benefit when considering the power consumption. For a net benefit, AFM should be greater than one. Otherwise, it will lower the overall AFC system efficiency even though the AFC improves the lift or drag coefficients. As shown in
Figure 15b, AFM for the steady blowing is inversely proportional to the momentum coefficient and it is less than one for the entire range. Even though the steady blowing improves the flow field by controlling flow separation, the power requirement is more than its benefit; therefore, it does not provide a net benefit. The AFM of the ZNMF actuator is also less than one for the entire range. The AFM reduces exponentially with the momentum coefficient (AFM ~
e−Cμ) and quickly becomes a very small number (i.e., inefficient). For example for
Cµ = 0.11%, AFM is about 0.1 indicating an extremely inefficient AFC system even at low momentum coefficient. On the other hand, the fluidic oscillators (SWJ) provide a net benefit for the entire range tested in this study. AFM gradually increases with
Cµ until
Cµ = 0.11% reaching ~1.4. AFM stays at this level until
Cµ = 0.4% and saturates afterwards. Based on the trend, it is possible to deduce that the fluidic oscillators could have a net benefit as long as the flow inside the actuator is less than sonic conditions. Similar to the previous conclusions, the steady suction appears to be the most efficient AFC method especially for low momentum actuations. After reaching peak (AFM ~ 2), AFM is inversely proportional to
Cµ, providing a similar level AFM to the fluidic oscillators near
Cµ = 0.5%. By looking at the trend, it appears that the AFM of the steady suction breaks even (AFM = 1) near
Cµ = 0.8%. After this point, it does not provide a net benefit, meaning the power consumption of the actuator is more than its flow control improvement. For example, Greenblatt et al. [
14] tested the steady suction for high momentum case (
Cµ = 2.58%) to achieve an attached flow. For this case, the flow separation was almost eliminated reaching a
Cdp close to zero (
Cdp = 0.007). However, the calculated AFM is 0.27 (i.e., less than one), indicating that the elimination of flow separation on the hump model with steady suction is very inefficient.


