Time–Scale Relationship between Securitized Real Estate and Local Stock Markets: Some Wavelet Evidence


Abstract
:1. Introduction
2. Research Methods
2.1. The Essence of Wavelet Analysis
2.2. Wavelet-Based Modelling
3. Sample and Data
4. Empirical Results
4.1. Time-Scale Decomposed Returns
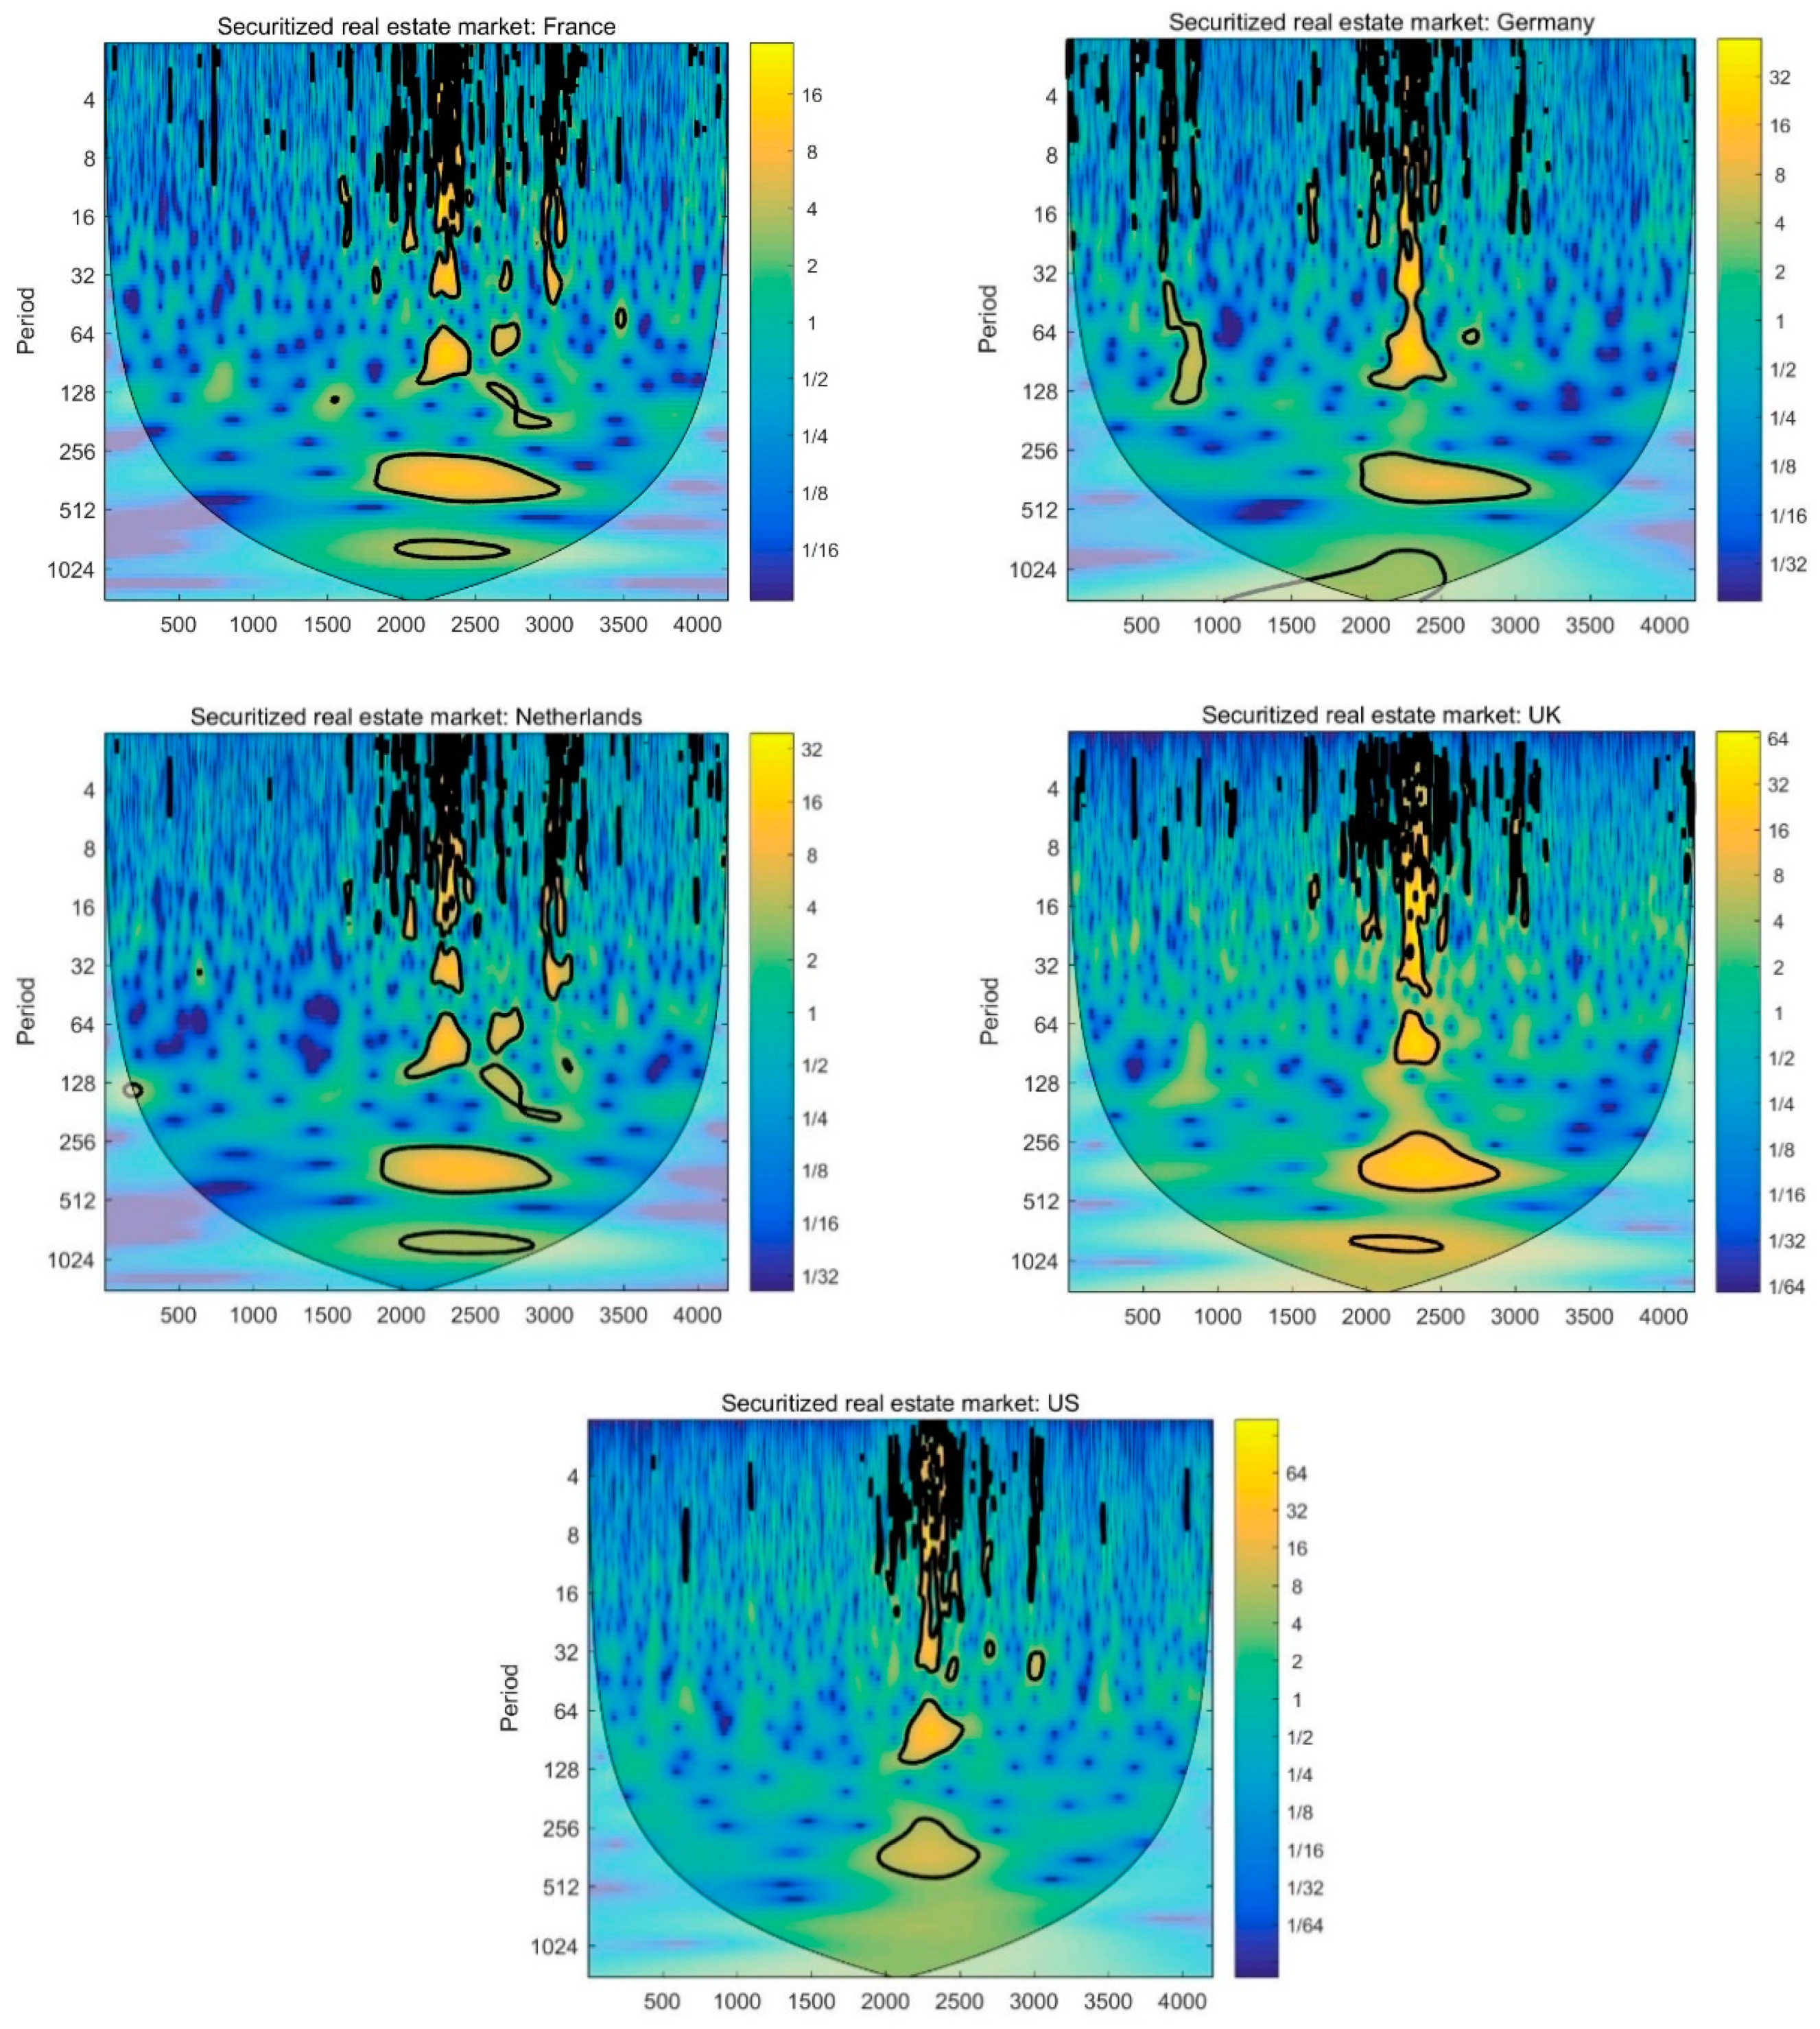
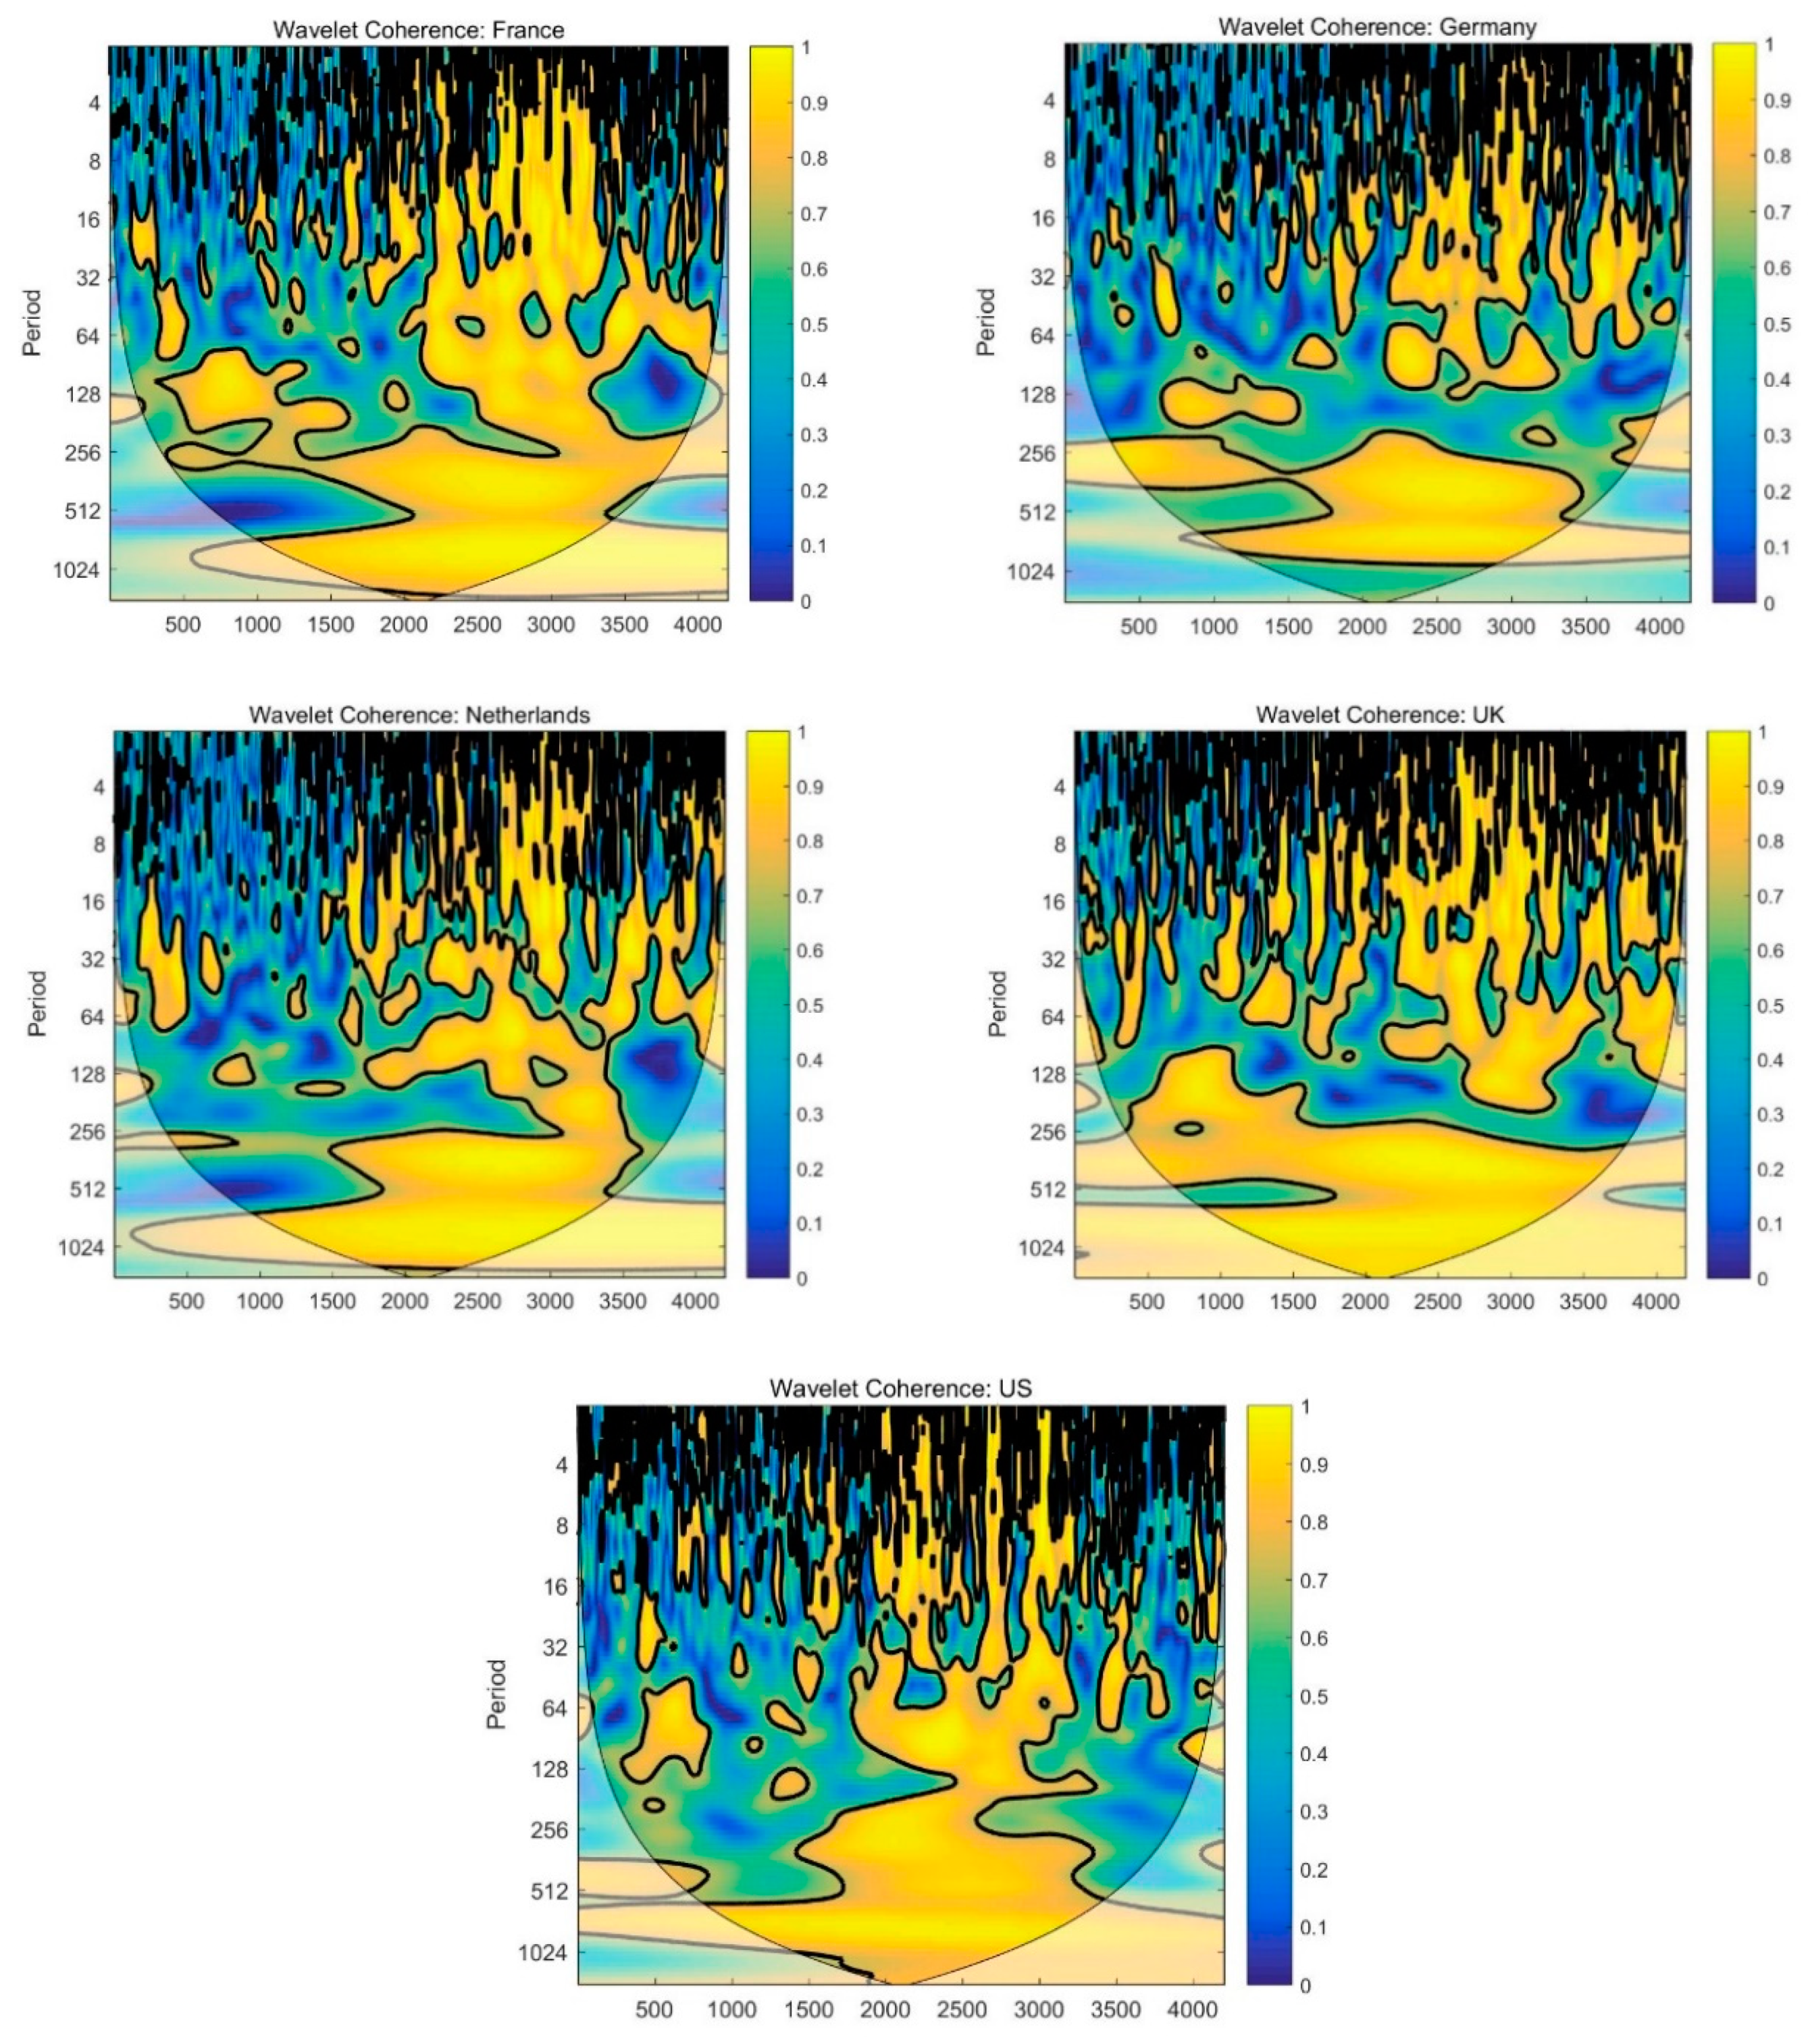
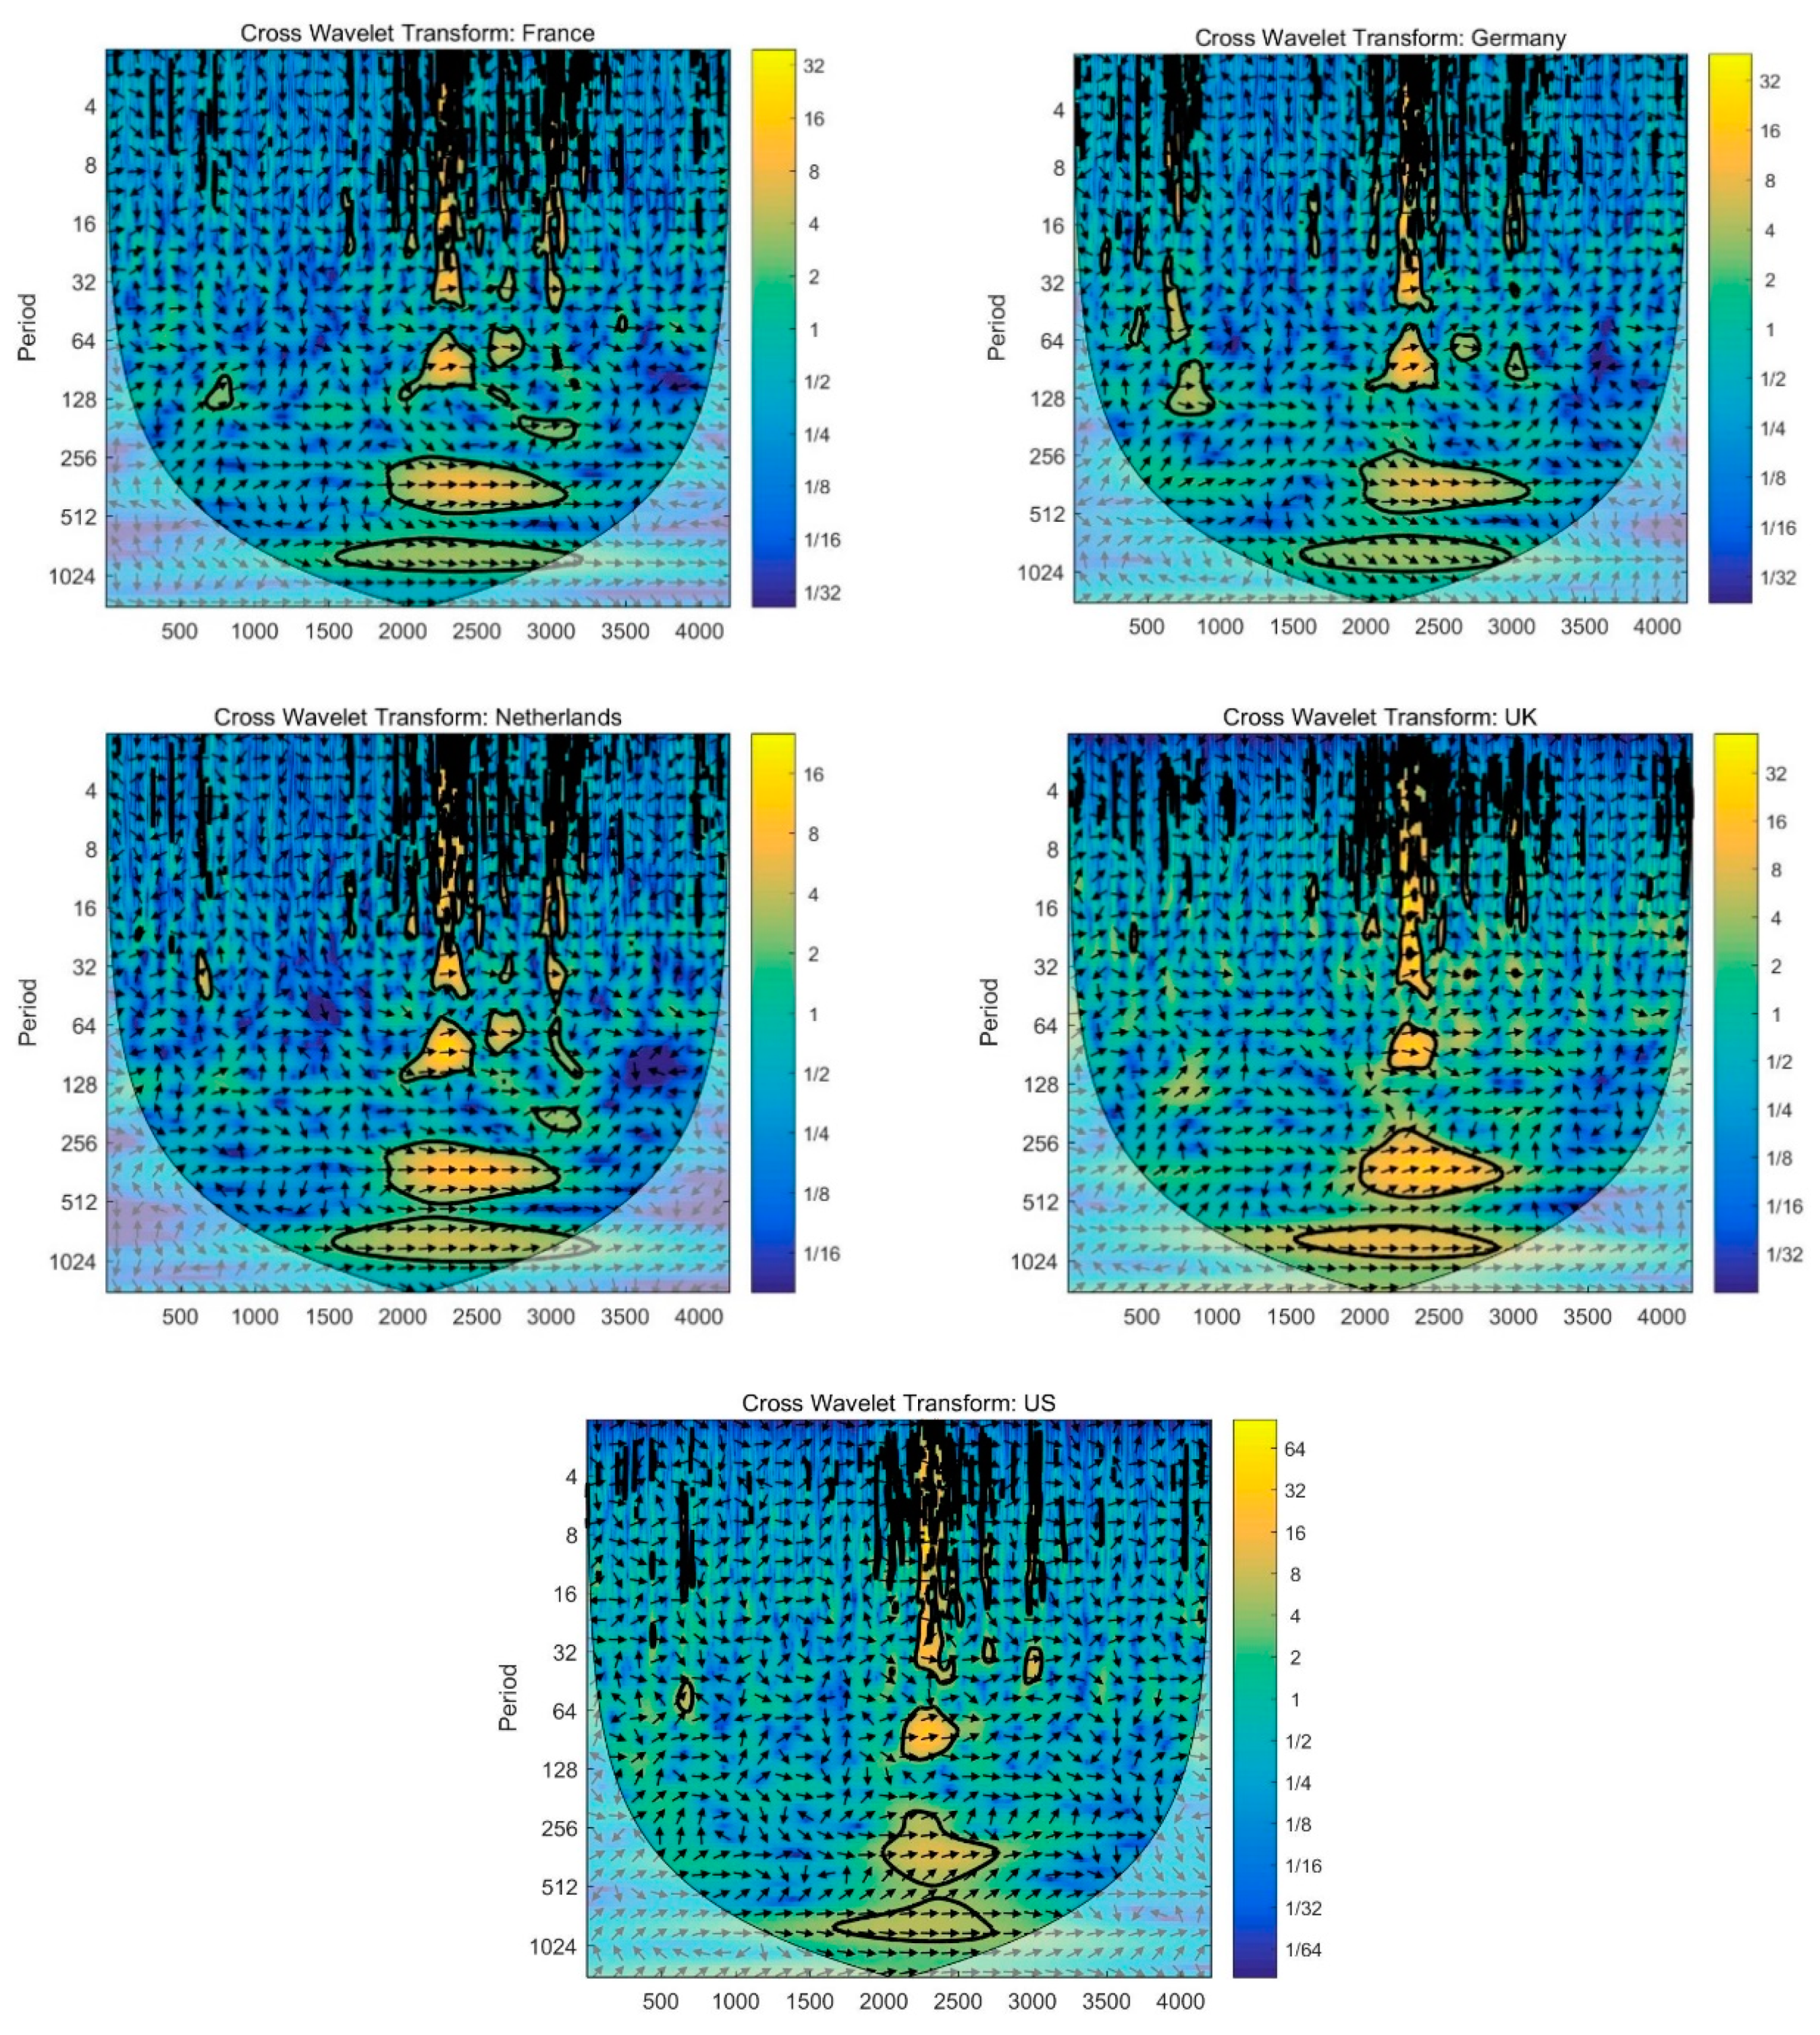
4.2. CWT: Wavelet Power Spectrum, Cross Wavelet Power Spectrum, and Wavelet Coherency
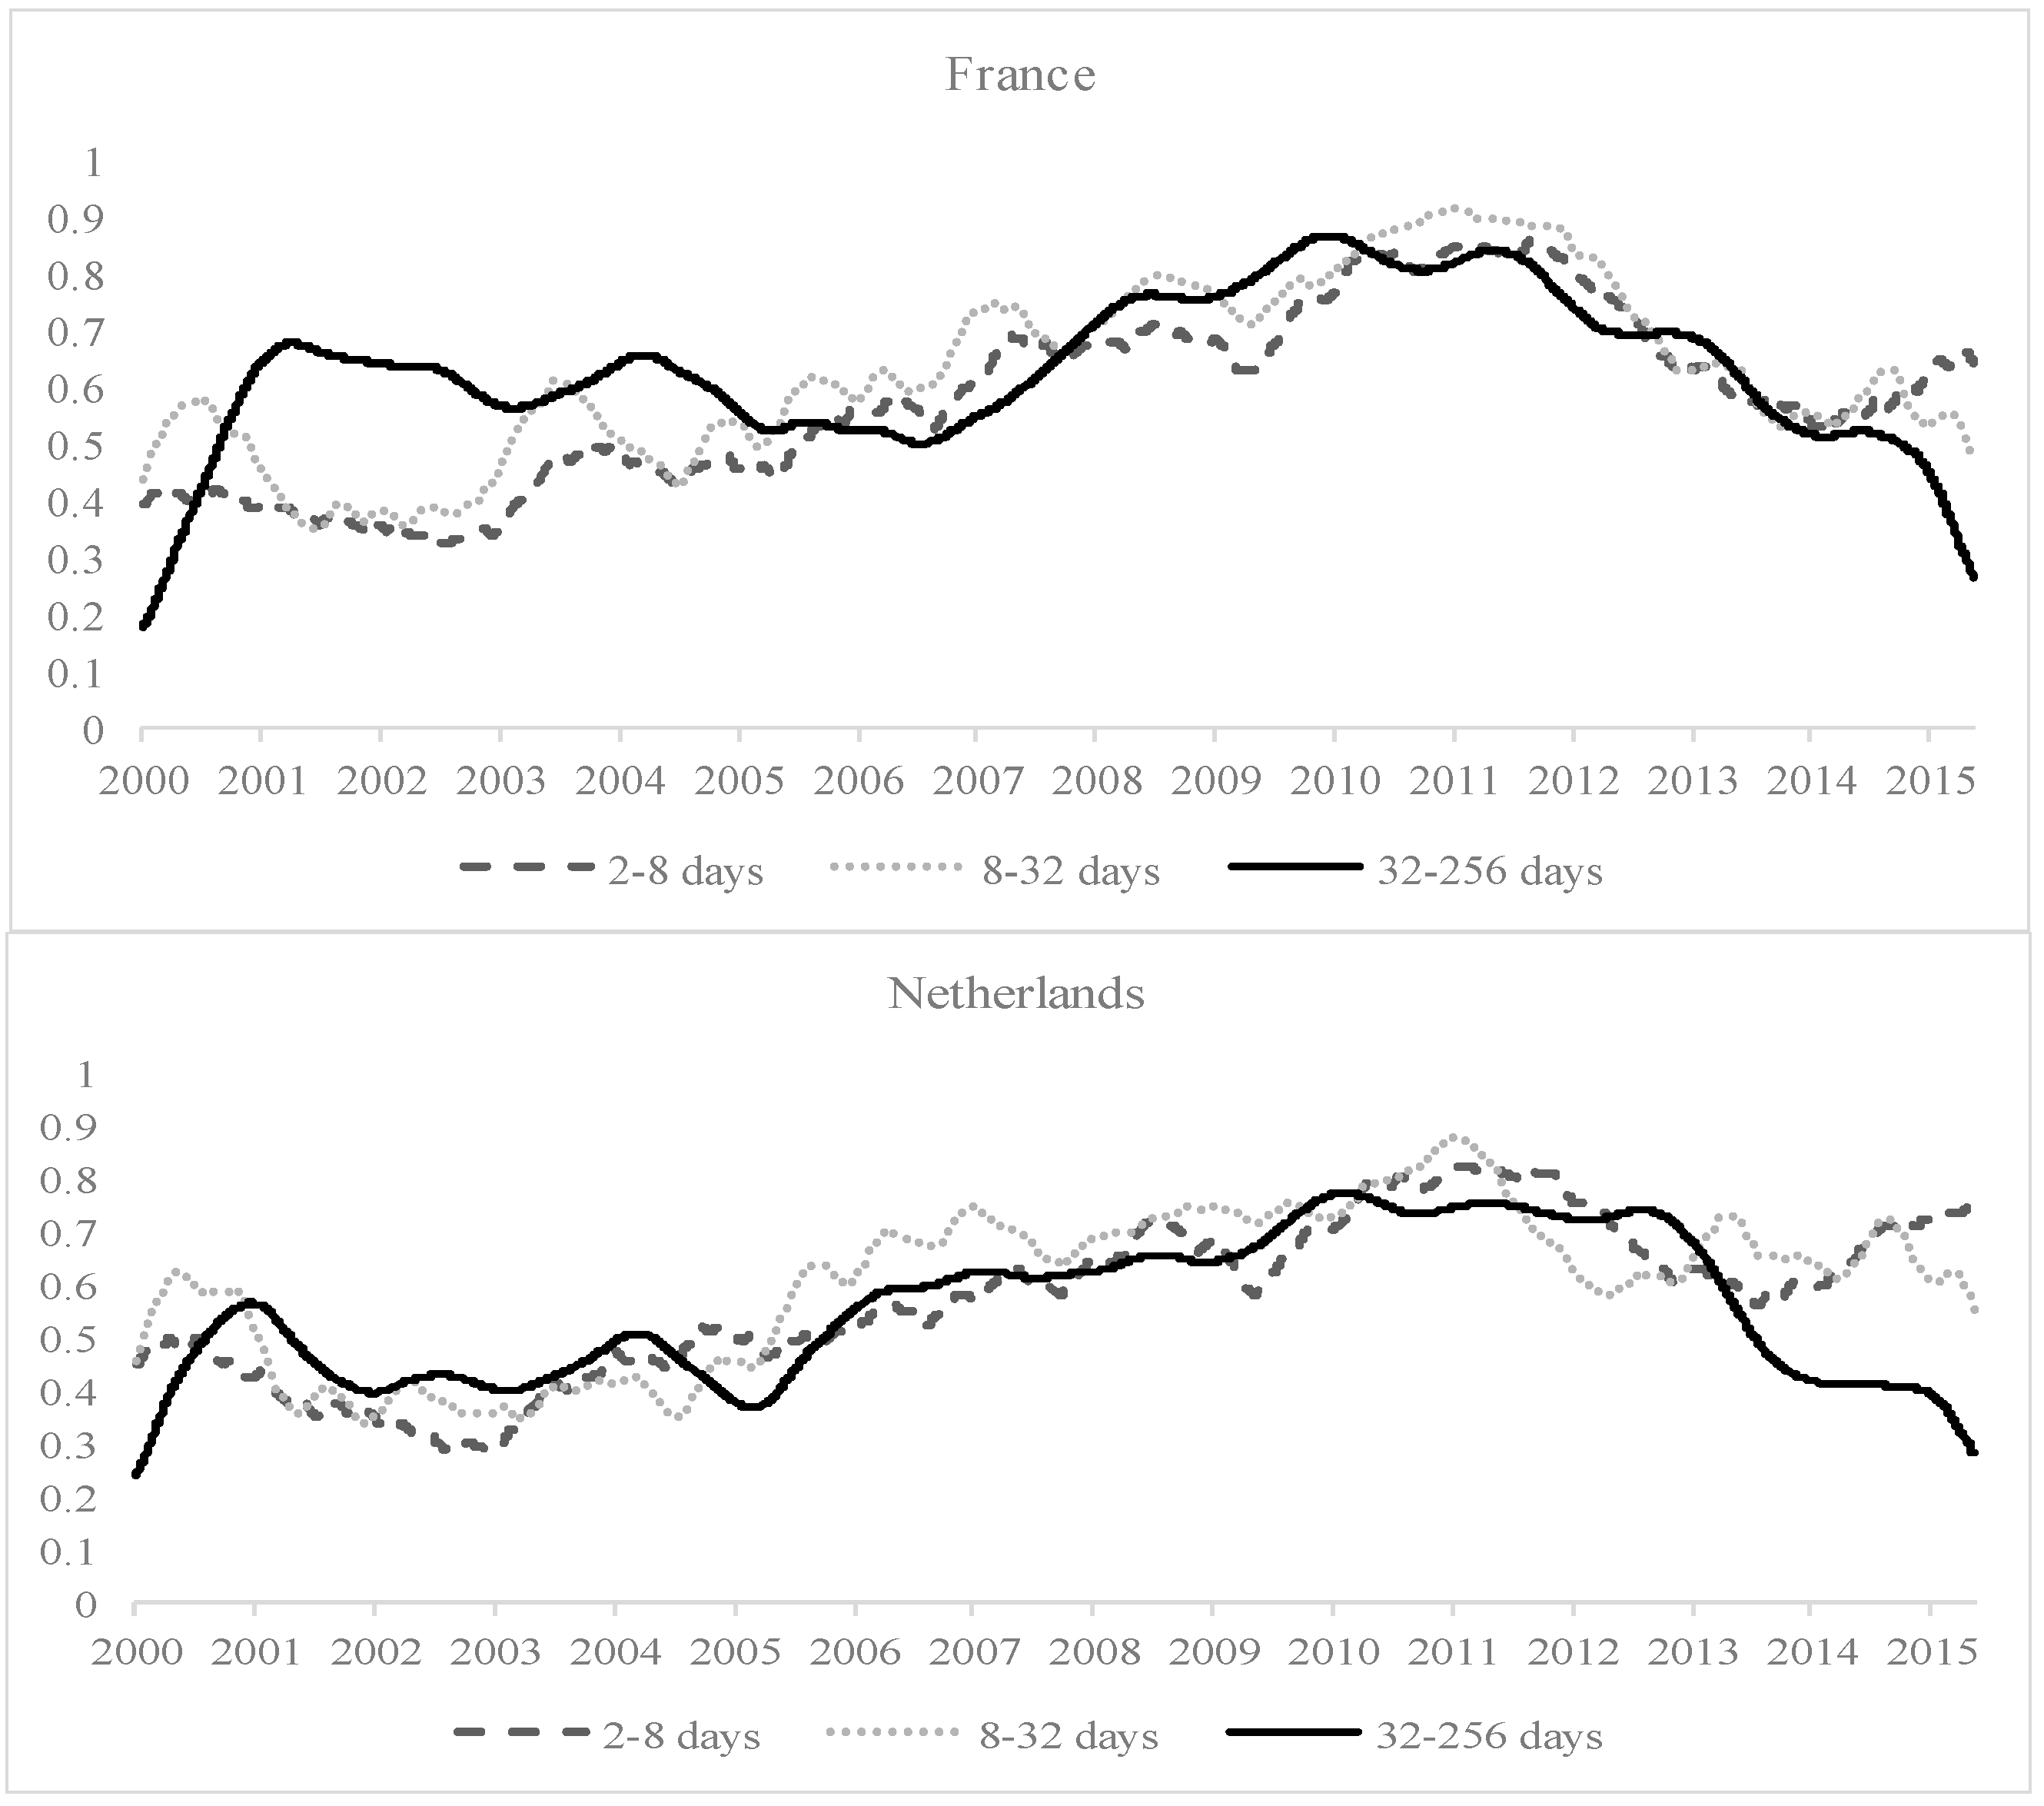
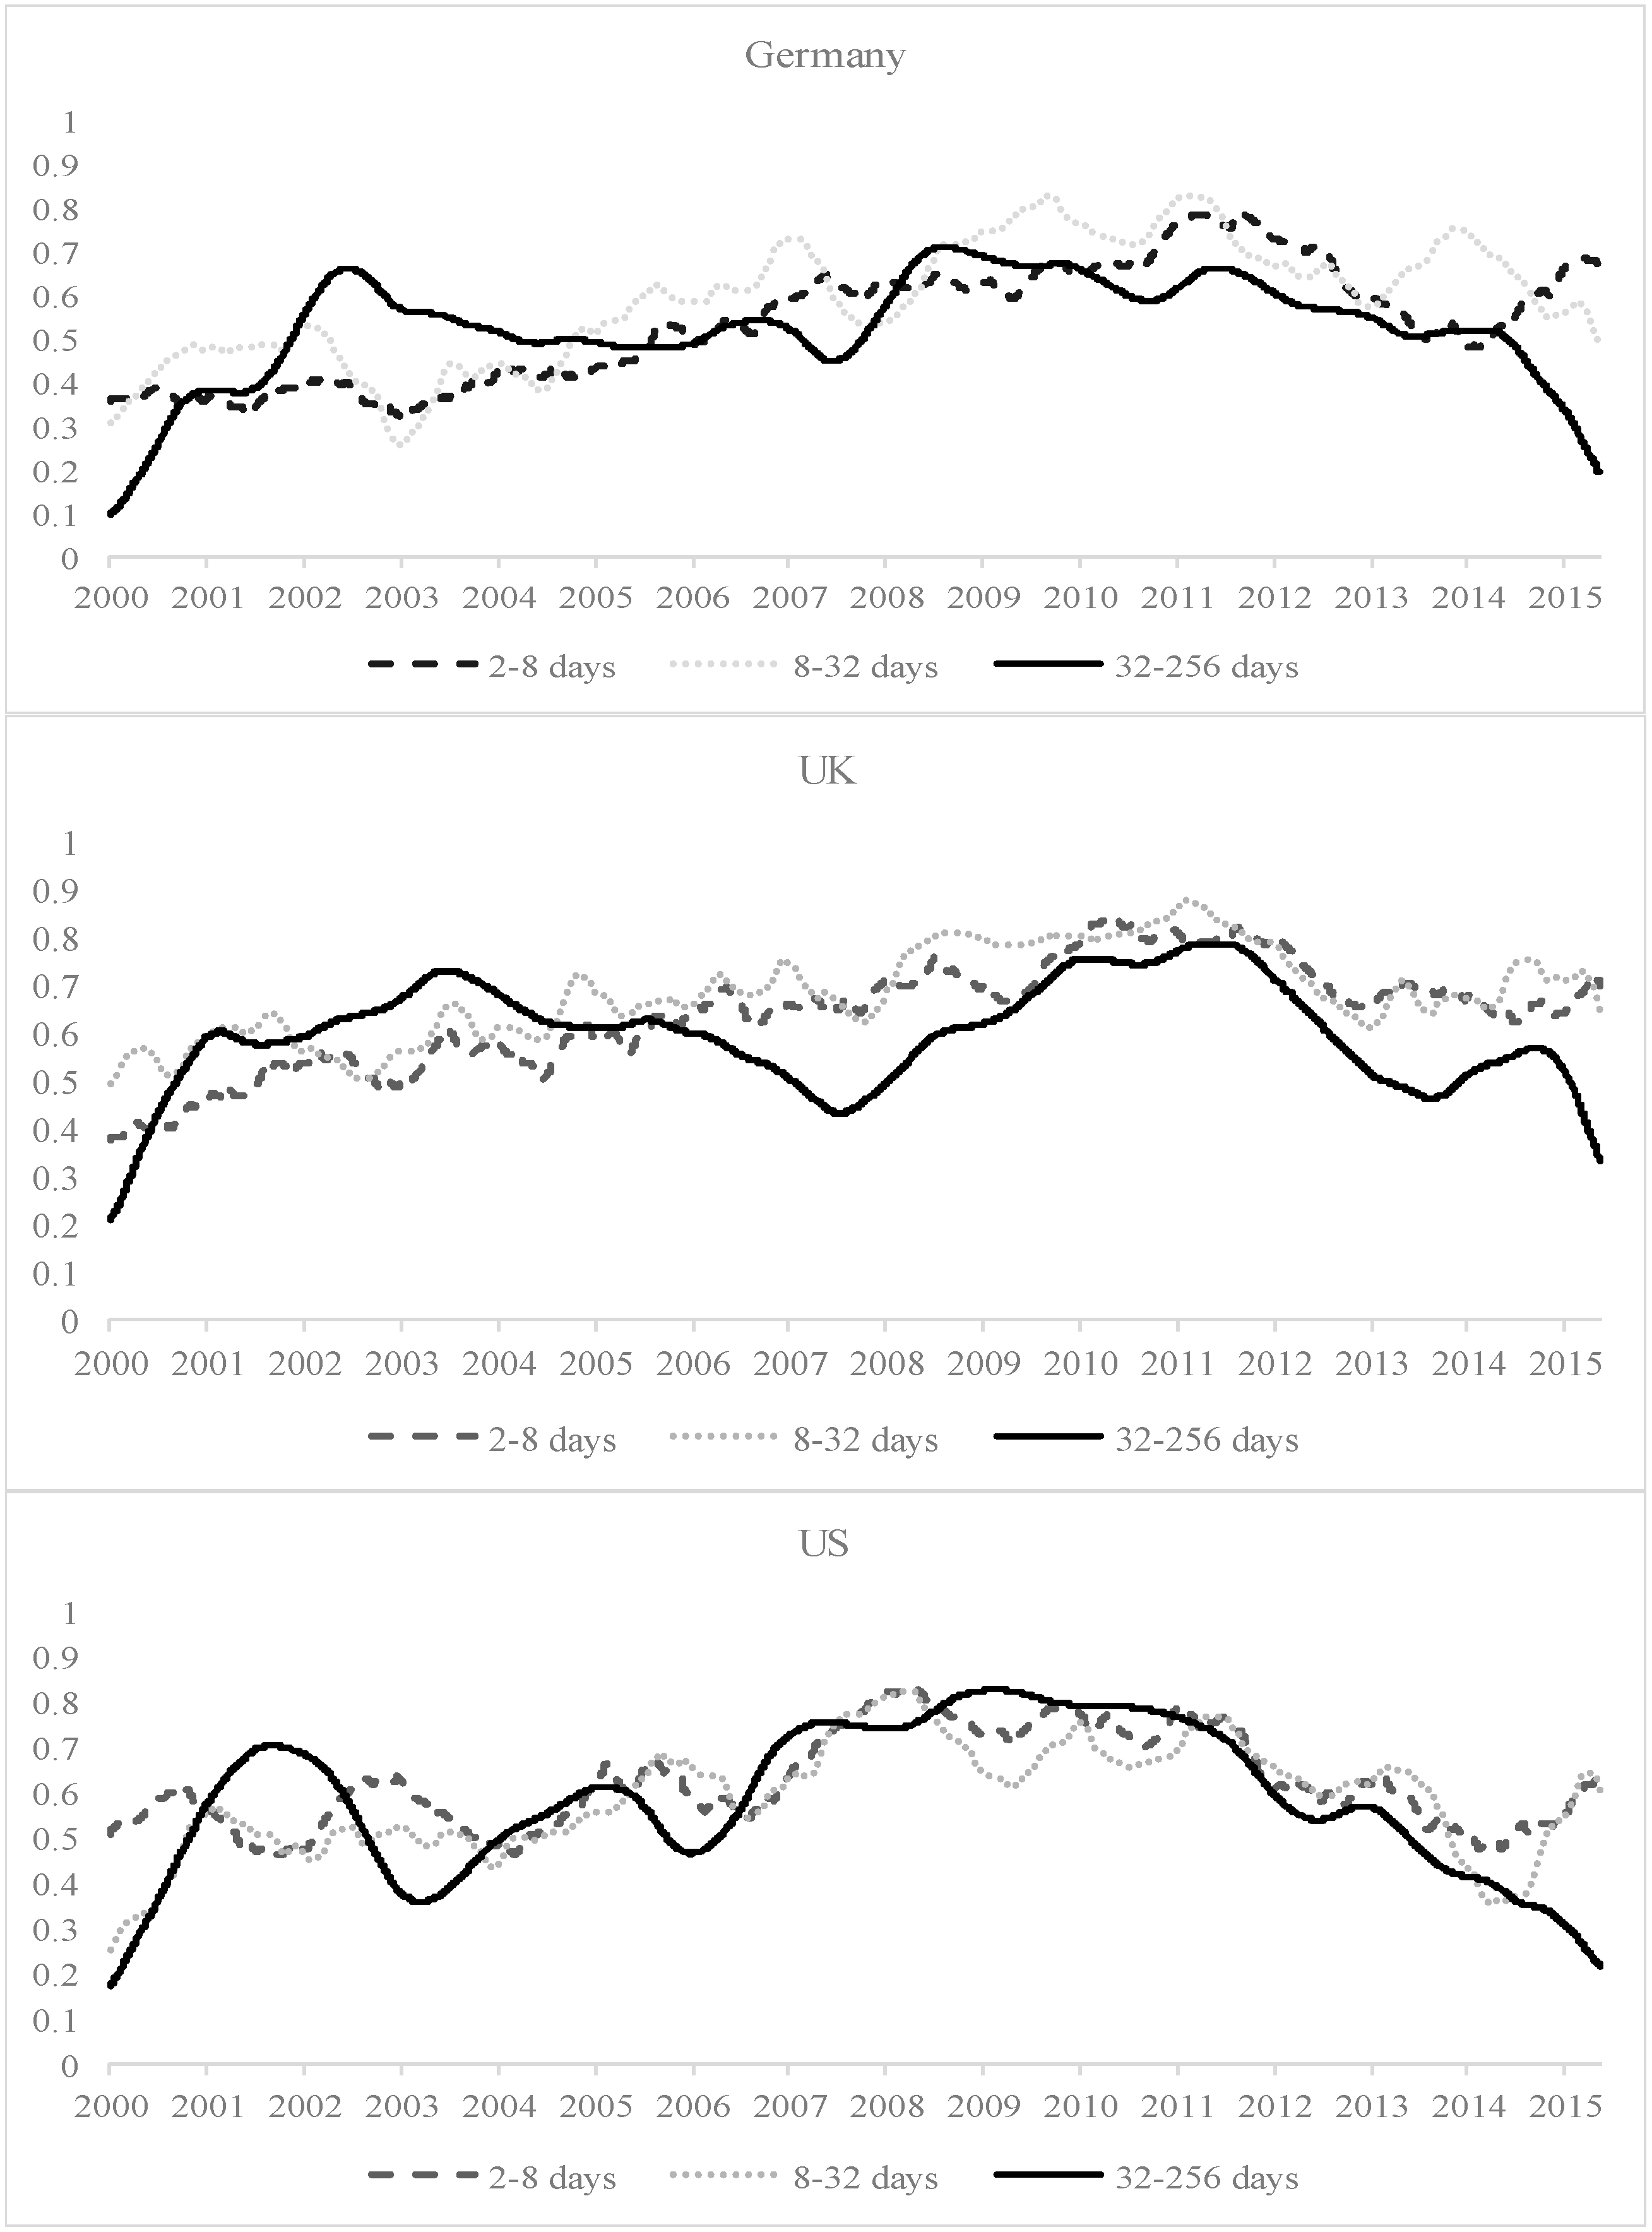
4.3. CWT: PTV and Rolling PTV Analysis
4.4. Contagion Across Real Estates and Local Stock Markets
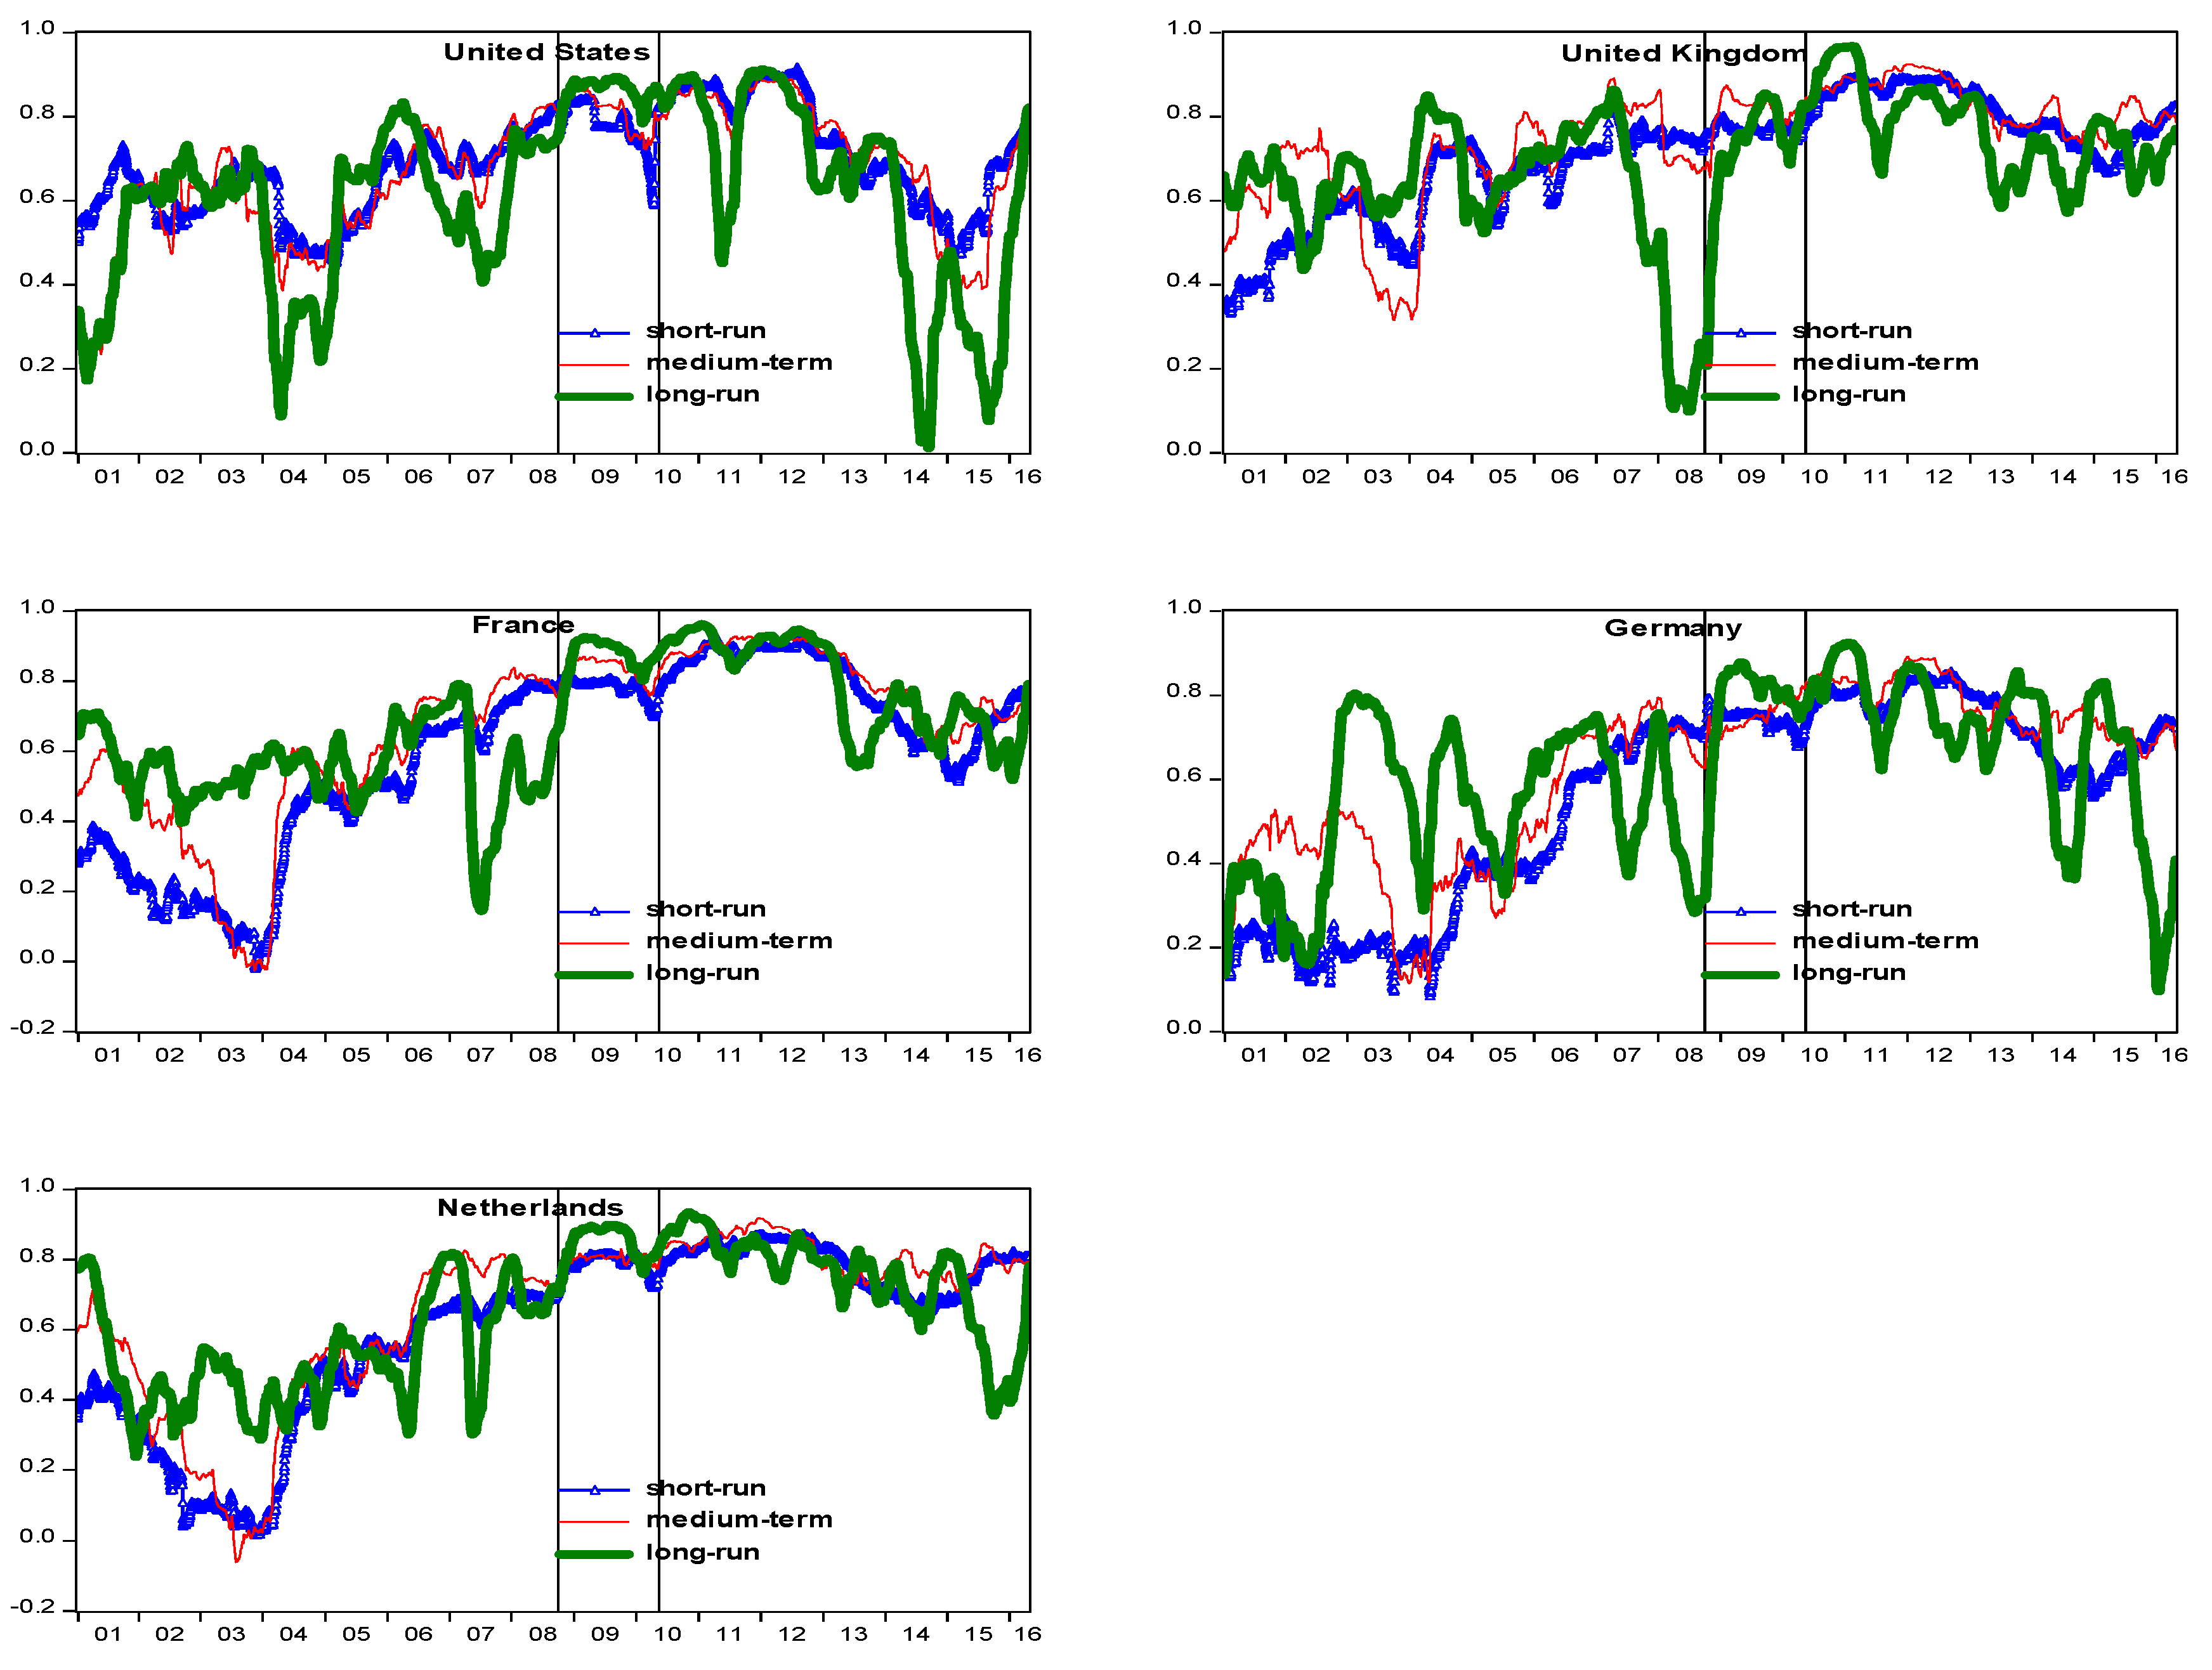
4.5. Wavelet-Based Multi-Resolution Asymmetric Dynamic Conditional Correlation (ADCC)-GARCH Model
5. Conclusions
Author Contributions
Funding
Acknowledgments
Conflicts of Interest
References
- Aguiar-Conraria, Luís, Nuno Azevedo, and Maria Joana Soares. 2008. Using wavelets to decompose the time–frequency effects of monetary policy. Physica A: Statistical mechanics and its Applications 387: 2863–78. [Google Scholar] [CrossRef]
- Ambrose, Brent W., Esther Ancel, and Mark D. Griffiths. 1992. The fractal structure of real estate investment trust returns: The search for evidence of market segmentation and nonlinear dependency. Real Estate Economics 20: 25–54. [Google Scholar] [CrossRef]
- Bond, Shaun A., G. Andrew Karolyi, and Anthony B. Sanders. 2003. International real estate returns: A multifactor, multi-country approach. Real Estate Economics 31: 481–500. [Google Scholar] [CrossRef]
- Cappiello, Lorenzo, Robert F. Engle, and Kevin Sheppard. 2006. Asymmetric dynamics in the correlations of global equity and bond returns. Journal of Financial Econometrics 4: 537–72. [Google Scholar] [CrossRef]
- Daubechies, Ingrid. 1992. Ten Lectures on Wavelets. Philadelphia: Society for Industrial and Applied Mathematics, pp. 198–202. [Google Scholar]
- Deora, Rahul, and Duc Khuong Nguyen. 2013. Time-scale co-movement between the Indian and world stock markets. Journal of Applied Business Research 29: 765–76. [Google Scholar] [CrossRef]
- Dewandaru, Ginanjar, Rumi Masih, and A. Mansur M. Masih. 2016. Contagion and interdependence across Asia-Pacific equity markets: An analysis based on multi-horizon discrete and continuous wavelet transformations. International Review of Economics & Finance 43: 363–77. [Google Scholar]
- Dima, B., Ş. M. Dima, and Flavia Barna. 2015. A wavelet analysis of capital markets’ integration in Latin America. Applied Economics 47: 1019–36. [Google Scholar] [CrossRef]
- Dornbusch, Rudiger, Yung Chul Park, and Stijn Claessens. 2000. Contagion: Understanding how it spreads. The World Bank Research Observer 15: 177–97. [Google Scholar] [CrossRef]
- Eichholtz, Piet M. A. 1996. Does international diversification work better for real estate than for stocks and bonds. Financial Analysts Journal 52: 56–62. [Google Scholar] [CrossRef]
- Engle, Robert. 2002. Dynamic conditional correlation: A simple class of multivariate generalized autoregressive conditional heteroskedasticity models. Journal of Business & Economic Statistics 20: 339–50. [Google Scholar]
- Grinsted, Aslak, John C. Moore, and Svetlana Jevrejeva. 2004. Application of the cross-wavelet transform and wavelet coherence to geophysical time series. Nonlinear Processes in Geophysics 11: 561–66. [Google Scholar] [CrossRef]
- Hoesli, Martin, and Elias Oikarinen. 2012. Are REITs real estate? Evidence from international sector level data. Journal of International Money and Finance 31: 1823–50. [Google Scholar] [CrossRef]
- Hoesli, Martin, and Kustrim Reka. 2015. Contagion channels between real estate and financial markets. Real Estate Economics 43: 101–38. [Google Scholar] [CrossRef]
- Huang, Shian-Chang. 2011. Wavelet-based multi-resolution GARCH model for financial spillover effects. Mathematics and Computers in Simulation 81: 2529–39. [Google Scholar] [CrossRef]
- Hui, Eddie C. M., and Ka Kwan Kevin Chan. 2013. The European sovereign debt crisis: Contagion across European real estate markets. Journal of Property Research 30: 87–102. [Google Scholar] [CrossRef]
- Hui, Eddie C. M., and Ka Kwan Kevin Chan. 2016. Is there any contagion among major equity and securitized real estate markets? Analysis from a new perspective. Journal of Real Estate Finance and Economics 56: 1–20. [Google Scholar] [CrossRef]
- Jammazi, Rania. 2012. Oil shock transmission to stock market returns: Wavelet-multivariate Markov switching GARCH approach. Energy 37: 430–54. [Google Scholar] [CrossRef]
- Kaminsky, Graciela L., and Carmen M. Reinhart. 2000. On crises, contagion, and confusion. Journal of international Economics 51: 145–68. [Google Scholar] [CrossRef]
- Khalfaoui, Rabeh, M. Boutahar, and H. Boubaker. 2015. Analyzing volatility spillovers and hedging between oil and stock markets: Evidence from wavelet analysis. Energy Economics 49: 540–49. [Google Scholar] [CrossRef]
- Lee, Hahn Shik. 2004. Price and volatility spillovers in stock markets: A wavelet analysis. Applied Economics Letters 11: 197–201. [Google Scholar]
- Li, Xiao-Lin, Tsangyao Chang, Stephen M. Miller, Mehmet Balcilar, and Rangan Gupta. 2015. The co-movement and causality between the US housing and stock markets in the time and frequency domains. International Review of Economics & Finance 38: 220–33. [Google Scholar]
- Ling, David C., and Andy Naranjo. 1999. The integration of commercial real estate markets and stock markets. Real Estate Economics 27: 483–515. [Google Scholar] [CrossRef]
- Ling, David C., and Andy Naranjo. 2002. Commercial real estate return performance: A cross-country analysis. Journal of Real Estate Finance and Economics 24: 119–42. [Google Scholar] [CrossRef]
- Liow, Hiang Kim. 2012. Co-movements and correlations across Asian securitized real estate and stock markets. Real Estate Economics 40: 97–129. [Google Scholar] [CrossRef]
- Liow, Kim Hiang, and Felix Schindler. 2011. An Assessment of the Relationship between Public Real Estate Markets and Stock Markets at the Local, Regional, and Global Levels. ZEW-Centre for European Economic Research Discussion Paper, No. 11-056. Berlin: ZEW-Centre for European Economic Research. [Google Scholar]
- Liow, KimHiang, Xiaoxia Zhou, Qiang Li, and Yuting Huang. 2018a. Co-movement of Greater China real estate markets: Some time-scale evidence. Journal of Real Estate Research. forthcoming. [Google Scholar]
- Liow, KimHiang, Xiaoxia Zhou, Qiang Li, and Yuting Huang. 2018b. Dynamic interdependence between the US and the securitized real estate markets of the Asian-Pacific economies. Journal of Property Investment and Finance. forthcoming. [Google Scholar] [CrossRef]
- Liu, Crocker H., David J. Hartzell, Wylie Greig, and Terry V. Grissom. 1990. The integration of the real estate market and the stock market: Some preliminary evidence. Journal of Real Estate Finance and Economics 3: 26. [Google Scholar] [CrossRef]
- Liu, Xueyong, Haizhong An, Shupei Huang, and Shaobo Wen. 2017. The evolution of spillover effects between oil and stock markets across multi-scales using a wavelet based GARCH-BEKK model. Physica A 465: 374–83. [Google Scholar] [CrossRef]
- Lizieri, Colin, and Stephen Satchell. 1997. Interactions between property and equity markets: An investigation of linkages in the United Kingdom 1972–1992. Journal of Real Estate Finance and Economics 15: 11–26. [Google Scholar] [CrossRef]
- Loh, Lixia. 2013. Co-movement of Asia-Pacific with European and US stock market returns: A cross-time-frequency analysis. Research in International Business and Finance 29: 1–13. [Google Scholar] [CrossRef]
- Mallat, Stephane G. 1989. A theory for multiresolution signal decomposition: The wavelet representation. IEEE Transactions on Pattern Analysis and Machine Intelligence 11: 674–93. [Google Scholar] [CrossRef]
- Markowitz, Harry. 1952. Portfolio selection. The Journal of Finance 7: 77–91. [Google Scholar]
- Michayluk, David, Patrick J. Wilson, and Ralf Zurbruegg. 2006. Asymmetric volatility, correlation and returns dynamics between the US and UK securitized real estate markets. Real Estate Economics 34: 109–31. [Google Scholar] [CrossRef]
- Morawski, Jaroslaw, Heinz Rehkugler, and Roland Füss. 2008. The nature of listed real estate companies: Property or equity market? Financial Markets and Portfolio Management 22: 101–26. [Google Scholar] [CrossRef]
- Okunev, John, and Patrick J. Wilson. 1997. Using nonlinear tests to examine integration between real estate and stock markets. Real Estate Economics 25: 487–503. [Google Scholar] [CrossRef]
- Okunev, John, Patrick Wilson, and Ralf Zurbruegg. 2000. The causal relationship between real estate and stock markets. Journal of Real Estate Finance and Economics 21: 251–61. [Google Scholar] [CrossRef]
- Quan, Daniel C., and Sheridan Titman. 1999. Do real estate prices and stock prices move together? An international analysis. Real Estate Economics 27: 183–207. [Google Scholar] [CrossRef]
- Ramsey, James B. 2002. Wavelets in economics and finance: Past and future. Studies in Nonlinear Dynamics & Econometrics 6: 1–27. [Google Scholar]
- Ranta, Mikko. 2013. Contagion among major world markets: A wavelet approach. International Journal of Managerial Finance 9: 133–49. [Google Scholar] [CrossRef]
- Rua, António, and Luís C. Nunes. 2009. International co-movement of stock market returns: A wavelet analysis. Journal of Empirical Finance 16: 632–39. [Google Scholar] [CrossRef]
- Schindler, Felix. 2011. Long-term benefits from investing in international securitized real estate. International Real Estate Review 14: 27–60. [Google Scholar]
- Tiwari, Aviral Kumar, Mihai Ioan Mutascu, and Claudiu Tiberiu Albulescu. 2016. Continuous wavelet transform and rolling correlation of European stock markets. International Review of Economics & Finance 42: 237–56. [Google Scholar]
- Torrence, Christopher, and Peter J. Webster. 1999. Interdecadal changes in the ENSO-monsoon system. Journal of Climate 12: 2679–90. [Google Scholar] [CrossRef]
- Yunus, Nafeesa, J. Andrew Hansz, and Paul J. Kennedy. 2012. Dynamic interactions between private and public real estate markets: Some international evidence. Journal of Real Estate Finance and Economics 45: 1021–40. [Google Scholar] [CrossRef]
- Zhou, Jian. 2010. Co-movement of international real estate securities returns: A wavelet analysis. Journal of Property Research 27: 357–73. [Google Scholar] [CrossRef]
- Zhou, Jian. 2012. Multiscale analysis of international linkages of REIT returns and volatilities. Journal of Real Estate Finance and Economics 45: 1062–87. [Google Scholar] [CrossRef]
| 1 | Interested readers, please consult various source references for the mathematical functions. |
| 2 | After experimenting with Daubechies LA (8) and Haar filters, the latter was chosen in the MODWT. It is the simplest of all wavelet filters and avoids the boundary problem of filtering. Moreover, the choice of the length of the window is not straightforward, since a longer window implies the loss of time information, and a shorter window implies the loss of frequency information. Ranta (2013) find that calculations using different DWT filters produce very similar results. In this study, we use the 250-day window (one year trading) as the base case, with the 125 days and 500 days used to test the robustness of the results. |
| 3 | Interested readers, please consult Cappiello et al. (2006) for the relevant mathematical details. Empirically, the model can be estimated using RATS or Ox metrics software packages. |
| 4 | The analysis of real estate and stock market returns may need to control for the fact that the real estate securities are embedded in the country specific stock indexes. Whilst this may be probably needed for some Asian markets, such as Japan, Hong Kong, and Singapore, where real estate firms represent a sizeable portion of the overall market valuation, this is probably not that much of a concern for the US and four other European markets in our sample where securitized real estate is a relatively small part of the overall market index. Thus, examining the connection between public real estate and the overall stock market has the flavor of regressing a dependent variable on itself. |
| 5 | The stock market plots are not shown to conserve space. |
| 6 | We inspect another two rolling wavelet correlation series using windows of 125 days and 500 days respectively (the plots are not displayed to conserve space). Although the rising correlation trends of 125-days are quite similar with those using the 250-day windows, the co-movement patterns are more volatile for the 500-day windows. However, the chosen filter (the Haar filter) and the window sizes do not appear to have any significant effect on the results. |
| 7 | |
| 8 | The corresponding correlation and t-test results are not presented to conserve space. |


| Real Estate Returns (RE) | |||||
| REFR | REGE | RENE | REUK | REUS | |
| Mean | 0.00036 | 0.00001 | 0.00011 | 0.00018 | 0.00045 |
| Median | 0.00084 | 0.00026 | 0.00060 | 0.00099 | 0.00165 |
| Maximum | 0.09329 | 0.14111 | 0.09014 | 0.15391 | 0.32583 |
| Minimum | −0.10357 | −0.14563 | −0.08610 | −0.16445 | −0.32277 |
| Std. Dev. | 0.01555 | 0.01805 | 0.01506 | 0.02286 | 0.02511 |
| Skewness | −0.12634 | −0.03566 | −0.22948 | −0.44756 | −0.31375 |
| Kurtosis | 7.04311 | 10.25292 | 7.21583 | 9.34468 | 30.22439 |
| Jarque-Bera | 2874.59 | 9215.50 | 3150.17 | 7191.67 | 129,896.80 |
| Probability | 0 | 0 | 0 | 0 | 0 |
| Stock Retruns (ST) | |||||
| STFR | STGE | STNE | STUK | STUS | |
| Mean | 0.00002 | 0.00005 | −0.00003 | −0.00010 | 0.00014 |
| Median | 0.00045 | 0.00058 | 0.00031 | 0.00057 | 0.00086 |
| Maximum | 0.11890 | 0.11654 | 0.10577 | 0.14800 | 0.12332 |
| Minimum | −0.11684 | −0.09723 | −0.11362 | −0.14699 | −0.13310 |
| Std. Dev. | 0.01605 | 0.01649 | 0.01591 | 0.01950 | 0.01689 |
| Skewness | −0.01915 | −0.06913 | −0.10200 | −0.28101 | −0.39447 |
| Kurtosis | 8.87680 | 7.38654 | 8.61356 | 9.42605 | 8.69940 |
| Jarque-Bera | 6049.95 | 3373.86 | 5527.15 | 7288.69 | 5799.00 |
| Probability | 0 | 0 | 0 | 0 | 0 |
| Panel A: Public Real Estate Markets | |||||||||
| Real Estate | Time Scales | I | II | III | IV | V | VI | VII | VIII |
| FR | Mean | −1.53 × 10⁻¹⁹ | −6.02 × 10⁻²⁰ | −4.55 × 10⁻²⁰ | 1.47 × 10⁻¹⁹ | −1.65 × 10⁻²⁰ | 1.02 × 10⁻²⁰ | −1.37 × 10⁻²¹ | 5.23 × 10⁻²⁰ |
| SD | 0.0102 | 0.0068 | 0.0050 | 0.0031 | 0.0021 | 0.0017 | 0.0011 | 0.0012 | |
| GE | Mean | 5.05 × 10⁻¹⁹ | 3.70 × 10⁻²⁰ | 7.81 × 10⁻²⁰ | 1.32 × 10⁻¹⁹ | 4.79 × 10⁻²⁰ | 6.25 × 10⁻²⁰ | −3.16 × 10⁻²⁰ | −9.52 × 10⁻²⁰ |
| SD | 0.0117 | 0.0079 | 0.0058 | 0.0038 | 0.0026 | 0.0024 | 0.0012 | 0.0013 | |
| NE | Mean | 1.37 × 10⁻¹⁹ | −2.03 × 10⁻²⁰ | 7.49 × 10⁻²⁰ | 3.40 × 10⁻²⁰ | −2.34 × 10⁻²⁰ | 7.86 × 10⁻²⁰ | 1.19 × 10⁻²⁰ | 1.22 × 10⁻¹⁹ |
| SD | 0.0098 | 0.0065 | 0.0051 | 0.0032 | 0.0021 | 0.0017 | 0.0011 | 0.0011 | |
| UK | Mean | −1.52 × 10⁻¹⁹ | 1.31 × 10⁻¹⁹ | 2.40 × 10⁻¹⁹ | 2.90 × 10⁻¹⁹ | −1.73 × 10⁻¹⁹ | 2.07 × 10⁻¹⁹ | 2.62 × 10⁻²⁰ | 1.08 × 10⁻¹⁹ |
| SD | 0.0085 | 0.0110 | 0.0099 | 0.0071 | 0.0041 | 0.0036 | 0.0018 | 0.0026 | |
| US | Mean | 1.61 × 10⁻¹⁹ | −4.78 × 10⁻¹⁹ | −8.68 × 10⁻²⁰ | 1.16 × 10⁻¹⁹ | −1.49 × 10⁻¹⁹ | 1.58 × 10⁻¹⁹ | 1.16 × 10⁻¹⁹ | 3.73 × 10⁻²⁰ |
| SD | 0.0121 | 0.0122 | 0.0099 | 0.0056 | 0.0041 | 0.0037 | 0.0016 | 0.0018 | |
| Panel B: Stock Markets | |||||||||
| FR | Mean | 6.92 × 10⁻²⁰ | 3.40 × 10⁻¹⁹ | 2.80 × 10⁻²⁰ | −5.09 × 10⁻²⁰ | −1.03 × 10⁻¹⁹ | 3.04 × 10⁻²⁰ | 3.89 × 10⁻²⁰ | −9.28 × 10⁻²⁰ |
| SD | 0.0108 | 0.0071 | 0.0048 | 0.0031 | 0.0020 | 0.0017 | 0.0009 | 0.0009 | |
| GE | Mean | 2.34 × 10⁻¹⁹ | −1.65 × 10⁻¹⁹ | 3.60 × 10⁻²⁰ | −8.66 × 10⁻²¹ | 5.74 × 10⁻²⁰ | 1.44 × 10⁻¹⁹ | 3.72 × 10⁻²⁰ | 7.30 × 10⁻²¹ |
| SD | 0.0111 | 0.0071 | 0.0051 | 0.0034 | 0.0022 | 0.0018 | 0.0010 | 0.0010 | |
| NE | Mean | 8.82 × 10⁻²⁰ | 9.18 × 10⁻²⁰ | −4.56 × 10⁻²⁰ | −8.71 × 10⁻²¹ | −3.00 × 10⁻²⁰ | −4.12 × 10⁻²¹ | 8.68 × 10⁻²⁰ | 7.56 × 10⁻²⁰ |
| SD | 0.0106 | 0.0070 | 0.0048 | 0.0030 | 0.0021 | 0.0018 | 0.0009 | 0.0010 | |
| UK | Mean | −6.62 × 10⁻²⁰ | −6.97 × 10⁻²⁰ | 1.24 × 10⁻¹⁹ | 2.52 × 10⁻²⁰ | −1.90 × 10⁻¹⁹ | −6.55 × 10⁻²⁰ | 3.85 × 10⁻²⁰ | −7.10 × 10⁻²¹ |
| SD | 0.0076 | 0.0102 | 0.0079 | 0.0054 | 0.0034 | 0.0026 | 0.0013 | 0.0016 | |
| US | Mean | −6.39 × 10⁻²⁰ | −2.00 × 10⁻¹⁹ | 4.22 × 10⁻¹⁹ | 5.98 × 10⁻²¹ | −7.83 × 10⁻²⁰ | −1.07 × 10⁻²⁰ | 1.09 × 10⁻¹⁹ | 9.81 × 10⁻²⁰ |
| SD | 0.0071 | 0.0085 | 0.0070 | 0.0045 | 0.0031 | 0.0024 | 0.0012 | 0.0012 | |
| Panel A: Public Real Estate Markets | |||||
| VAR | FR | GE | NE | UK | US |
| d1 | 47.49% | 46.54% | 46.74% | 18.31% | 29.00% |
| d2 | 26.48% | 26.34% | 25.44% | 31.73% | 33.83% |
| d3 | 14.31% | 14.23% | 15.36% | 26.06% | 21.70% |
| d4 | 6.00% | 6.35% | 6.45% | 14.17% | 7.48% |
| d5 | 2.88% | 3.16% | 3.01% | 4.86% | 4.01% |
| d6 | 1.91% | 2.72% | 2.09% | 3.57% | 3.17% |
| d7 | 0.94% | 0.65% | 0.91% | 1.32% | 0.81% |
| Panel B: Stock Markets | |||||
| VAR | FR | GE | NE | UK | US |
| d1 | 50.74% | 50.19% | 49.99% | 20.74% | 23.58% |
| d2 | 27.10% | 26.07% | 26.87% | 37.73% | 34.94% |
| d3 | 12.64% | 12.91% | 12.80% | 22.95% | 23.59% |
| d4 | 5.20% | 5.79% | 5.21% | 10.84% | 9.79% |
| d5 | 2.32% | 2.70% | 2.71% | 4.55% | 4.92% |
| d6 | 1.48% | 1.70% | 1.88% | 2.38% | 2.46% |
| d7 | 0.52% | 0.64% | 0.54% | 0.81% | 0.73% |
| Country | Scale | Full Period (%) | Pre-Crisis (%) | GFC (%) | EDC (%) | Post-Crisis (%) |
|---|---|---|---|---|---|---|
| FR | All | 65.19 | 53.68 | 74.84 | 84.19 | 66.53 |
| 2–8 days | 57.54 | 43.79 | 68.61 | 80.17 | 64.66 | |
| 8–32 days | 61.38 | 49.84 | 74.33 | 85.16 | 63.07 | |
| 32–256 days | 60.43 | 53.64 | 71.01 | 84.14 | 55.16 | |
| GE | All | 59.14 | 50.89 | 66.28 | 72.19 | 61.85 |
| 2–8 days | 53.79 | 41.57 | 62.6 | 70.35 | 62.39 | |
| 8–32 days | 57.74 | 46.87 | 65.57 | 78.82 | 62.33 | |
| 32–256 days | 50.18 | 45.54 | 59.88 | 63.88 | 46.42 | |
| NE | All | 63.45 | 52.35 | 72.27 | 79.22 | 66.43 |
| 2–8 days | 57.33 | 43.84 | 65.33 | 75.52 | 67.79 | |
| 8–32 days | 59.14 | 47.89 | 70.66 | 80.04 | 62.49 | |
| 32–256 days | 53.14 | 44.81 | 63.25 | 75.47 | 51.57 | |
| UK | All | 68.91 | 63.96 | 68.82 | 81.46 | 68.18 |
| 2–8 days | 63.38 | 53.31 | 69.96 | 79.16 | 69.82 | |
| 8–32 days | 67.53 | 60.71 | 73.64 | 82.98 | 68.71 | |
| 32–256 days | 57.41 | 56.49 | 53.63 | 75.79 | 52.19 | |
| US | All | 64.3 | 57.93 | 79.51 | 77.72 | 55.9 |
| 2–8 days | 61.72 | 55.48 | 76.56 | 76.82 | 57.33 | |
| 8–32 days | 57.7 | 49.87 | 77.93 | 71.26 | 56.43 | |
| 32–256 days | 55.92 | 50.12 | 78.06 | 77.93 | 43.48 |
| Panel A: Lehman Brothers Collapse (15 September 2008) | ||||||||||||
| d1 (2–4 days) | d2 (4–8 days) | d3 (8–16 days) | ||||||||||
| Events | Corr. Before | Corr After | Diff. | t-stat | Corr. Before | Corr After | Diff. | t-stat | Corr. Before | Corr After | Diff. | t-stat |
| FR | 0.7489 | 0.7823 | 0.0334 | 15.93 * | 0.7835 | 0.8096 | 0.0261 | 20.07 * | 0.7998 | 0.8271 | 0.0273 | 13.38 * |
| GE | 0.7165 | 0.7552 | 0.0386 | 45.70 * | 0.7205 | 0.7468 | 0.0263 | 13.49 * | 0.7311 | 0.6989 | −0.0322 | −22.92 * |
| NE | 0.6722 | 0.7791 | 0.1069 | 38.86 * | 0.7142 | 0.8043 | 0.0902 | 50.71 * | 0.7384 | 0.7970 | 0.0586 | 15.40 * |
| UK | 0.7503 | 0.7619 | 0.0116 | 10.31 * | 0.7519 | 0.7764 | 0.0245 | 12.99 * | 0.7840 | 0.8114 | 0.0275 | 5.70 * |
| US | 0.7671 | 0.8054 | 0.0383 | 11.87 * | 0.7717 | 0.8168 | 0.0451 | 14.51 * | 0.8128 | 0.8489 | 0.0360 | 16.18 * |
| d4 (16–32 days) | d5 (32–64 days) | d6 (64–128 days) | ||||||||||
| Corr. Before | Corr After | Diff. | t-stat | Corr. Before | Corr After | Diff. | t-stat | Corr. Before | Corr After | Diff. | t-stat | |
| FR | 0.8122 | 0.8663 | 0.0541 | 25.93 * | 0.6754 | 0.8668 | 0.1914 | 34.93 * | 0.5354 | 0.8540 | 0.3186 | 14.0 * |
| GE | 0.7125 | 0.7360 | 0.0235 | 2.64 * | 0.6045 | 0.7628 | 0.1583 | 9.43 * | 0.5066 | 0.7549 | 0.2483 | 10.32 * |
| NE | 0.7808 | 0.7903 | 0.0096 | 2.51 * | 0.6871 | 0.8264 | 0.1393 | 18.66 * | 0.7069 | 0.8414 | 0.1345 | 20.4 * |
| UK | 0.6965 | 0.8053 | 0.1087 | 10.48 * | 0.4949 | 0.7325 | 0.2375 | 13.57 * | 0.3227 | 0.7062 | 0.3835 | 26.66 * |
| US | 0.7578 | 0.8359 | 0.0781 | 22.65 * | 0.7246 | 0.8057 | 0.0811 | 16.39 * | 0.7675 | 0.8817 | 0.1143 | 41.19 * |
| d7 (128–256 days) | ||||||||||||
| Corr. Before | Corr After | Diff. | t-stat | |||||||||
| FR | 0.3366 | 0.8842 | 0.5476 | 53.78 * | ||||||||
| GE | 0.4032 | 0.7641 | 0.3609 | 33.76 * | ||||||||
| NE | 0.7017 | 0.8974 | 0.1957 | −36.19 * | ||||||||
| UK | 0.0338 | 0.5236 | 0.4898 | −16.99 * | ||||||||
| US | 0.5618 | 0.8958 | 0.3340 | −22.77 * | ||||||||
| Panel B: European Debt Crisis (2 May 2010) | ||||||||||||
| d1 (2–4 days) | d2 (4–8 days) | d3 (8–16 days) | ||||||||||
| Events | Corr. Before | Corr After | Diff. | t-stat | Corr. Before | Corr After | Diff. | t-stat | Corr. Before | Corr After | Diff. | t-stat |
| FR | 0.7799 | 0.8466 | 0.0668 | 26.46 * | 0.7712 | 0.8527 | 0.0815 | 13.06 * | 0.8077 | 0.8907 | 0.0830 | 28.07 * |
| GE | 0.7440 | 0.7813 | 0.0374 | 14.40 | 0.7249 | 0.8044 | 0.0794 | 27.06 | 0.7224 | 0.8456 | 0.1232 | 64.42 |
| NE | 0.7967 | 0.8189 | 0.0223 | 9.70 * | 0.7927 | 0.8243 | 0.0316 | 6.76 * | 0.8043 | 0.8476 | 0.0433 | 15.85 * |
| UK | 0.7536 | 0.8500 | 0.0964 | 39.21 * | 0.7814 | 0.8591 | 0.0777 | 35.30 * | 0.8014 | 0.8598 | 0.0584 | 28.85 * |
| US | 0.7480 | 0.8612 | 0.1132 | 32.59 * | 0.7567 | 0.8637 | 0.1070 | 27.25 * | 0.8024 | 0.8528 | 0.0504 | 12.57 * |
| d4 (16–32 days) | d5 (32–64 days) | d6 (64–128 days) | ||||||||||
| Corr. Before | Corr After | Diff. | t-stat | Corr. Before | Corr After | Diff. | t-stat | Corr. Before | Corr After | Diff. | t-stat | |
| FR | 0.8438 | 0.8664 | 0.0226 | 6.00 * | 0.8447 | 0.9226 | 0.0778 | 15.08 * | 0.8783 | 0.9188 | 0.0405 | 8.54 * |
| GE | 0.8160 | 0.8286 | 0.0127 | 5.58 * | 0.8275 | 0.8675 | 0.0400 | 13.85 * | 0.8114 | 0.8462 | 0.0348 | 3.28 * |
| NE | 0.7999 | 0.8420 | 0.0421 | 29.72 * | 0.8376 | 0.8698 | 0.0322 | 8.81 * | 0.8367 | 0.9009 | 0.0642 | 9.32 * |
| UK | 0.8386 | 0.8795 | 0.0409 | 18.81 * | 0.7911 | 0.9115 | 0.1204 | 27.13 * | 0.7851 | 0.9179 | 0.1327 | 24.96 * |
| US | 0.7747 | 0.8322 | 0.0576 | 16.83 * | 0.7676 | 0.8418 | 0.0742 | 16.73 * | 0.9212 | 0.8692 | −0.0521 | −16.98 * |
| d7 (128–256 days) | ||||||||||||
| Corr. Before | Corr After | Diff. | t-stat | |||||||||
| FR | 0.8991 | 0.9506 | 0.0515 | 12.98 * | ||||||||
| GE | 0.7943 | 0.8821 | 0.0878 | 15.16 * | ||||||||
| NE | 0.8780 | 0.9100 | 0.0319 | 6.05 * | ||||||||
| UK | 0.7893 | 0.9295 | 0.1402 | 18.21 * | ||||||||
| US | 0.8991 | 0.8280 | −0.0710 | −11.3 * | ||||||||
| a | b | g | Mean | SD | Maximum | Minimum | ||
|---|---|---|---|---|---|---|---|---|
| France | Short | 0.0736 *** | 0.9147 *** | 0.0043 | 0.5751 | 0.2613 | 0.9415 | −0.2965 |
| Medium | 0.6193 *** | 0.3102 *** | 0.2158 *** | 0.5610 | 0.5230 | 0.9921 | −0.8290 | |
| Long | 0.795 *** | 0.1667 *** | 0.0713 *** | 0.5262 | 0.7447 | 0.9978 | −0.9275 | |
| Raw data | 0.0258 *** | 0.9696 *** | 0.0054 | 0.6011 | 0.2177 | 0.9144 | −0.0007 | |
| Germany | Short | 0.0677 *** | 0.9199 *** | 0.0011 | 0.5272 | 0.2522 | 0.8938 | −0.3286 |
| Medium | 0.6315 *** | 0.3025 *** | 0.0591 * | 0.5277 | 0.5408 | 0.9896 | −0.8912 | |
| Long | 0.7841 *** | 0.1731 *** | 0.0577 *** | 0.4541 | 0.7715 | 0.9963 | −0.9199 | |
| Raw data | 0.0158 *** | 0.9818 *** | 0.0034 | 0.5574 | 0.2074 | 0.8712 | 0.0565 | |
| Netherlands | Short | 0.0716 *** | 0.9080 *** | 0.0277 ** | 0.5945 | 0.2350 | 0.9277 | −0.2543 |
| Medium | 0.6157 *** | 0.3177 *** | 0.1073 *** | 0.5397 | 0.5286 | 0.9911 | −0.8616 | |
| Long | 0.7758 *** | 0.1870 *** | 0.0956 *** | 0.5315 | 0.7371 | 0.9974 | −0.9077 | |
| Raw data | 0.0185 *** | 0.9781 *** | 0.0033 | 0.6029 | 0.2069 | 0.8842 | 0.0073 | |
| UK | Short | 0.1583 *** | 0.7785 *** | 0.0172 | 0.6029 | 0.2082 | 0.9668 | −0.3337 |
| Medium | 0.6282 *** | 0.2836 *** | 0.2656 *** | 0.6029 | 0.4570 | 0.9931 | −0.7660 | |
| Long | 0.7861 *** | 0.1741 *** | 0.0907 *** | 0.6029 | 0.7548 | 0.9972 | −0.9085 | |
| Raw data | 0.0510 *** | 0.9319 *** | 0.0060 | 0.6029 | 0.1422 | 0.9084 | 0.1061 | |
| US | Short | 0.1693 *** | 0.7302 *** | 0.0581 ** | 0.6029 | 0.1863 | 0.9577 | −0.1926 |
| Medium | 0.6369 *** | 0.281 *** | 0.1536 *** | 0.6029 | 0.4915 | 0.9909 | −0.8335 | |
| Long | 0.7514 *** | 0.2156 *** | 0.0279 *** | 0.6029 | 0.8185 | 0.9952 | −0.9545 | |
| Raw data | 0.0611 *** | 0.8758 *** | 0.0734 *** | 0.6029 | 0.1304 | 0.9100 | 0.0672 |
© 2019 by the authors. Licensee MDPI, Basel, Switzerland. This article is an open access article distributed under the terms and conditions of the Creative Commons Attribution (CC BY) license (http://creativecommons.org/licenses/by/4.0/).
Share and Cite
Liow, K.H.; Zhou, X.; Li, Q.; Huang, Y. Time–Scale Relationship between Securitized Real Estate and Local Stock Markets: Some Wavelet Evidence. J. Risk Financial Manag. 2019, 12, 16. https://doi.org/10.3390/jrfm12010016
Liow KH, Zhou X, Li Q, Huang Y. Time–Scale Relationship between Securitized Real Estate and Local Stock Markets: Some Wavelet Evidence. Journal of Risk and Financial Management. 2019; 12(1):16. https://doi.org/10.3390/jrfm12010016
Chicago/Turabian StyleLiow, Kim Hiang, Xiaoxia Zhou, Qiang Li, and Yuting Huang. 2019. "Time–Scale Relationship between Securitized Real Estate and Local Stock Markets: Some Wavelet Evidence" Journal of Risk and Financial Management 12, no. 1: 16. https://doi.org/10.3390/jrfm12010016
APA StyleLiow, K. H., Zhou, X., Li, Q., & Huang, Y. (2019). Time–Scale Relationship between Securitized Real Estate and Local Stock Markets: Some Wavelet Evidence. Journal of Risk and Financial Management, 12(1), 16. https://doi.org/10.3390/jrfm12010016