1. Introduction
In March 2006, the Green Paper “A European Strategy for Sustainable, Competitive and Secure Energy” was published. It has been adopted by the European Commission and its main objective is to achieve the security of the energy sector by formulating appropriate political and economic directions. This goal can be achieved in line with sustainable development and climate change policies. Thus, at the European Council Summit held on the 8th and 9th of March 2007, in order to limit the increase in global average temperature to 2 °C above the pre-industrial temperature, an action plan integrating the energy and climate policy of the so-called European Union Climate and Energy Package was agreed. This plan assumed: (a) a reduction in greenhouse gas emissions of at least 20% before the end of 2020 compared to 1990 levels; (b) the rationalization of energy use and a consequent reduction in its consumption by 20%; (c) an increase in the proportion of energy produced from renewable energy sources to 20% of total energy consumption in the European Union (EU) by 2020; and (d) achieving at least a 10% share of biofuels in transport fuels.
The first three (a–c) goals are of the utmost importance for the EU’s energy sector because this sector emitted 36% of the world’s carbon dioxide emissions caused by human activities in 2015 [
1]. The first strategy to meet the goals (especially a and b) is to increase the efficiency of electricity generation [
2,
3] and transmission, and a reduction of the end user’s electrical losses. Another proposed solution is to increase the number of power plants using renewable energy sources (realizing assumptions a and c). However, in this case, the limitations stem from climatic conditions and the availability of renewable energy sources in individual EU countries. It is also possible to build nuclear power plants (fulfilling assumption a). However, the socio-political situations prevailing in some countries preclude the introduction of these technologies. The last solution is the use of sequestration and storage of carbon dioxide (CCS—carbon dioxide capture and storage technologies) [
4]. Currently, three technologies for carbon capture are being developed: pre-combustion, post-combustion, and oxy-combustion. The implementation of these technologies results in a significant reduction in the efficiency of a power plant’s electricity production [
5,
6,
7]. Moreover, it is necessary to store the captured carbon dioxide (e.g., by injecting it into an underground oil deposit for oil extraction or by storing it in the seabed). The EU requires that currently built power plants are prepared to add a CCS unit into their infrastructure. Those power plants are called “capture-ready” power plants.
The pre-combustion CCS technologies [
8,
9] focus on CO
2 capture before the combustion process. Integrated gasification combined cycle (IGCC) power plants are mainly being considered for these technologies [
10,
11,
12,
13,
14,
15]. The net efficiency of electricity generation for such power plants are 9–12 p.p. [
8,
10,
16] lower than that of conventional IGCC power plants (without CO
2 capture). According to research by Franz et al. [
17], the efficiency decrease can be reduced to about 6 p.p., while the environmental performance can be improved significantly by gasification of biomass [
18,
19] instead of coal.
The post-combustion CCS technologies [
20,
21] focus on the separation of carbon dioxide and nitrogen, the two main components of combustion process flue gas. Several separation methods can be used for this purpose, such as: chemical absorption [
22,
23,
24,
25,
26,
27] (mainly 30% Ethanolamine (MEA) or Methyl diethanolamine (MDEA) solution, [
24,
28]) resulting in an efficiency decrease of coal-fired power plants by 9–12 p.p. [
10,
21,
29,
30,
31,
32,
33]; membrane separation with relatively cheap membranes with very good properties [
6,
34,
35,
36,
37]; and carbonate looping process [
38,
39]. The decrease in the net efficiency can be reduced by deep thermal integration of all power plant installations [
5].
The main assumption of oxy-combustion technology [
40,
41,
42,
43] is the elimination of nitrogen from the oxidant. As a result, flue gas with a high concentration of CO
2 and moisture is produced. Thus, after the process of flue gas drying has been completed, the CO
2 capture process is much less complicated and energy intensive. The disadvantage of the technology is the necessity of using an air separation unit (ASU) which produces oxygen of adequate purity. For oxygen production, all the available gas separation methods are used (e.g., chemical absorption, cryogenic processes [
44,
45,
46], and high-temperature membranes [
41,
47,
48,
49] and are currently being researched at the laboratory scale [
50]. The power consumption of the carbon dioxide capture process in this technology is reduced to a value near the lower limit of the range of 110–170 kWh/tCO
2 [
21,
51,
52]. Currently, pulverized-fuel boilers [
53,
54,
55] and fluidized-bed boilers [
56] are being studied with a view to oxy-combustion implementation and pilot oxy-type boilers with thermal power of 15 and 30 MW
th are being tested [
56].
The overview of the thermodynamic and economic analyses that are presented in this paper was performed as part of a work that was co-financed by the National Centre for Research and Development within the framework of Contract SP/E/2/66420/10––Strategic Research Program––Advanced Technologies for Energy Generation: Development of a technology for oxy-combustion pulverized-fuel and fluid boilers integrated with CO2 capture. The basic oxy-type power plant analyzed in this research was equipped with a cryogenic air separation unit (ASU). The thermodynamic and economic performance of this ASU was improved by adding initial separation with use of the low-temperature membranes. Further improvement of the oxy-type power plant performance was achieved by use of the ASU based on the novel high-temperature membranes. Finally, the heat recovery analysis was performed to minimize the heat loss in the oxy-type power plant.
The thermodynamic and economic results were compared with similar results for a reference power plant (conventional lignite and hard-coal-fired power plant). All analyses available in the world literature do not comprehensively cover the solutions available in the field of oxy-combustion technology with the same assumptions. Comparable results in the field of presented structures in literature differ radically from one another, due to the fact that the authors adopted different assumptions for a particular structure in their articles. This makes it impossible to perform a comprehensive comparative analysis, such as the authors of this article are pleased to present.
2. Description of the Analyzed Oxy-Type Power Plant
The overall structure of this thermal power plant, integrated with oxy-combustion technologies is presented in
Figure 1. This power plant consists of:
Boiler island consisting, inter alia, of a steam boiler and a flue gas cleaning–drying system (FD);
Steam turbine unit (STU);
Air separation unit (ASU);
Carbon dioxide capture and compression unit (CC).
The steam boiler produces the steam to be fed to the steam turbine, where the steam energy is transformed into mechanical energy. Then, this energy is used to drive the electricity generator (G). Oxygen is produced in the ASU and then mixed with recirculated flue gas which is then fed to the boiler as an oxidizer. The oxygen content in the oxidizer has a significant impact on the maximum flue gas temperature in the boiler’s combustion chamber (the higher the oxygen content, the higher the maximum temperature [
57,
58] and the fuel’s ignition temperature). Therefore, this value should not deviate significantly from the oxygen content in the air. With such combustion processes taking place in the boiler, a flue gas consisting mainly of CO
2 and water vapor is produced. Next, the flue gas is fed to the flue gas cleaning-drying system and then to the CO
2 capture and compression unit (CC). In the latter, the flue gas is prepared for transport (compression and CO
2 separation).
The summarized results of the analysis of the following four variants of an oxy-type power plant presented in this paper:
Variant V1—an oxy-type power plant equipped with a lignite-fired, fluidized-bed boiler and cryogenic ASU [
59,
60]:
Variant V2—an oxy-type power plant equipped with a hard-coal-fired, pulverized-fuel boiler and hybrid ASU (membrane-cryogenic) [
61,
62,
63,
64];
Variant V3a—an oxy-type power plant equipped with a lignite-fired, fluidized-bed boiler and ASU with a three-end type, high-temperature membrane (HTM) [
65,
66];
Variant V3b—an oxy-type power plant equipped with a hard-coal-fired, pulverized-fuel boiler and ASU with a four-end type, high-temperature membrane (HTM) [
3,
67,
68].
Therefore, the analyzed variants of the oxy-type power plant differ in terms of the construction of the boiler and the air separation unit. In all variants, the same steam turbine unit (presented in
Figure 2) and the same CO
2 capture and compression unit (presented in
Figure 3) were used.
Ultra-critical steam parameters (live steam-650 °C/30 MPa; reheated steam-670 °C/6.5 MPa) were assumed for the steam turbine unit, and the boiler’s feedwater temperature was 310 °C. The STU was equipped with four low-pressure-feedwater heaters (WH1–WH4), three high-pressure-feedwater heaters (WH5-WH7), and one steam cooler (WH8). The pressures in the deaerator (DEA) and of the water at the outlet of the condensate pump (COP), respectively, were 1.2 MPa and 1.6 MPa, and the condenser (CND) pressure was 5 kPa. The electric power of the generator (G), which is equal to the gross electrical power of the power plant, was 600 MW. Other assumptions based on the findings in the literature [
3,
67,
68,
69] are presented in
Table 1.
The thermodynamic parameters and composition of the flue gas at the inlet to the CO
2 capture and compression unit (D1 point in
Figure 3) were calculated during the computation of the boiler model. The CC unit can be divided into two main parts. In the first, the flue gas was:
Compressed in two compressor sections, FC1 and FC2, to a pressure of 0.4 MPa and 1.6 MPa, respectively;
Cooled to a temperature of 46 °C (the temperature at which most of the water will condense) in two flue gas intercoolers (FIC1 and FIC2);
Deprived of a significant portion of its water in two-phase separators (PS1 and PS2).
In the second part of the CC unit:
The flue gas was further compressed to a pressure of 6.5 MPa in the last compressor section (FC3);
The flue gas was cooled in the flue gas intercooler (FIC3) to the temperature at which most of the CO2 will condense (variants V1 and V2—3 °C; variants V3a and V3b—11 °C);
The liquefied gas (containing a high content of CO2) in the third phase separator (PS3) was separated;
The liquefied gas pressure was increased to transport pressure (15 MPa) in the CO2 pump (CDP).
Thus, in this part of the installation, the CO2 was compacted and prepared for transport. It was assumed that the isentropic efficiency of the flue gas compressor sections was 85% and the mechanical–electric efficiency of these sections was 98%.
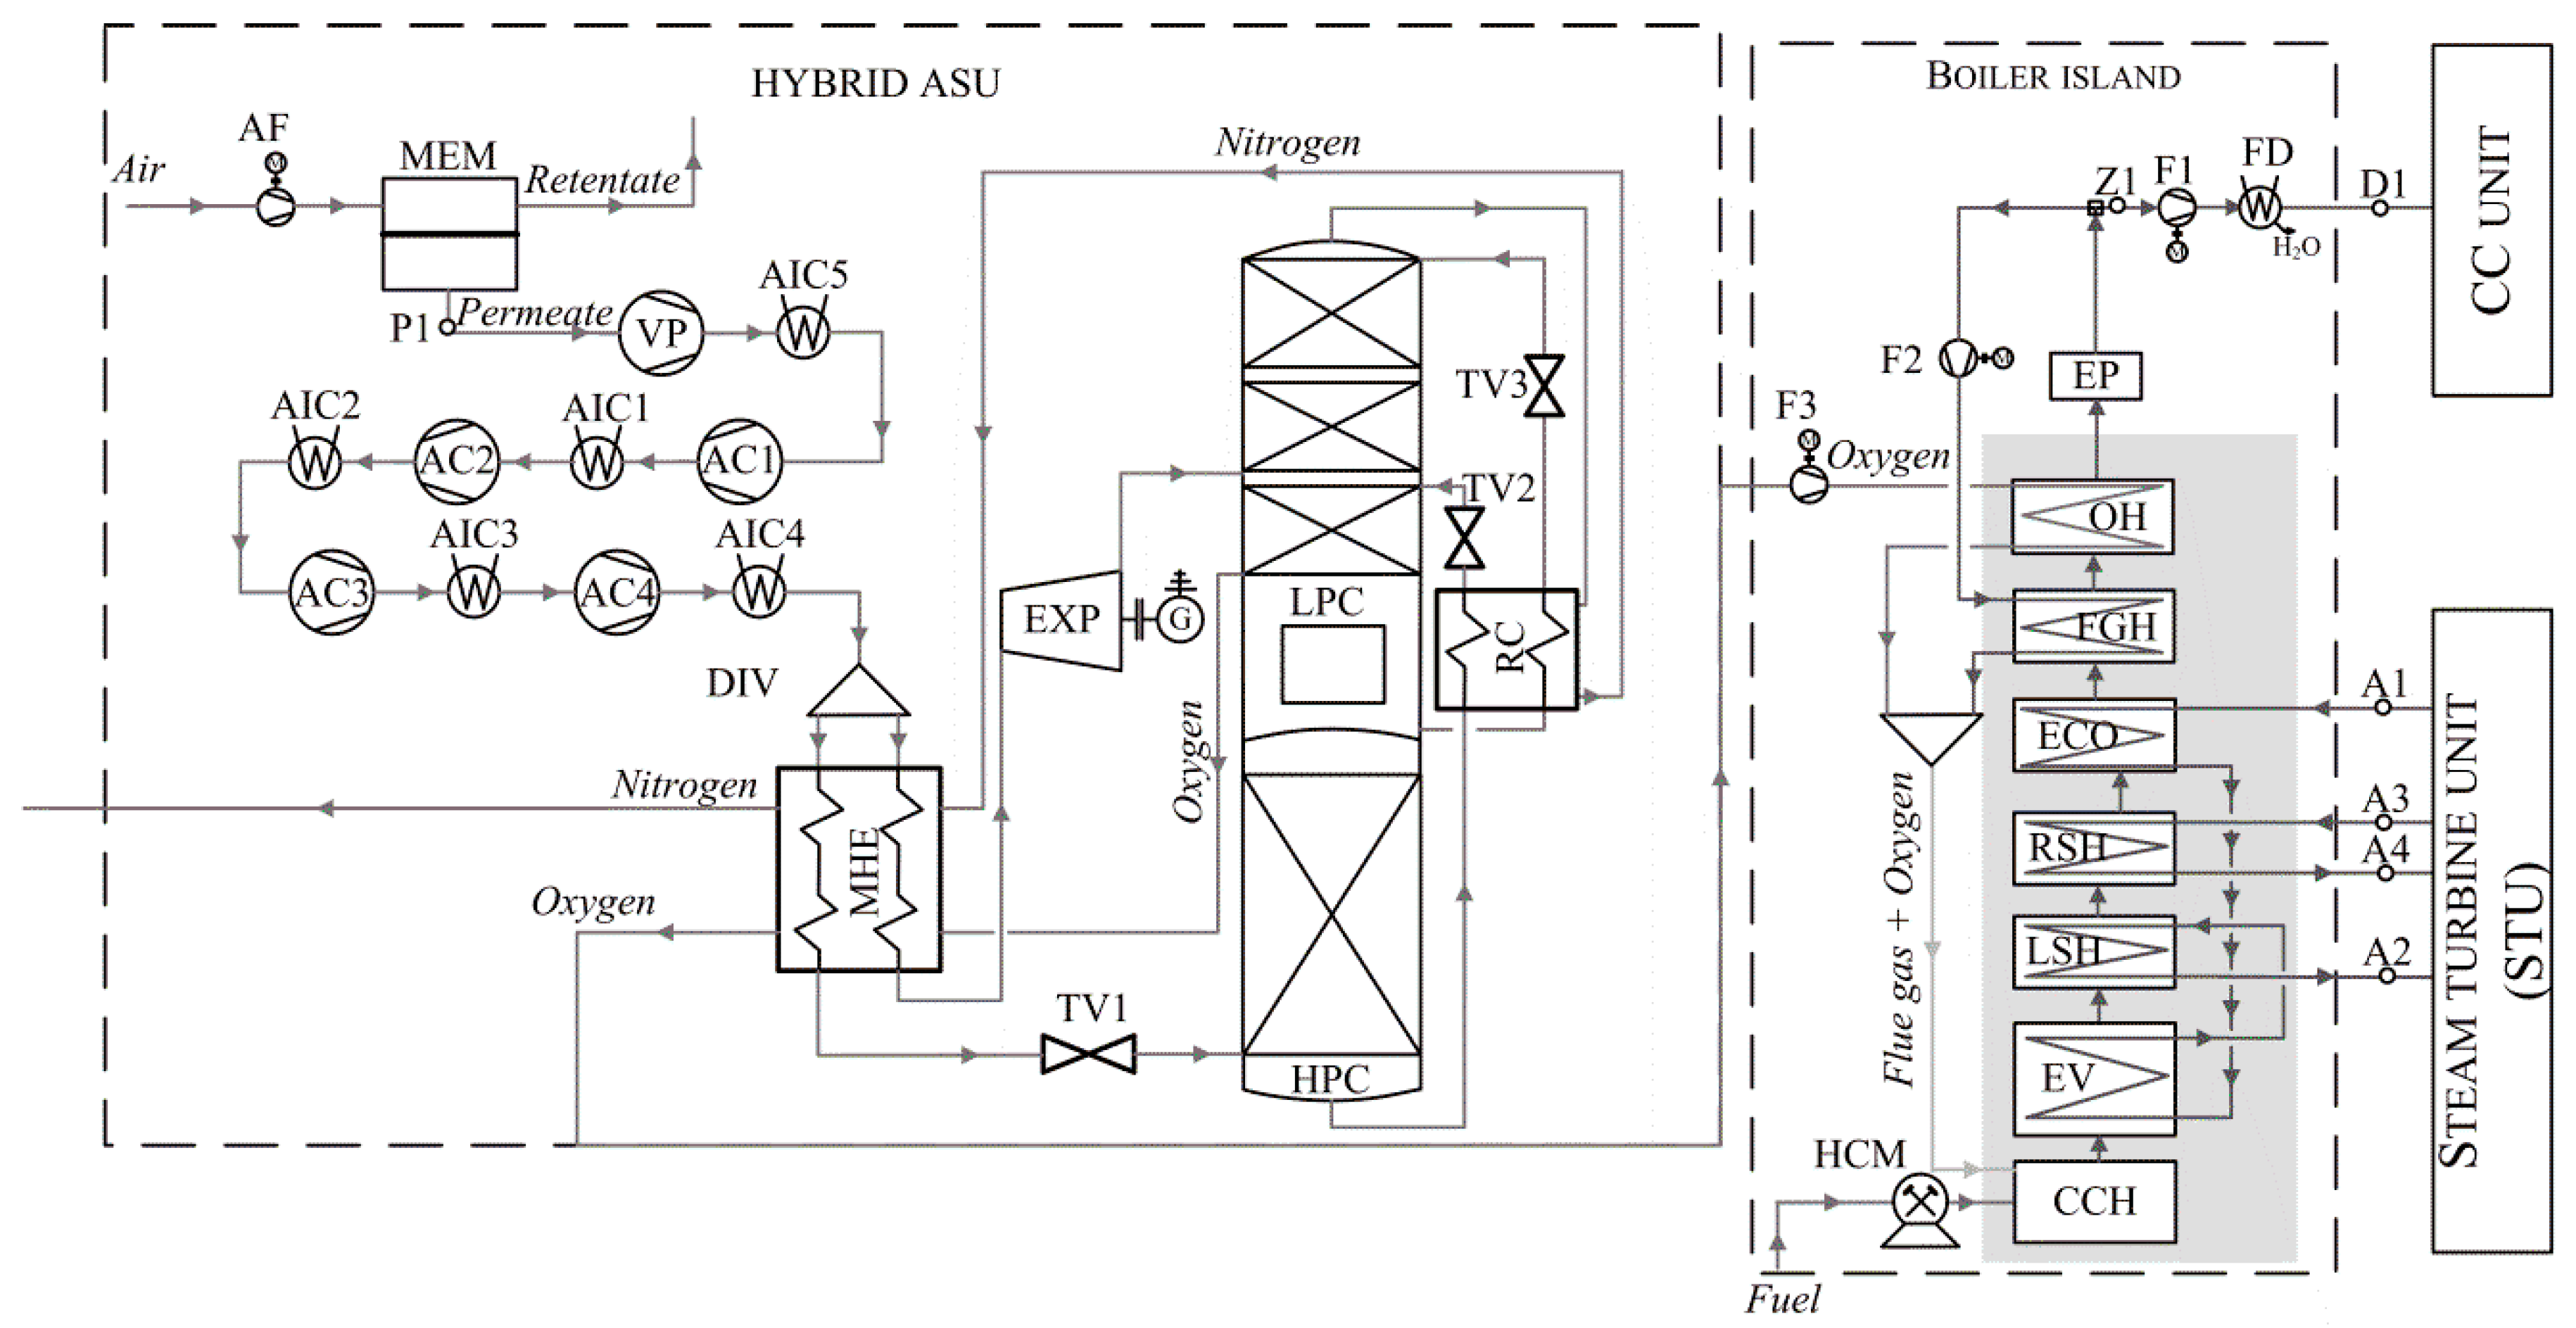
2.1. Variant V1—Steam Boiler and Description of the ASU
In addition to the steam turbine unit and the CO
2 capture and compression unit described in
Section 2, the variant V1 of the oxy-type power plant was equipped with a lignite-fired fluidized-bed boiler and an air separation unit based on the cryogenic method of oxygen separation from the air [
59,
60]. The scheme of these two installations where they have been integrated with each other is presented in
Figure 4.
In this example of an oxy-type power plant, a cryogenic ASU modelled in the ASPEN PLUS software was used. The general principle of this installation is to compress and cool down (condensation of the oxygen) a specific amount of air to achieve the desired purity of the oxygen. The air, taken from the environment, flows through four compressor sections (AC1–4), and four intercoolers (AIC) and is fed to the stream divider (DIV), where it is divided into two streams. These streams are cooled down in a multi-stream heat exchanger (MHE) by oxygen and nitrogen streams to the appropriate temperature required by the separation process. Next, the bigger air stream flows through the throttle valve (TV1) and is then fed to the high-pressure distillation column (HPC). The remaining air flows through the expander (EXP) and is fed to a low-pressure distillation column (LPC). In the high-pressure column, there is an initial separation of the air into an almost pure stream of liquefied nitrogen and a stream of nitrogen, oxygen (oxygen content ~40%) and argon mixture. Next, these streams are throttled in TV2 and TV3 valves to slightly higher pressures than the LPC’s pressure. Before it reaches the TV3 valve, the gas stream is further cooled down. In the low-pressure column, the air components are separated again. As a result, a nitrogen stream and an oxygen stream (95% pure) are created and separated. The pressures of those streams are at near ambient pressure.
In the scheme presented in
Figure 4, the air fan and the vacuum pump are absent (
,
). The model of the fluidized-bed boiler was constructed using the GateCycle program. The structure of the boiler was divided into two parts: a radiation part and a convection part. For the modelling of the radiation part, the fluidized-bed boiler module from the GateCycle library was used. This element models the operation of a combustion chamber with an evaporator (CCH + EV) and the last stages of the live steam (LSH2) and the reheated steam (RSH2) superheaters. The following parts are located in the convection part of the boiler: the first stages of the live steam (LSH1) and the reheated steam (RSH1) superheaters; an economizer (ECO); a recirculated flue gas heater (FGH); and a parallel-connected oxygen heater (OH) and a nitrogen heater (NH). Additionally, the following elements were incorporated into the structure: a flue gas exhaust fan (F1); a recirculated flue gas fan (F2); a high-purity oxygen fan (F3); a lignite dryer (LD); a lignite crusher (LC); an electrostatic precipitator (EP); and a flue gas dryer (FD).
In variant V1 of an oxy-type power plant, the lignite crusher was used, together with the following four fans: the flue gas exhaust fan (F1); the recirculated flue gas fan (F2); the high-purity oxygen fan (F3); and the nitrogen fan (F4).
Due to the need to maintain combustion conditions similar to the combustion conditions in the air, it was necessary to incorporate flue gas recirculation in the structure of oxy-type boilers. In this situation, the recirculated flue gas was taken from the outlet of the electrostatic precipitator. According to the scheme (
Figure 4), this flue gas had not yet been dried in the FD, so it had a high water content [
66,
67,
70]. This method of recirculation is called “wet” recirculation [
71]. So-called “dry” recirculation can also be used [
71] (recirculated flue gas is taken from the outlet of the flue gas dryer). However, in this case, this solution significantly reduces the thermal efficiency of the boiler [
60,
70]. The main assumptions for the cryogenic ASU model computations have been presented in
Table 2 [
59].
The fuel used to feed the combustion chamber of the steam boiler was lignite with a lower heating value of 9960 kJ/kg and the following mass composition: carbon (c)—28.6%; hydrogen (h)—2.2%; sulfur (s)—0.95%; nitrogen (n)—0.25%; oxygen (o)—8%; ash (a)—17.5%; and water (w)—42.5%. It was assumed that the oxygen content in the oxidizer was 30% [
57,
58,
72,
73] and the excess oxidant ratio was 1.2. The flue gas flow rate was split in two to OH and NH-fed heat exchangers. For the computation of the fuel dryer model, it was assumed that the decrease in the gas temperature in the fuel dryer was 60 K and the minimum temperature difference between the lignite and gas was 20 K; only part of the fuel stream was dried. The amount of dried fuel was determined by the possibility of drying the lignite to a moisture content of 30%. The remaining assumptions for the computations of the lignite-fired, fluidized-bed boiler model are presented in
Table 3.
2.2. Variant V2—Steam Boiler and Description of the ASU
The variant V2 of an oxy-type power plant was equipped with a hard-coal-fired, pulverized-fuel boiler and a hybrid air separation unit [
61,
62,
63,
64]. A schematic diagram of both installations is presented in
Figure 5.
This kind of oxy-type power plant uses cryogenic air separation (as in variant V1). The difference is that an additional single-stage membrane separator is used in the structure in order to raise the oxygen content at the inlet to the cryogenic part of the ASU. The membrane installation was modeled in the Aspen Custom Modeler 2004 [
61,
62,
63,
64]. Such changes in the ASU’s structure greatly reduce the flow rate of gas through the compressors and the cryogenic installation; thus, the auxiliary power of the ASU is reduced as well. The three-end membrane module (MEM) was used in the membrane part of the ASU. On the supply side of the membrane module, an air fan (AF) was installed and on the permeate side and a vacuum pump (VP) was used.
The pulverized-fuel boiler used in variant V2 of an oxy-type power plant was modelled in the GateCycle software. As in the previous variant (V1), so-called “wet” flue gas recirculation was used. The boiler consisted of a combustion chamber (CCH); an evaporator (EV); a live steam superheater (LSH); a reheated steam superheater (RSH); an economizer (ECO); a recirculated flue gas heater (FGH); an oxygen heater (OH); a flue gas exhaust fan (F1); a recirculated flue gas fan (F2); a high-purity oxygen fan (F3); a hard coal mill (HCM); an electrostatic precipitator (EP); and a flue gas dryer (FD). Unlike in the previous example (variant V1), the live and reheated steam superheaters were not divided into two sections. The reason for this was that in variant V2, the radiation part of the boiler was not modelled with the use of the boiler module from the GateCycle library. The difference was that, in this case, there was also the electric power from the hard coal mill and the power of the lignite crusher, while that of the nitrogen fan was zero.
The fuel used to feed the combustion chamber of the steam boiler was hard coal with a lower heating value of 24,078 kJ/kg and the following mass composition: carbon (c)—61.25%; hydrogen (h)—3.9%; sulfur (s)—1.1%; nitrogen (n)—0.93%; oxygen (o)—6.5%; ash (p)—9%; and water (w)—17.32%. It was assumed, as in variant V1, that the oxygen content in the oxidizer was 30% and the excess oxidant ratio was 1.2. Other assumptions for the computation of the pulverized-fuel boiler model were the same as in the V1 variant (
Table 3).
The authors in the literature [
61,
62,
63,
64] analyzed low-temperature separation membranes made of the following four materials: polyethylene oxide (PPO), Matrimid, phenolic resin, and carbon/ZSM5. Based on these analyses, phenolic resin was chosen as the best of the materials that were considered. It is characterized by an oxygen permeation coefficient of 3.1119 (m
3N/m
2h bar) and a nitrogen permeation coefficient of 0.2922 (m
3N/m
2h bar). The O
2/N
2 selectivity coefficient (
) calculated with the use of both quantities was 10.65. The main assumptions for the computations of the hybrid ASU model are presented in
Table 4 [
61,
62,
63,
64]. The remaining assumptions were the same as in the V1 variant (
Table 2).
2.3. Variant V3a—Steam Boiler and Description of the ASU
The V3a variant oxy-type power plant is equipped with a lignite-fired, fluidized-bed boiler and air separation unit with a three-end type, high-temperature membrane [
65,
66]. The scheme of these two integrated installations is shown in
Figure 6.
In this example, an ASU using high-temperature membranes for separation was implemented. This membrane is made of a material that is an ionic oxygen conductor (perovskite materials). The unit flow rate of the oxygen permeating through the membrane depends on the partial pressure of the oxygen on the fed side of the membrane (
), the partial pressure of the oxygen on the permeate side of the membrane (
), the membrane coefficient (
), and the unit surface area of the membrane (
) as given by Equation (1) [
74].
The membrane coefficient
(Equation (2)) depends on the membrane’s operational temperature (
), the membrane’s thickness (
), and the properties of the membrane material (coefficient of ionic conductivity of the membrane material—
(S/m)) [
74].
Therefore, in order to separate the oxygen, it is necessary to preheat the air to a temperature in the range of 700–900 (950) °C. Therefore, a regenerative air heater (RAH) and air heater (AH) integrated into the boiler’s structure were used. In addition, it was necessary to increase the pressure difference on both sides of the membrane; thus, an air compressor (AC) and a vacuum pump (VP) were incorporated into the structure of the ASU. The preheated and compressed air was then fed to the membrane module. Then, after the oxygen was separated, the remaining gas flowed out of the membrane module as retentate. The amount of oxygen that permeated through the membrane defines the so-called oxygen recovery rate (variants V3a and V3b). This quantity was changed during the computation process [
65,
66] and it was defined as the ratio of the mass flow rate of the oxygen permeating through the membrane (
) to the mass flow rate of the oxygen in the air (
) according to Equation (3).
The oxygen that permeated through the membrane was discharged from the membrane module as permeate. The membrane module used in this case was a three-end type of membrane module. The retentate from the membrane module flowed through the first part of the expander (EXP1), then the RAH heat exchanger and then the second part of the expander (EXP2). However, the permeate flowed through the second section of the economizer (ECO2), the regenerative oxygen heater (ROH) and the oxygen cooler (OC) in order to decrease its temperature to 20 °C before it was introduced into the vacuum pump (VP). Next, the oxygen was heated in the OH heat exchanger before being mixed with the recirculated flue gasses (which were preheated in the recirculated flue gas heater—FGH). The numerator of this equation consisted of the electric power of the air compressor (
), both parts of the expanders EXP1 and EXP2 (
) and the vacuum pump (
). The main assumptions for the computation of the variant V3a ASU model are presented in
Table 5. The more detailed assumptions are described in References [
65,
66].
In this case, similar to variant V1, the lignite-fired, fluidized-bed boiler was used. In both cases, the same fuel (lignite) was chosen. The difference was that in this variant an additional air heater (AH) was added into the boiler’s structure between the RSH2 and LSH1 heat exchangers and there was no high-purity oxygen heater (that was parallel to the nitrogen heater in variant V1). In addition, there was no high-purity oxygen fan in this case. The lignite dryer was used in this case (as in variant V1), where the gas was mainly composed of nitrogen preheated in the nitrogen heater (NH), this nitrogen was used as a drying medium. The assumptions were almost identical; the difference was that the flow rate of the dried fuel was determined by the possibility of drying the lignite to achieve a moisture content of 10%. The assumptions for the computation of this type of boiler model were identical to those presented in
Table 2. A more detailed V3a variant description has been presented in the literature [
65,
66].
2.4. Variant V3b—Steam Boiler and Description of the ASU
The variant V3b of the oxy-type power plant was equipped with a hard-coal-fired, pulverized-fuel boiler and air separation unit that used a four-end type, high-temperature membrane for air separation. The scheme of both installations is presented in
Figure 7.
In this variant, the high-temperature membranes were used as in variant V3a. The difference was that the four-end type membrane module was used here instead of the three-end type. The permeate side of the membrane was fed by the recirculated flue gas (with a low oxygen concentration), so the partial pressure of the oxygen on this side of the membrane was low; in this solution, there was no need for a vacuum pump. In addition, two recirculated flue gas heaters were used: the first was fed with oxidant (FGH1); and the second one (FGH2) was located in the steam boiler; the expander was not divided into two parts. It was assumed that the temperature difference on the hot side of the FGH1 heat exchanger was 50 K. During the computation, the oxygen recovery rate (as in variant V3a) was changed [
3,
69]. The remaining assumptions for the computation of variant V3b ASU were the same as those in References [
67,
68].
A hard-coal-fired, pulverized-fuel boiler similar to the variant V2 boiler was used in the variant V3b of the oxy-type power plant. In both cases, the same fuel (hard coal) was chosen. The difference was that in this case the air heater (AH) and the recirculated flue gas heater (FGH2) were added to the boiler’s structure. This decision led to the need for the evaporator to be split into two parts, because of the high-temperature demand for air and flue gas at the inlet to the membrane module in the ASU. Additionally, the high-purity oxygen and nitrogen heaters were removed from the convection part of the boiler. The assumptions for the computation of this type of boiler model were identical to those presented in
Table 2. More detailed V3b variant descriptions are presented in the literature [
3,
67,
68,
69].
3. Thermodynamic and Economic Analysis Methodology
One of the most important power plant work indicators is the net efficiency of the electricity generation (). For all power plant types, the efficiency (Equation (4)) depends on the gross power of the power plant (), the sum of the auxiliary power of the power plant (), the fuel flow rate (), and the lower heating value ().
This efficiency, in the case of a thermal power plant (Equation (5)), can be described as a function of the steam turbine unit’s efficiency () and the boiler’s thermal efficiency ().
In the steam turbine unit’s efficiency (Equation (6)) and the boiler’s thermal efficiency (Equation (7)) equations, the heat flux supplied to the steam turbine unit () can be implemented.
After introducing the auxiliary power rate of a power plant (Equation (8)), which is the sum of the auxiliary power rates of the air separation unit (), the CO2 capture and compression unit () and the steam turbine unit (), the can be calculated according to the Equation (9).
In the case of oxy-type power plants, through the use of an air separation unit and a CO
2 capture and compression unit, waste heat sources appear in the power generation systems that can be used to increase the efficiency of power generation. For the assumptions that the heat fed to the steam turbine unit is constant but the electric power of the steam turbine unit is increased by
, the auxiliary power of the power plant is lowered by
and the boiler’s thermal efficiency is increased by
, then the net efficiency of electricity generation that it will be increased by
[
3,
69], according to the Equation (10).
The auxiliary power rate of the steam turbine unit (Equation (11)) is the sum of the powers of the condensate pump (), the main water pump (), and the bleed condensate pumps BP1 and BP2 (), divided by the gross electrical power of the power plant ().
The auxiliary power rate of the CO2 capture and compression unit (Equation (12)) is a sum of the powers of the three sections of the flue gas compressor () and the CO2 pump (), divided by the gross electrical power of the power plant ().
The auxiliary power rate of the air separation unit (Equation (13)) depends on the air compressor’s electrical power (), the expander’s electrical power (), the air fan’s electrical power (), and the vacuum pump’s electrical power ().
The auxiliary power rate of the steam boiler (Equation (14)) depends on the sum of the electrical power of the fans present in the boiler’s structure (), the electrical power required to drive fuel preparation devices () (such as: the lignite crusher and the hard coal mill) and the electrical power of the electrostatic precipitator ().
The net present value (
NPV) was used as the main indicator of economic effectiveness. According to Equation (15), this quantity depends on the annual net cash flow (
CFt) and discount rate (
r). These cash flows are determined for individual years of construction and the operation period, discounted and finally summed together [
68,
69,
75]:
For the assumption that the net present value is zero (
NPV = 0), the break-even price of electricity (
kelGR) is determined. Therefore, when the actual price of electricity is higher than the break-even price of electricity (
kel >
kelGR), then the analyzed power plant will be economically profitable (
NPV > 0) [
68,
69,
75].
The annual net cash flow (Equation (16)) depends on the total investment cost of the power plant (
), the revenue from the sale of electricity (
), the operating cost (
), income tax (
), amortization costs (
), and the liquidation value (
):
The operating costs (Equation (17)) are the sum of the costs of: repairs (), amortization (), insurance (), maintenance (), fuel (), CO2 emissions (), and exploitation ().
In the case of the economic analyses that are presented in this paper, the revenue from the sale of electricity (Equation (18)) is defined as the product of the annual operational time of the power plant () of 7500 h, the net electrical power of the power plant () and the price of electricity ().
For the assumption that NPV = 0 and after the substitution of Equations (17) and (18) into Equation (16), the dependence on the break-even price of electricity can be obtained, presented as Equation (19).
The break-even price of electricity can be divided into components (Equation (20)) dependent on the total investment cost (), the fuel cost (), and the non-fuel cost ().
The non-fuel cost is defined by Equation (21).
The repair cost is defined as a part of the total investment cost and the exact value of this quantity is determined by the indicator of the repair cost. This indicator is systematically increased during the 30 years of operation of the analyzed power plant from 0.5% to 3.5%. The amortization and insurance costs are determined similarly, with the use of an average amortization rate (5%) and an indicator of the insurance cost (0.2%). To determine the maintenance cost, it was assumed that the employment rate was 0.4 persons/MW
gross and the annual cost of employment was 14,300 EUR. The fuel and CO
2 emission costs were determined with the use of the unit price of fuel (16 EUR/Mg for lignite and 50 EUR/Mg for hard coal—determined from Reference [
76]) and the unit CO
2 emission cost (21.8 EUR/Mg
CO2 [
69]). It was assumed that the unit exploitation cost was 4.2 EUR/MWh
gross. Income tax was determined on the assumption that the income tax rate was 19%—the Polish income tax rate. The liquidation value was assumed to be 20% of the total investment cost of the power plant.
For the economic analysis, it was assumed that the total investment cost of the power plant was divided over five years. Overall, 10% of the total investment cost was used during the first year, 30% during the second year, 25% during the third year, 20% during the fourth year, and the remaining 15% during the fifth year. Eighty percent of this investment cost was covered by a commercial loan with a 6% per year rate. The repayment period of the loan was 15 years.
The last quantity needed for economic analysis was the total investment cost of the oxy-type power plant. This investment cost was divided into four parts: the boiler and steam turbine unit investment cost, the CO2 capture and compression unit investment cost, the air separation unit investment cost, and the increase in the STU investment cost associated with the replacement of the regenerative feedwater heaters.
The boiler and steam turbine unit investment cost was constant and for the variants V1 and V3a oxy-type power plants and the variant V4a of the reference power plant it was 623 m EUR. For the remaining oxy-type and reference power plants its value was 582 m EUR. Those costs were estimated based on the results from Reference [
77]. The modifications to the boiler’s construction (described in
Section 2.1,
Section 2.2,
Section 2.3 and
Section 2.4) were considered during the determination of the ASU’s investment cost. The methodology presented in the literature [
69] was used to determine the increase in the STU’s investment cost associated with the replacement of the regenerative feedwater heaters (
). The methodology takes into consideration relative increase of the steam cycle power output and additional cost of new gas-water heat exchangers.
The CC unit’s investment cost was determined based on the purchase cost of the flue gas compressor. This cost was then multiplied by an indicator of the CC unit’s investment cost which was equal to 10. This indicator value was estimated based on the results of the economic analysis for “Case 1” presented in the literature [
77]. The exact method for the estimation of the CC unit’s investment cost is presented in Reference [
69].
The determination of the ASU’s investment cost of the variant V1 of the oxy-type power plant was primarily based on the power plant labeled “Case 3” described in the literature [
77]. The ASU’s investment cost of variant V2 was determined based on the same data. The difference was that in this case the purchasing cost of the membrane and vacuum pump was included. The ASU’s investment costs of variants V3a and V3b were based on the estimation equations for the purchasing costs of the air compressor, expander, membrane, and vacuum pump. The indicator of the ASU’s investment cost was determined according to the analysis presented in the literature [
77] (for the power plant labeled “Case 1”). The entire methodology is presented in Reference [
69].
4. Thermodynamic Analysis Results for the Oxy-Type Power Plant Variants
The net efficiency of electricity generation (Equation (5)) is one of the most important thermodynamic indicators. The steam turbine unit’s efficiency needed for calculation of the efficiency (Equation (9)) for the basic calculations (without waste heat recovery analysis) for all the analyzed examples of the oxy-type power plant, was constant (51.95%).
The integration of the steam boiler with the air separation unit in variants V1 and V2 of the oxy-type power plant involved the introduction of flue gas recirculation and oxygen uptake from the ASU. As a result, the change of the ASU’s operating parameters did not change the flow rate of the fuel supplied to the boiler`s combustion chamber. Furthermore, the heat flux supplied to the steam turbine unit was constant, therefore the electrical power of the steam turbine was constant as well. Finally, according to Equation (7) in both variants (i.e., V1 and V2), the thermal efficiency of the boiler was constant. For the variants V3a and V3b of the oxy-type power plant, the heat flux supplied to the steam turbine was also constant. However, the introduction of an air heater (and of a recirculated flue gas heater in variant V3b into the boiler’s structure caused an increase in the fuel flow rate supplied to the combustion chamber. The amount of extra fuel depended on the air temperature and the flow rate at the inlet to the boiler’s air heater. This temperature mainly depended on the air compressor’s pressure rate and the flow rate mainly depended on the oxygen recovery rate in the ASU. Additionally, the heat transferred in the additional heat exchangers was not included in the heat flux supplied to the steam turbine unit (Equation (6)). In conclusion, in both cases the thermal efficiency of the boiler was related to the ASU’s operating parameter () and, therefore, to the auxiliary power rate of the ASU. Thus, both quantities ( and ) must be considered together.
The auxiliary power rate of the steam turbine was constant for all the analyzed variants (3.4%). The boiler’s auxiliary power rate for variants V3a and V3b depended on the ASU’s oxygen recovery rate, for the same reason as in case of the boiler’s thermal efficiency. Additionally, for the same reason the flue gas flow rate depended on (because of the fuel flow rate change). Therefore, the auxiliary power rate of the CC unit also depended on the ASU’s oxygen recovery rate. Both quantities ( and ) were constant for variants V1 and V2 of the oxy-type power plants. The air separation unit’s auxiliary power rate for all the analyzed examples of the oxy-type power plants depended on the ASU’s operating parameters.
According to the dependencies previously described, the results of the basic thermodynamic analysis of the oxy-type power plant variants were divided into two parts. The first part concerning the results of variants V1 and V2 is presented in
Section 4.1. The second part concerning the remaining cases is presented in
Section 4.2.
The waste heat recovery methods presented in this paper led to a change in both the thermal efficiency of the boiler (lignite drying) and the net electrical power of the power plant (replacement of the feedwater heaters supplied with steam). As a result, the net efficiency of the electricity generation will change. The results of the waste heat recovery analysis have been presented in
Section 4.3. The results of the thermodynamic analyses for all investigated variants of the oxy-type power plants (for the highest determined net efficiency of the power plant) have been summarized in
Section 4.4.
4.1. Thermodynamic Analysis of Variants V1 and V2 of the Oxy-Type Power Plant
Preliminary thermodynamic analyses for variant V1 of an oxy-type power plant were performed for the pressure at the outlets of the air compressors in the ASU (point P1 in
Figure 4), which was equal to 6 bar. The results of this analysis are presented in
Table 6. The auxiliary power rate of the ASU (~15.7%) and the CC unit (~9.6%) presented the highest value of all the other auxiliary power rates. Both these quantities (
and
) were several times greater than the remaining two auxiliary power rates (
and
); therefore, they had the greatest impact on the net efficiency value of the power plant. This efficiency for variant V1 was 12.3 p.p. lower than the analogous efficiency for the reference power plant (variant V4a).
A similar preliminary thermodynamic analysis was performed for the variant V2 oxy-type power plant. As in the previous example (variant V1), the highest value amongst the auxiliary power rates was seen in and . The net efficiency of the power plant was ~9.8 p.p. lower than the analogous efficiency for the reference power plant (variant V4b). So, it can be concluded that the implementation of a membrane installation into the structure of the cryogenic air separation unit is thermodynamically viable because the ASU’s auxiliary power rate decreased.
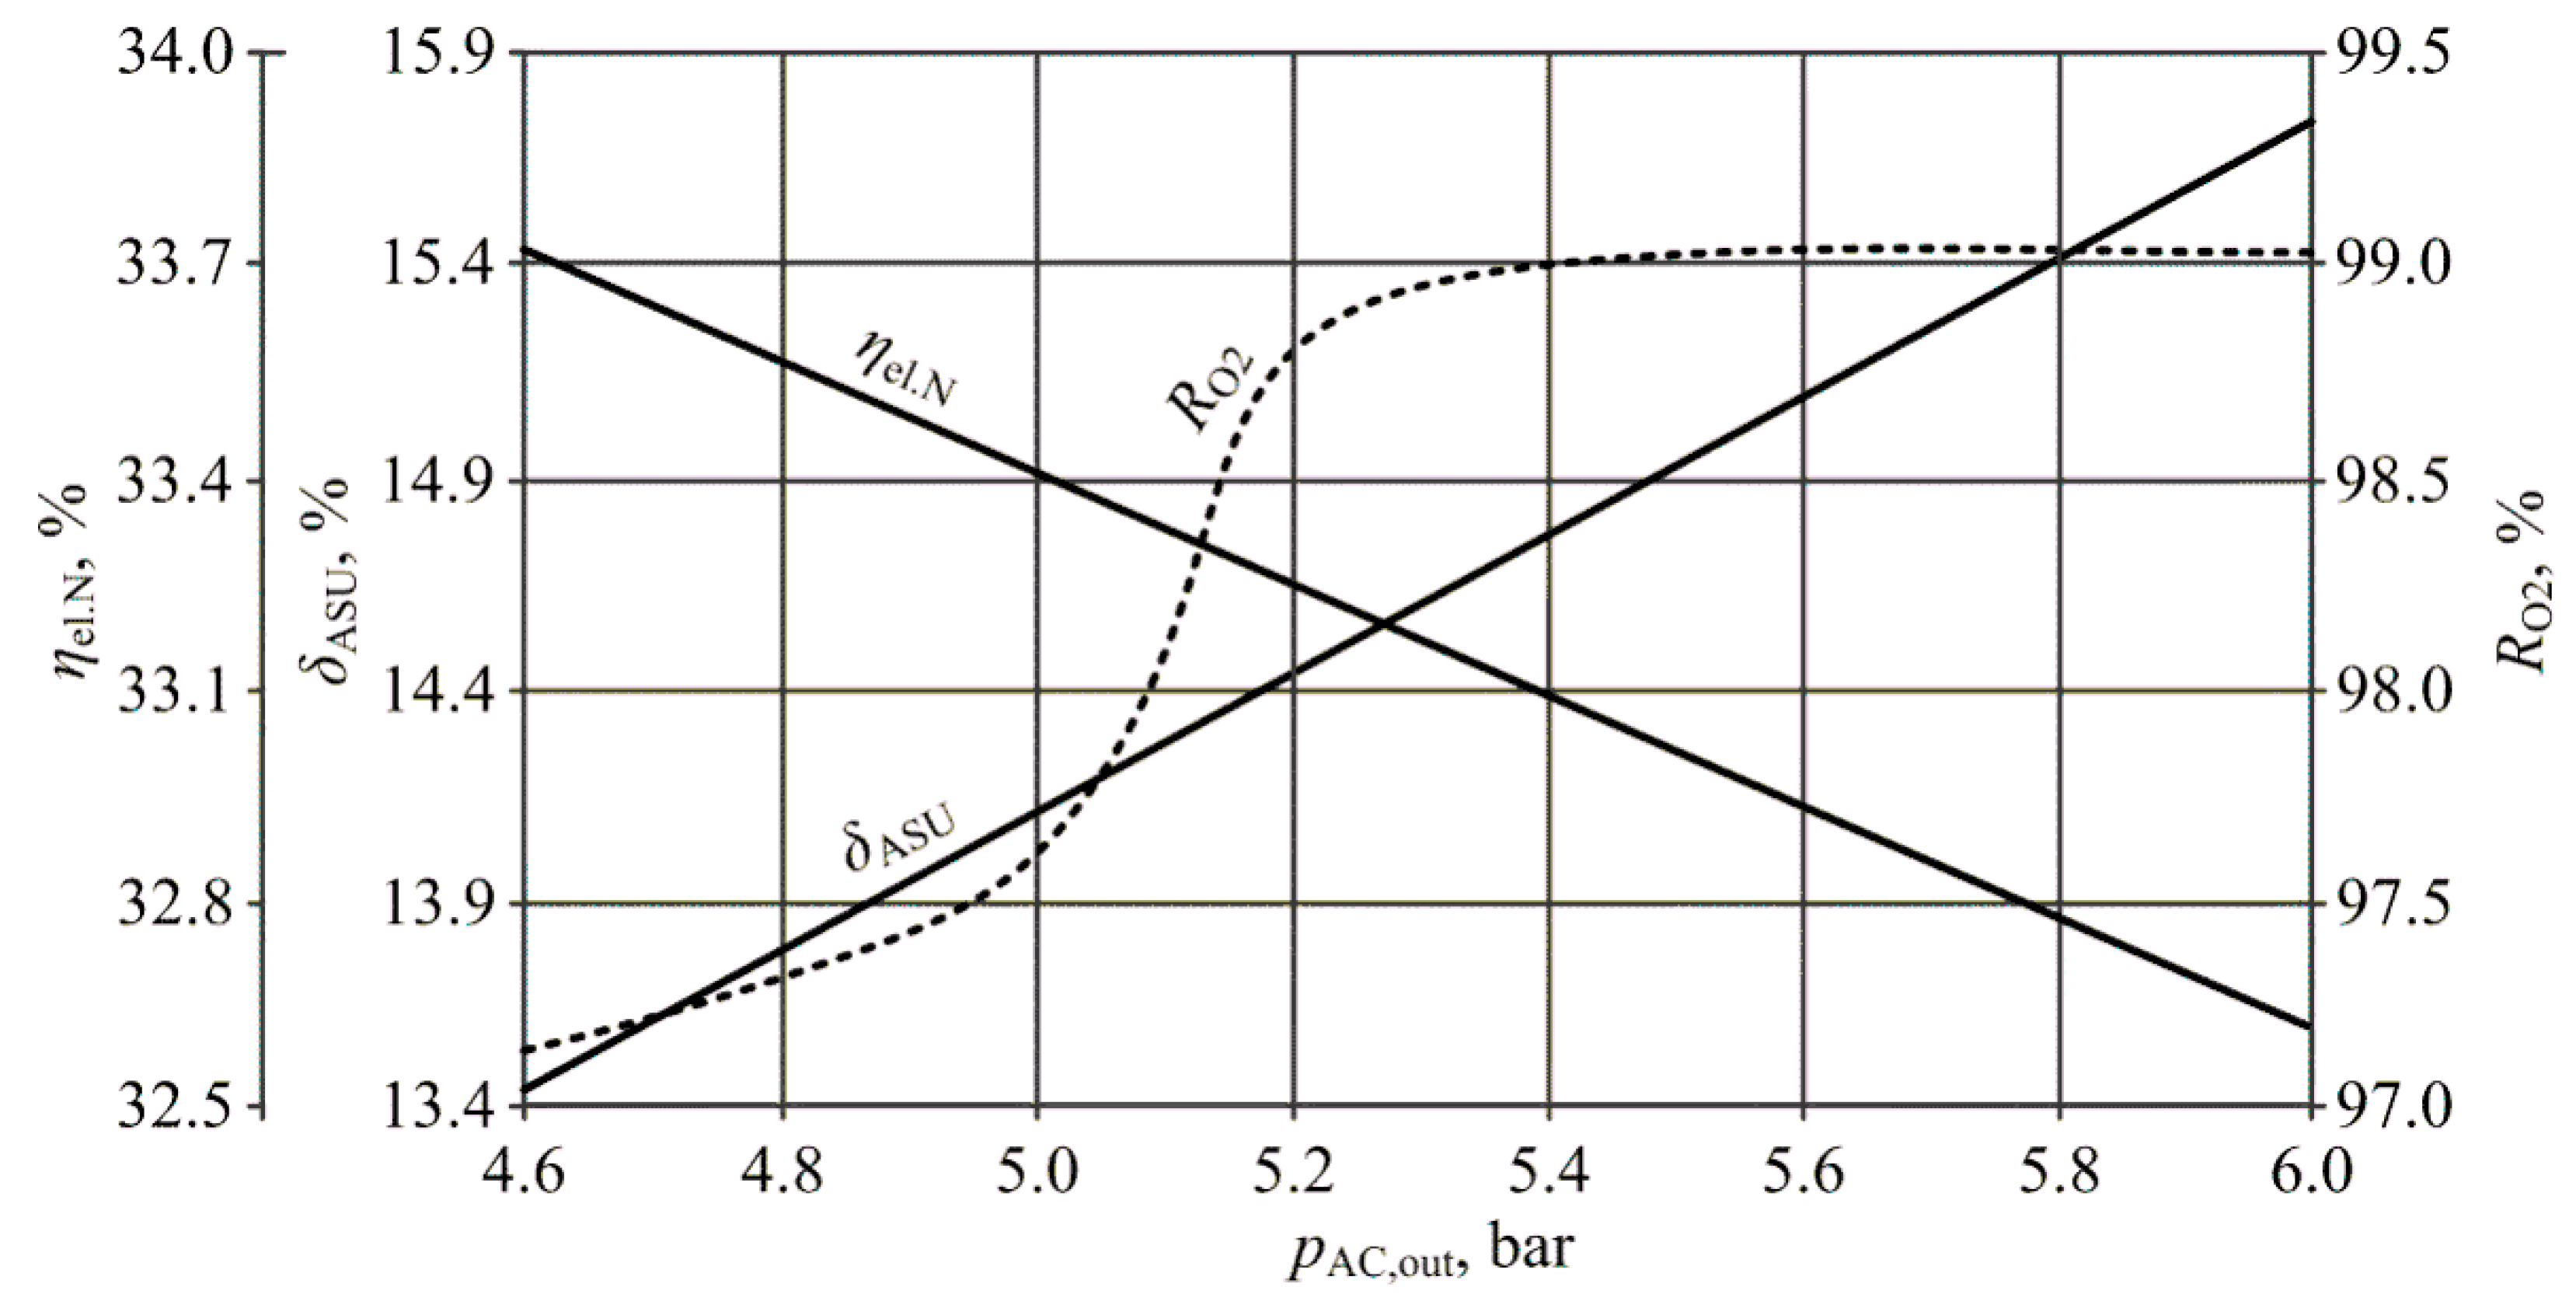
The further thermodynamic analysis of the V1 variant of the oxy-type power plant focused primarily on sensitive analysis of the effect of changes in the most important operating parameters of the cryogenic air separation unit on the auxiliary power rate of the ASU (
). This was due to the fact that almost half of the auxiliary power rate of the power plant was the ASU’s auxiliary power rate [
42,
45,
59,
60,
78].
In
Figure 8, the auxiliary power rate of the ASU and the oxygen recovery rate are presented as a function of the pressure (
) at the outlet of the air compressor in the ASU (point P1 in
Figure 4). The increase in the pressure resulted in an increase of
and, at the same time, an increase of
(which reached the maximum value for
5.5 bar). The auxiliary power rate of the ASU, as in the analysis presented by Fu et al. [
78], had already decreased (by approximately 20%) as a result of the implementation of the self-heat recuperation technology. Additionally, the net efficiency as a function of the pressure (
) at the outlet of the air compressor in the ASU is presented in
Figure 8. This efficiency decreased with an increase in the pressure.
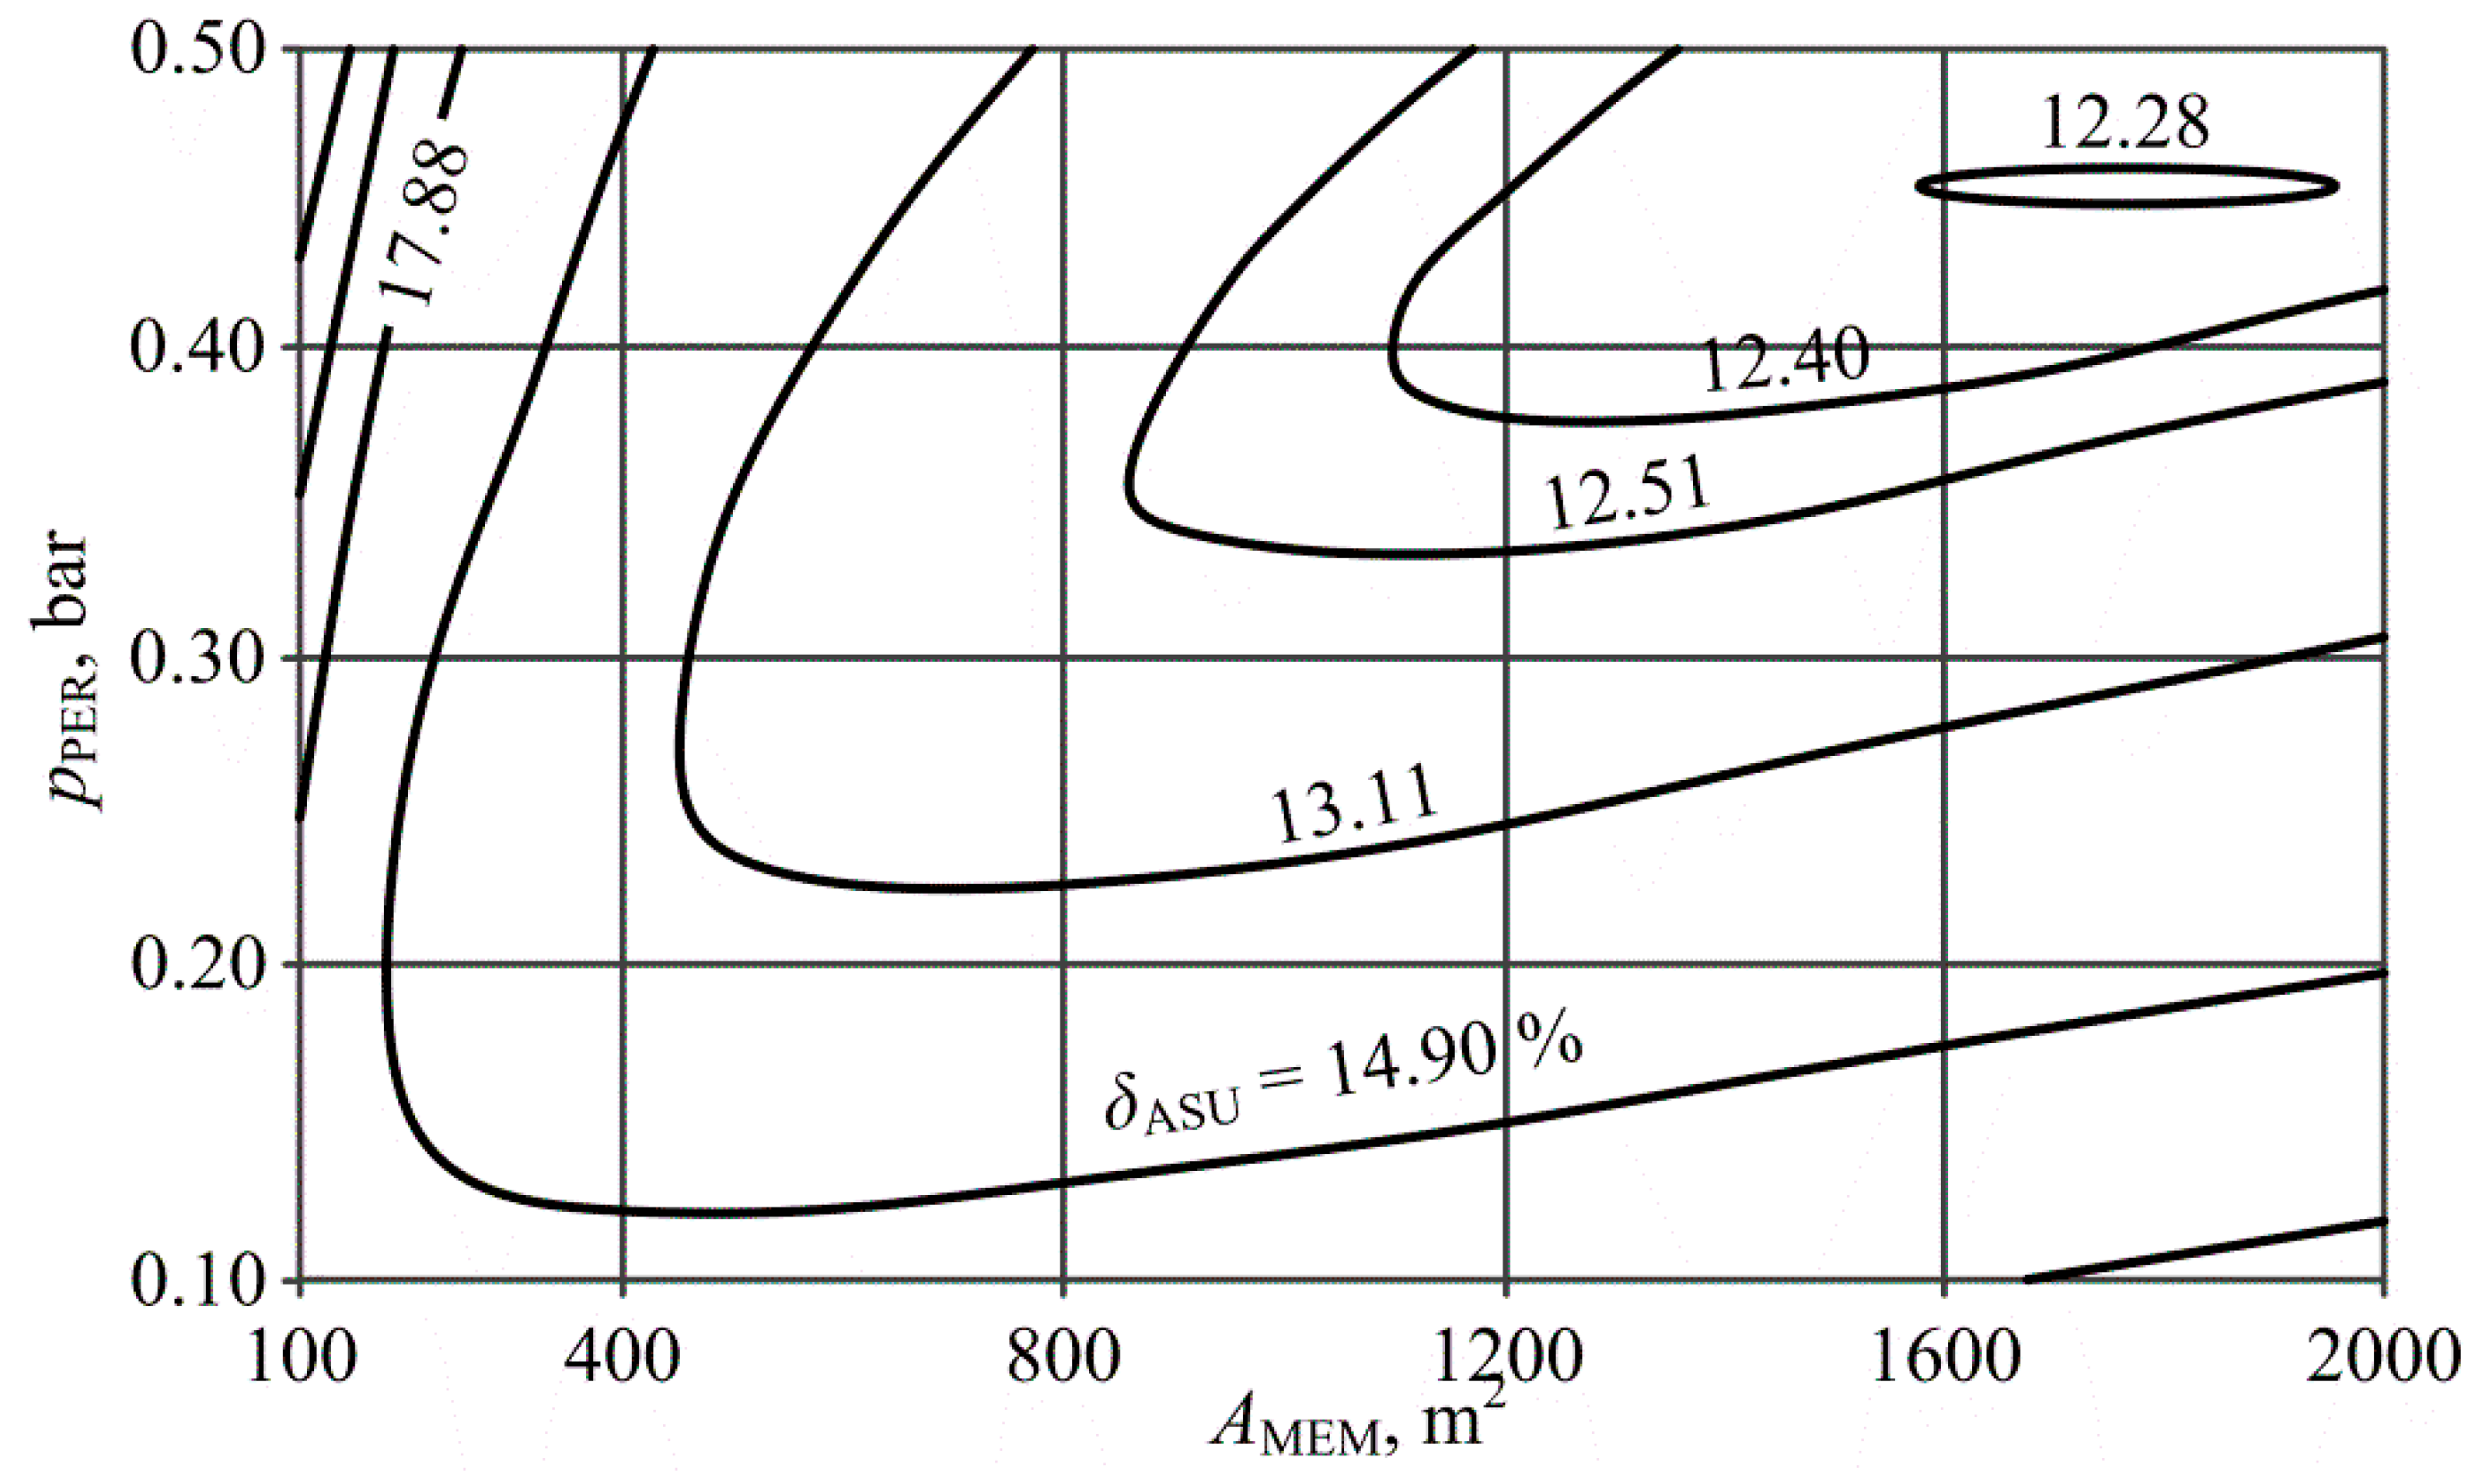
Further thermodynamic analysis of the V2 variant of the oxy-type power plant focused primarily on sensitive analysis of the effect of change in the operating parameters of the membrane part of the (hybrid) air separation unit on the auxiliary power rate of the ASU (
). Mainly, the influence of the separation membrane’s surface area and the permeate pressure (point P1 in
Figure 5) on the value of
were analyzed. In
Figure 9, the auxiliary power rate as a function of the separation membrane’s surface and the permeate pressure is presented. The results were based on the analyses presented in References [
61,
62,
64]. The permeate pressure and membrane’s surface area should be optimized together with the aim of minimizing the auxiliary power rate of the ASU. In this case of a permeate pressure of ~0.45 bar and a membrane surface of ~1800 m
2,
had the lowest value (~12.28%). According to the results presented in
Figure 8 and
Figure 9, the cryogenic air separation unit’s (variant V1) auxiliary power rate was significantly higher than that of the hybrid air separation unit (variant V2). However, in the V1 variant, lignite was used as fuel in the oxy-type power plant, which significantly increased the amount of oxygen needed for the fuel combustion process.
An analysis was performed on the possibility of a further decrease in
by decreasing the temperature at the outlet of the intercoolers (AIC1, AIC2, AIC3, and AIC4 in
Figure 5), decreasing the pressure increase in the air fan (AF in
Figure 5—used to overcome the pressure loss in the installation) and increasing the O
2/N
2 membrane selectivity coefficient (
). The results of this analysis have been presented in
Figure 10, curve A represents the results for the assumption that the increase in pressure in the AF was 0.05 bar and the temperature at the outlet of the intercoolers was 30 °C (the same as for the results presented in
Figure 9); while curve B represents the results for the assumption that the increase in the pressure in the AF was reduced to 0.02 bar and the temperature at the outlet of the intercoolers decreased to 20 °C. Decreasing the pressure difference and the temperatures could reduce the auxiliary power rate of the ASU by approximately 0.9 p.p. (lower
values) and 1.3 p.p. (higher
values). Increasing the O
2/N
2 membrane selectivity coefficient reduced
by 1.5 p.p. The lowest value of the auxiliary power rate of the ASU, presented in
Figure 10, was 9.8%.
The results of decreasing the temperature at the outlet of the intercoolers, decreasing the pressure increase in the air fan, and increasing the O
2/N
2 membrane selectivity coefficient (
) on the net efficiency of electricity generation are presented in
Figure 11 (Curves A and B represent the same assumptions as in
Figure 10). The results indicated that there was a great possibility to increase the net efficiency by up to 1.2 p.p. (to a maximal value of 37.3%).
The remaining quantities necessary to determine the net efficiency of electricity generation have been presented in
Table 6. For the V1 variant of the oxy-type power plant, the decrease in the net efficiency relative to the reference power plant was reduced to ~11.2 p.p. (by ~1.1 p.p.) by decreasing the pressure at the outlet of the air compressor (to 4.6 bar). For variant V2, the same efficiency difference was reduced to 8.6 p.p. (by ~1.2 p.p.) by decreasing the temperature at the outlet of the intercoolers, decreasing the pressure increase in the air fan and increasing the O
2/N
2 membrane selectivity coefficient (
).
4.2. Thermodynamic Analysis of Variants V3a and V3b of the Oxy-Type Power Plants
As described previously, the ASU operating parameters for the variants V3a and V3b oxy-type power plants have a huge impact on the auxiliary power rate of the ASU, the boiler’s thermal efficiency, the auxiliary power rate of the boiler, and the CC unit. Thus, analysis of the influence of these parameters on the ASU’s auxiliary power rate without a simultaneous analysis of the influence on the boiler’s thermal efficiency is pointless. The auxiliary power rates of the boiler and the CC unit as a function of the oxygen recovery rate for variants V3a and V3b are presented in
Figure 12.
For variant V3a, the (theoretical) maximal possible value of the oxygen recovery rate was ~88.5%, due to the assumed value of the air compressor’s pressure ratio (13.82) and the structure of the ASU. For variant V3b and for the same reason (air compressor’s pressure ratio—15; four-end membrane module), the maximal oxygen recovery rate was ~99%. For both cases, the auxiliary powers of the boiler and the CC units decreased as the increased. The first of the mentioned auxiliary power rates () for < ~54% was slightly higher for variant V3a (dominant influence of the fuel flow rate), while for > ~54% this quantity was considerably higher for variant V3b (dominant influence of the hard coal mill’s and the lignite crusher’s energy consumption). The CC unit’s auxiliary power rate in the whole analyzed range was considerably lower for variant V3b (lower flue gas flow rate).
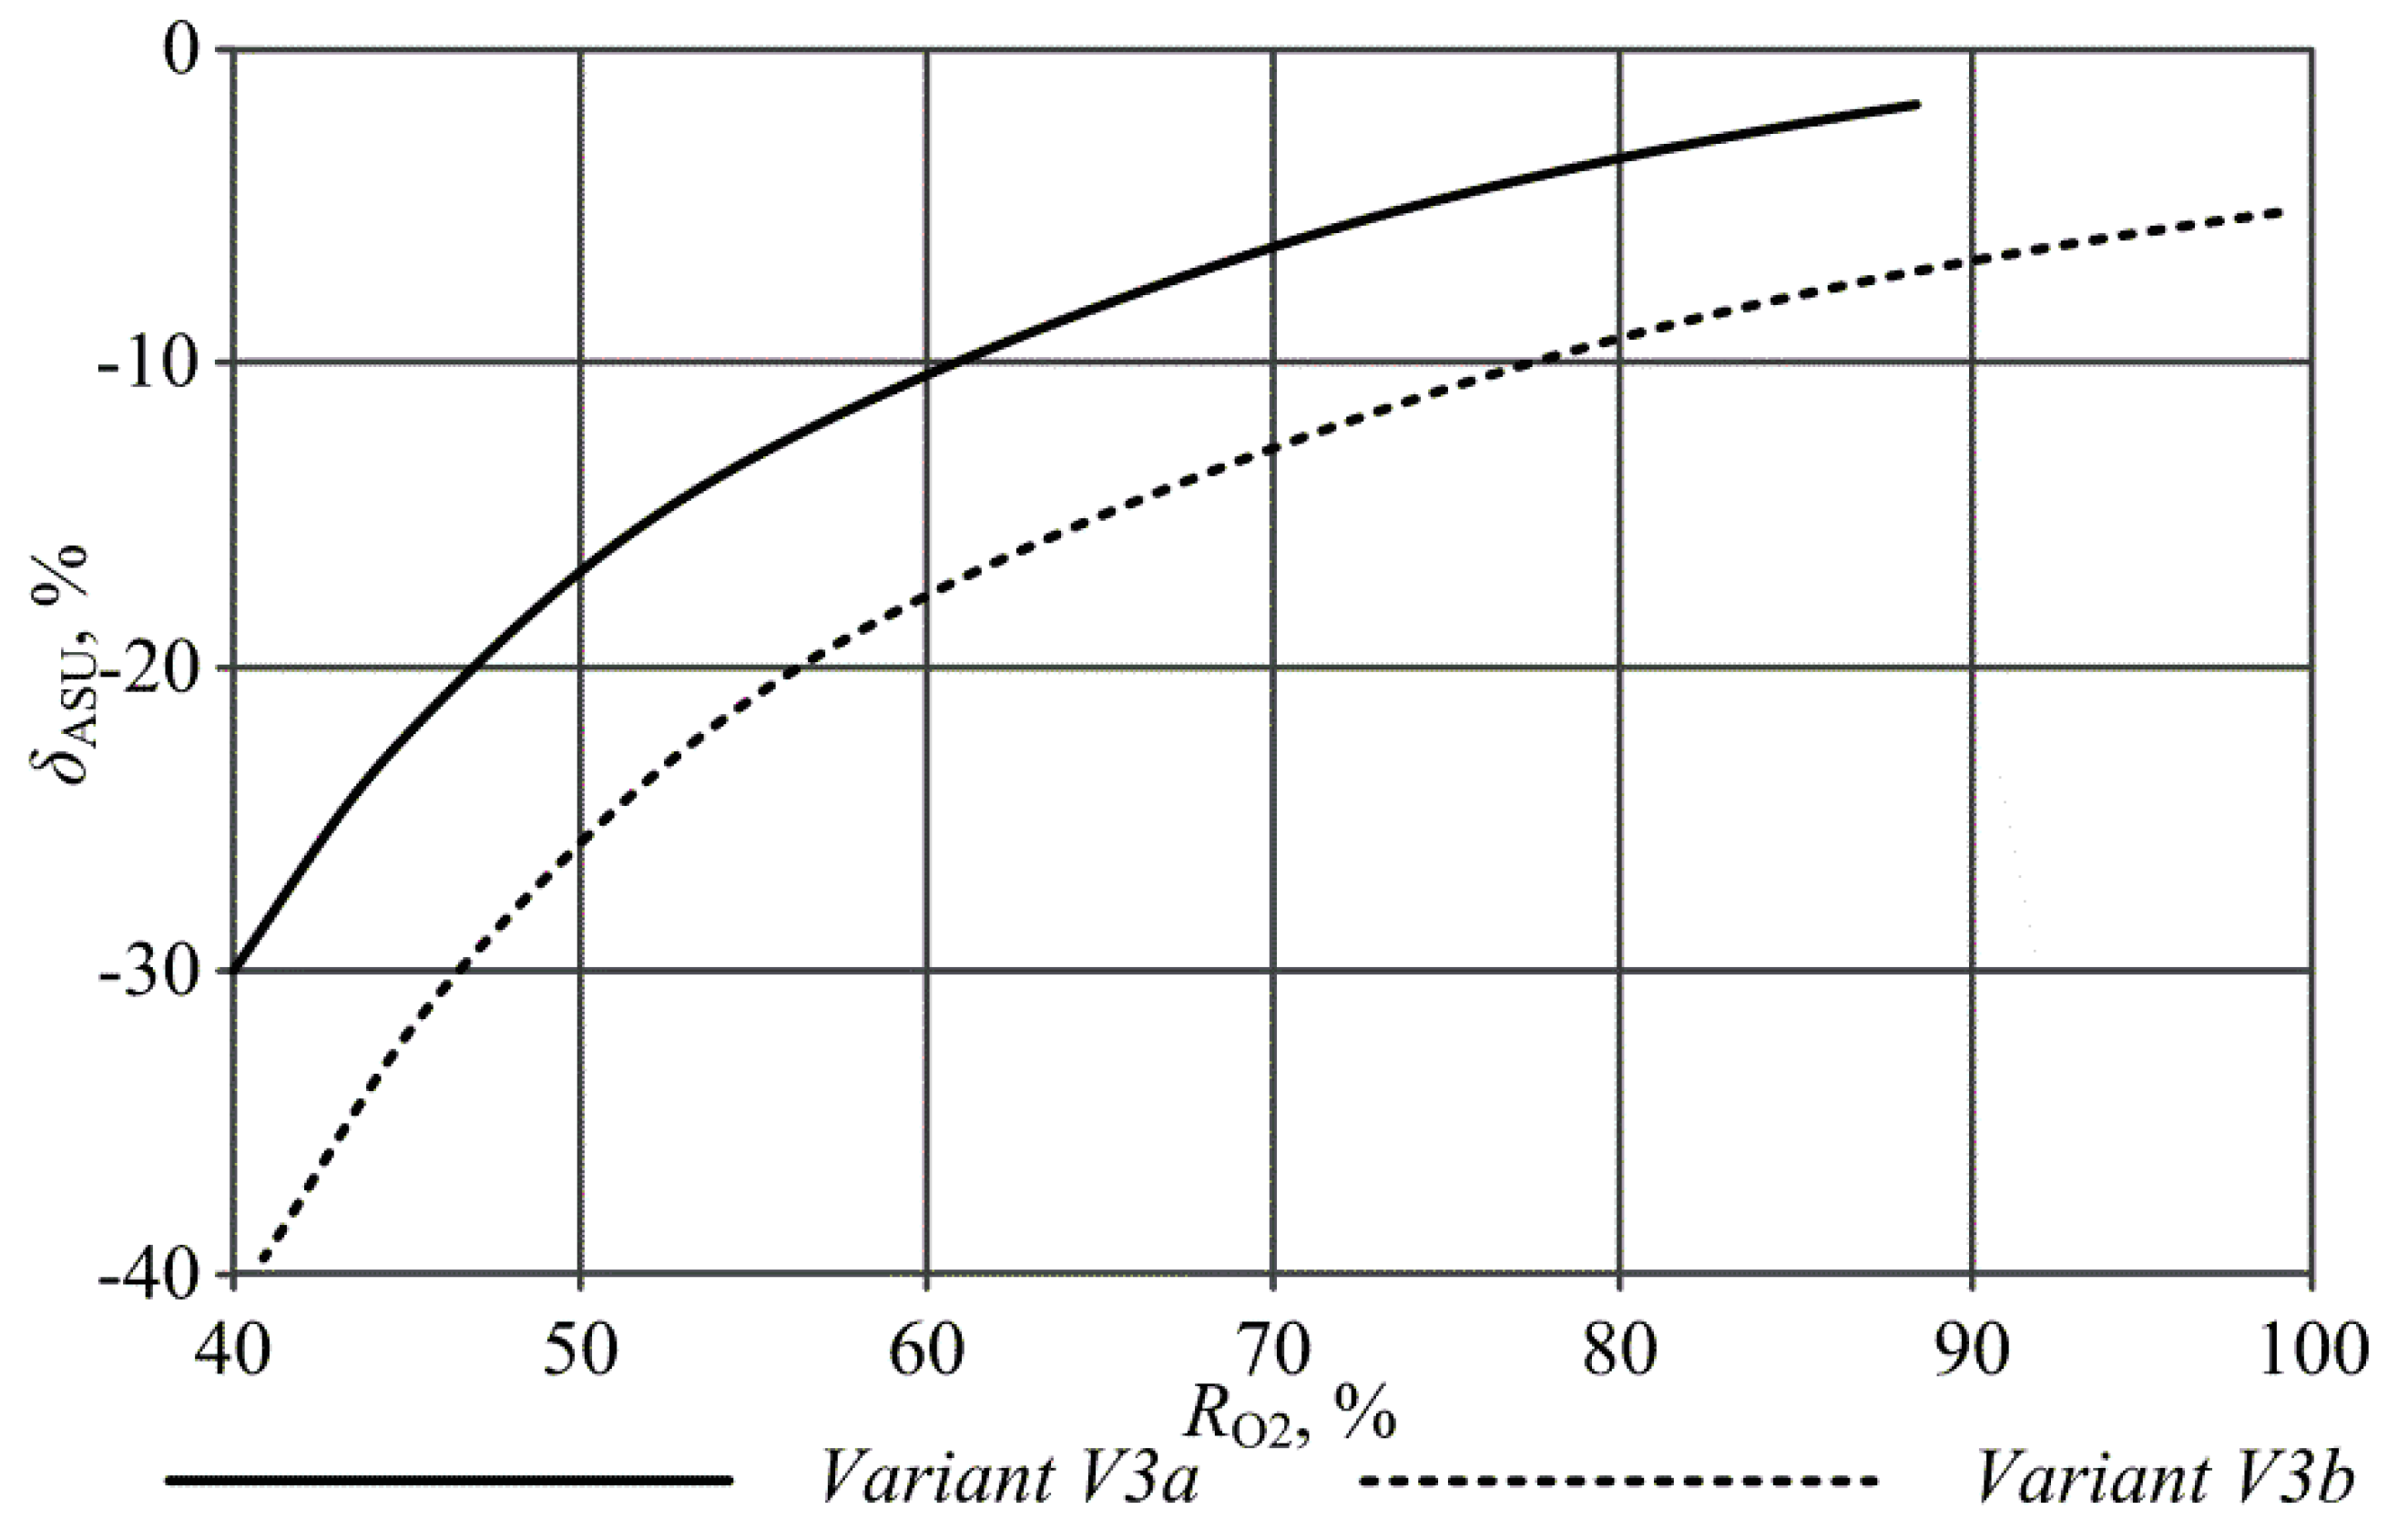
The influence of the oxygen recovery rate in the ASU on the ASU’s auxiliary power rate is presented in
Figure 13 for variants V3a and V3b. This auxiliary power rate increased with the increase in the oxygen recovery rate and this quantity had a negative value for the whole analyzed range of
. This means that the ASU did not use electricity to drive the equipment, but instead the additional electricity was generated in such installations, mainly because the power of the expander was higher than the power required by the air compressor. However, it should be remembered that the heat flux from the steam boiler was supplied to the ASU for this purpose. According to
Figure 13, the value of
for variant V3a was much higher. This was because, in this case, an additional regenerative air heater (RAH) was incorporated into the system, which significantly reduced the retentate’s expander power.
The auxiliary power rate of the V3a and V3b variants oxy-type power plants as a function of the oxygen recovery rate is presented in
Figure 14. This quantity increased as the oxygen recovery rate increased for both cases, as is the case of the ASU’s auxiliary power rate (
Figure 13). As previously described,
and
decreased with the increase in
(
Figure 12). Thus, it could be concluded that the auxiliary power rate of the power plant was influenced most by the ASU’s auxiliary power rate.
The thermal boiler’s efficiency as a function of the ASU’s oxygen recovery rate is presented in
Figure 15. This efficiency increased with the increase in
for both cases. Initially, it was higher for variant V3a until
reached a value of ~85%, and then the values for this quantity for both cases were similar.
It is possible to determine the net efficiency of the electricity generation when the thermal efficiency of the steam turbine unit (51.95%), the boiler’s thermal efficiency (
Figure 15), and the auxiliary power rate of the power plant (
Figure 14) are known.
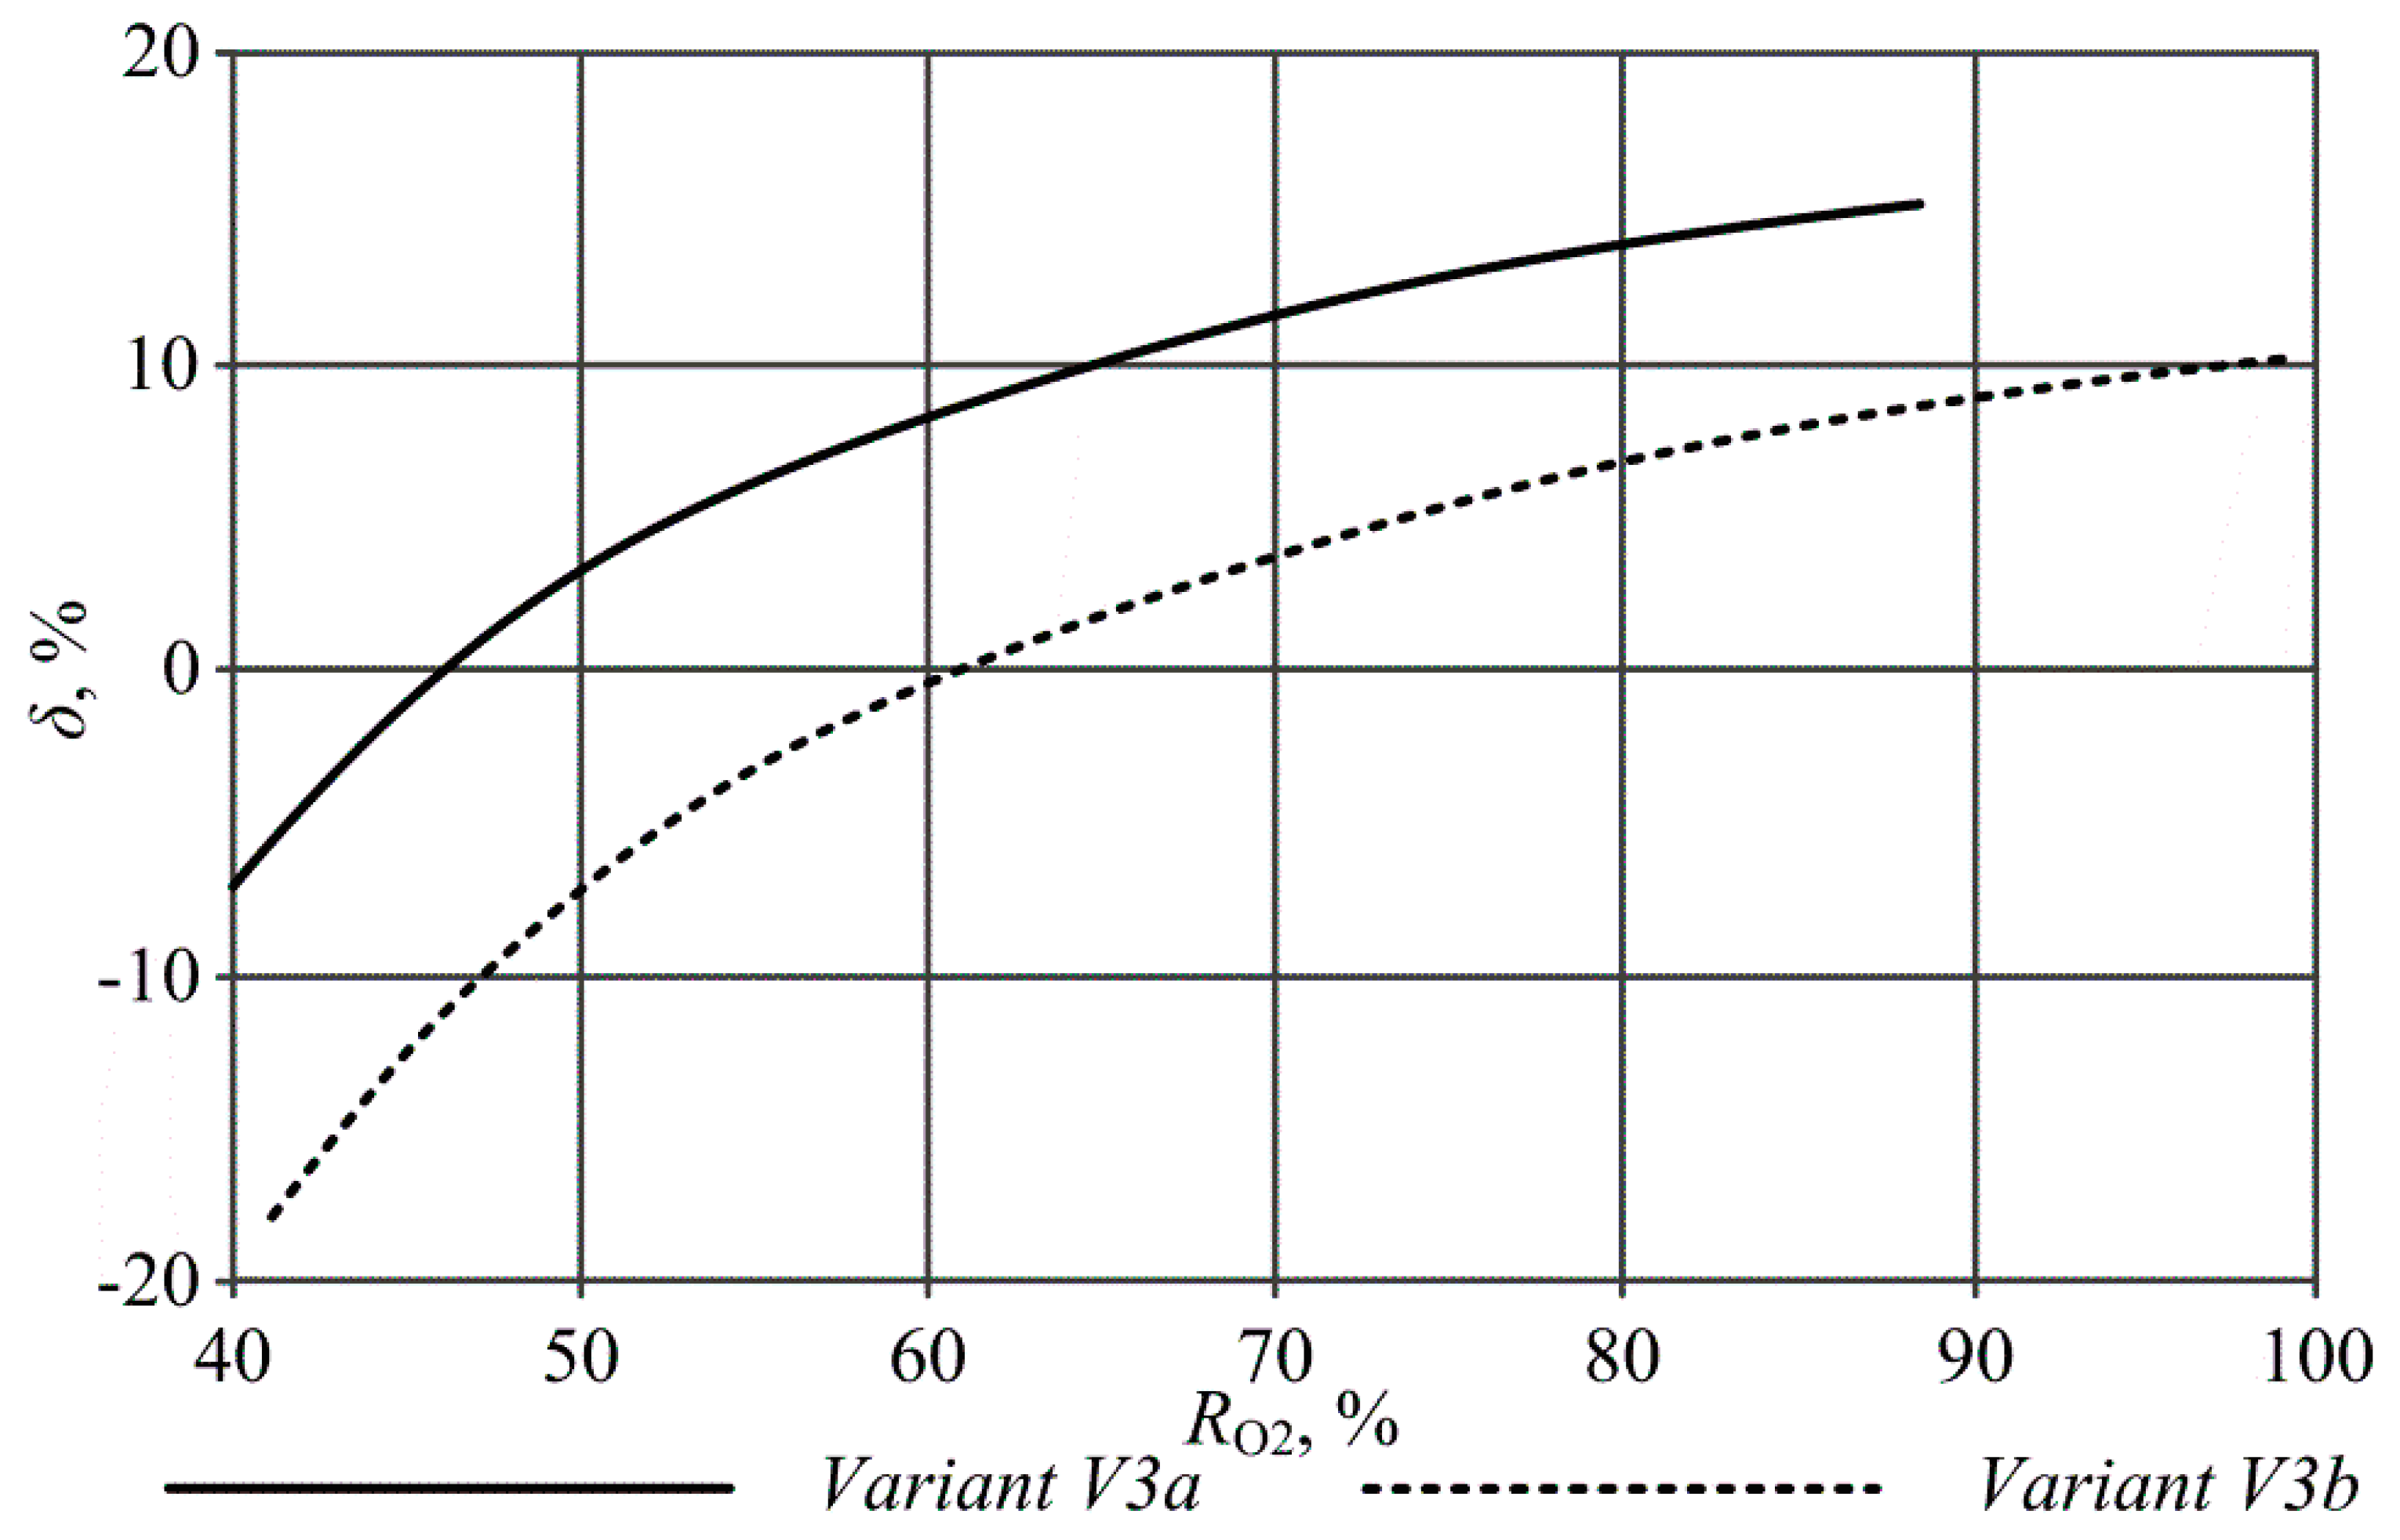
as a function of the oxygen recovery rate in the ASU for variants V3a and V3b is shown in
Figure 16. This efficiency for both cases increased with the increase in the ASU’s oxygen recovery rate. Such dependences can also be observed in the literature [
3,
65,
66,
67,
69]. Much higher values of the net efficiencies were achieved by the variant V3b of the oxy-type power plant. This was primarily because hard coal was used as the fuel in this variant. For the examples analyzed in this paper, the maximum value of
occurred for the following oxygen recovery rates: ~88.5% (variant V3a) and ~99% (variant V3b).
The thermodynamic indicators for the V3a and V3b variants of the oxy-type power plants for the ASU’s operation parameters characterized by the highest net efficiency of the power plant have been collated in
Table 7. For variant V3b, this efficiency was 7.24 p.p. lower than that for the reference power plant (variant V4b). This efficiency decrease for variant V3a was significantly higher (9.52 p.p. relative to the variant V4a reference power plant).
4.3. Analysis of Waste Heat Recovery
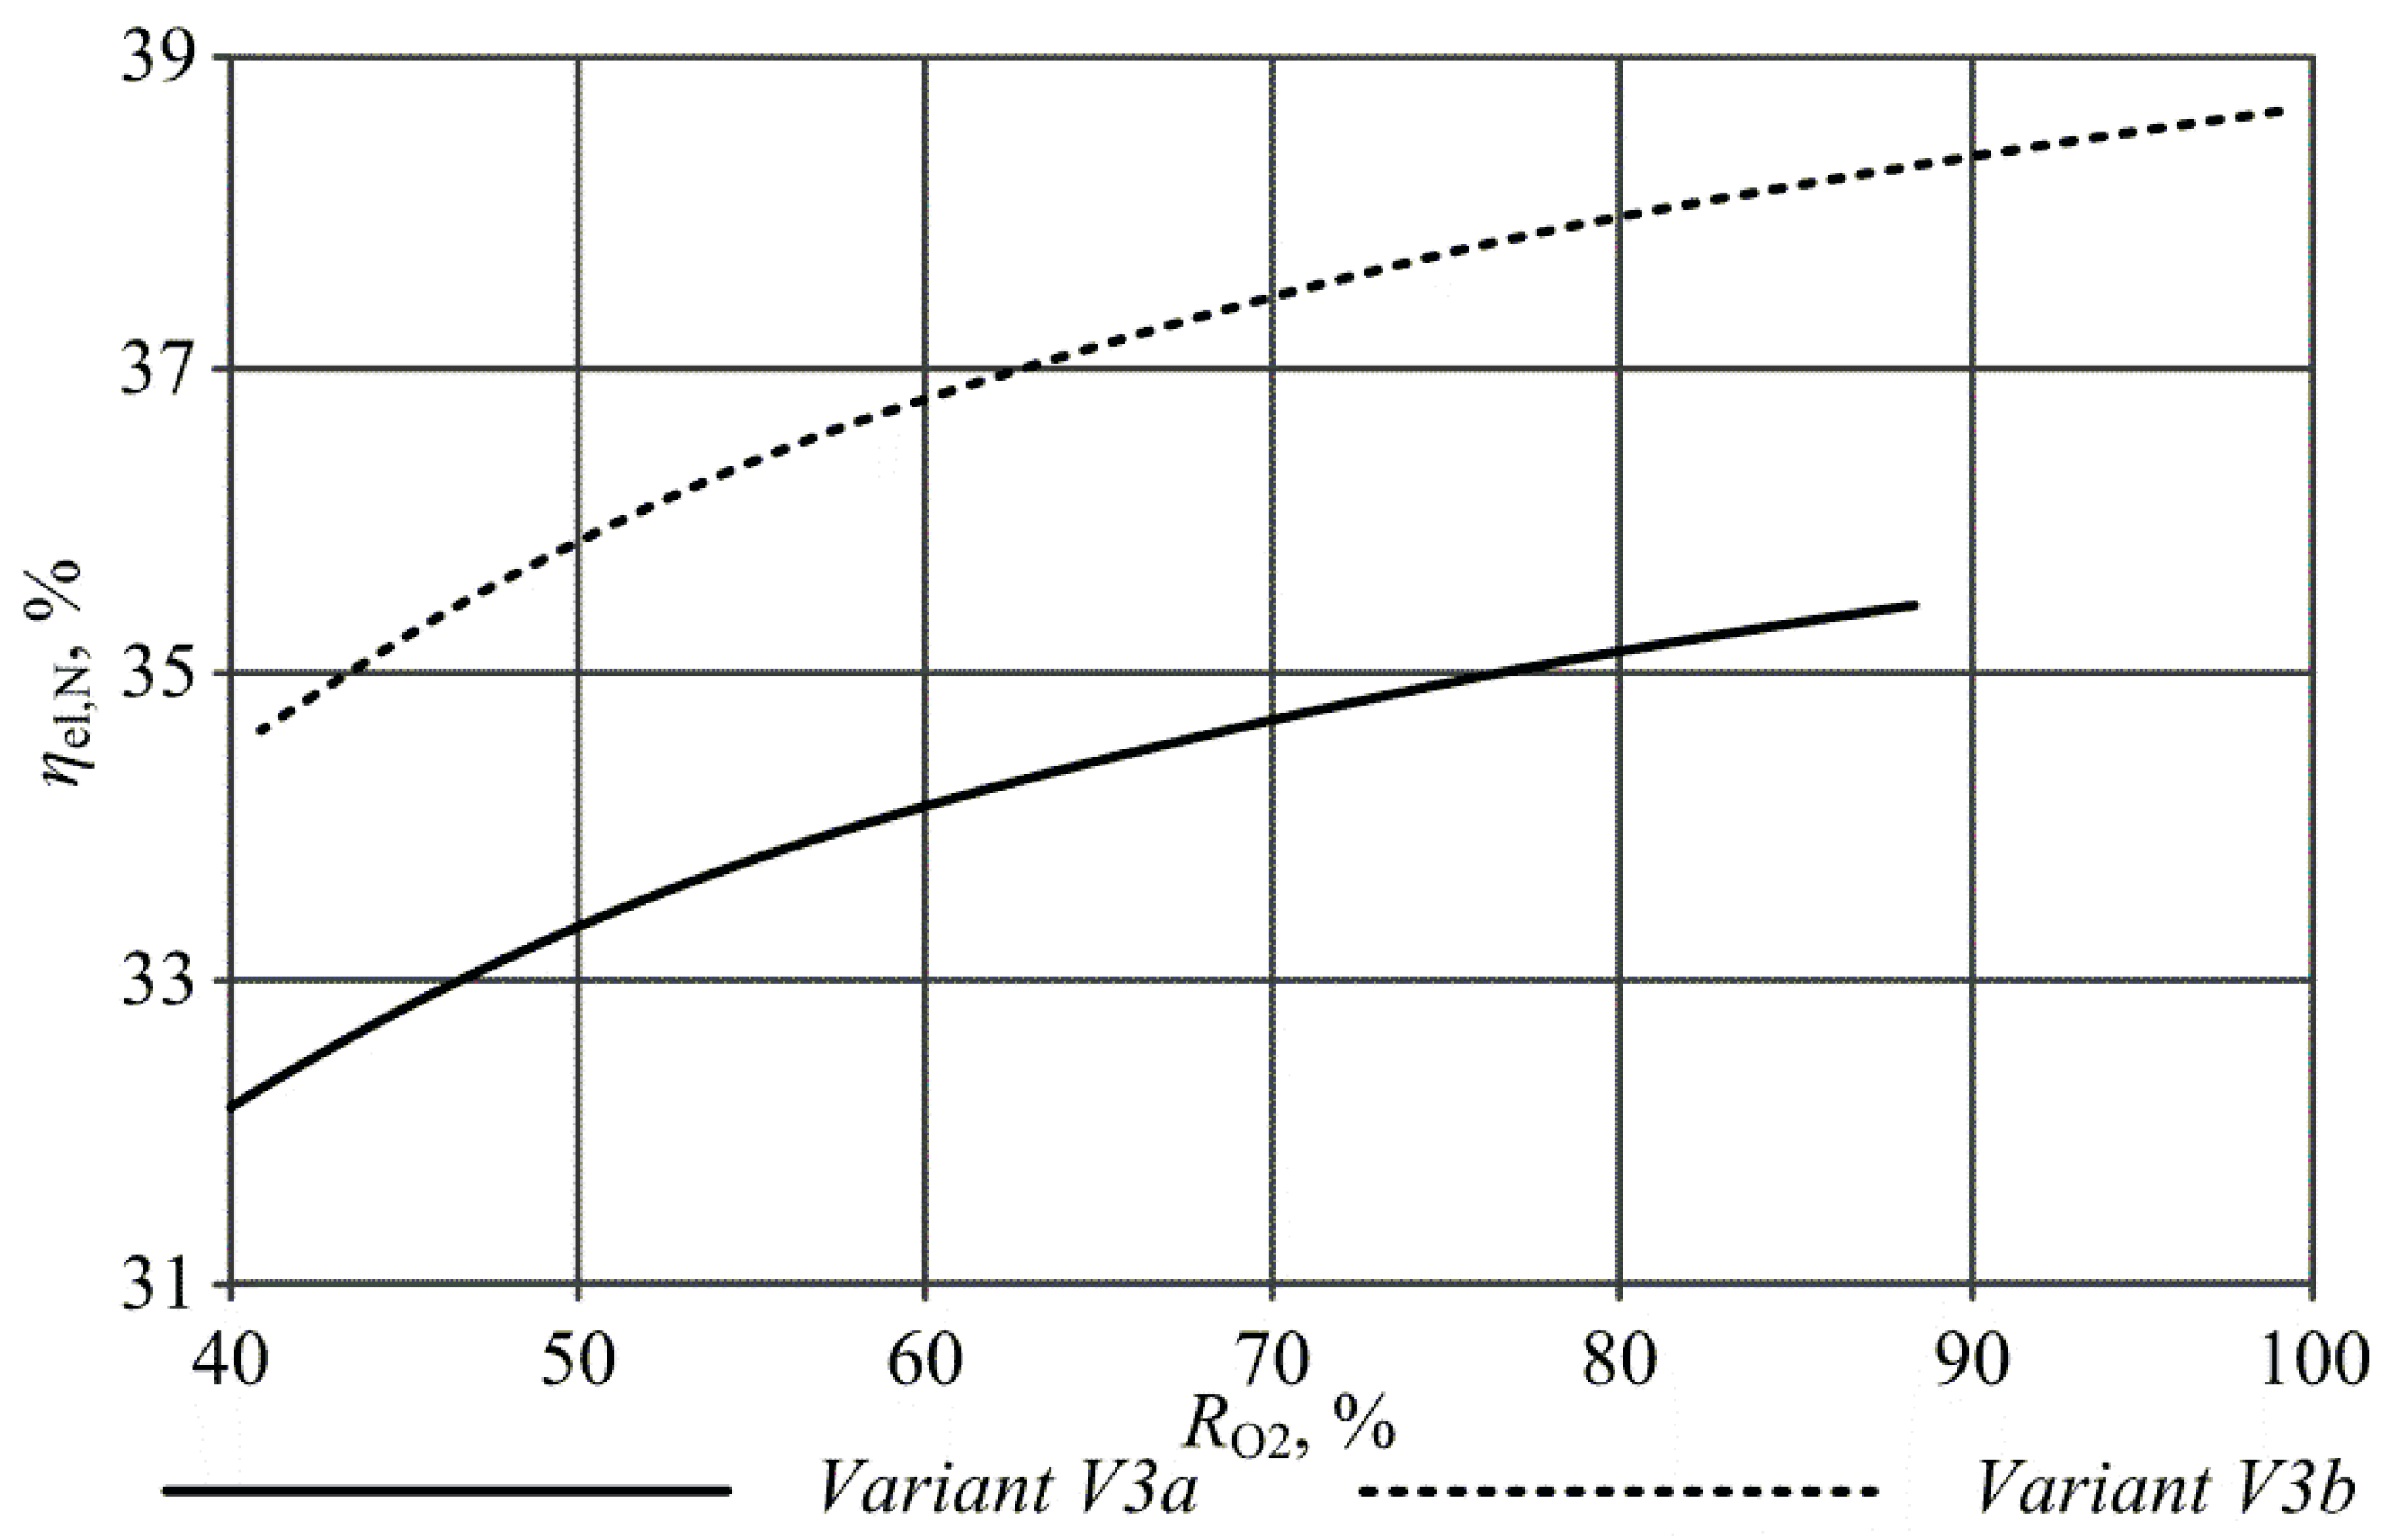
The next step for all the oxy-type power plant variants was an analysis of the use of waste heat to improve the net efficiency of the power plant. For variant V1, the first method was the introduction of a lignite dryer [
79,
80,
81]. The second method (for this variant) was to use the waste heat to heat the feedwater in the steam turbine unit, thus replacing the feedwater heaters fed with steam (for example, with heat exchangers fed with flue gas). The gas left after the separation of the oxygen from the air (mostly consisting of nitrogen) was used in the first method as the drying medium. This gas was preheated in an additional nitrogen heater positioned parallel to the OH heat exchanger in the boiler (
Figure 4). During the analysis of the lignite dryer, the influence of such parameters as the drying medium’s flow rate on the boiler’s thermal efficiency was identified. The results of this analysis are presented in
Figure 17 on the assumption that the temperature decrease in the drying medium in the lignite dryer was 60 K. Increasing the drying medium’s flow rate caused a significant increase in the boiler’s thermal efficiency. In this variant, it was only possible to increase
up to ~92.8% (if the whole nitrogen flow rate from the ASU was used, about 386 kg/s).
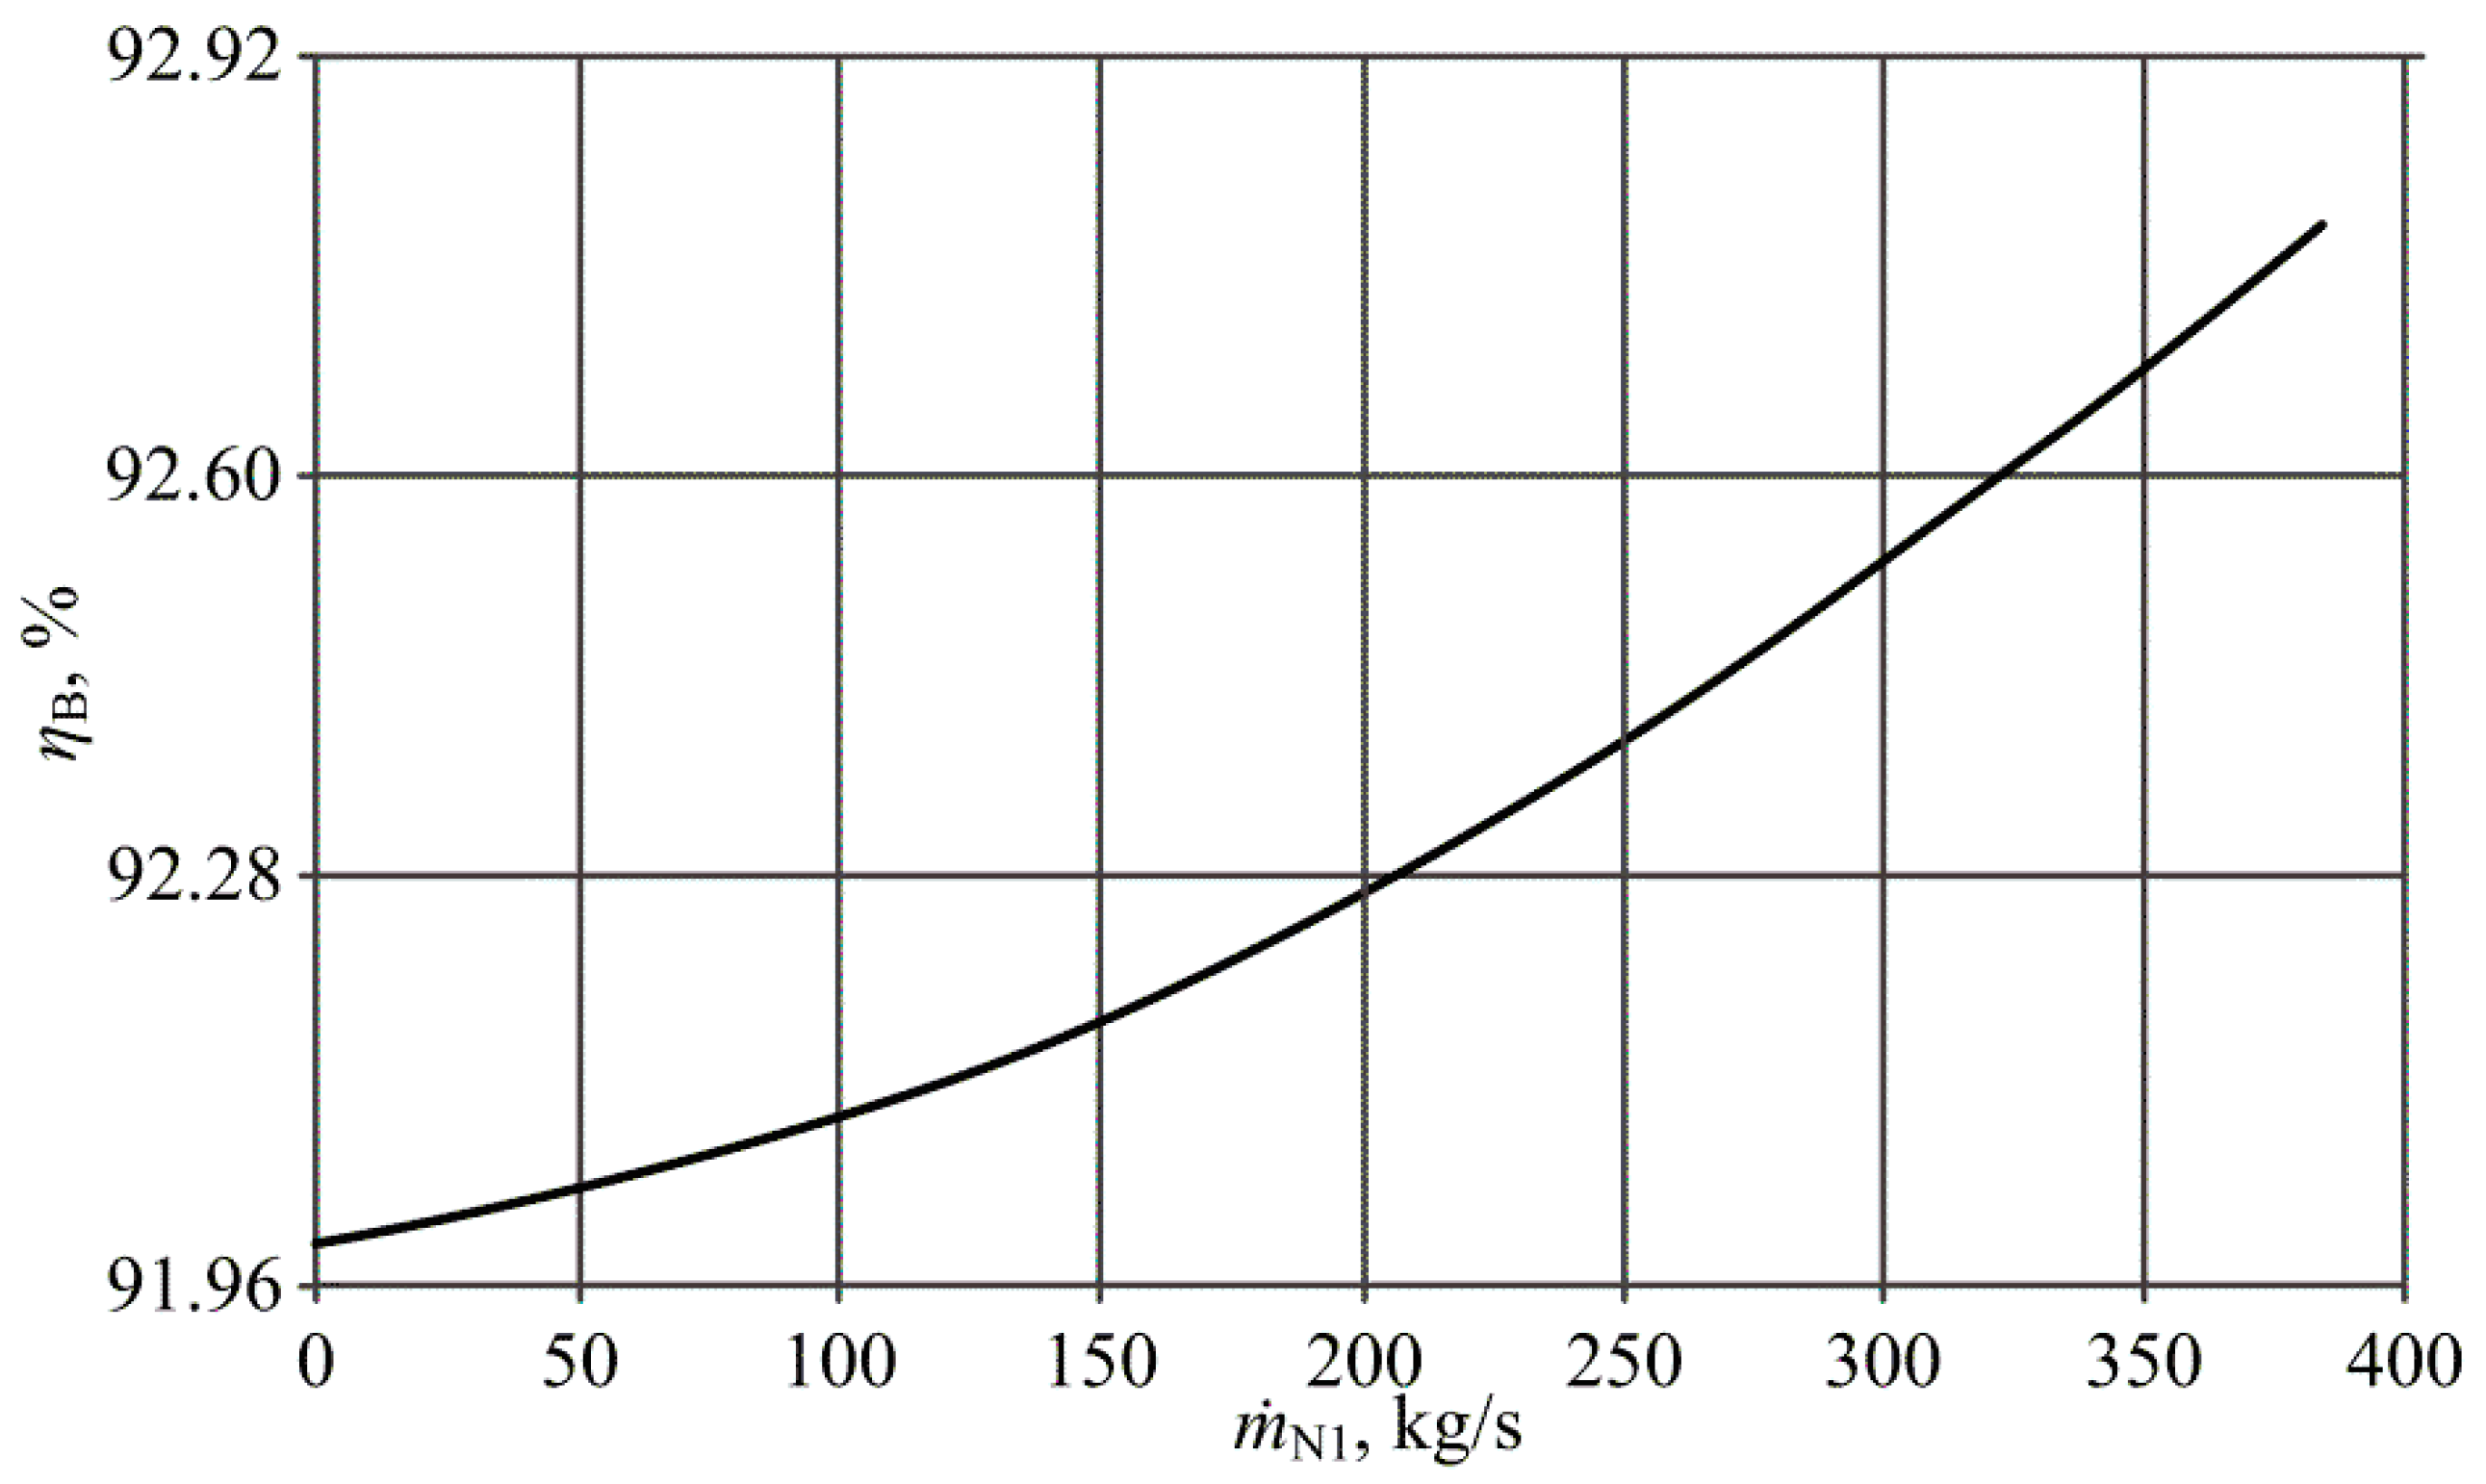
The effect on
of increasing the drying medium’s flow rate and decreasing the pressure of the air at the air compressor’s outlet (point P1 in
Figure 4) is presented in
Figure 18 with a curve labeled “A”. The drying medium’s flow rate increased up to its maximum possible value (~386 kg/s) during the computation. The analysis showed that there was a significant potential for improving the net efficiency of the power plant. This efficiency increased by ~1.5 p.p. (including a 0.4 p.p. increase associated with the lignite drying) to the value of ~34.1%.
In the second method of waste heat recovery, the heat from the ASU’s air intercoolers (AIC1, AIC2, AIC3, and AIC4 in
Figure 4) and the CC unit’s flue gas intercoolers (FIC1, FIC2, and FIC3 in
Figure 3) was used to heat the feedwater in the steam turbine unit. The main assumptions during this analysis were the invariability of the temperatures at the inlets and outlets of the replaced regenerative feedwater heaters presented in
Figure 2. A similar approach has been described in the literature [
42,
59,
60,
62,
67]. This thermal integration of the ASU and CC unit with a steam turbine unit enabled the removal of two steam bleeds (which supplied the WH1 and WH2 heat exchangers presented in
Figure 2), resulting in a 7.17 MW increase in the gross electric power of the power plant. The net efficiency of electricity generation as a function of the air compressor’s outlet pressure and the drying medium’s flow rate for the variant V1 of the oxy-type power plants with replaced WH1 and WH2 heat exchangers is presented in
Figure 18 (curve “B”). In the whole range of
and
,
increased by ~0.6 p.p. The maximal value of this efficiency was 34.7%.
Drying the hard coal before the combustion process resulted in a much lower improvement in efficiency than in the case of drying the lignite. Thus, in the variant V2 of the oxy-type power plants the waste heat was used only for the feedwater heating in the steam turbine unit. For this purpose, the thermal integration of the ASU and CC unit with the steam turbine unit was carried out. As in the previous variant (V1), the heat from the air intercoolers and the flue gas intercoolers was used to replace the feedwater heaters. This thermal integration enabled the removal of two steam bleeds (which supplied the WH1 and WH2 heat exchangers), resulting in a 7.17 MW increase in the gross electric power of the power plant (the same as in variant V1). The net efficiency of this type of oxy-type power plant reached 36.8%. The efficiency presented in
Figure 11 increased by 0.6 p.p. (after the replacement of the WH1 and WH2 heat exchangers).
For variant V3a, as in previous cases, analyses were conducted for the use of waste heat for drying the lignite (as in variant V1) and replacement of the regenerative feedwater heaters within the steam turbine unit (as in variants V1 and V2). The results of these analyses are presented in
Figure 19. Drying the lignite caused a change in the value of the net efficiency of electricity generation. The maximum value of this efficiency was measured for an oxygen recovery rate of ~47%. The heat flux from the flue gas intercoolers (in the CC unit) and the drying medium on outlets of the lignite dryers was used for the replacement of the regenerative feedwater heaters in the steam turbine unit in this type of oxy-type power plant. As a result, the amount of heat was sufficient to replace only the first low-pressure regenerative feedwater heater (WH1) [
65,
66]. The results of this analysis are presented in
Figure 19 with the curve labeled “WH1 replacement”. Across the whole range of the oxygen recovery rate, the replacement of the WH1 heat exchanger caused a 0.2 p.p. increase in the net efficiency of the power plant.
For variant V3b, the authors in References [
3,
69] analyzed the use of waste heat to replace the regenerative feedwater heaters in the steam turbine unit. This method, unlike the analogous methods in the previous variants (V1, V2, and V3a), was performed from the assumption that the individual regenerative feedwater heaters could be replaced either entirely (as before) or partially. This method used the heat contained in the flue gas on the inlet of the flue gas dryer (FD in
Figure 7) and the gas at the outlet of the expander in the ASU. The influence of the oxygen recovery rate (the amount of waste heat largely depended on this quantity) on the gross electrical power of the power plant and, thus, on the gross and net efficiency of the power plant, was analyzed. The results are presented in
Figure 19 with a dashed line. For oxygen recovery rates smaller than or equal to 44.6%, it was possible to replace all the low- and high-pressure regenerative feedwater heaters. Thus, for this value of
the net efficiency of the power plant had the maximum value. According to the analysis presented by Gopan et al. [
82], the power plant’s efficiency could be increased by over 6 p.p. with the use of the staged, pressurized oxy-combustion (SPOC) process (compared to the atmospheric pressure oxy-combustion technology). The net efficiency of electricity generation across the whole analyzed range of
provided higher values with the V3b variant of the oxy-type power plant (as in
Figure 16).
4.4. Description of the Reference Power Plant Variants
The reference power plant for the analyses performed on four examples of an oxy-type power plant consisted of a steam turbine unit and a classic steam boiler (in which air was used as the oxidant). The following two examples of a reference power plant were considered in this paper:
Variant V4a—the reference power plant equipped with a lignite-fired, fluidized-bed boiler;
Variant V4b—the reference power plant equipped with a hard-coal-fired, pulverized-fuel boiler.
In both cases, the same steam turbine unit was used as in all the oxy-type power plant variants (
Figure 2). The lignite used in variant V4a as a fuel had the same lower heating value and composition as in variants V1 and V3a. While in variant V4b, the same fuel (hard coal) was used as in variants V2 and V3b. The boilers in the reference power plant were modeled using stoichiometric calculations. It was assumed that the fluidized-bed boiler’s thermal efficiency was 93% and the thermal efficiency for the pulverized-fuel boiler was 95%. The auxiliary power rates for both reference power plants were 7%. The thermodynamic quantities (such as net efficiency of the power plant) that were determined have been presented in
Table 8.
4.5. Summary of the Thermodynamic Analysis Results
The results of the thermodynamic analyses of the four variants of the oxy-type power plant are summarized in
Table 9. The air compressor pressure ratios were assumed based on the parametric study of each case of oxy-type power plant [
60,
61,
66,
67]. The presented results are for the operational parameters of the ASU characterized by the maximal values of net efficiency of electricity generation (presented in
Figure 11,
Figure 18 and
Figure 19).
According to the results presented in
Table 9, the largest decrease in the net efficiency of electricity generation (compared to the reference power plant) occurred in the variant V1 of the oxy-type power plant (10.2 p.p.). The oxygen separation method implemented in this case was one of the oldest and most technologically advanced methods of gas separation. The auxiliary power rate of the ASU was the highest among all the analyzed examples (13.14%), which resulted in the highest auxiliary power rate for the power plant (28.86%). For variant V2, the net efficiency decrease was 1 p.p. lower than in variant V1. This was due to the use of oxygen membrane separation before the cryogenic installation and the use of hard coal as the fuel (the ASU’s auxiliary power rate was ~2.3 p.p. lower and the power plant’s auxiliary power rate was ~5.5 p.p. lower). However, the use of high-temperature membranes for oxygen separation resulted in a significant reduction in the net efficiency decrease (compared to the reference power plant) to 4.86 p.p. (variant V3a) and 4.30 p.p. (variant V3b). The lower value of this decrease in efficiency in variant V3b was related to a large amount of heat resources used to replace the regenerative feedwater heaters in the steam turbine unit. In both cases, a significant decrease in the boiler’s thermal efficiency was observed, but the negative values for the ASU’s auxiliary power rates resulted in a significant increase in the net efficiency of the power plant. The unit’s CO
2 emission (related to the net power of the power plant) decreased from 108.36 kg/MWh (variant V1) to 66.84 kg/MWh (variant V3b).


