1. Introduction
With the development of modern cyber-technologies, Internet technology has developed rapidly and we have entered an era of interconnection with everything. The emergence of Internet technology has brought us into a new world of interconnection, which now makes networking a very important and indispensable part of our modern life, providing us with convenience and promoting the current progress of society.
However, this technology also brings us lots of security problems caused by malicious network intrusions. According to the report of Kaspersky Laboratory in the second quarter of 2018, more than
malicious intrusions have been launched in 187 countries, which is significantly higher than the number of previous quarters. Moreover, the cyber attacks against mobile devices have also shown an unexpected trend of explosion (as is shown in
Figure 1) due to the popularity of mobile networking, which aggravates the severity of the situation. The most well-known network attack is probably the “WannaCry virus” ransomware incident. It affected many computers and application systems, as well as telecommunication systems, transportation systems, energy production management systems, and industrial control systems in 2017.
In addition, more and more malicious attackers have begun to pay their attention to critical infrastructures, such as the smart city, power transmission, and so on. Once these facilities are subjected to cyber attacks, there will be tremendous trouble in the future. Therefore, protecting devices and systems against malicious attacks has become an important and urgent task, since this intrusion can result in great risks.
IDS, proposed by Anderson [
1], is a method/way to protect application systems from malicious attacks, which is considered as the second defending line. It collects, analyses, and distinguishes valid information, including the packet size, packet characteristics, attacker behaviour models, and access rules. Today, IDS has become a hot research topic and a thorny issue [
2] due to the increasing amount of data generated by the Internet. Therefore, it makes sense to design an effective IDS, and it is an active security defending strategy that is used widely in the information field.
There are many studies on IDS, and it can be divided into two parts: the signature-based IDS, and the anomaly-based IDS. In order to design and improve the performance of IDS, scholars have proposed many methods, including statistics [
3], data mining [
4], the artificial immune system [
5], clustering-based method [
6], decision tree (DT), [
7] and so on. What captured our attention was the methods based on machine learning algorithms, such as the artificial neural network. Although these methods are effective at detecting malicious behavior, they are also unable to cope with many other problems.
However, the updated hacker technology and powerful attack abilities can generate a massive amount of data with so many characteristics, such as a huge number of samples, many new attack types, and imbalanced data distribution. Those problems are prevalent in the current cyber world, which undoubtedly reduces the performance of IDS. As is known to us, the traditional IDS cannot perform well while grappling with these issues, such as the HT-assisted DoS attacks (sinkhole and blackhole attacks) in embedded systems [
8]. Besides, the requirement of fast detection is also an urgent thing. Therefore, discovering how an IDS can be designed to satisfy this need is still a huge challenge.
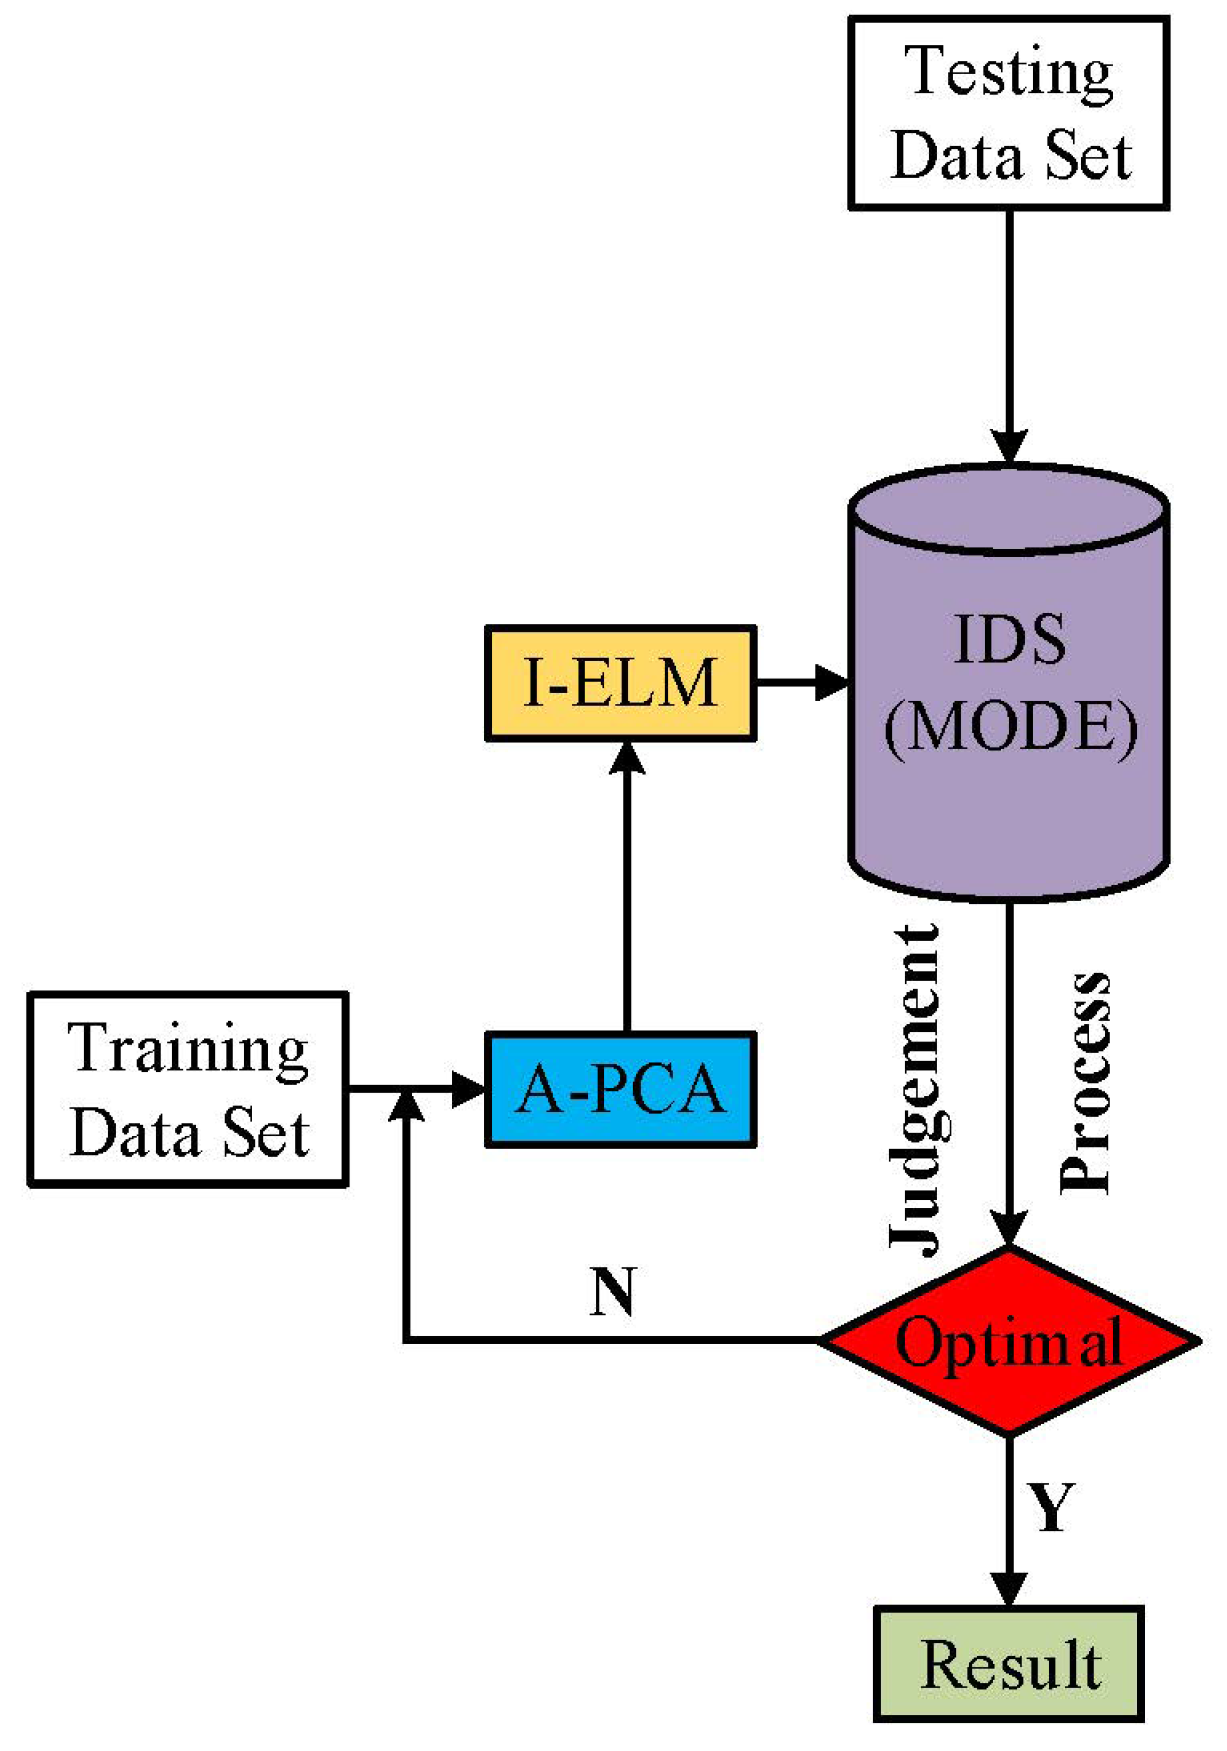
In order to help improve the detection accuracy and solve these problems, a method is proposed by us in this paper. It combines the incremental extreme learning machine [
9] (I-ELM) with adaptive principal component analysis (A-PCA) as our IDS’s detection algorithms. The A-PCA is used to extract effective features automatically according to the parameter constraints, and the I-ELM is responsible for detecting malicious attacks, as is shown in
Figure 2.
The major contributions of our paper are summarized as follows: (1) A new method based on I-ELM is proposed in IDS, which is an adjustable network structure ELM and can minimize training error to solve the over-fitting problem, so as to enhance the anomaly detection accuracy. (2) Our method has better performance to identify new types of cyber-attacks. (3) This method provides more computation capacity than SVM, BP, and CNN, which is suitable for dealing with massive data. (4) The proposed method proposed by us has shown different characteristics that are very suitable for IDS, and not only provides better performance but also reduces the consuming time.
The rest of this paper is organized as follows: in
Section 2, we present some related research about IDS to explain the reasons for applying the algorithm. A method named the incremented extreme learning machine with adaptive principal component analysis" is selected by us to detect abnormal network action in
Section 3. Then,
Section 4 introduces the NSL-KDD dataset and NSW-NB15 dataset to test our method of IDS, which is followed by the experimental results and discussion. Finally,
Section 5 concludes the whole paper. The last part describes future work.
2. Related Work
The IDS was firstly proposed by Anderson, and was designed to be a security device used to detect malicious actions on communication networks. The critical part of IDS is the classification method. Many people have been devoted to designing an IDS to protect application systems from intrusions. The traditional IDS was aimed at distinguishing abnormal actions of network environments, which is usually based on statistics technology. However, traditional IDS cannot deal with the above-mentioned problems in
Section 1.
Anomaly detection is actually a two-class problem; that is to say, it can separate normal data from abnormal data by its functions. Due to the research and development of artificial intelligence, lots of machine learning algorithms have been widely applied in IDS. Usually, the model of IDS is trained by the training dataset with known attack types. Therefore, many surveillance models are designed to distinguish anomalies in the working environment, such as a collision-free surveillance model in the Internet of things [
10], data mining in a smart grid [
11], and a UAV surveillance framework in the smart city [
12]. However, the most typical and common surveillance learning algorithms in IDS models are the deep belief network [
13], the artificial neural networks (ANN) [
14], the support vector machine (SVM) [
15], the extreme learning machine [
16], the Convolutional Neural Network (CNN) [
17], and so on, which have also made IDS achieve great progress in anomaly detection. The above-mentioned methods can be used alone or combined with other algorithms.
Although they have all achieved good performance in IDS, they still have many inevitable problems. If we want to obtain a perfect classification efficiency when we use these methods, we must get a great quantity of high-quality datasets to train them, which is usually difficult to meet due to the network dataset with massive samples and imbalanced distribution. Besides, they all have their shortcomings. The BP neural network algorithm has some obvious weaknesses, such as the slow convergence speed, long training time, and the local optimum instead of global optimality. SVM is suitable for processing a small dataset, but is unsuitable for a huge dataset with lots of samples. The CNN is required to adjust its parameters. Moreover, they will lead to a high false alarm rate and take more time to train their networks. Faced with the cyber-dataset with new types of attacks, huge number of samples, uneven and imbalanced data distributions, and highly complex structures, they tend to be more incompetent.
However, we found that there was another neural network algorithm named the incremental extreme learning machine (I-ELM), which is an improvement of ELM [
9,
18]. It possesses many advantages, such as stronger learning ability, faster convergence and training, the convenience of approximating a nonlinear function, higher detection efficiency, and especially its training speed, which is thousands of times faster than other methods [
18,
19]. It is obvious that these capabilities are well-suited for dealing with such massive samples of datasets. I-ELM is an adjustable network structure ELM, and can minimize the training error by adding nodes to solve the overfitting and under-fitting [
9,
20,
21], which overcomes some disadvantages that it needs to optimize all parameters, and lacks appropriate activation functions. Usually, a one-hot encoding method is adopted to keep the original information of the dataset and avoid distribution interference of samples, which is also able to increase the dimension degree and decrease the cost time in the training network, as well as over-fitting. An adaptive principal component analysis (A-PCA) is helpful for reducing the feature dimension and retaining as much information as possible. Therefore, we figured that a combination of these would be ideal for our security framework design. The NSL-KDD dataset, with a massive amount of data and imbalanced sample distributions, can be applied to test our method.
However, the dataset of NSL-KDD used by us was derived from KDD-CUP99 datasets. It also has many shortcomings of the KDD-CUP99 dataset [
22,
23,
24,
25], such as: (1) the lack of new attack types, (2) a lack of real cyber-world property, (3) a failure to solve the constant changes in attacks and network architectures, (4) little new network service features, and (5) unclear emergence of the selection of network traffic. It is important that the values of the connection’s content features are always set to be greater than zero, which will affect the capabilities of machine learning algorithms without a doubt. The low detection accuracy of “R2L” and “U2R” could be a result of this reason. Although this dataset deletes a great deal of redundant samples in KDD-CUP99, it does not have enough of a proper reason. All of these serious flaws may lead to a lack of practicability and validity in our model. As a result, in order to further verify detection effectiveness and make it as least time-consuming as possible, the latest dataset, named UNSW-NB15, was also chosen for application in our paper [
25,
26,
27].
3. Principles of the Method
In this section, we demonstrate a method named incremental ELM (I-ELM), which is an improvement from ELM, and adaptive principal component analysis (A-PCA), which is a combination of the adaptive control idea and PCA.
3.1. I-ELM
I-ELM is a kind of incremental adjustable structure ELM, which is different from the feedback neural network algorithm, such as the BP-neural network. Due to the lack of feedback calculation, ELM obviously has stronger learning capabilities, and faster convergence and training. A typical I-ELM structure is shown in
Figure 3.
The parameters
and
of the hidden nodes of I-ELM are usually independent of each other. Firstly, we assumed that we had a dataset
, and this network construction has
n hidden nodes. Thus, the output function of the network is:
where
,
, and
are the training parameters of I-ELM. Among them,
and
denote the input weights and the connection linking the output weights of the
ith hidden node, respectively.
is the threshold value of the
ith hidden node, and
denotes the
ith hidden node’s output. If another node is added, this output becomes
.
In the I-ELM construction, it firstly always sets a new hidden node. Then, we can change the network structure through randomly adding a node one-by-one to the network.
represents the network error function of the current I-ELM with
n hidden nodes, and
is the output function we want to achieve. Thus, the following I-ELM iteration function can be obtained:
Huang et al. [
9,
19,
20] also proved that if
, and
are any type of function sequence, it could get a probability of 1 when
:
where
,
and
are the training parameters of I-ELM. Among them,
is the input weight,
is the output weight, and
represents the bias of the the hidden node, respectively.
is the output activation function, and
is the output for the hidden node,
j. Usually, due to the need to calculate the integral in reverse, I-ELM adopts the activation function
and
. The function
can map the input variables from
to
, which meet the probabilistic requirements
. This excellent property makes ELM always use it as an activation function. The purpose of choosing the appropriate activation function and training process using this machine learning is to find some appropriate parameters that can match the training dataset without error.
3.2. A-PCA
Usually, the same kind of data in datasets have a higher concentration and different types of data, which means the variance in the former data is smaller. Principal component analysis (PCA) is based on this principle, and it constructs a set of orthogonal bases to project the high-dimensional data to a hyperplane to convert the high-dimensional data to relative low-dimensional data. At the same time, making the variance of the reduced dataset as large as possible is helpful for retaining most of the original information.
PCA is a data-driven approach, which is applied to data compression and image processing [
28], artificial intelligence [
29], fault diagnosis [
30], decision analysis, and so on. The purpose of using PCA is to reduce the dimensionality of the dataset and keep the original variation by preserving the most important information as much as possible.
The following is the principle of PCA. We have a dataset
with
N samples, as mentioned above. It can be assumed that every sample has a feature set
, of which
m is the maximum sample feature. Thus, the whole dataset
can show that:
Firstly, an average observed value
and an average deviation of observed value
are defined here:
Then, it can be get the
from the decentralization of all samples:
And we get the covariance matrix of the dataset:
Thus, we can use the singular value decomposition to get the eigenvalue and the eigenvector of the covariance matrix , which correspond to each other, respectively. Furthermore, is the maximum linearly independent eigenvector with . Therefore, it can reconstruct a new sample space by choosing some eigenvectors according to the value of the eigenvalue.
Adaptive principal component analysis (A-PCA) is a method that combines the adaptive control theory with PCA, which selects the features after being decomposed by PCA by comparing the given performance indicators we set by automatically adjusting the step size of r to compress the dataset according to the value of and dimension after using PCA.
This can be defined as
, with the following details.
where
r is the ratio of A-PCA, and
is the accuracy of I-ELM.
Finally, the work of I-ELM and A-PCA can be described in
Figure 4.
3.3. Evaluation Criteria
In this subsection, we want to select some standard performance criteria to evaluate the IDS’ performance. There are many quotas to evaluate it. For this paper, we chose the most commonly used indicators, including detection accuracy (
), detection rate (
), detection of the false alarm rate (
), and the training and testing time of IDS (
T). They are shown in
Table 1, and a confusion matrix shown in
Table 2. We will show some concepts before we give the specific definitions of the evaluation criteria.
• The Number of True Positive ()
This is the sum of the normal sample in the dataset, which is judged by IDS as a normal sample.
• The Number of False Positive ()
This is the sum of the abnormal sample in the dataset, which is misjudged by IDS as a normal sample.
• The Number of False Negative ()
This is the sum of the normal sample in the dataset, which is misjudged by IDS as an abnormal sample.
• The Number of True Negative ()
This is the sum of the abnormal sample in the dataset, which is judged by IDS as an abnormal sample.
• The Starting Time of IDS ()
• The Ending Time of IDS ()
Therefore, the following can be obtained:
Therefore, the larger the is, the higher the detection accuracy will be; the larger the is, the more normal samples can be identified; and the smaller is, the fewer the samples which can be misidentified, which shows that the model’s performance of IDS is better.
4. Experiment
4.1. Experiment Platform
In order to avoid interference from the operating platform, all methods are limited to running on the same platform and using the same programming language as shown in the following
Table 3.
4.2. Dataset Explanation
4.2.1. NSL-KDD Dataset
The KDD-CUP99 dataset contains more than 5 million training samples and more than 2 million testing samples. Due to the large number of redundant samples in KDD99, a larger recognition and classification error is caused [
17]. NSL-KDD [
31] is optimized from the KDD-CUP99 dataset, which removes redundant and duplicate records and becomes the most typical dataset in IDS. The NSL-KDD dataset also has 41 features, which contain 9 discrete features and 32 continuous features. They include five types: (1) “DoS” attacks, (2) “probe” attacks, (3) “U2R” attacks, (4) “R2L” attacks, and (5) “normal”. In addition, the testing dataset contains a number of different attack patterns from the training dataset, whose details are shown in the
Table 4.
The NSL-KDD is divided into four datasets: KDDTrain+, KDDTest, KDDTrain+_20percent (a subdataset of KDDTrain+), and the KDDTest21(a subdataset of the KDDTest). The specific data distribution of four datasets are shown in
Table 5.
From
Table 5, it can be seen that the category of normal, that is, of no attack, has the most samples, which accounts for more than half of the training dataset. However, the attack categories of “R2L” and “U2R” are less than
. The situation of this problem—we call it “imbalance data”—will lead to a great identification bias. As is known to us, although the NSL-KDD dataset is lacking in new practicality, its imbalanced distribution of data can also be applied to test our method.
4.2.2. UNSW-NB15 Dataset
The UNSW-NB15 dataset was created by the Australian Center for Cyber Security (ACCS) in 2015. It is a new dataset about IDS in research. The purpose of this dataset is to solve the inherent problems of classical KDD99 and improve the NSL-KDD dataset, which contains some new types of cyber attacks and has modem normal traffic scenarios [
26,
27]. The UNSW-NB15 dataset has nine different modern attack types with 49 features, which has five more attack types than NSL-KDD.
This dataset consists of 2,540,044 samples, and includes 9 attack types, known as “Fuzzers”, “DoS”, “Analysis”, “Reconnaissance”, “Exploit”, “Shellcode”, “Worm”, “Backdoor”, and “Generic”, whose specific amount is shown in
Table 6. For easy use, it was divided into two parts: a training dataset (175,341 samples) and a testing dataset (82,332 samples). Clearly, the UNSW-NB15 dataset also has an imbalance distribution situation. The first category, “Analysis”; second category, “Backdoor”; eighth category, “Shellcode”; and ninth category, “Worms”, are also very few, whose sum is less than
of the total samples.
4.3. Data Preprocessing
4.3.1. Data Encoding for Symbolic Features
The NSL-KDD dataset contains different features, which are divided into two parts (categorical and continuous). It must convert categorical features to continuous features to ensure the deep learning can deal with them. In the NSL-KDD dataset, the second feature (protocol type), third feature (network service type of target host), and fourth feature (connection status) are symbolic, which cannot be used directly in machine learning. Other features are discrete. For our paper, we adopted a one-hot code to encode those same types of features and also to take an example of a second feature, as shown in
Table 7. After encoding, the second feature (protocol) changed from 1 to 3.
We used the same encoding method to encode the third feature (service) that includes 70 service types, meaning this feature changed from 1 to 70. In the same way, the fourth feature (flag) changed from 1 to 11. Therefore, the entire features of the dataset became 122 features (). By using the same encoding method, all 49 features of the UNSW-NB15 dataset became 183 features ().
4.3.2. Data Normalization
Different features contained in the dataset usually have different dimensions or dimensional units, and this would affect the results of data analysis. Due to this fact, it is important to eliminate the dimensional influence. At the same time, it is necessary to keep the values of each sample feature distributed uniformly [
32]. There is no doubt that normalization is the best way to resolve these problems. After data normalization, the problem of comparability between the original data’s characteristic indicators lies in the unified data scale, so as to facilitate comprehensive comparative evaluation.
For this paper, we adopted the min–max normalization method to normalize data samples, which transforms the original value to make sure that it is mapped between
. The function is as follows:
where
is the new value after normalization, and
and
are the minimum value and maximum value of the sample of the
fitting feature, respectively.
4.4. Experiments of NSL-KDD Dataset
In order to evaluate the performance of our proposed method, rigorous experiments were performed on the NSL-KDD dataset. These experiments also include SVM, the BP neural network, CNN, ELM, and I-ELM. The experimental results show that our method showed better performance.
In the paper, we used the NSL-KDDTest+ as a test dataset to test our proposed method. The details of NSL-KDDTest+ are shown in
Table 5, and we selected the best test results and recorded them a hundred times. The parameters of the algorithm are referenced in
Section 3. By adjusting the parameters, we ensured that the training accuracy was between
and
.
Firstly, five confusion matrices can be obtained from the experimental results, which are shown in
Table 8,
Table 9,
Table 10,
Table 11,
Table 12 and
Table 13. Each of them shows the detail of detection on five network behaviors (including four abnormal actions and one normal action), respectively.
From these confusion matrices, we can know that the algorithm of ELM has the best performance of detection on a third category (33, total 200), and the algorithm of I-ELM has the best performance of detection on the second category (6301, total 7458), fourth category (963, total 2754), and fifth category (9361, total 9711), and the proposed algorithm has the best performance of detection on the first category (1849, total 2421). However, the performance of our method of the other four terms is close to the best, which are (6217, total 7458), (22, total 200), (891, total 2754), and (9332, total 9711), respectively, which also shows that the generalization capability is stronger than others in identifying new attack methods.
The proposed algorithm can still achieve good performance in both of the two categories, especially in the third and fourth classes with fewer samples, which indicates that it is a better solution to the problems of dataset imbalance. Even compared with the accuracies of Wu et al. [
17], the detection accuracy of this method is the highest.
It can be seen that the detection rates
of all algorithms are similar and have little difference between them. However, the method we proposed has the best detection accuracy
and lowest detection of false alarm rates
, which indicates better performance. The time consumed is also the least, besides the method of ELM from
Table 14 and
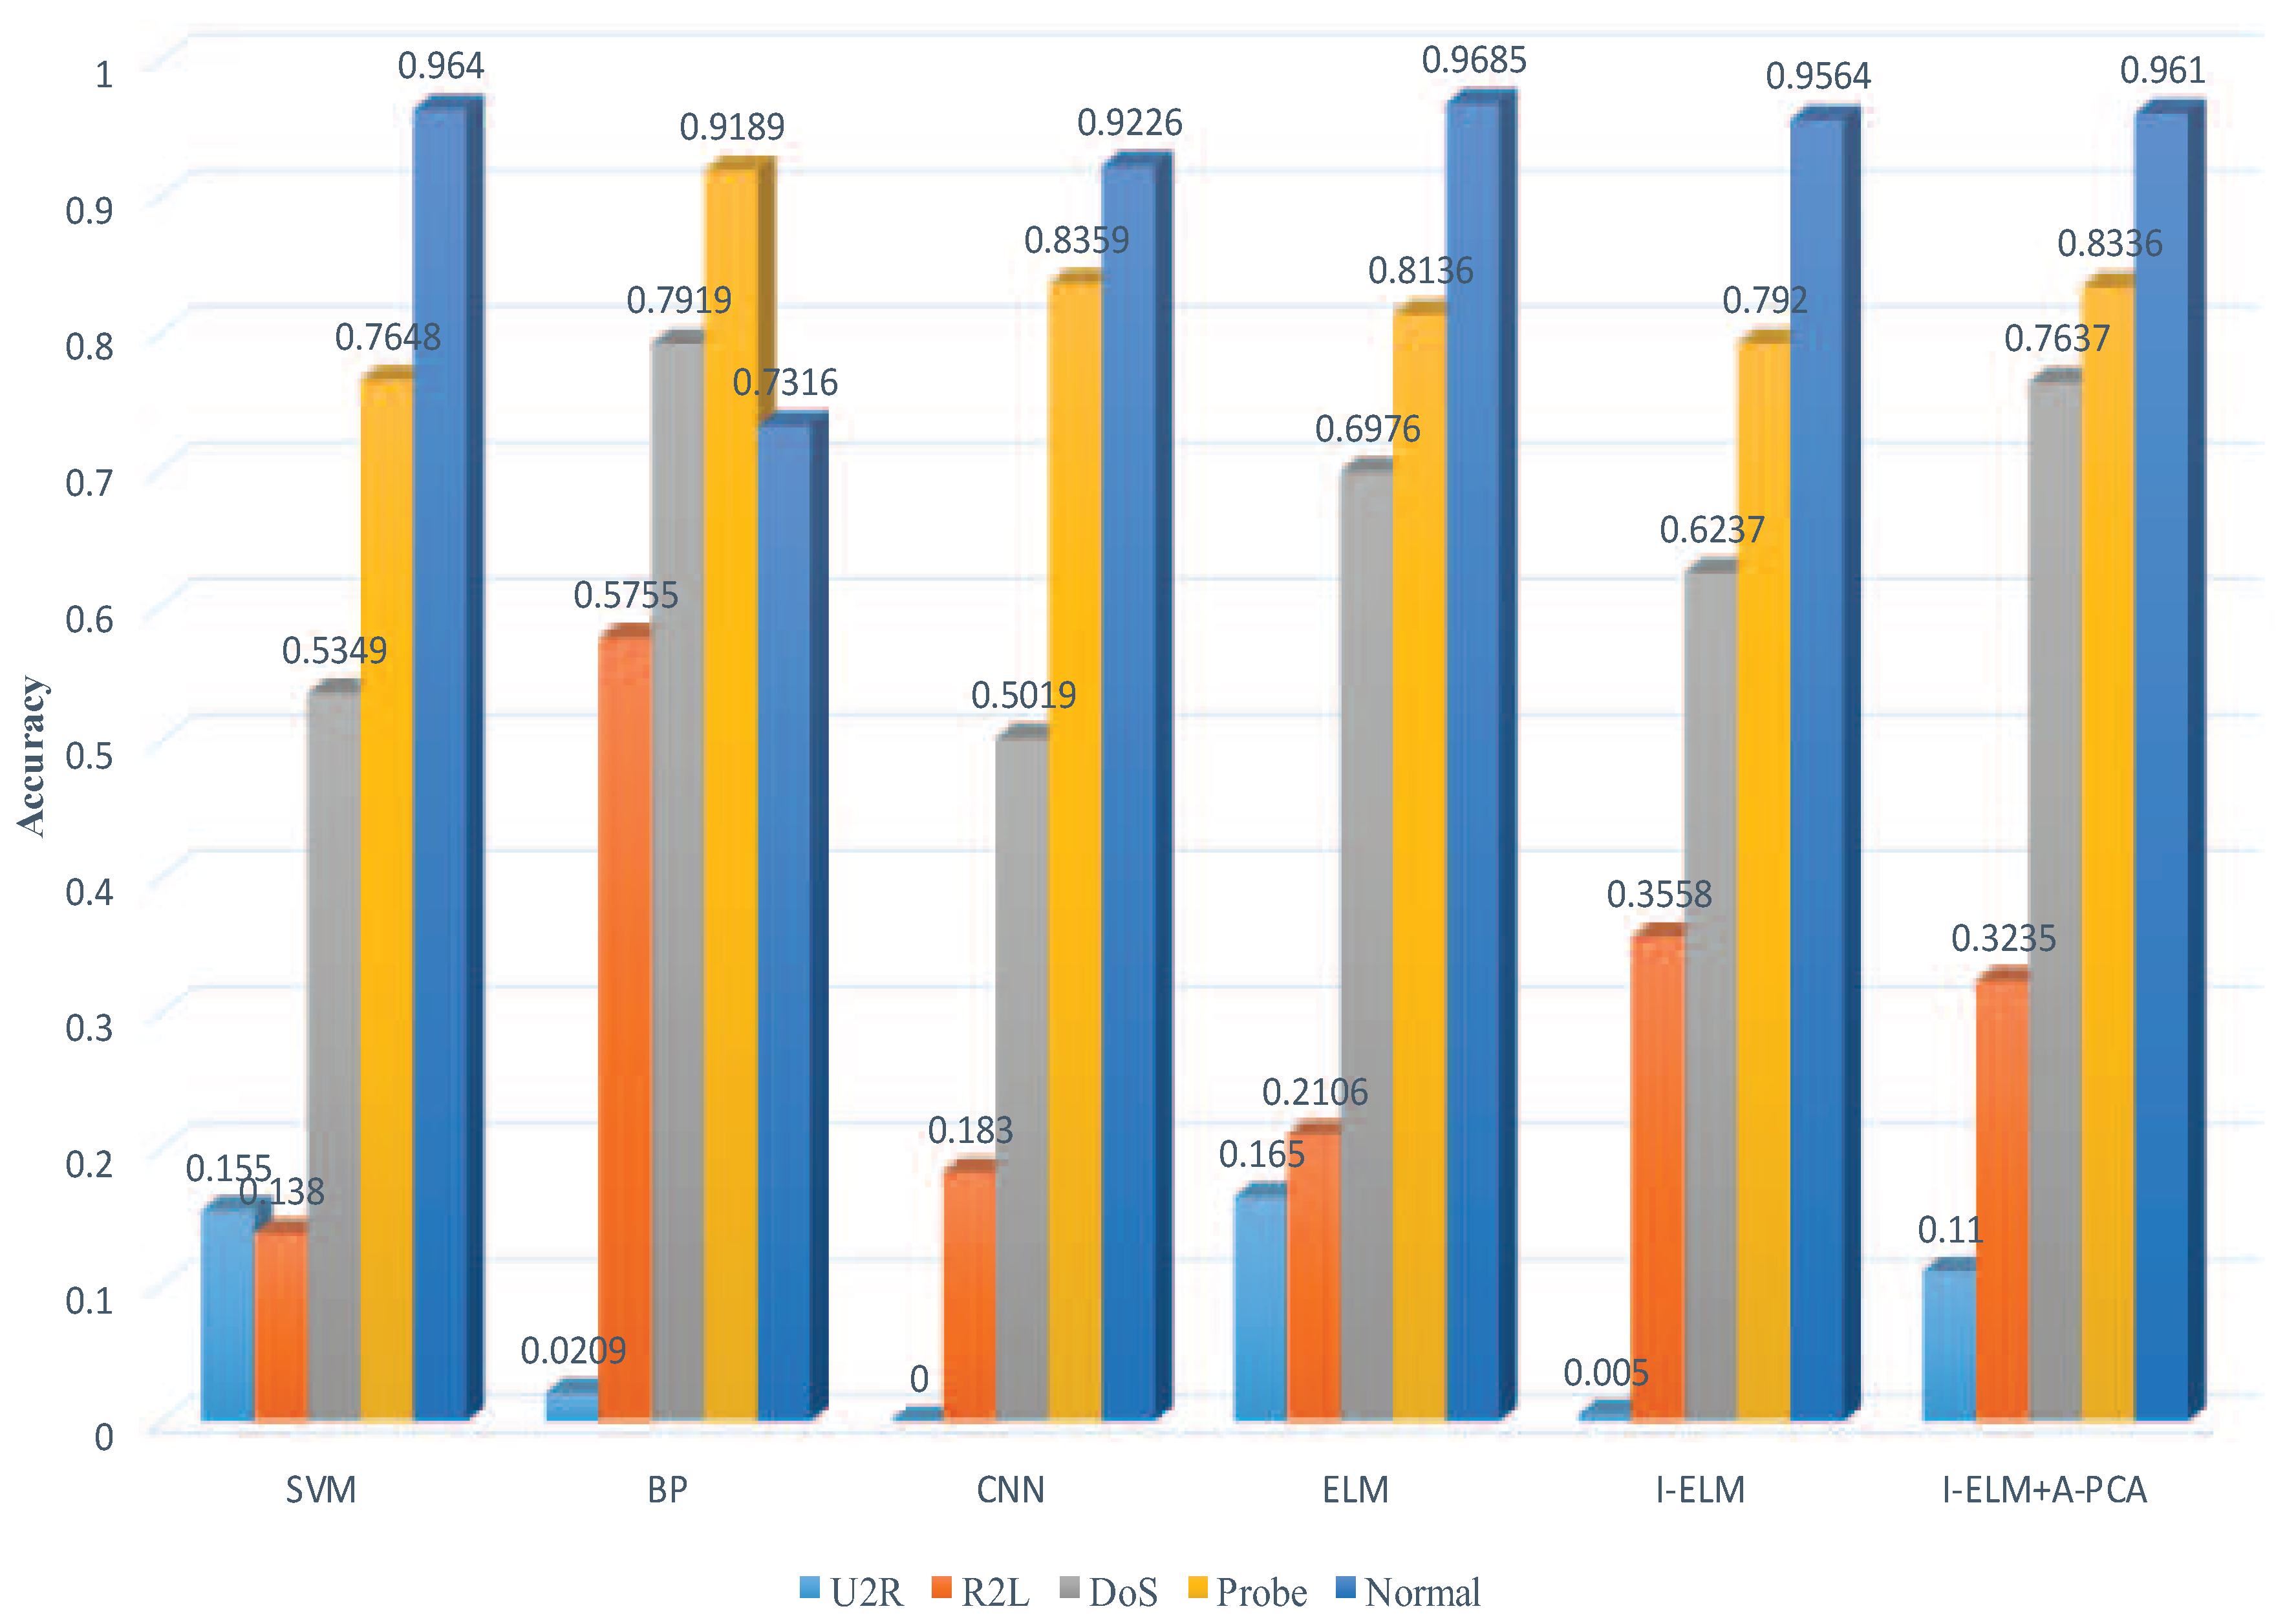
Figure 5, which also shows our method has a stronger computation capacity. We can also see the detection details of four abnormal actions, and one normal behaviour from
Figure 6.
Figure 7 shows that we can get different detection accuracies, different dimensions of new feature descriptions, and different average times after different ratios of A-PCA processing when we choose the NSL-KDD dataset. It is clear from
Figure 7 that the A-PCA algorithm makes the characteristics of new dataset space less than those of the original dataset. We can see that there are 85 dimensions of new feature space and the
when
, and that there are 86 dimensions of new feature space and the
when
—whose accuracies are better than those of different algorithms in [
17]—and the
when we used 122 dimensions of new feature space.
Besides, it is obvious that we can get the with 17 dimensions of new feature space when . These analysis results also show that the algorithm of A-PCA can reduce the dimension of the data without affecting the inherent nature of the dataset. Therefore, our proposed method has better performance than the I-ELM method without A-PCA. At the same time, our proposed method can reduce the time of training and testing.
4.5. Experiments of UNSW-NB15 Dataset
There exists a different distribution problem in the training dataset and testing dataset of the NSL-KDD dataset, which could also lead to a great identification bias and efficient disturbing of our IDS model. In order to further verify the performance of our proposed method, some experiments were also performed on the UNSW-NB15 dataset. These algorithms also include SVM, BP, CNN, ELM, and I-ELM.
In this paper, we used the training dataset of the UNSW-NB15 dataset to train our algorithm.
Table 15 shows that the detection accuracy
, the detection rates
, and the detection of false alarm rates
of all methods are different to each other. However, the method we proposed has the highest detection accuracy
and the highest detection rate
. Besides, the costing time is also lower than SVM, BP, and CNN. The detection details of nine attacks and one normal behaviour are displayed in
Figure 8.
From
Figure 9, we can get different detection accuracies, different dimensions of new feature descriptions, and different average times after different ratios of A-PCA processing when we use the UNSW-NB15 dataset. It is very clear that the A-PCA algorithm makes the characteristics of new dataset space less than those of the original dataset. When we set
, the highest detection accuracy score of
can be achieved, which is greater than the detection accuracy of
when
, and the detection accuracy of
when
.
From the above
Table 15, and
Figure 8 and
Figure 9, we know that the proposed method also has better performance by using the UNSW-NB15 dataset, not only in the field of detection accuracy but also the costing time of detection.
Although the UNSW-NB15 dataset has massive samples with many new network types, which brings a great knotty problem in IDS, the proposed method can also achieve good performance. From the
Figure 6,
Figure 7,
Figure 8 and
Figure 9, it can be seen that our method can perform well whether you use the NSL-KDD dataset with an imbalanced data distribution or the UNSW-NB15 dataset.
5. Conclusions
As we all know, the function of IDS is to find the abnormal data quickly and effectively in the dataset. Due to the imbalanced and huge amount of NSL-KDD datasets, it is necessary for the detection to solve these problems. In our research, we proposed a method used in IDS which combines I-ELM and A-PCA to detect anomalies in the network dataset.
We have compared our method with other algorithms of IDS, such as SVM, the BP neural network, CNN, ELM, and I-ELM on the performance of IDS at detecting cyber attacks using the NSL-KDD dataset and UNSW-NB15 dataset, all of which are repeated one hundred times with the same dataset on the same platform. What’s more, some indicators were selected to explain the performance of different methods. Finally, the experimental results using datasets processed by A-PCA show that the detection method proposed by us can obtain a stronger capability for detecting new attacks, meaning stronger computing power and highest accuracy, and proving that our method is a better solution to the problems of the dataset with imbalance and massive samples.


