1. Introduction
Sustainability is becoming extremely relevant in all stages of the life cycle of a commodity. A variety of questions need to be addressed in the early stages of a product such as product design, manufacturing, use, disposal, and in its effect on the society. All these phases have specific sustainability insights and metrics that should be considered. There is a desire to maneuver towards a more sustainable design and means of development. However, these requirements need to be addressed very early in the design of new products. Approximately 80% of the cost of production is determined during the design process of the product [
1], therefore, having a clear understanding of the production cost is important.
Sustainability is a broad concept which has been adopted to reflect the need for civilization to work within its own means and to use the resources and products in a manner that does not affect the quality and well-being of future generations [
2]. It is characterized by the “triple bottom line”, i.e., the need for sustaining and even reconciliating environmental, social, and economic demands. While environmental and economic expectations are conveniently exhaustive, the concept of social responsibility also encourages ethical action in relation to the structures alluded to above. The goal of sustainable social growth is to improve the rights and capabilities of individuals to lead lives that they have cause to admire, without undermining the capacity of future generations to fulfill their own human welfare needs. Such reconciliation cannot be accomplished without more effective solutions and technology which, in part, must be supported by manufacturing.
The manufacturing sector is already moving towards more sustainable practices and the research groups have proposed a range of approaches to enhance the performance of these sustainable practices. The sustainability helix [
3] is indicative of a philosophy that is focused on comparing the use and reuse of raw material models to those of nature. In a number of recent studies [
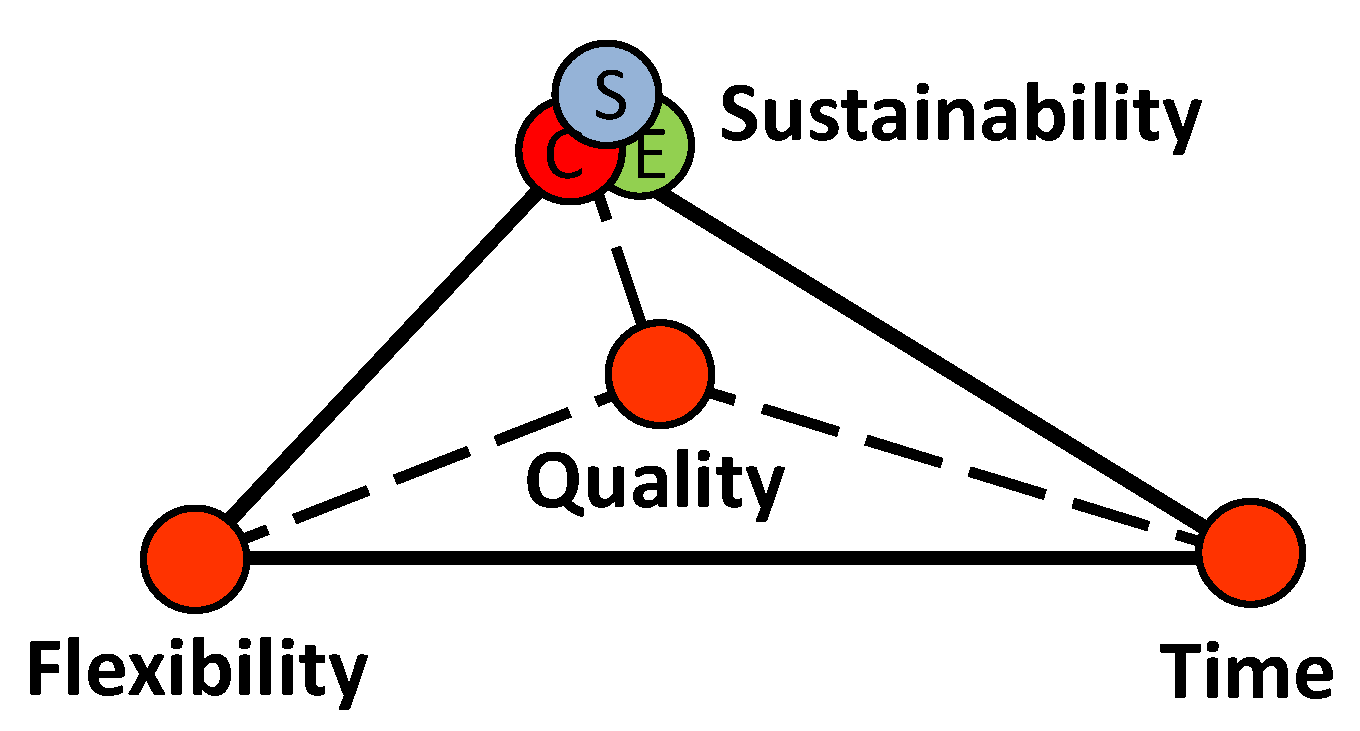
4,
5] it has been noted that there is a need to consider sustainability as one of the key manufacturing attributes (
Figure 1), essentially incorporating cost as one of the dimensions of sustainability. The other three typical qualities of production, i.e., quality, flexibility, and time are always important for the well-being of the industry.
A variety of factors, such as raw materials, supply chain requirements, production processes, use, distribution, and decommissioning influence the design of sustainable products. The social sustainability assessment brings importance to the overall viability of the product as it offers a detailed and focused review of the social footprint of the company. Nowadays, via global market boundaries and, consequently, globally distributed manufacturing cells, it is standard practice for businesses to follow a product life cycle approach aimed at preventing and shifting adverse impacts from one life cycle stage to another or from one social problem to another. Global sustainability metrics are all about well-being such as access to services, healthcare, social security, and the quality of the natural environment. Alternatively, sustainable manufacturing depends on the environmental friendliness of manufacturing plants and processes. This is measured in numerous ways, such as in terms of the energy use, water use, waste and emissions, the health and safety of its employees, etc.
The present paper discusses a framework for analyzing and assessing alternative process plans and strategies considering sustainability aspects as one of the key decision-making attributes. Such a framework would be used by a process engineer to draw up and review different process plans which could adapt to different scenarios of market needs, under the sustainability prism and performance. This paper is structured in a way to help “dive” into sustainable manufacturing from the higher level of product life cycle to product design and manufacturing system selection to boost the sustainability efficiency of an organization.
2. Life Cycle Considerations
As stated in the Introduction, product life cycle management (PLM) is essential for improving the performance of a product throughout its lifetime. However, the life of the product ranges from a few minutes in the case of aluminum cans, to more than 30 years in the case of airplanes, and even decades in the case of buildings and infrastructures. Today, one of the main principles focuses on prolonging the life of goods in order to reduce the need for new materials and the environmental effects of manufacturing. In comparison, reuse or even refurbishment of the parts before recycling and discarding will help minimize energy consumption and the effects on the environment.
The Ellen Macarthur Foundation [
6] took this concept one step further by introducing the circular economy concept. A circular economy seeks to rebuild capital. The fundamental concept is to replace a linear manufacturing model with a re-use and recycle model which improved supply of goods and services. Enhanced use of bio-based products such as molded pulp products (MPP) instead of plastics can help to achieve a smooth transition from linear to the circular economy. MPP are obtained from the molding of paper pulp (similar to the injection molding of plastics) [
7]. These products are an incredibly strong alternative to their toxic plastic counterparts, especially as a packaging material. The product life cycle of MPP is defined from the procurement of the raw materials (chipping of woods) to the end of life (disposal). A recent advancement in the category of MPP is the Green Fiber Bottle (GFB). The green product aims to replace the existing glass packaging for carbonated beverages with a sustainable paper-based packaging product [
8,
9]. From the energy perspective, efficient pulping methods could substantially reduce the cost of energy use in the preparation of paper pulp [
10,
11] and from the tooling perspective, additive manufacturing based tools for paper molding could further reduce the tooling costs and minimize the lead time for tool production [
12].
Traditionally, the environmental impact of a product during its life is assessed through the life cycle assessment (LCA). The LCA is used to assess the various emissions that both the manufacturing and the use of the component generate over the entire life of the product. The results are presented in the form of cumulative indexes such as the “eco-indicator” factor. However, the execution of the complete LCA is time and computationally demanding, and outcomes are subject to uncertainties. Since 80% of the economic impact cost is calculated at the design stage when many decisions are still uncertain, the LCA can be used to classify which process is dominant, for example, in the case of a civil aircraft, almost 95% of the energy is consumed during the use of the machine, whereas for furniture production, most of the energy consumption occurs during its manufacturing.
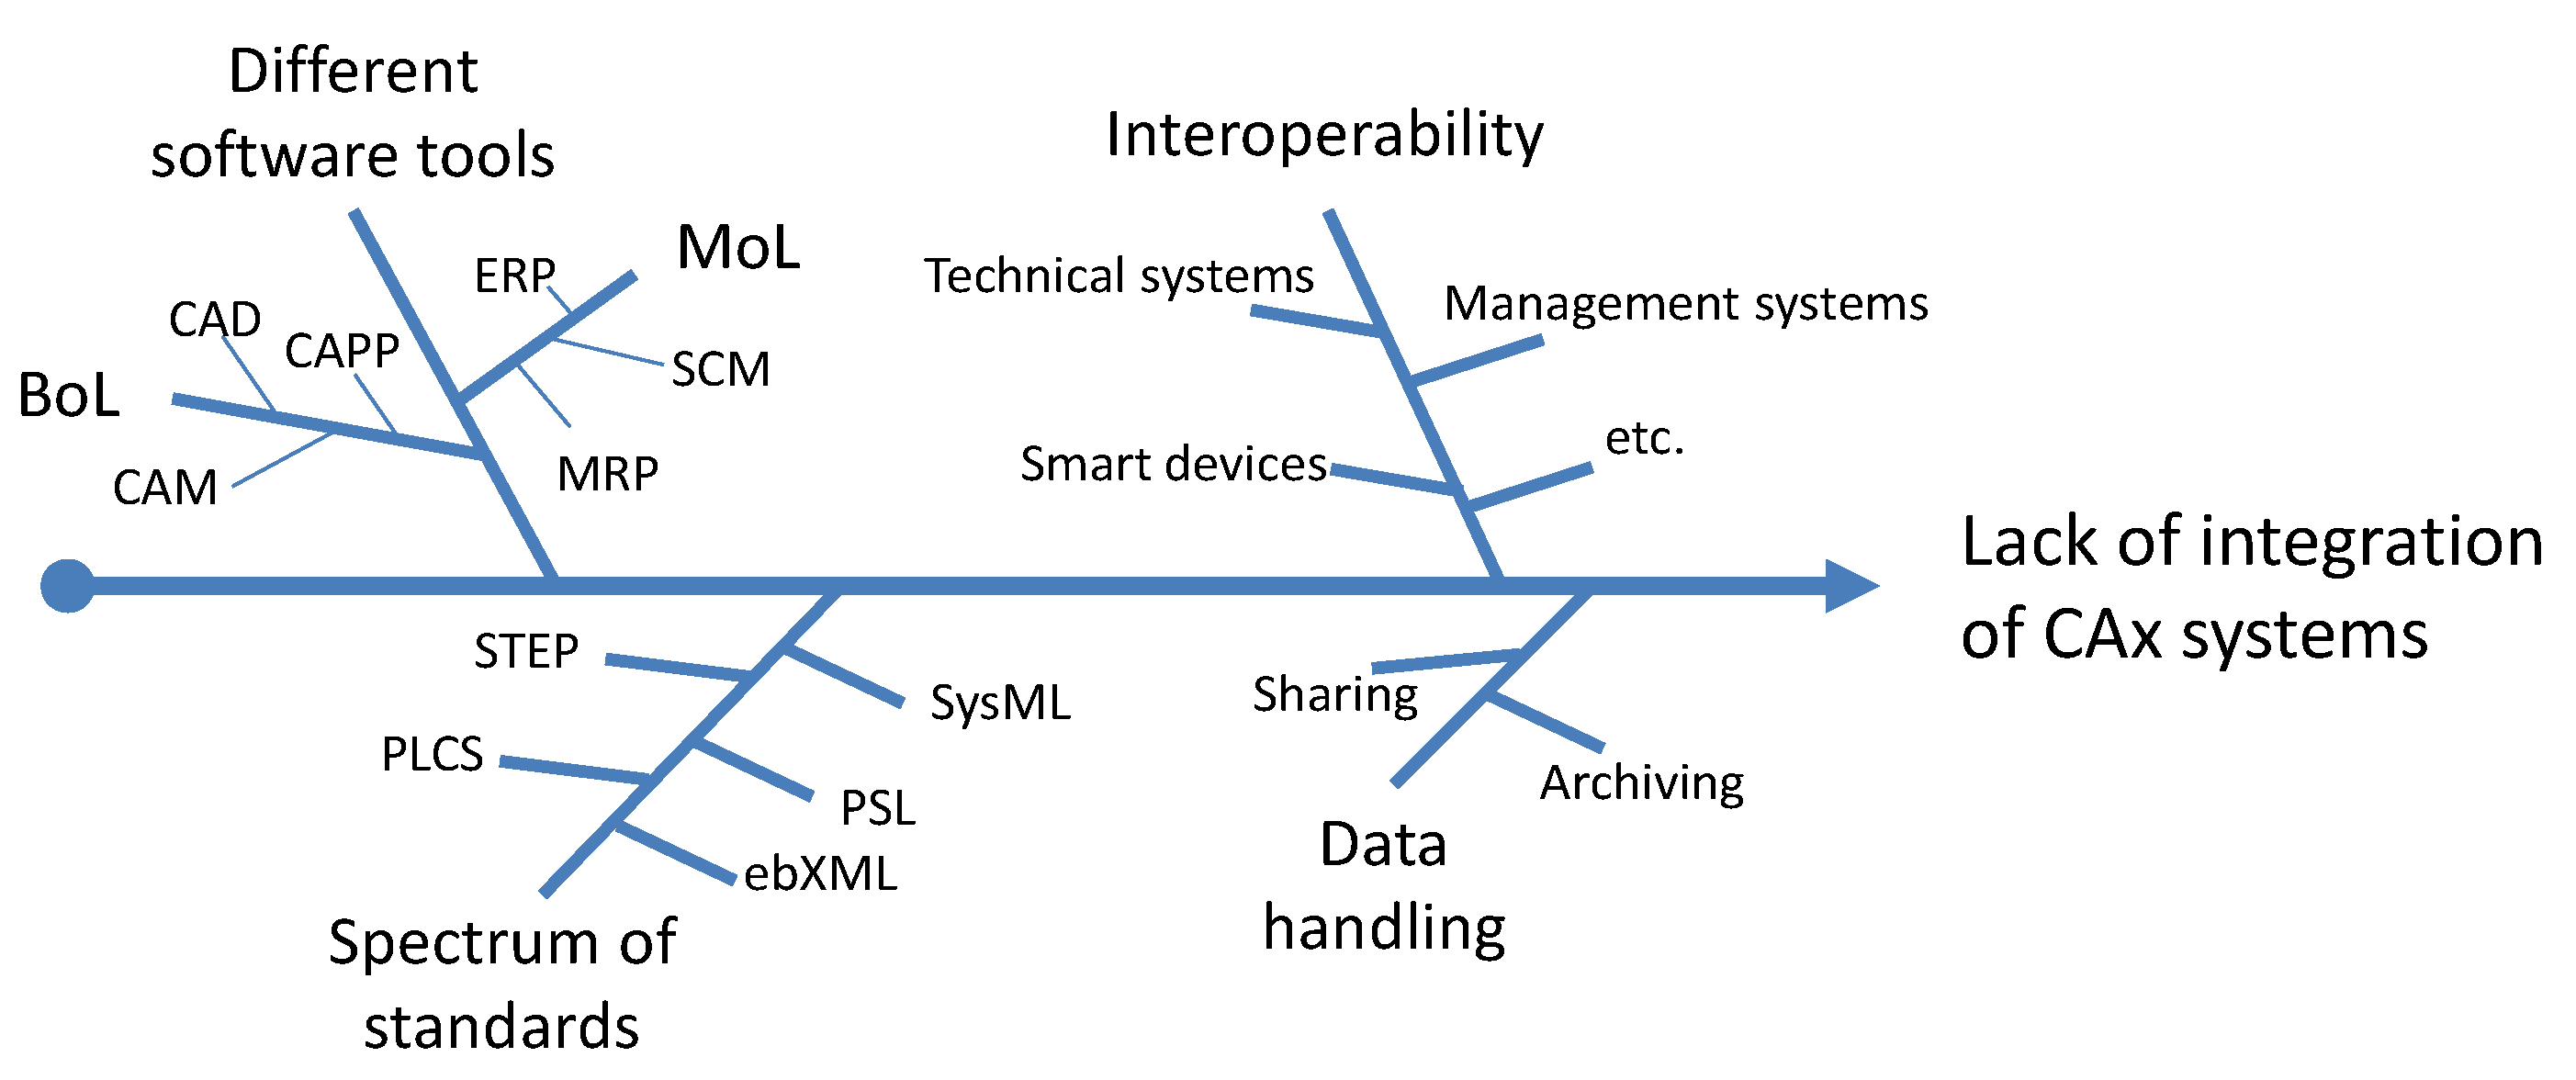
It is clear that success in producing sustainable goods through sustainable production practices requires knowledge and effective management of the product life cycle. PLM packages are the basis for handling the entire product lifecycle from layout to final disposal. In fact, there are three stages within the life cycle of the product, the beginning of life (BoL), the middle of life (MoL) and the end of life (EoL) [
13]. In conventional PLM systems, only BoL is considered. However, with a view to sustainability, the traditional PLM packages must be modified and the MoL and EoL phases must also be considered [
14]. However, a variety of challenges preclude full incorporation [
13,
14,
15,
16], as pointed out in
Figure 2.
3. Design for Sustainability
The starting point for a sustainable product is that it is designed having in mind the three main sustainability dimensions and the criteria imposed by these dimensions. Design for sustainability (D4S), also referred to as sustainable product design, is basically a set of guidelines and practices introduced for companies to apply when developing new products. In other words, from the early phase of a new product design, a firm addresses the environmental and social demands in addition to the obvious financial demands.
Allwood and Cullen [
17] emphasized the influence of the weight of a part on its sustainability efficiency. A lightweight design is much more sustainable because of the more efficient raw material usage; scrap reduction and the case of moving parts require less energy during operation. However, when considering the light-weighting impact, the energy required during the manufacturing of the component needs to be considered. For example, if the energy required during the production of the primary material is considered, the use of lightweight material does not necessarily result in the most energy-efficient solution [
18]. Therefore, light-weighting is not a solution for all sectors.
Since the beginning of the 1900s, the manufacturing world has been moving for standardization in order to take advantage of economies of scale related to tooling costs and the efficiency of continuous processes. Nevertheless, this standardization results in simplistic designs of components that are heavier than optimized ones. Allwood and Cullen [
17] identified the following five technical criteria for the use of less raw materials that should be required for sustainable design:
Support multiple loads with fewer structures where possible;
Do not overspecify the loads (i.e., avoid over-engineering);
Align loads with members to avoid bending if possible;
If bending is unavoidable, optimize the cross-section along with the member;
Choose the best material.
Alternatively, Ijomah et al. [
19] introduced a set of recommendations for remanufacturing to further promote sustainable manufacturing. Ceschin and Gaziulusoy [
20] discussed a quasi-chronological approach at four levels, namely product, product-service system, spatio-social system, and socio-technical system. Such a framework is useful to understand the evolution of sustainable manufacturing from being product-centric to system-level changes. In another work by Harik et al. [
21], sustainability metrics for quantifying sustainability in manufacturing industries were presented, which were useful in integrating and analyzing sustainability in manufacturing operations.
4. Sustainable Manufacturing
Production and manufacturing systems have a great impact on all three dimensions of sustainability. Sustainable manufacturing ensures that the technologies and methods used to manufacture goods fulfill the criteria for the three principles of sustainability. Since there is no widely agreed concept of sustainable production, a recent study defines it as a process that leads to the following [
22]:
Enhanced environmental friendliness;
Reduced prices;
Reduction in power consumption;
Reduced wastes;
Enhanced operational safety;
Improved health of workers.
Manufacturing facilities must meet the ever-increasing demand for consumer products as the quality of life continues to climb.
Table 1 summarizes some examples of sustainable technologies.
Reducing energy use while increasing the use of renewable energies is important, since approximately one-third of the global energy demand and CO
2 emissions are linked to manufacturing activities. It needs recognition at the factory level and the use of clean energy-efficient actuators and components to their maximum degree, while also taking into account the whole supply chain, from raw materials to manufacturing of final components. Davé et al. [
35] presented frameworks for the modeling of factory-level ecoefficiency and discussed the impact of the available data in the prediction of energy efficiency.
At the process stage, optimized technical changes are required to reduce energy and resource usage, hazardous wastes, workplace hazards, etc., to enhance product life by controlling process-induced surface integrity. For example, recycling of metal powder in metal additive manufacturing processes can optimize the resource consumption in three-dimensional (3D) printing technology [
36,
37].
Sustainable manufacturing can be accomplished by more energy-efficient technologies. A lot of work is underway, for example, to replace traditional methods that display high energy consumption with novel alternatives. For instance, for small batch sizes, the grind-hardening process is considered to be an alternative to the traditional heat treatment process [
38].
5. Social Dimension
Traditionally, judgments in manufacturing environments are made based on a tradeoff between cost, speed, and quality. One of the well-known anecdotes is that manufacturing organizations strive for “faster, better, and cheaper” means of production. Cost is related to sustainability through the economic pillar. It has only been during the last decade that the environmental pillar has also become important.
Both the manufacturing of goods and the facilities needed for their development are typically produced through conventional processes, which, in certain situations, are inefficient and have negative impacts. From a production perspective, this topic has been illustrated in the literature, with a special focus on regulatory, health, and safety human concerns, rather than cultural and ethical decision-making criteria [
39,
40,
41]. Bell and Morse [
42] questioned the feasibility of measuring the social aspect of sustainability. Few findings have been addressed aimed at quantifying quality of life from both empirical and subjective viewpoints [
43].
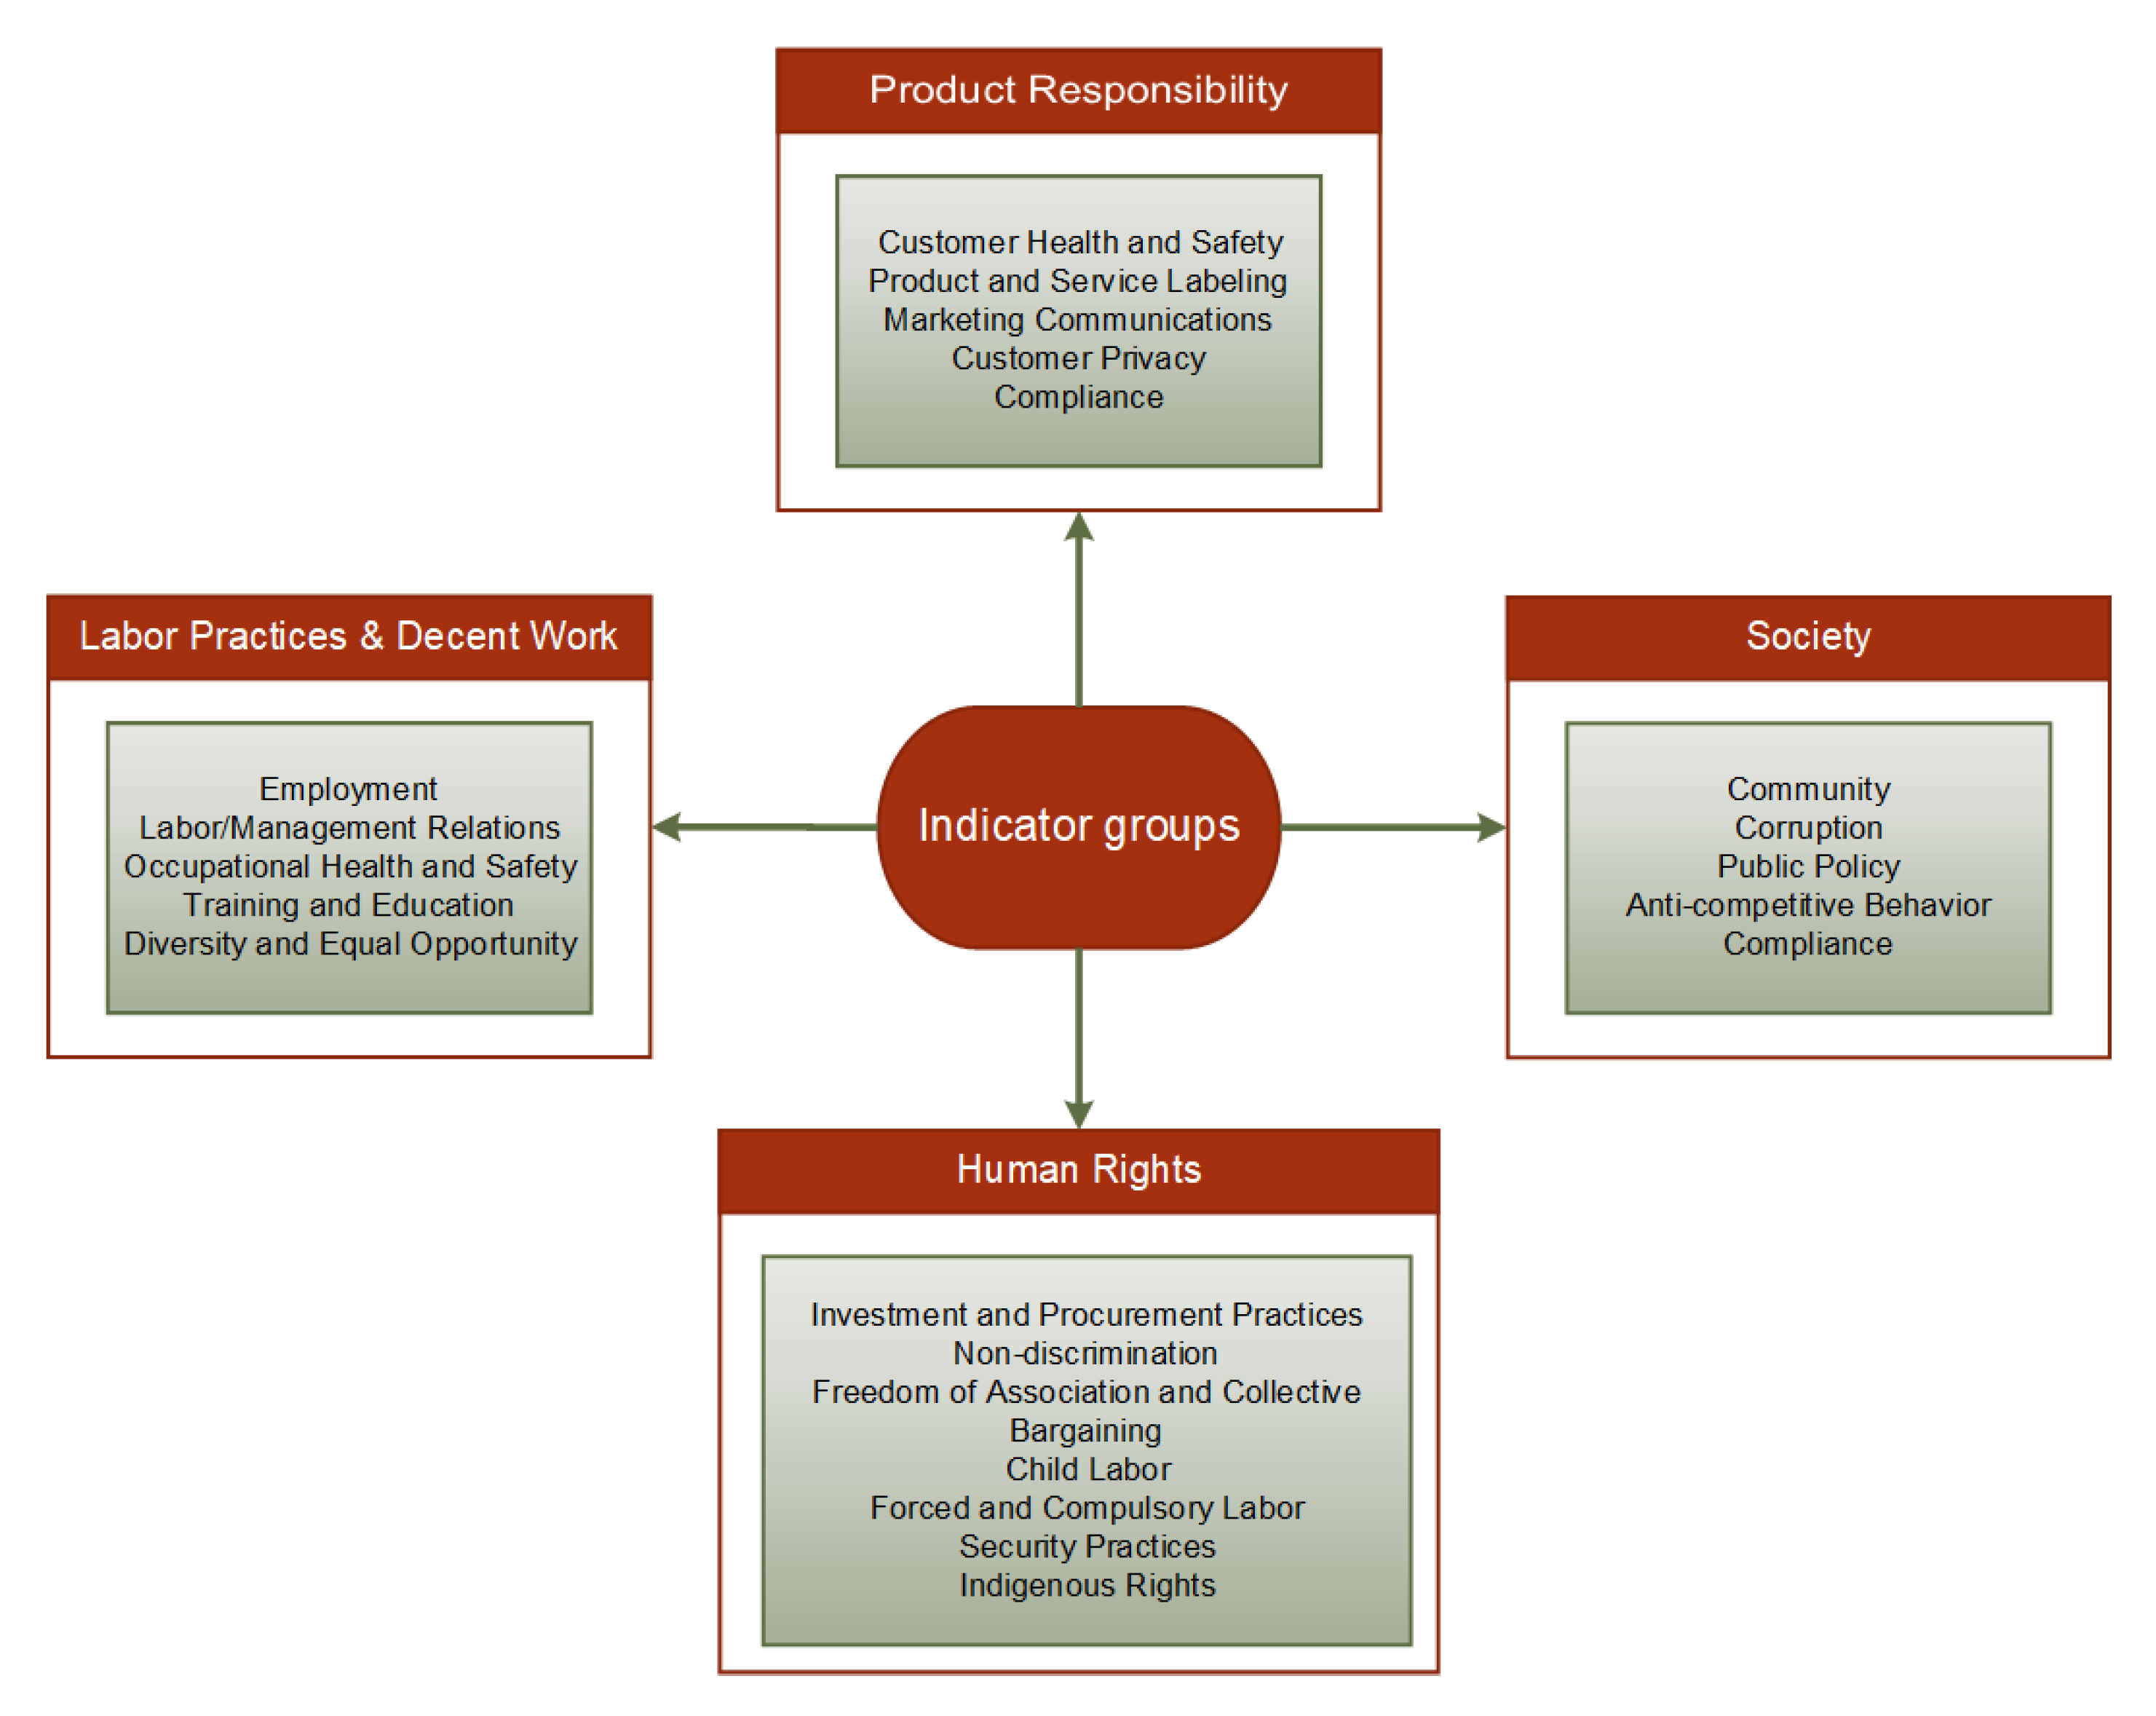
The Global Reporting Initiative’s Sustainability Reporting Guidelines (the “G3 Guidelines”) specify a formal structure for annual sustainability disclosure that is open to all forms of organizations [
44]. The social performance indicators are divided into the following four main groups: labor practices and decent work, human rights, society, and product responsibility, as indicated in
Figure 3.
The efforts directed to integrate social aspects in sustainability measures can be classified into two key concepts as follows:
The movement towards social sustainability and social life cycle assessment supplements the environmental LCA [
45,
46,
47] by determining social and political influences that lead to environmental problems. The core aspect of this approach is the study of the environmental resources relating environmental effects to social, cultural, and political platforms.
Investigation of the mechanisms of effect between organizational flows, such as inputs and outputs, and socially focused mid- and endpoints [
48]. These strategies consider the effect of goods and services on individuals, in particular, the protection of good well-being, human dignity, and the satisfaction of basic needs. A two-tiered method is recommended, with a mandatory component governed by standardized local and country requirements and an optional component allowing the addition of parameters of special significance or importance.
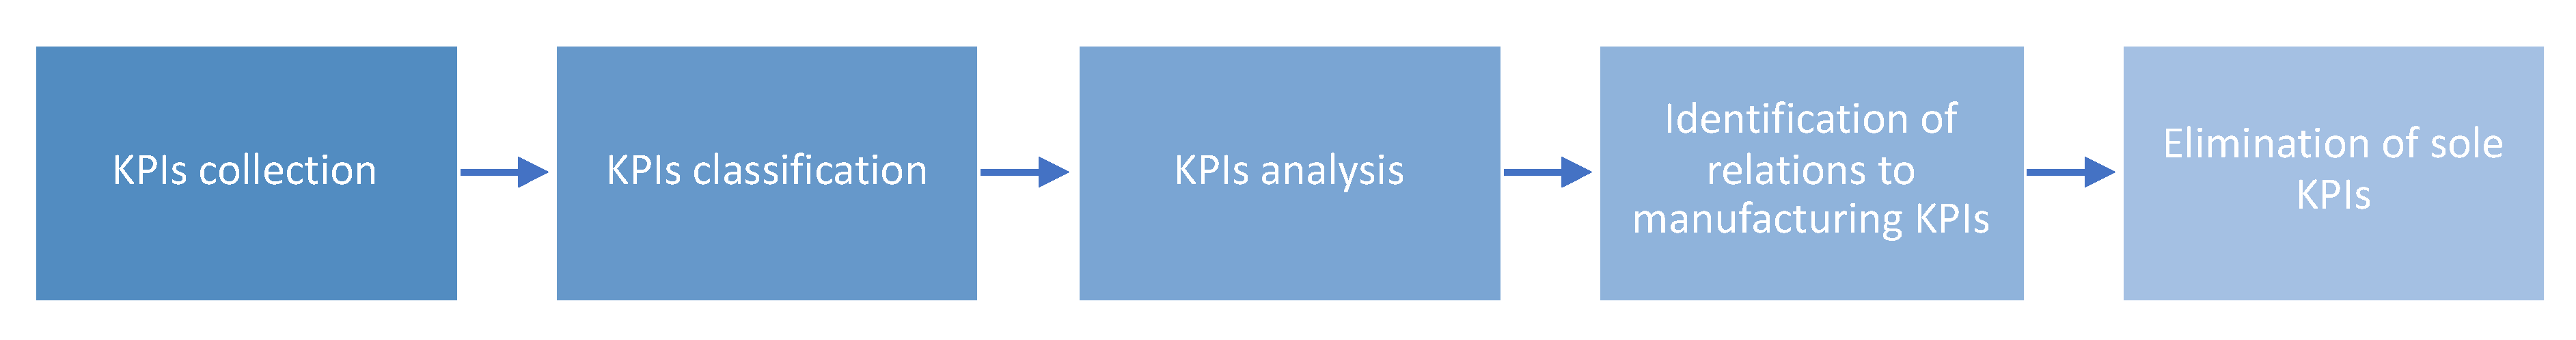
For the purposes of the current study, which focused on the sustainability aspects within the process-planning phase, consolidation of the social KPIs was performed which was oriented on the manufacturing/processing level. In order to define the social KPIs and evaluate their weighting in the field of the manufacturing industry, a multi-stage study was carried out comprised of the steps depicted in
Figure 4.
6. Framework for an Integrated CAx System towards Sustainability
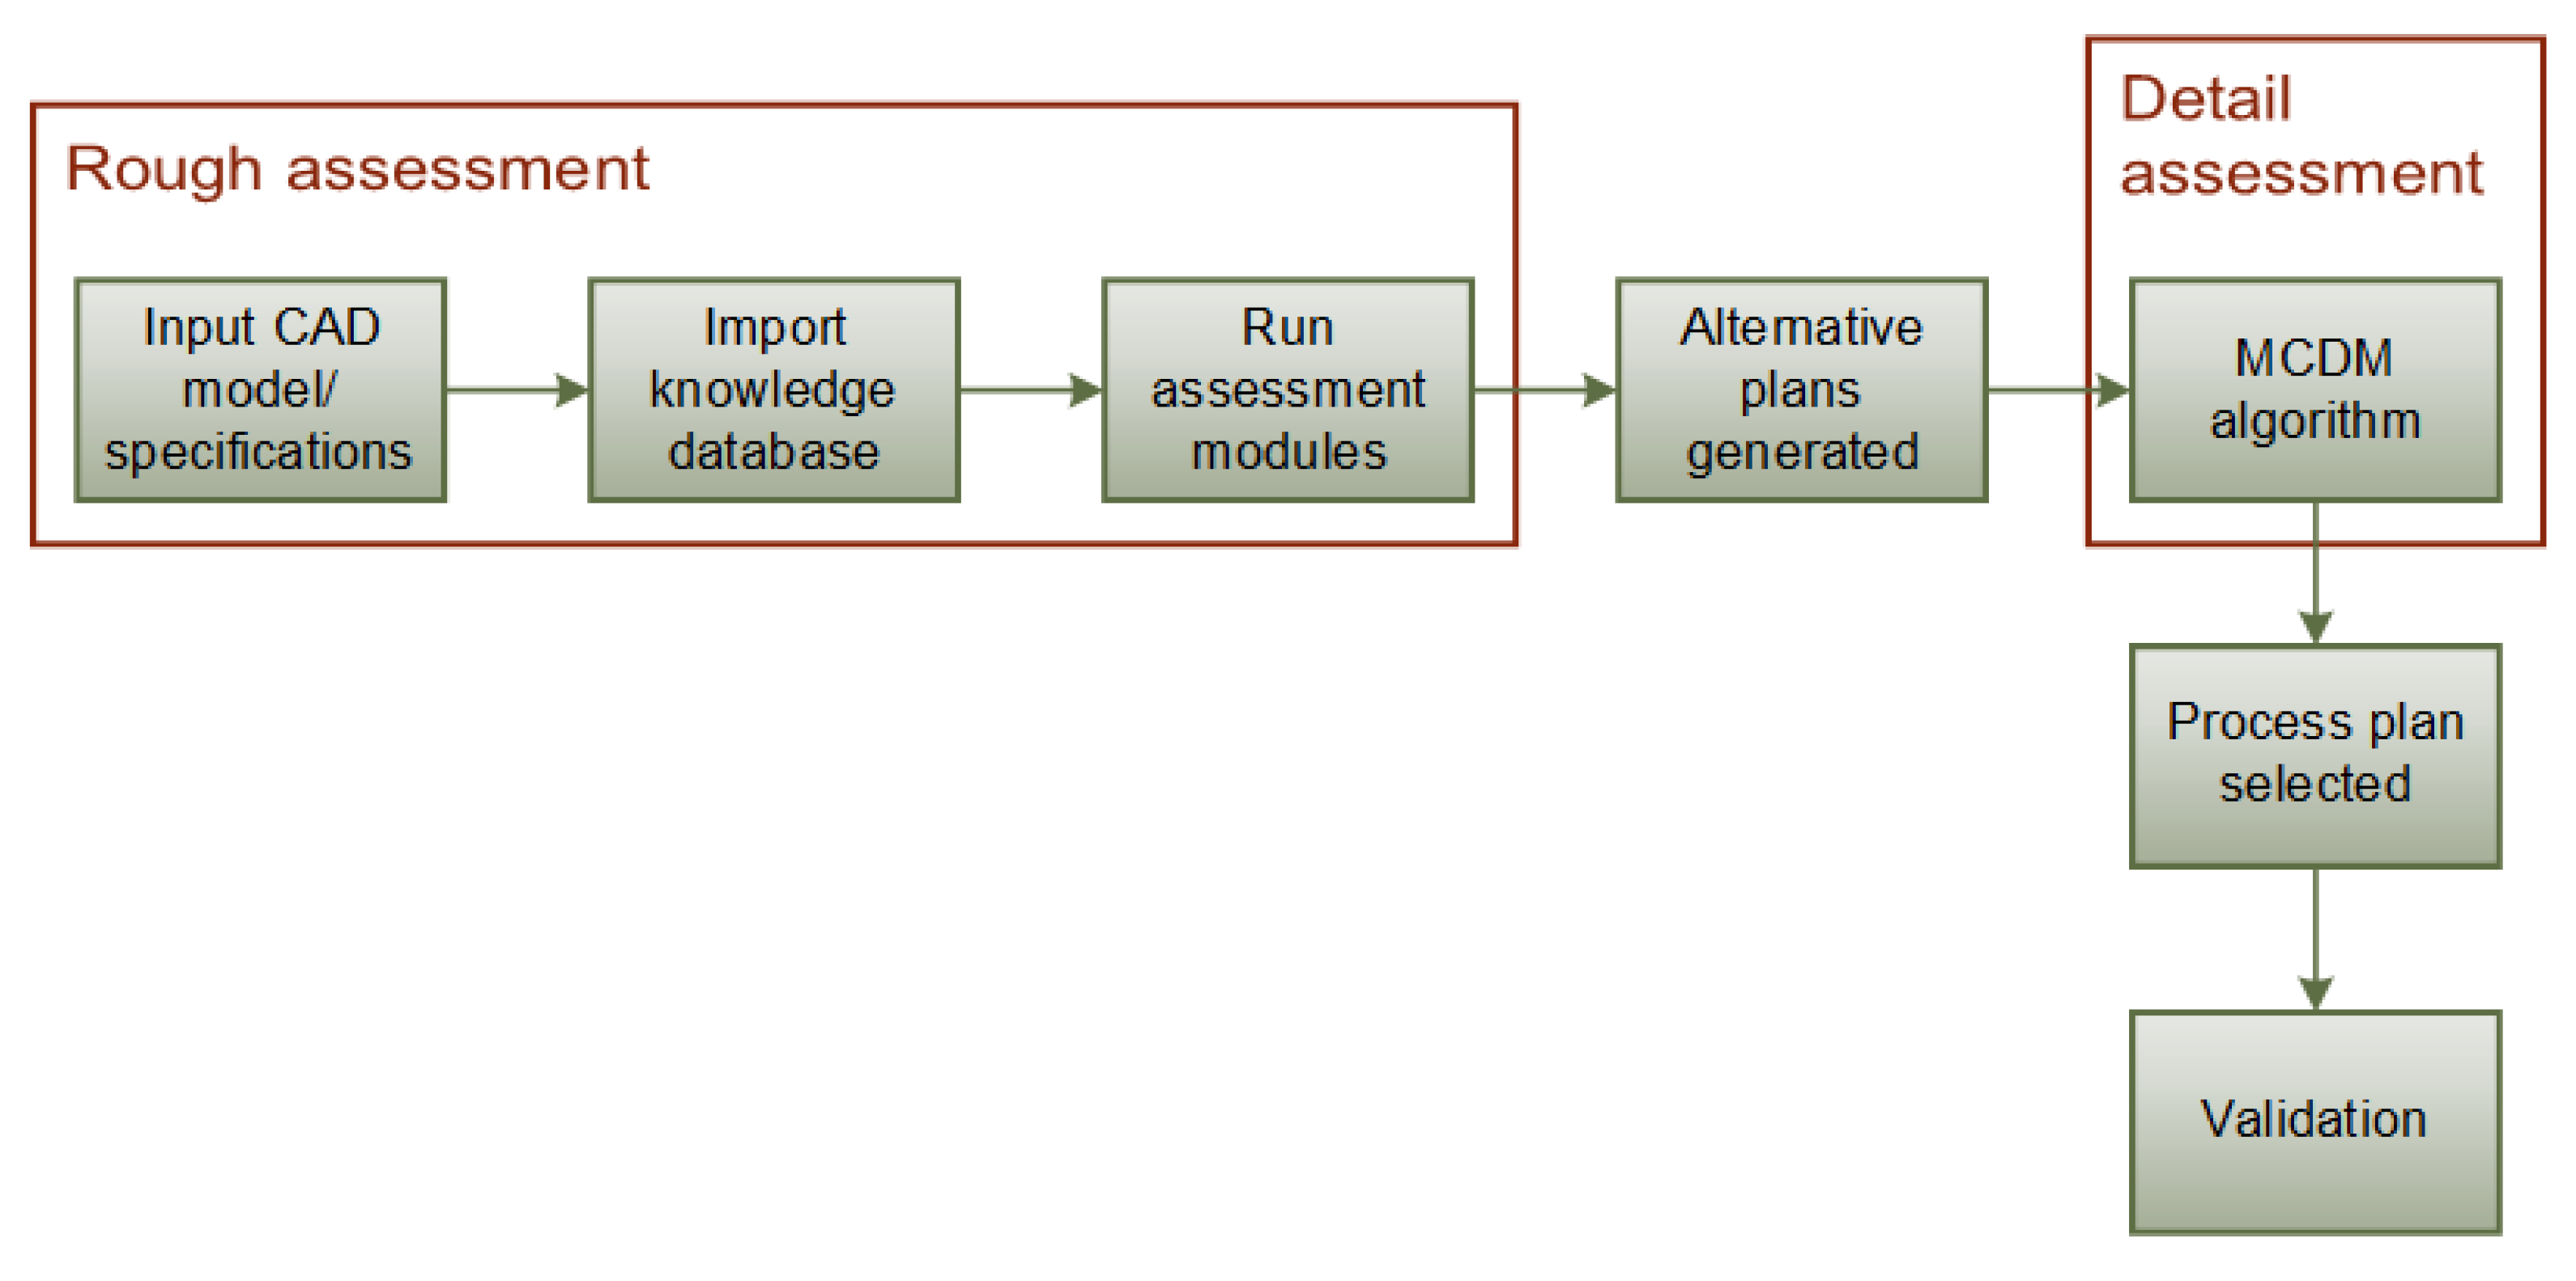
The basic goal is to analyze a variety of potential process maps during the concept generation in order to facilitate effective decision-making. The system suggested, in its operating nature, would consist of a variety of modules, interfaces and information databases. The framework is composed of two major phases, that have different requirements in terms of data and information. During the first phase, the process plans are assessed qualitatively and roughly ranked.
Figure 5 presents a block diagram of the proposed method.
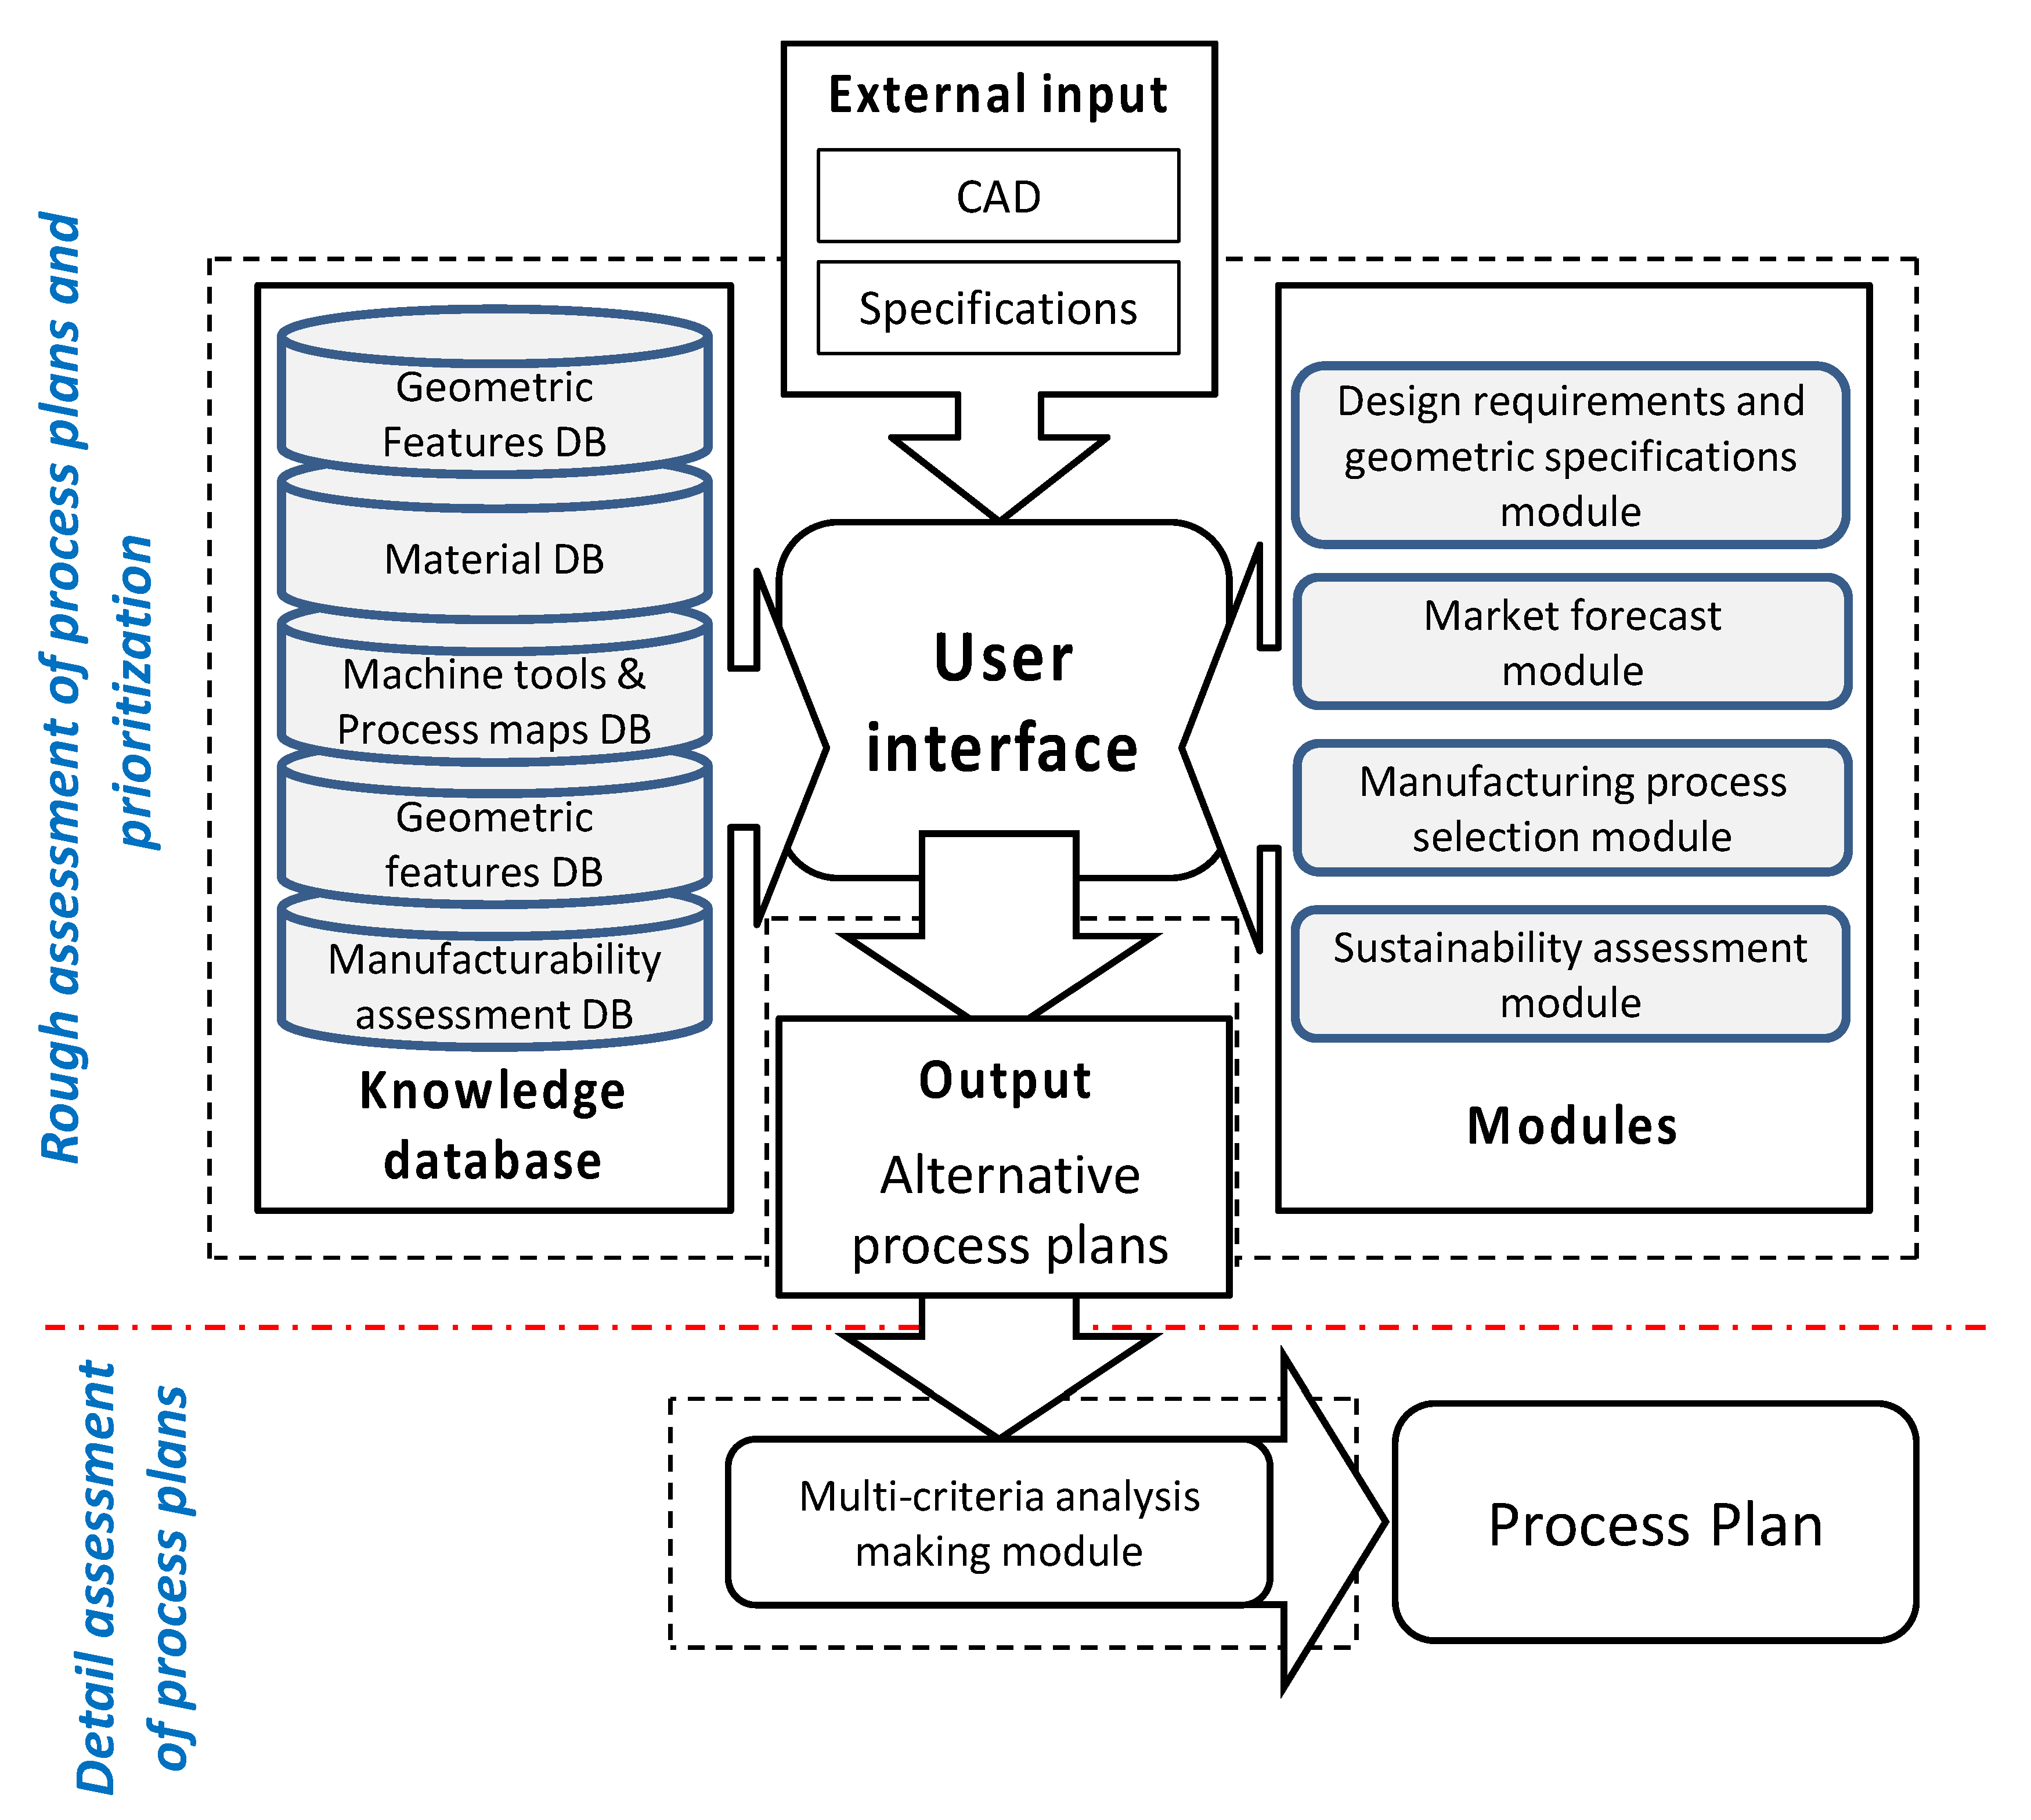
The general architecture of the system currently being applied is outlined in
Figure 6. For the highest-ranking process plans, quantitative data are then collected for running a multi-criteria assessment.
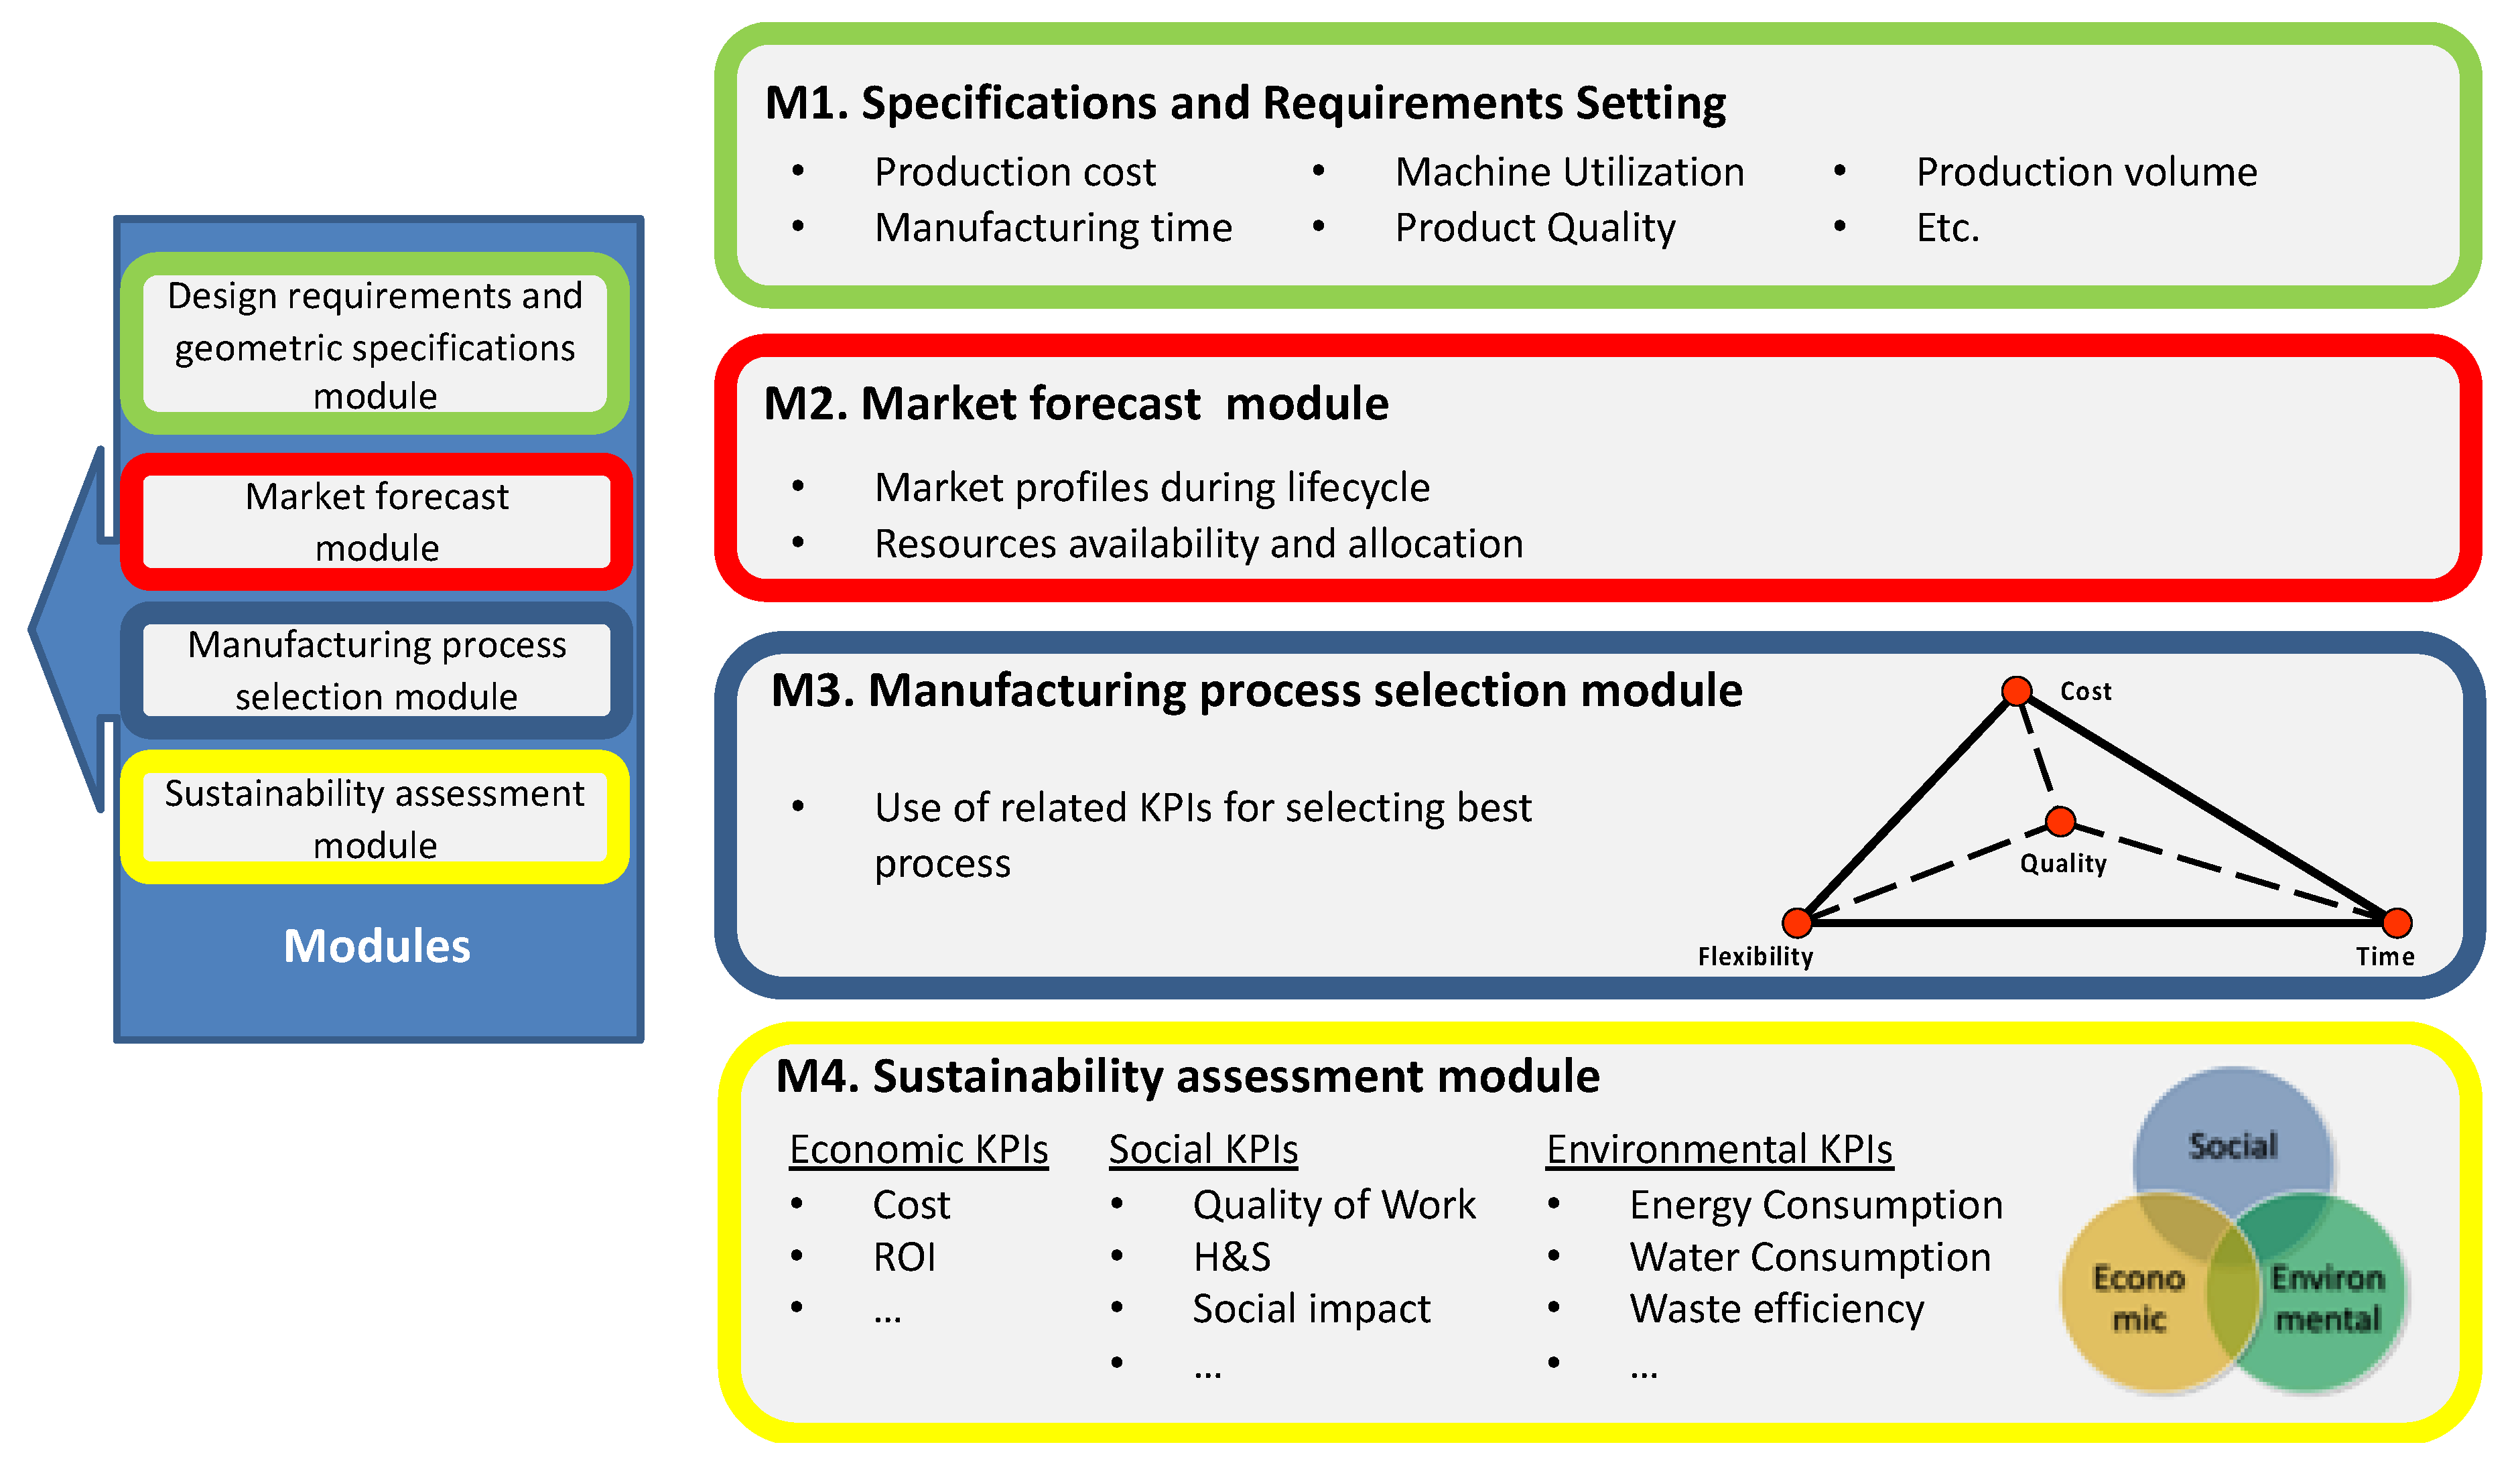
Figure 7 presents the four modules that are part of the first phase of the integrated CAx system. The modules are described in detail in the following paragraphs.
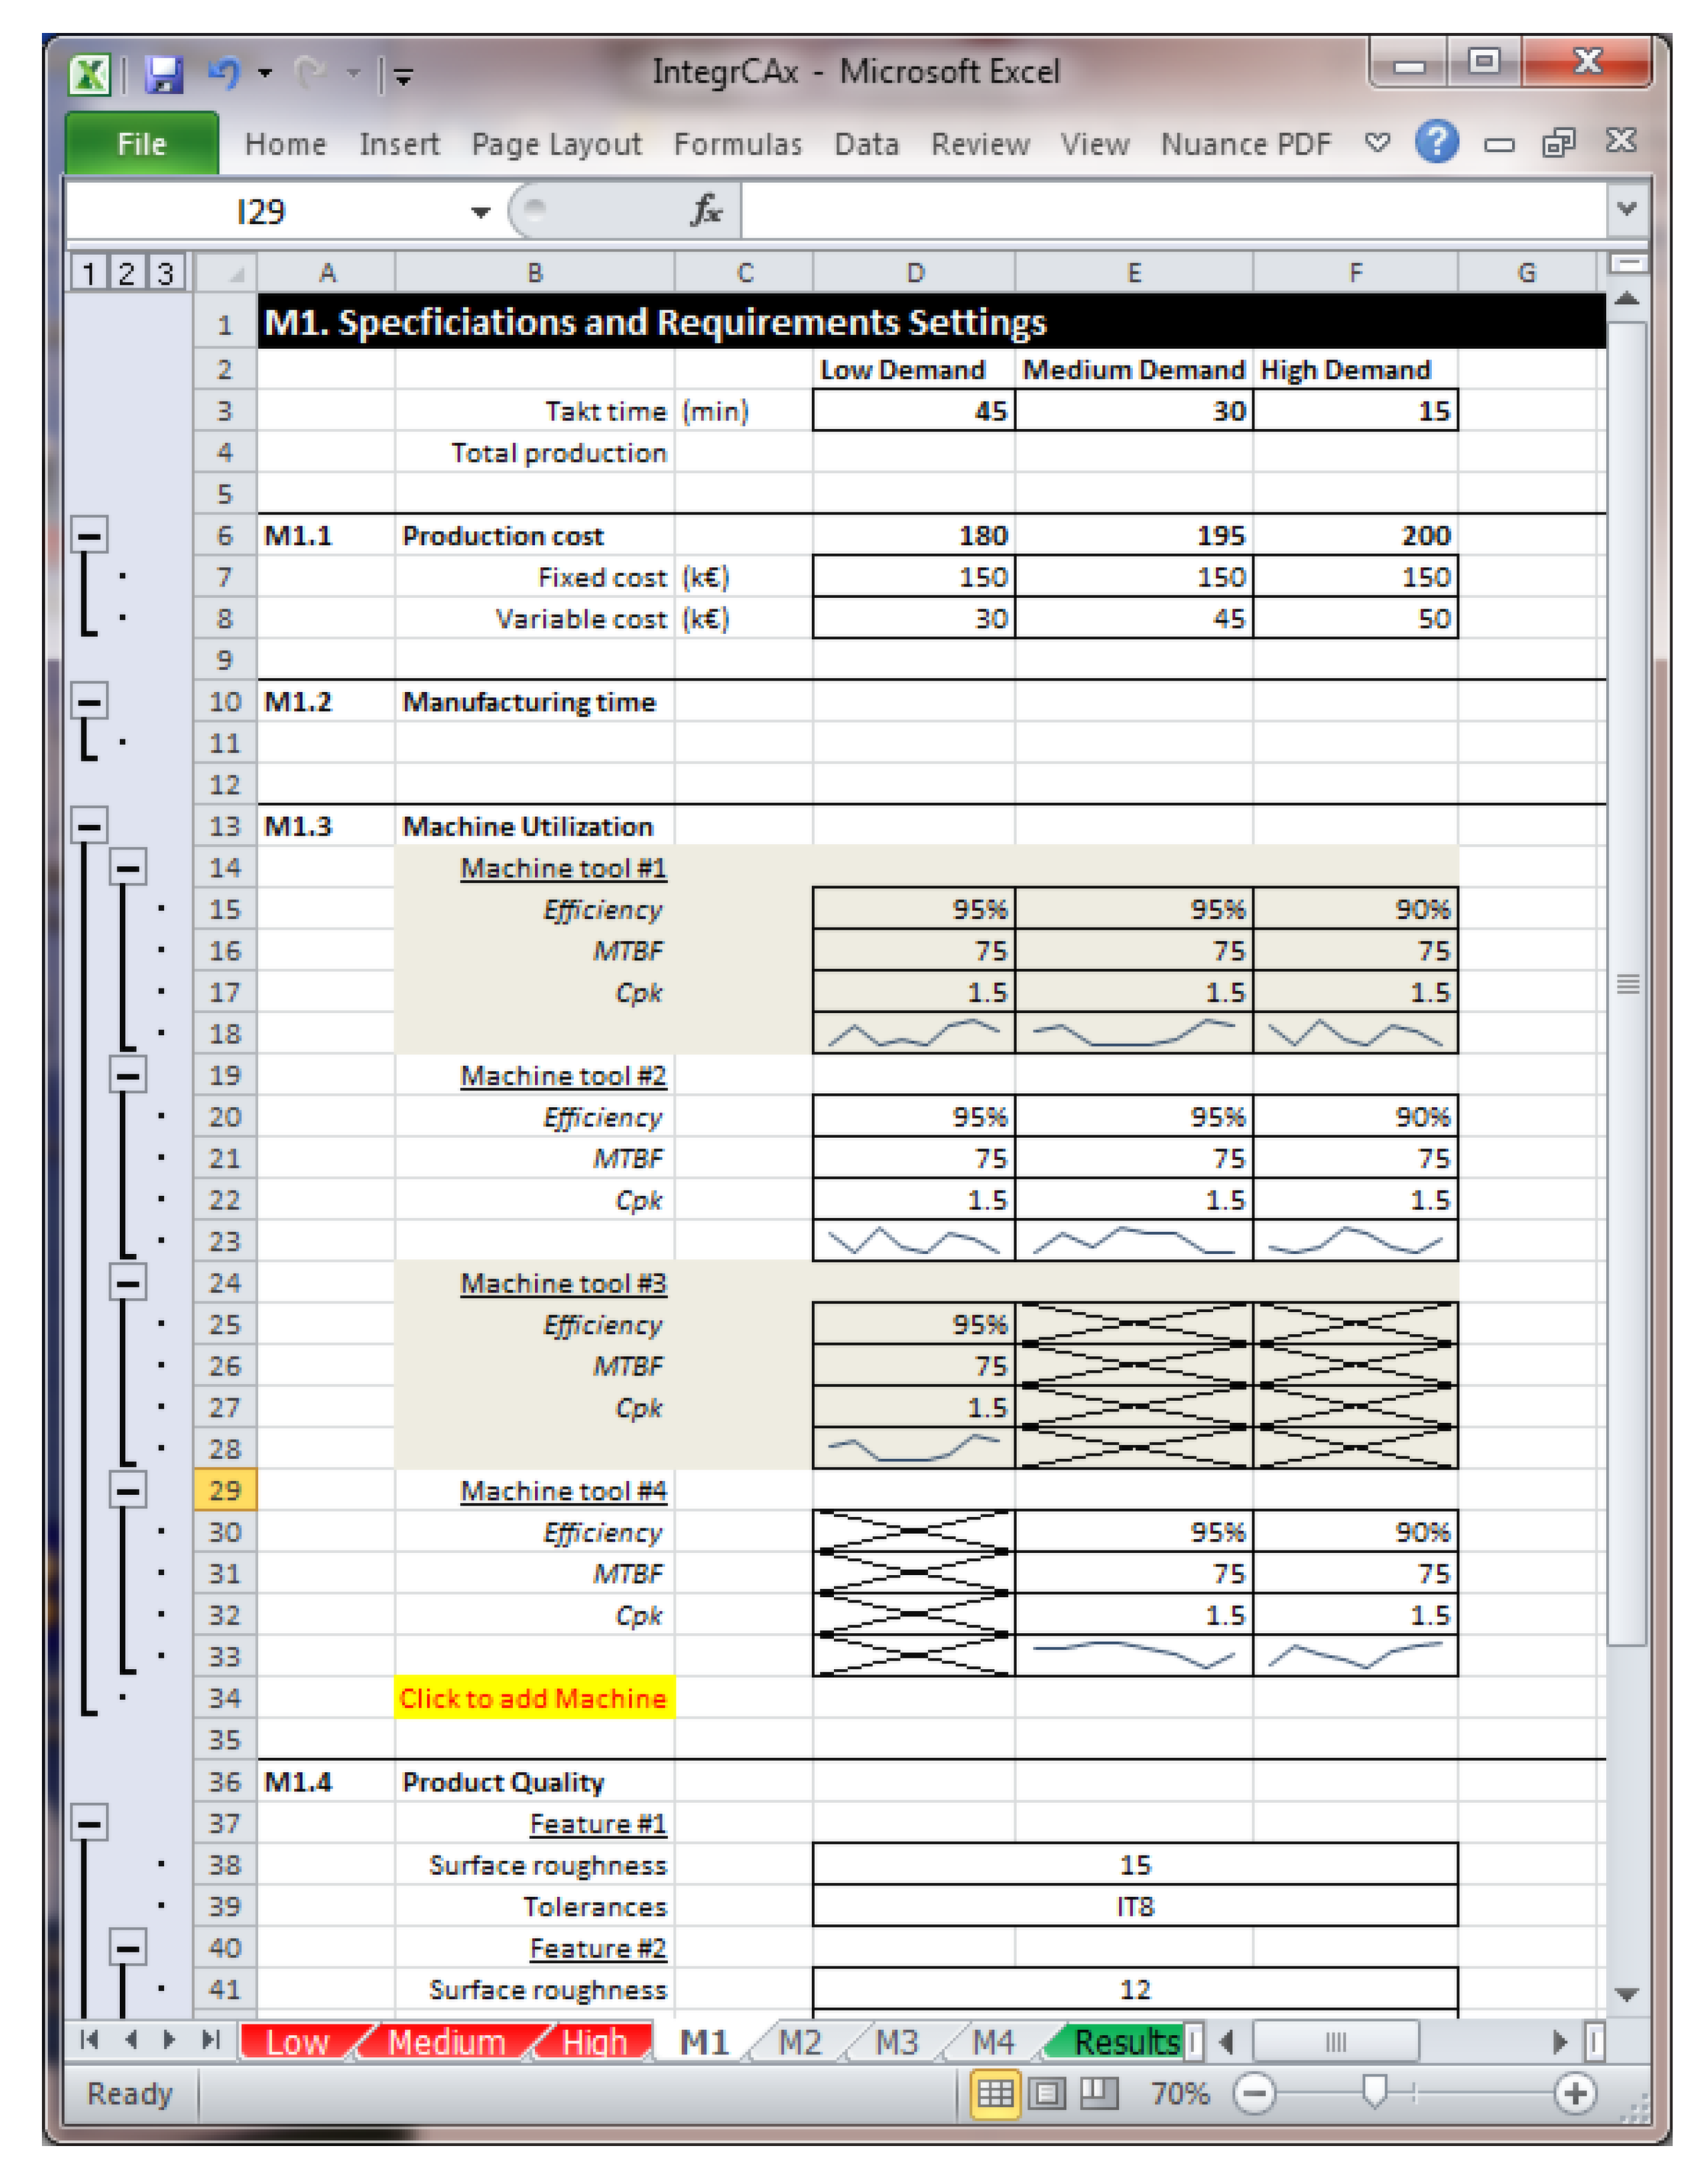
6.1. Design Requirements and Specifications Module
The first module focuses on capturing the design specifications and relevant data for assisting the decision-making process. The type of information captured includes data about the cost of the product and its production; manufacturing times such as cycle times, setup and changeover times; machine tools’ utilization, uptime, and reliability; product quality; production volume; inventory levels; transportation requirements; etc. Such data can be captured through process mapping and value stream mapping. Furthermore, geometric feature data are captured from CAD files, including shape, feature name, width, and length.
6.2. Market Forecast Module
For the industrialization of the product and the ramping up of the production, information is required with regards to the market demand and the associated lead times. Depending on the foreseen market demand, different production routes could be adopted. In general, demand is stochastic; however, methods have been developed and presented for assessing and forecasting such demand profiles during the product’s lifecycle. Within this module, such forecasting models are considered and incorporated in algorithms that detect potential alternate resources that could be used for the manufacturing of parts or the item itself, and compliance with the order specifications, including the quality specification for each lot of the order.
6.3. Manufacturing Process Selection Module
The selection of the most appropriate production route requires a profound understanding of the capabilities of various manufacturing processes available for the production of the product. The selection of the most appropriate process requires, at least at the beginning, rough estimations of the key manufacturing attributes, i.e., cost, time, and quality. These are reflected in key performance indicators. For example, the “cost” attribute can be assessed capturing information about equipment and facility costs, depreciation costs, material and consumables cost, labor and overtime costs, overhead costs, etc. “Time” can be assessed through key performance indicators such as cycle time, setup and changeover time, throughput time, lead time, etc. Finally, the “quality” attribute is assessed through feature-related metrics such as surface roughness measurements, tolerances, and financial measures such as cost of quality, yield, etc.
6.4. Sustainability Assessment Module
The major KPIs that are used for assessing sustainability are linked to the triple bottom line aspects, namely:
- -
Social pillar related KPIs, as highlighted in
Section 6 of the present paper, such as:
- ○
Work quality;
- ○
Health and safety;
- ○
Social impact.
- ○
…
- -
Economic pillar related KPIs, such as:
- ○
Cost;
- ○
Return on investment;
- ○
CAPEx;
- ○
Use of renewable.
- ○
…
- -
Environmental related KPIs, such as:
- ○
Energy consumption;
- ○
Waste efficiency;
- ○
Recycling efficiency;
- ○
Use of renewable energy sources.
- ○
…
As highlighted by Salonitis and Stavropoulos [
49], energy efficiency is a metric that can potentially be utilized as a sustainability index. It is associated with the triple bottom line aspects, as energy efficiency is related to the economic pillar (through the cost of consumed energy), the environmental pillar and the social pillar. However, Bunse et al. [
50] highlighted that present concepts of energy efficiency could be inaccurate. Energy efficiency can be linked to both technologies that can potentially reduce energy consumption, as well as operations and procedures that can have the same impact.
A plethora of energy-related KPIs are available [
35]. They can be categorized into energy consumption-focused metrics (such as energy usage per product, total on-site energy, total energy consumption, etc.), the environmental impact (such as carbon footprint, greenhouse emissions, energy profile, etc.), and the economics (such as energy cost). The focus can be in different levels, such as the manufacturing process level, machine tool or manufacturing plant, etc. However, deciding the level of analysis is important, as this also defines the data granularity, resolution, and how these will be used afterwards [
51].
The social sustainability aspect can be evaluated on the basis of the H&S of workers, the overtime requirements, and the human toxicity potential. Such metrics can be estimated using life cycle analysis techniques.
6.5. Multi-Criteria Analysis Module
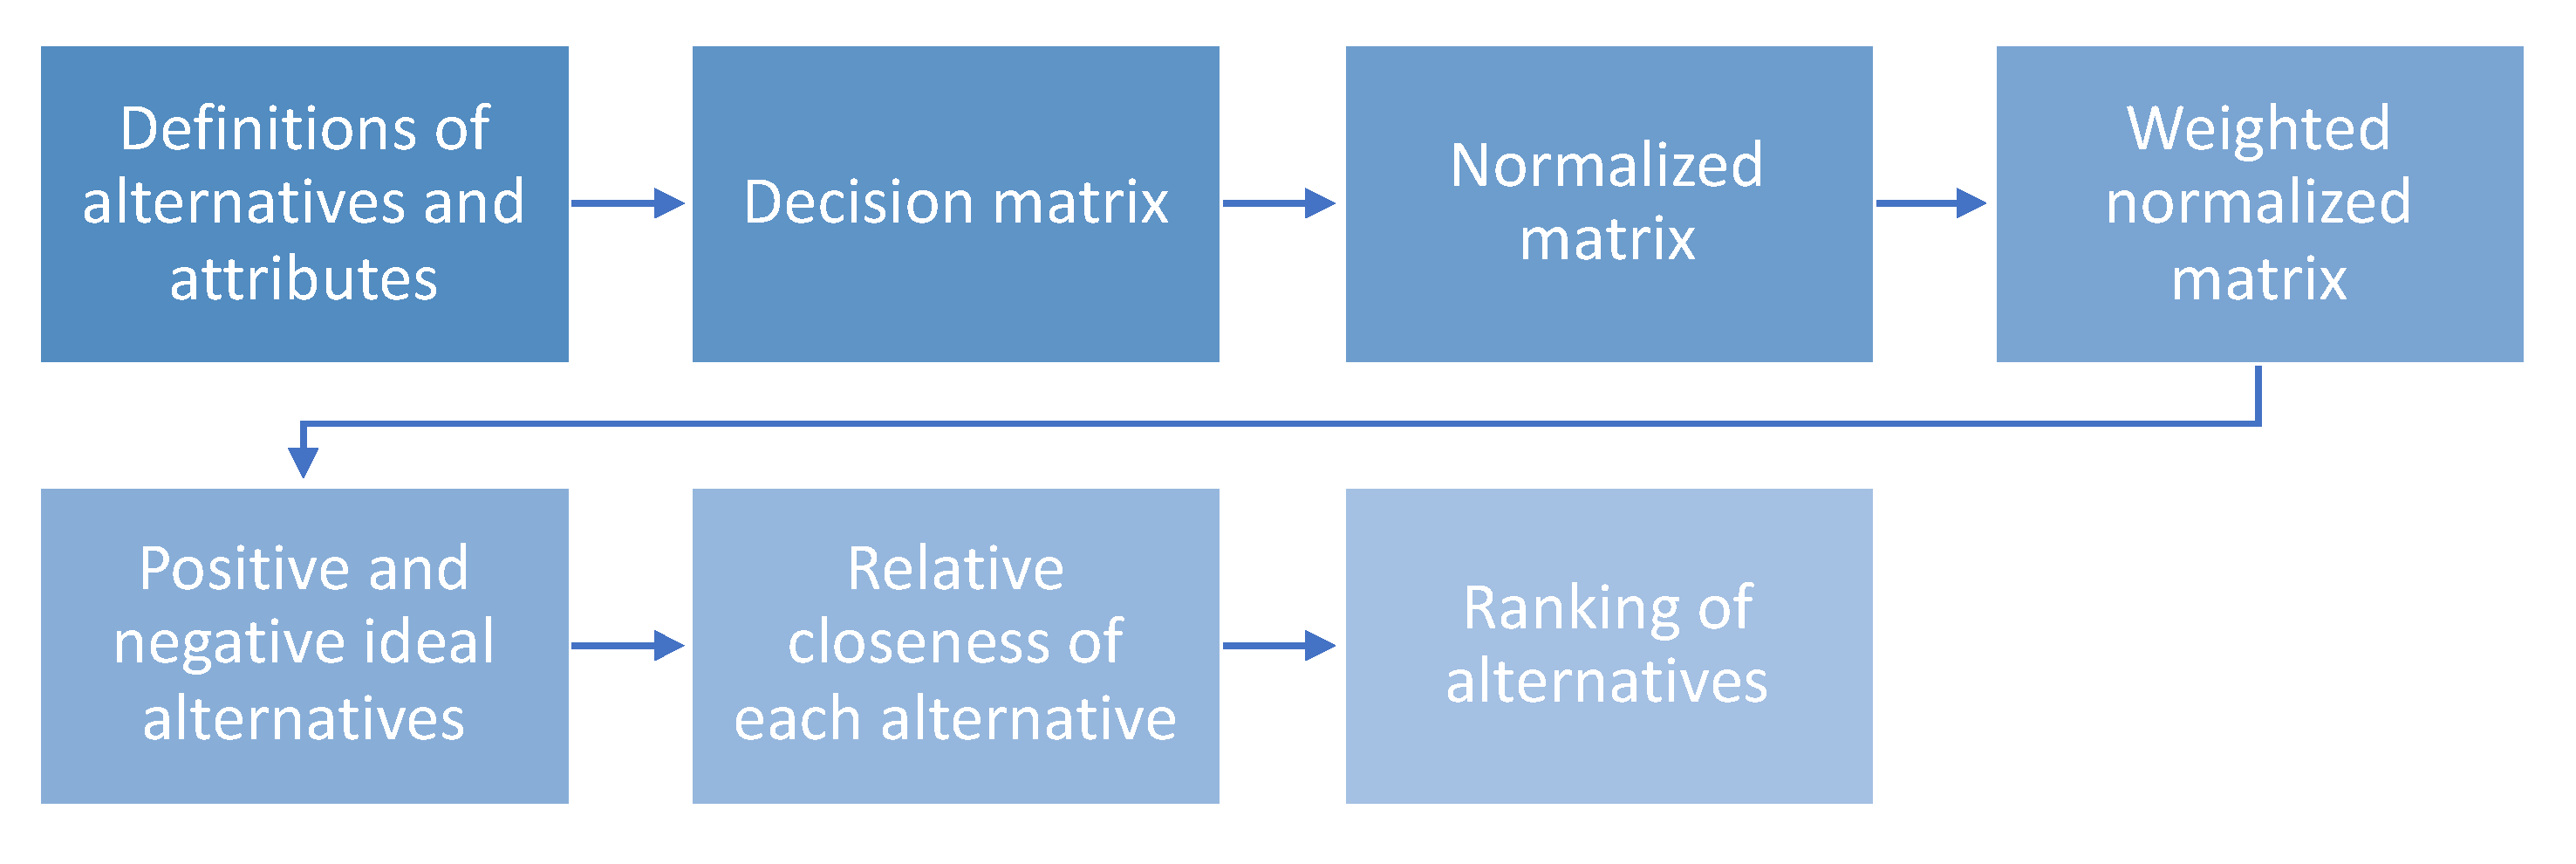
In the second phase of the framework, the quantitative assessment of the highest-ranked alternative process plans is conducted. It is clear that the selection of the optimal manufacturing plan is based on several attributes related to both sustainability and the other three key manufacturing decision attributes, i.e., time, quality, and flexibility. For this reason, a multi-criteria decision analysis method need to be applied. The Technique for Order of Preference by Similarity to Ideal Solution (TOPSIS) method was selected for this reason as it is considered to be a very powerful method when assessing conflicting attributes and can be used for dealing both with qualitative and quantitative attributes. For the present paper, the simplified method presented by Lozano-Minguez et al. [
52] is employed (
Figure 8). The TOPSIS method has been used in the past for assisting the decision making within the manufacturing environment, and a recent example is the work presented by Salonitis et al. [
53].
In general, the following three steps are involved in the use of any decision-making method including numerical analysis of alternatives:
Identifying the appropriate criteria and alternatives;
Attaching empirical measurements to the relative significance of the criteria and the effect of the alternatives on all those criteria;
Processing the quantitative values to evaluate a ranking of each option.
As can be seen in
Figure 8, a decision matrix is formulated, followed by normalization of every attribute of each option:
where
is the actual value of the i-th alternative in terms of the j-th criterion, and
is the normalized value of the i-th alternative in terms of the j-th criterion. Next, criteria weights (
) have to be determined to indicate their relative importance and to calculate the weighted normalized values (
) through:
The PIS (A+) and the NIS (A-), the ideal solutions are determined as:
Then, the ranking of the alternatives is evaluated by calculating the relative distance of each solution from the PIS (
) and to the NIS (
), as:
The relative closeness of each solution to the ideal (
) is estimated as follows, and the most favorable is the one closest to 1:
7. Validation
The proposed approach was developed in conjunction with Microsoft Access databases in Microsoft Excel (
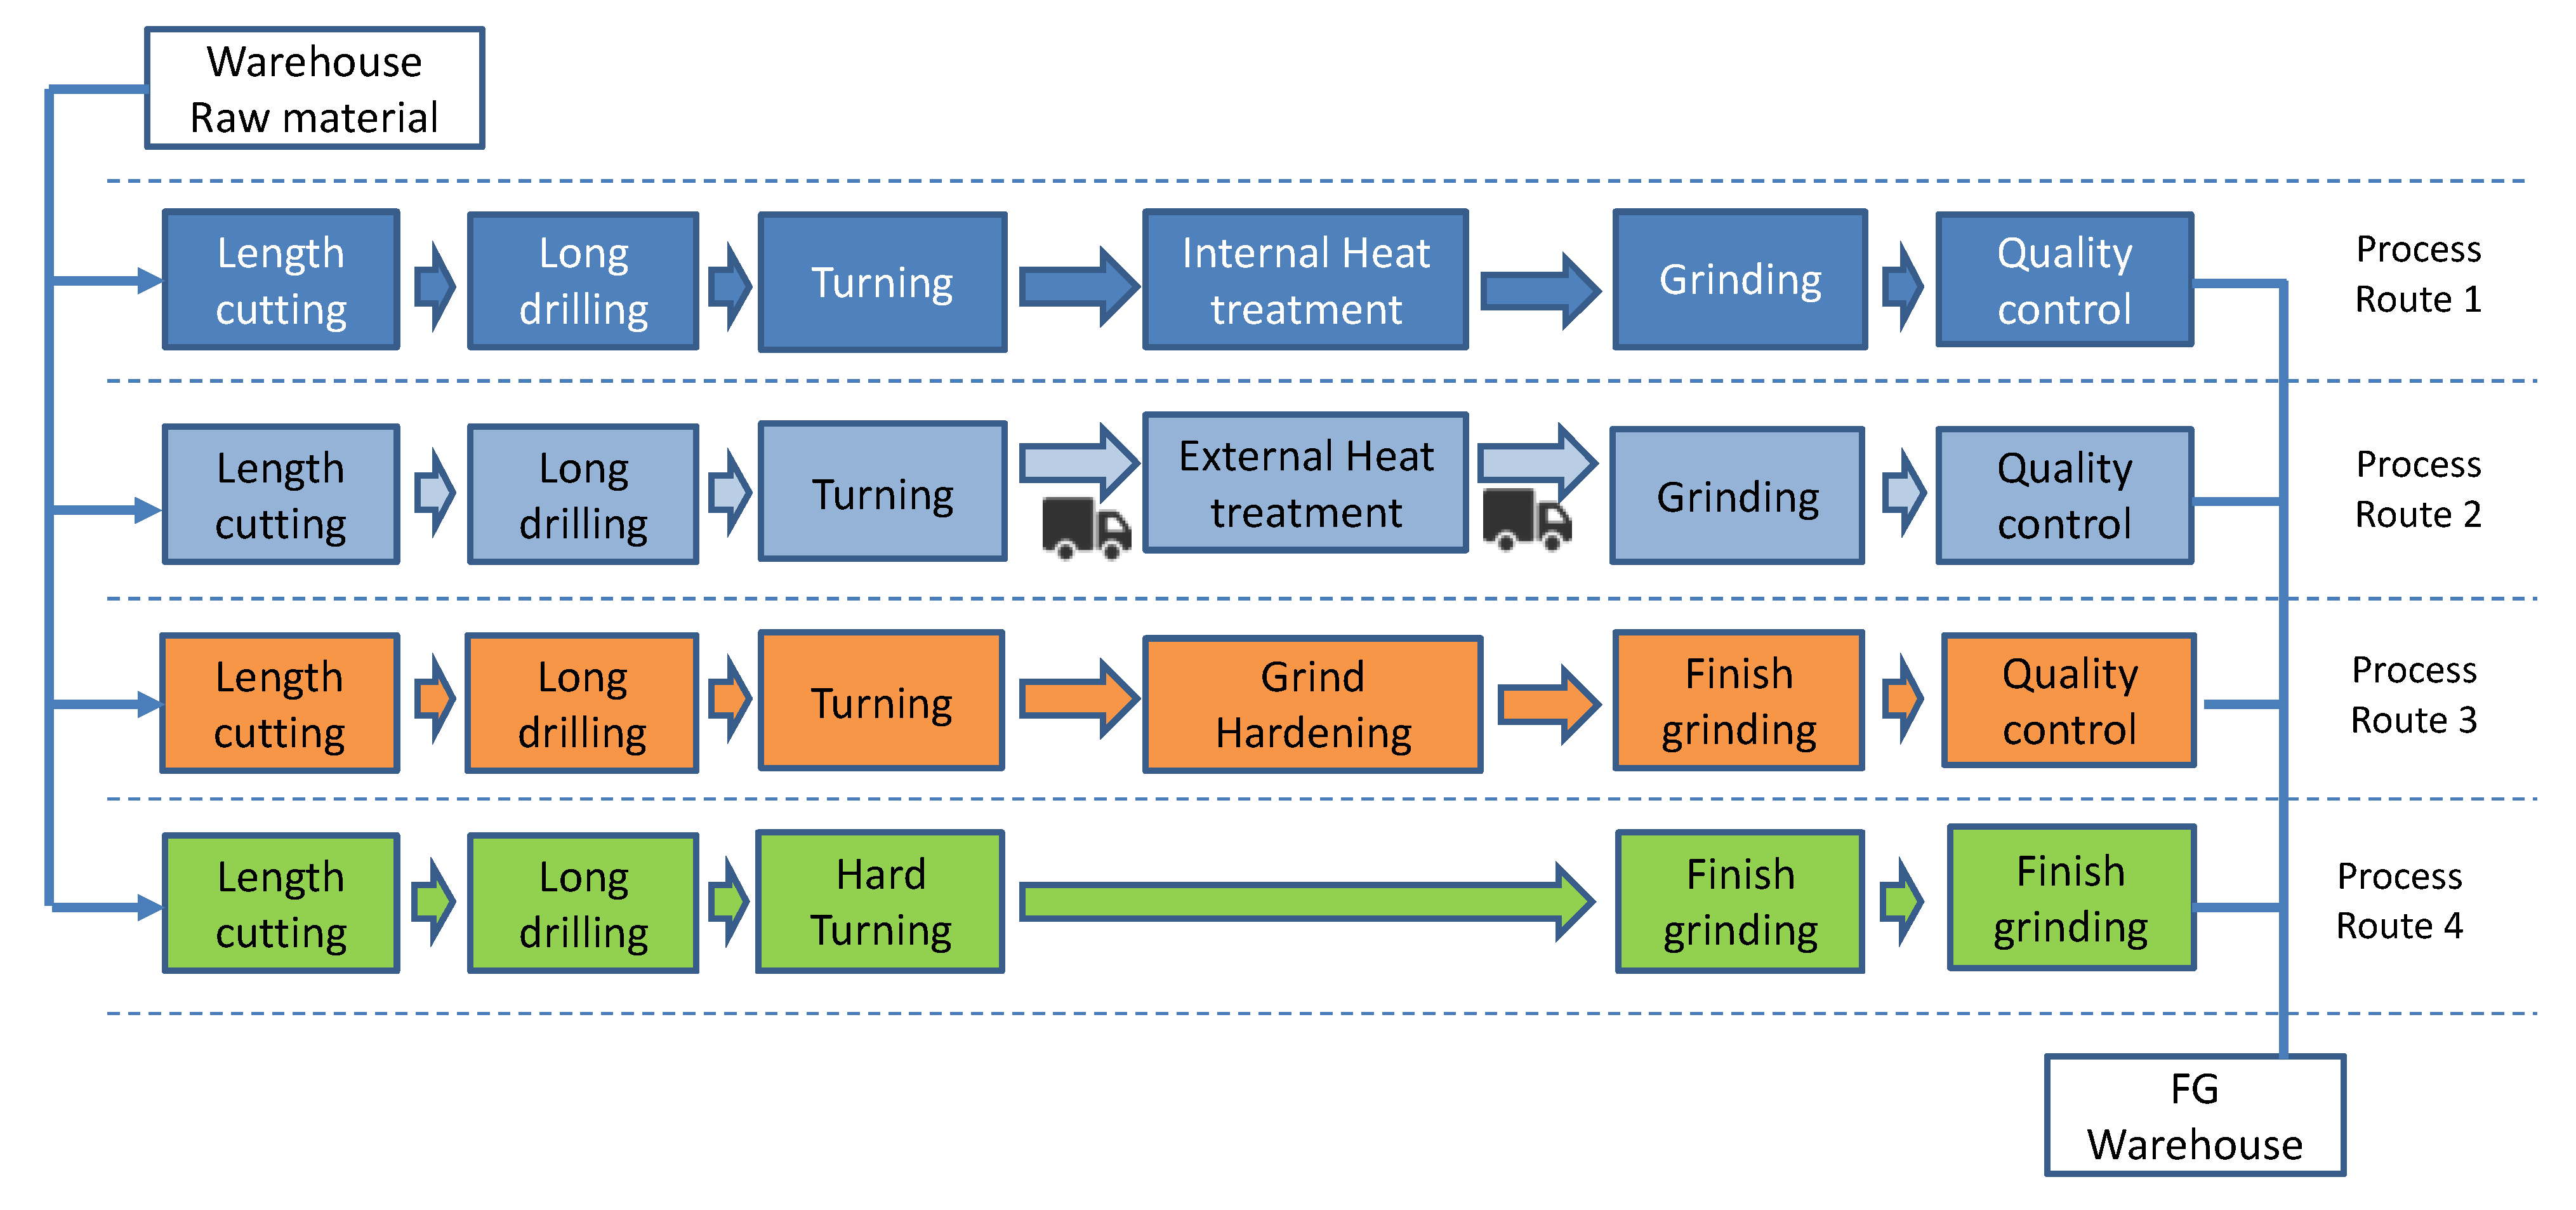
Figure 9). For the validation of the method, a case study of a simple metallic component was used. Four alternative routes of production were considered, as can be seen in
Figure 10. In all four cases, the shafts were cut to length, and then their diameters were reduced by turning on a lathe. To achieve the necessary microstructure and hardness, they were heat treated. Four different solutions could be adopted, and thus the four different routes. The first two routes used conventional salt baths for the heat treatment, although in the first case the heat treatment was done in house, whereas, in the second case, the components were transferred to an external subcontractor. For both cases, the heat treatment took place in batches. The third and fourth options relied on non-conventional heat treatment processes such as grind hardening and hard turning. In both latter cases, the heat treatment was done on each component individually. Finally, after the heat treatment, grinding was required to achieve the dimensional accuracy and the surface roughness values required by the design specifications.
7.1. Rough Assessment of Process Routes (First Phase of the Framework)
Since the purpose of this analysis is to determine the best of the alternative process plans, the values for all chosen parameters must be obtained. Thirteen criteria were identified from the literature review (n = 13), which reflected the most significant aspects of the three pillars of sustainability and are shown in
Table 2.
Table 2 shows the case of low demand as an example. These tables were also produced for the other two demand scenarios. These criteria can be classified into negative or positive criteria, with negative criteria meaning that the lower their value the better the performance, whereas, for the positive ones, the higher their value the better the performance. Therefore, it is obvious that “energy efficiency”, “raw material efficiency”, “waste management”, “H&S of workers”, “work quality”, “use of RES” and “cost efficiency” are positive criteria, whereas the rest are negative criteria. For the qualitative assessment of the various routes, the various criteria are assessed in three levels and compared to the rest of the alternative routes. The routes that are expected to have the highest performance with regards to the specific criterion are marked with “+++”, the routes with the least with “+”, and the routes in between with “++”. As an example, on the one hand, for the “energy efficiency” criterion, Process Route 4 has the potential to have the highest energy efficiency, as the number of processes is minimized and there is no need. On the other hand, Process Routes 1 and 2 have the lowest expected performance with regards to energy efficiency, as they require heat treatment processes that are based in salt baths that require high energy input. This information can be collected from the production managers and is based on experience. Therefore, this needs to be considered carefully, as it most likely incorporates a degree of bias. However, this bias can be minimized, if the comparison and marking are done by more than one individual.
As shown in
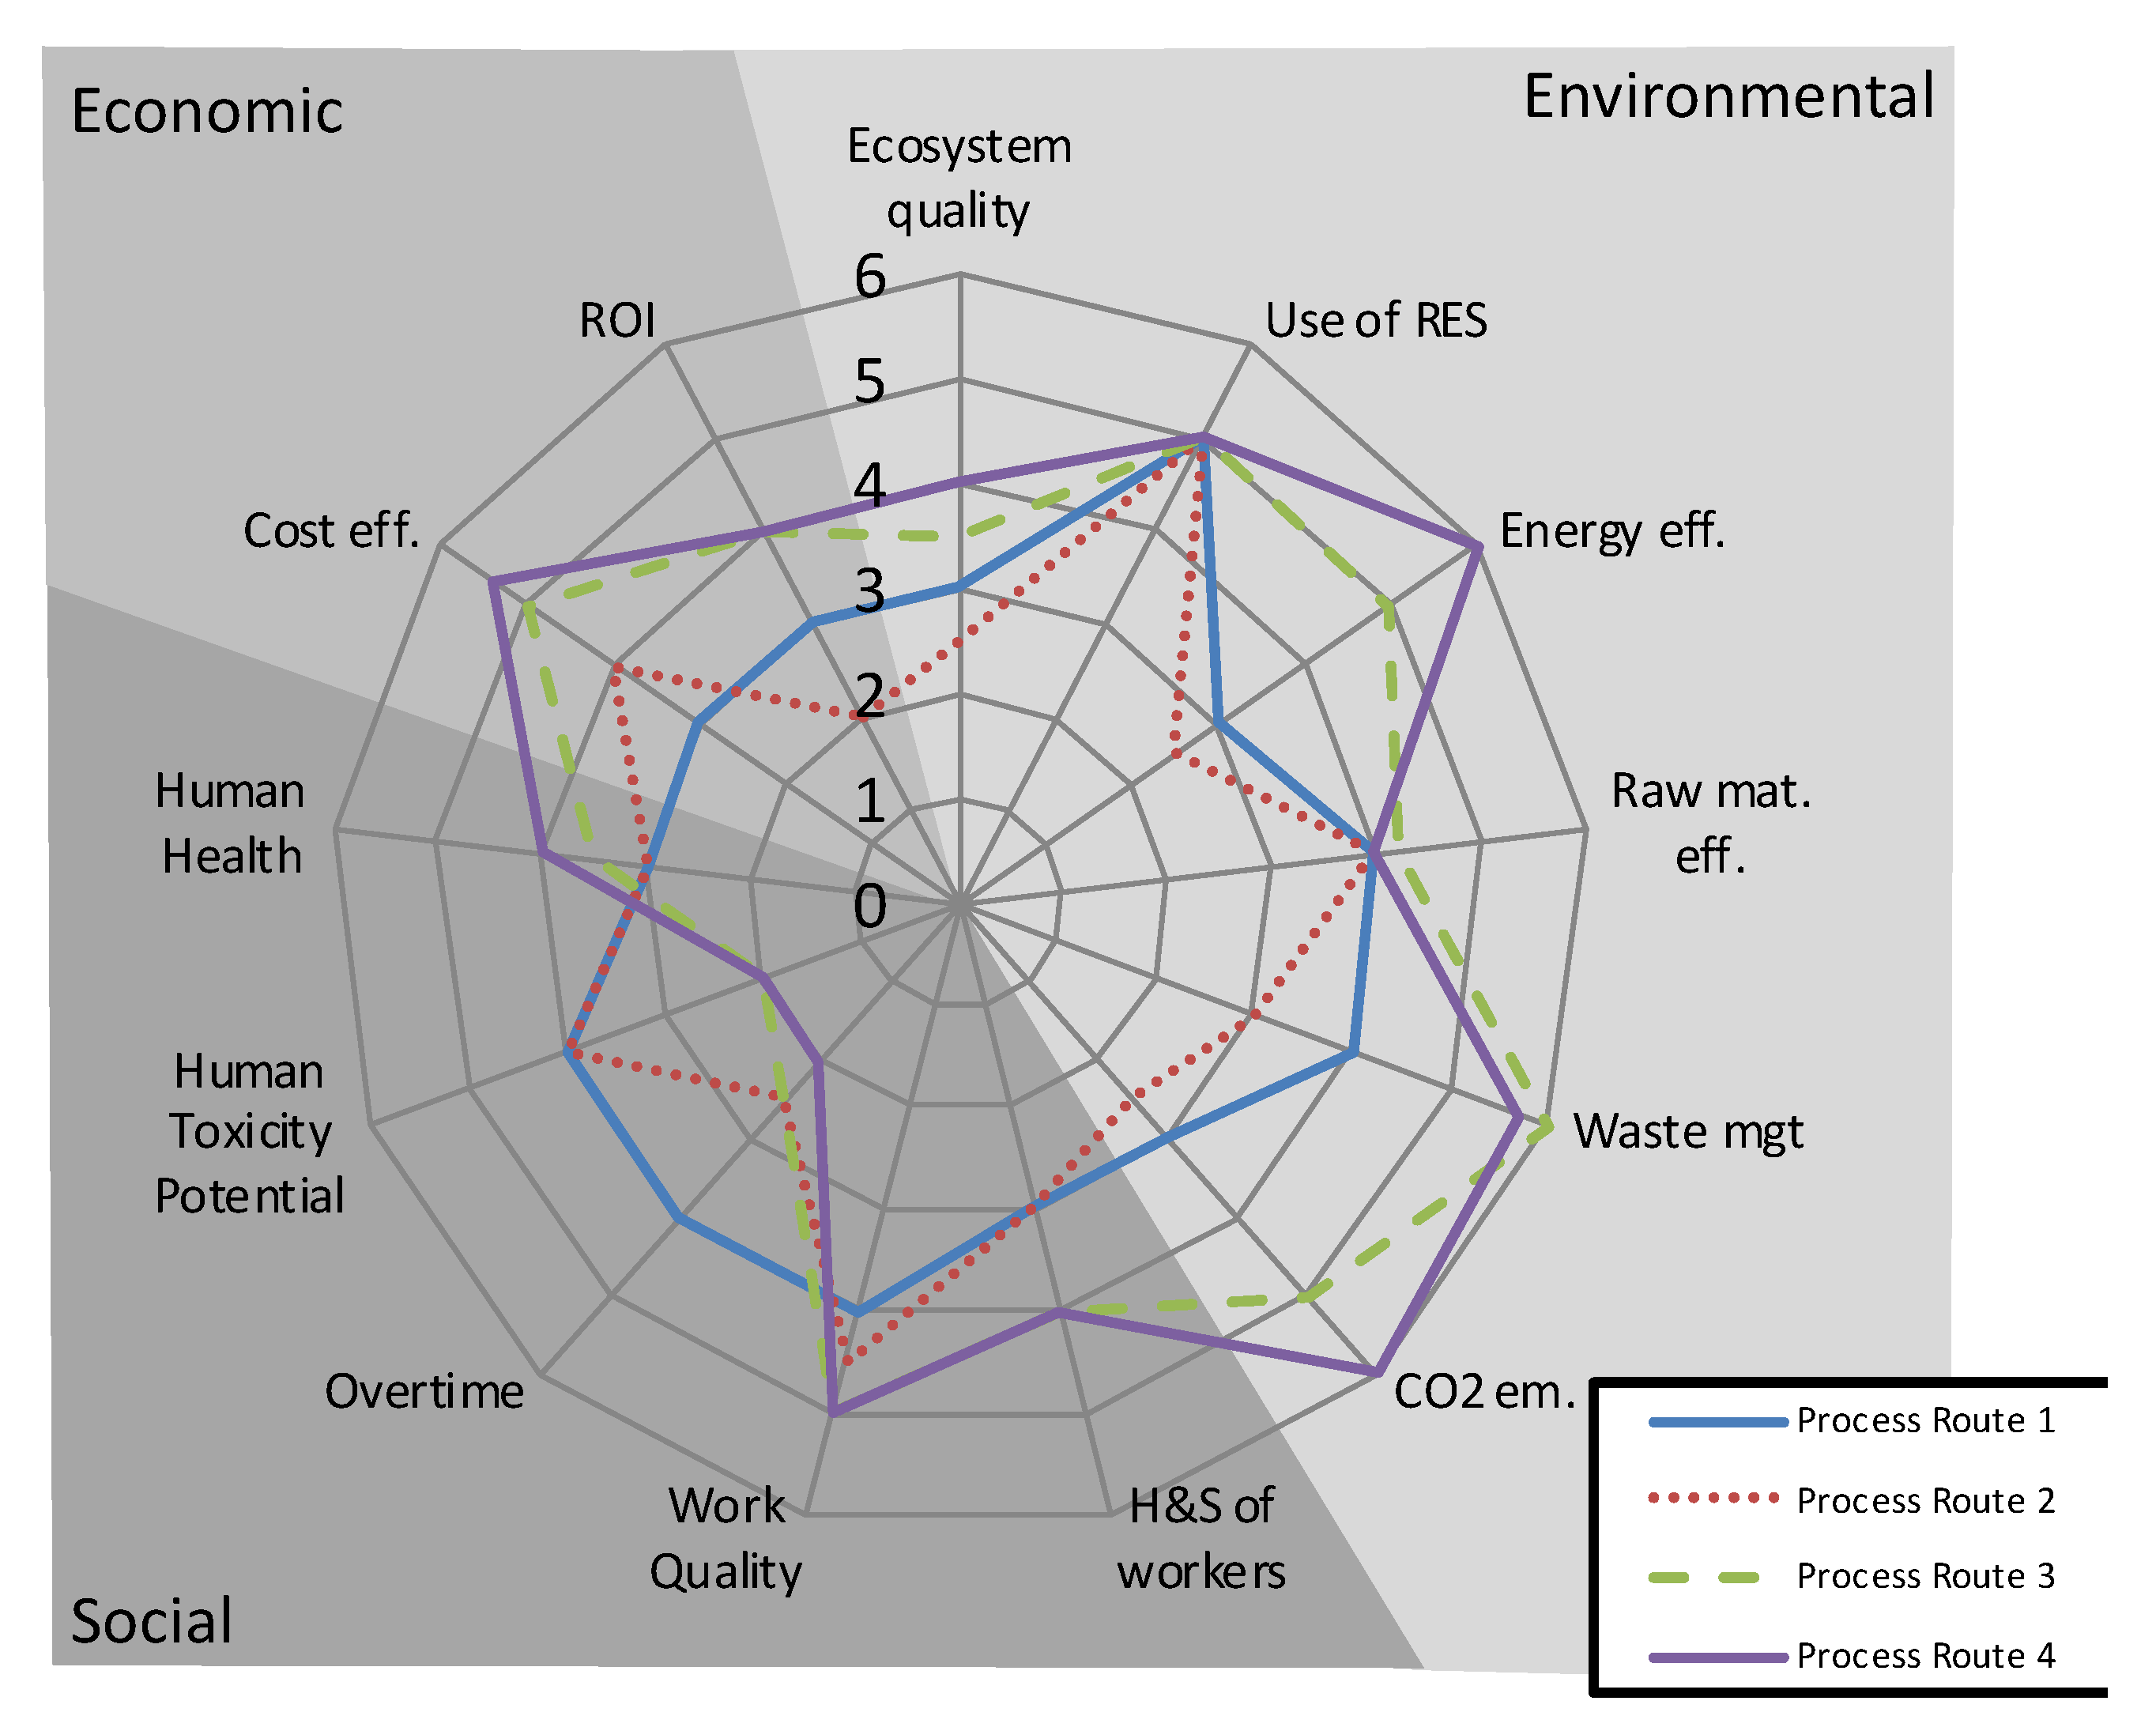
Table 2, even for the simple component used for validation, no process route can be selected at first glance. Radar diagrams can be used to refine the solution and choose the correct process plan.
Figure 11 presents such a diagram for one of the demand scenarios (low demand). For the development of the radar diagrams, practitioners with experience in the production (such as production managers and operators) are asked to rank the process routes on a scale from 0 to 6. In the radar diagram, the average score for each criterion is shown. All criteria are considered to be of equal importance (equal weights). Such diagrams allow the visual comparisons and visual evaluations of the different process routes.
The cumulative success for every process route can be quantified as the area within the region defined by the “radar” diagram for an initial rough evaluation. This can be easily calculated as per the following equation (generically presented for
n criteria
CR):
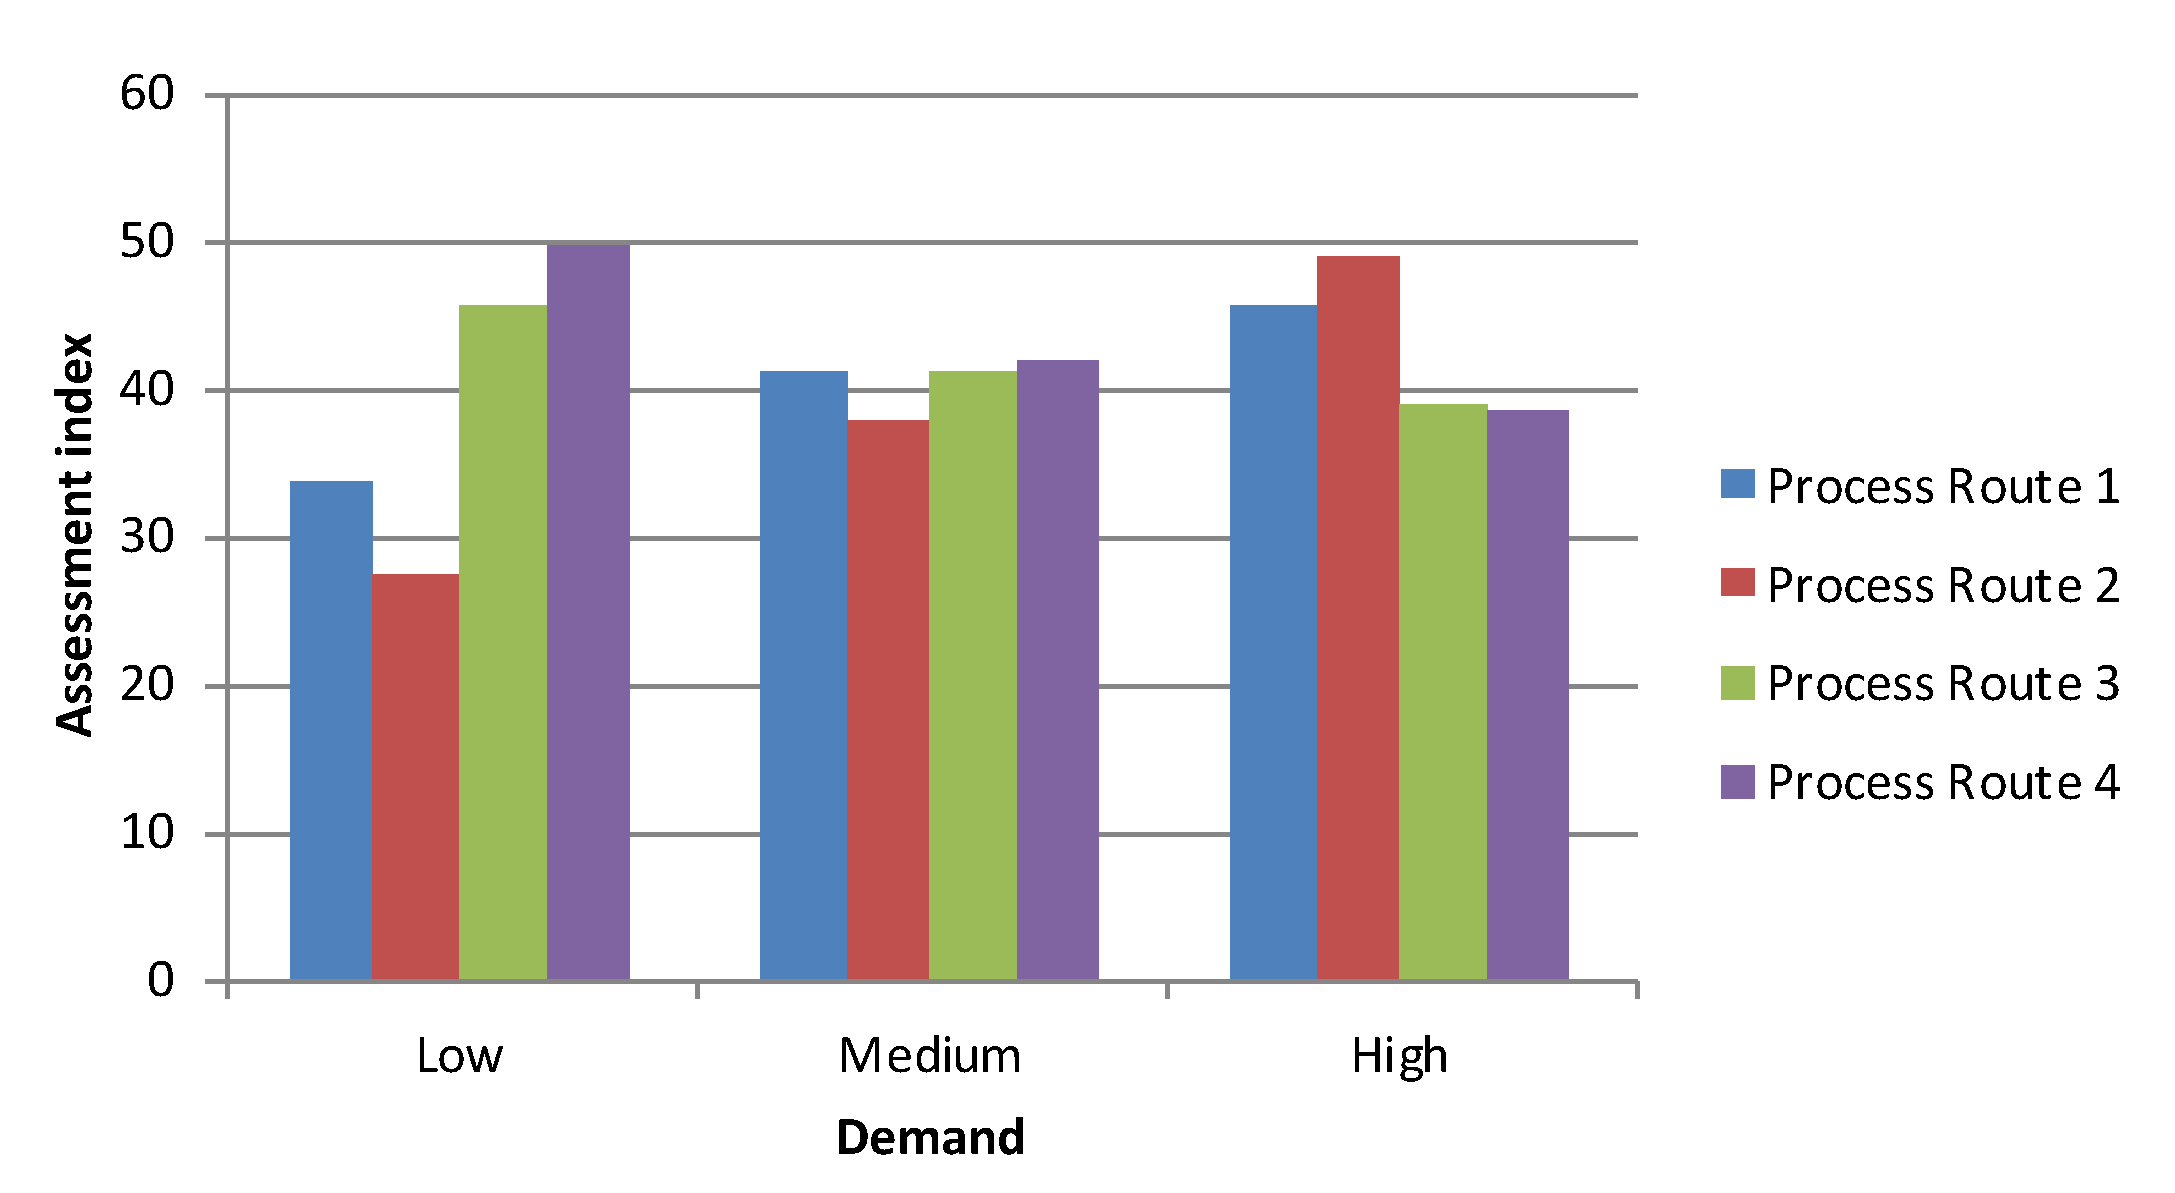
In
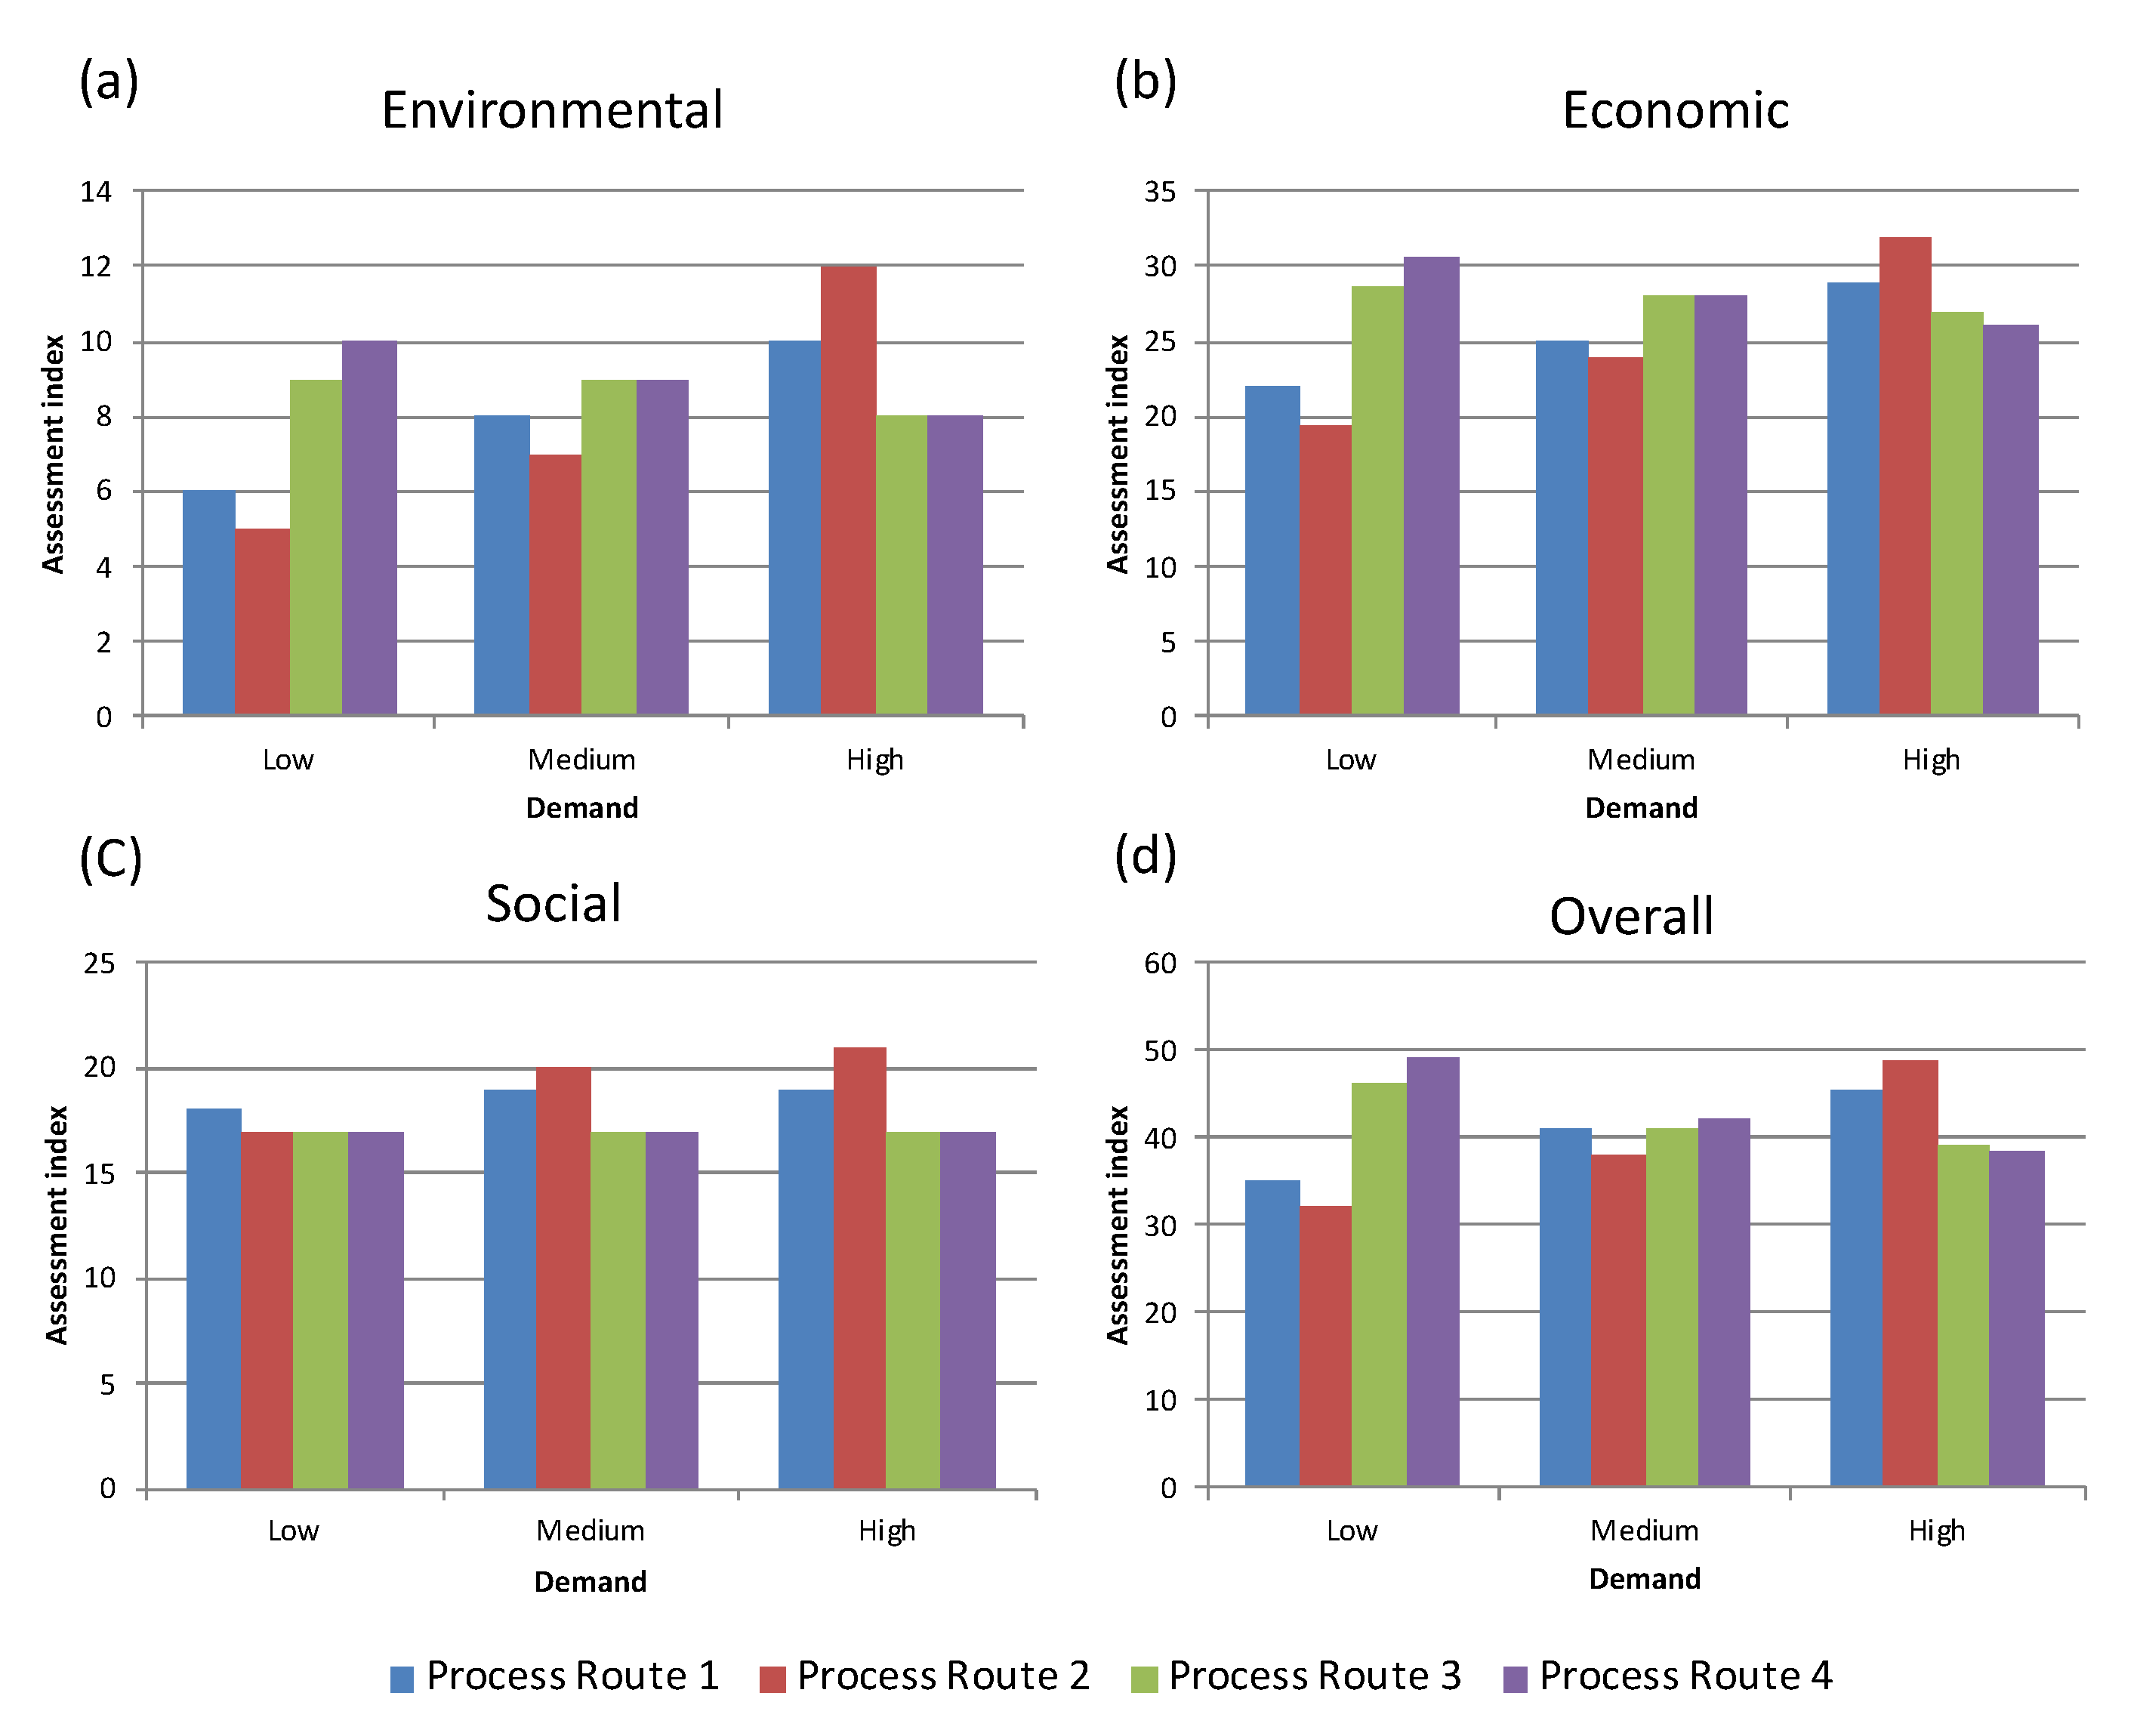
Figure 12, the index for each process route under three different market demand scenarios are presented.
This initial rough assessment, however, treats all criteria with equal importance. By assigning weights, the relative importance of specific criteria can be highlighted. The weights can also help identify the process routes that perform better when interested in specific pillars of sustainability.
Figure 13 compares the four different process routes when the focus is on the environmental, economic, or social pillars of sustainability. This is achieved by assigning a weight factor of one to the criteria of the respective pillar of interest, and 0.80 for the rest of the criteria.
Figure 13 highlights how the proposed method can be used to compare different manufacturing outputs and market demand scenarios under different criteria. For example, it is obvious that Process Route 2 is the preferred solution when the demand is high. That has to do with the fact that the production of shafts in large batches allows for economies of scale and makes use of an external partner for the heat treatment of the product. However, in low demands, such a process route is not favorable, as both the cost of the external subcontractor, as well as the environmental implications of transporting the small batches to the external location, reduces the overall assessment index.
An additional example of how such a dashboard can be used for decision making is, for example, the case of a low demand scenario. If the focus is on the economic or environmental performance, the best process route is the fourth one, whereas if the focus is on the social implications of the production, then the best processing route is the first one. Such information can help decision makers reach conclusions, revealing information that would be otherwise hidden if the decision was to be reached based on an aggregated index.
The validation scenario discussed in this study is applied to single component manufacturing and there is a one-to-one direct relationship between the batch size and energy consumption. The discussed approach is much more useful in a complex scenario where there is an inverse relationship, such as in additive manufacturing (AM) processes. In AM processes, batch size plays a vital role in deciding the cost of the part and energy costs. Therefore, the sustainability tool can be beneficial in deciding the suitability of AM processes over conventional for batch production at the industrial level, taking into account the factors of cost, time, quality, yield, energy consumption, and sustainability.
7.2. Detailed Assessment of Highest-Ranked Process Routes (Second Phase of the Framework)
The rough assessment of the various process routes determines their ranking. However, as mentioned, this rough ranking is based on qualitative comparison of the routes per criterion. For the more detailed and quantitative assessment, multi-criteria decision-making techniques such as the TOPSIS method described in
Section 6.5 should be considered. Following on to the case presented, the process routes ranking changes as per the demand scenario (
Figure 12). For low and high demand scenarios, the process route that outperforms the others is clear. However, for the case of medium demand, the differences in performance between the four options are slight and no confident decision can be reached. In such cases, more quantitative and detailed assessment is required. As per the framework outlined in
Section 6, the next step is to perform TOPSIS specifically for the medium demand scenario. According to the process outlined in
Figure 6, the decision matrix table is formulated. The variables’ values are calculated (for example energy consumption can be calculated based on either energy audits or based on the physics of the process, CO
2 emissions can be calculated using life cycle analysis of all the stages involved) or assumed based on literature review findings (such as the case of human health and ecosystem quality).
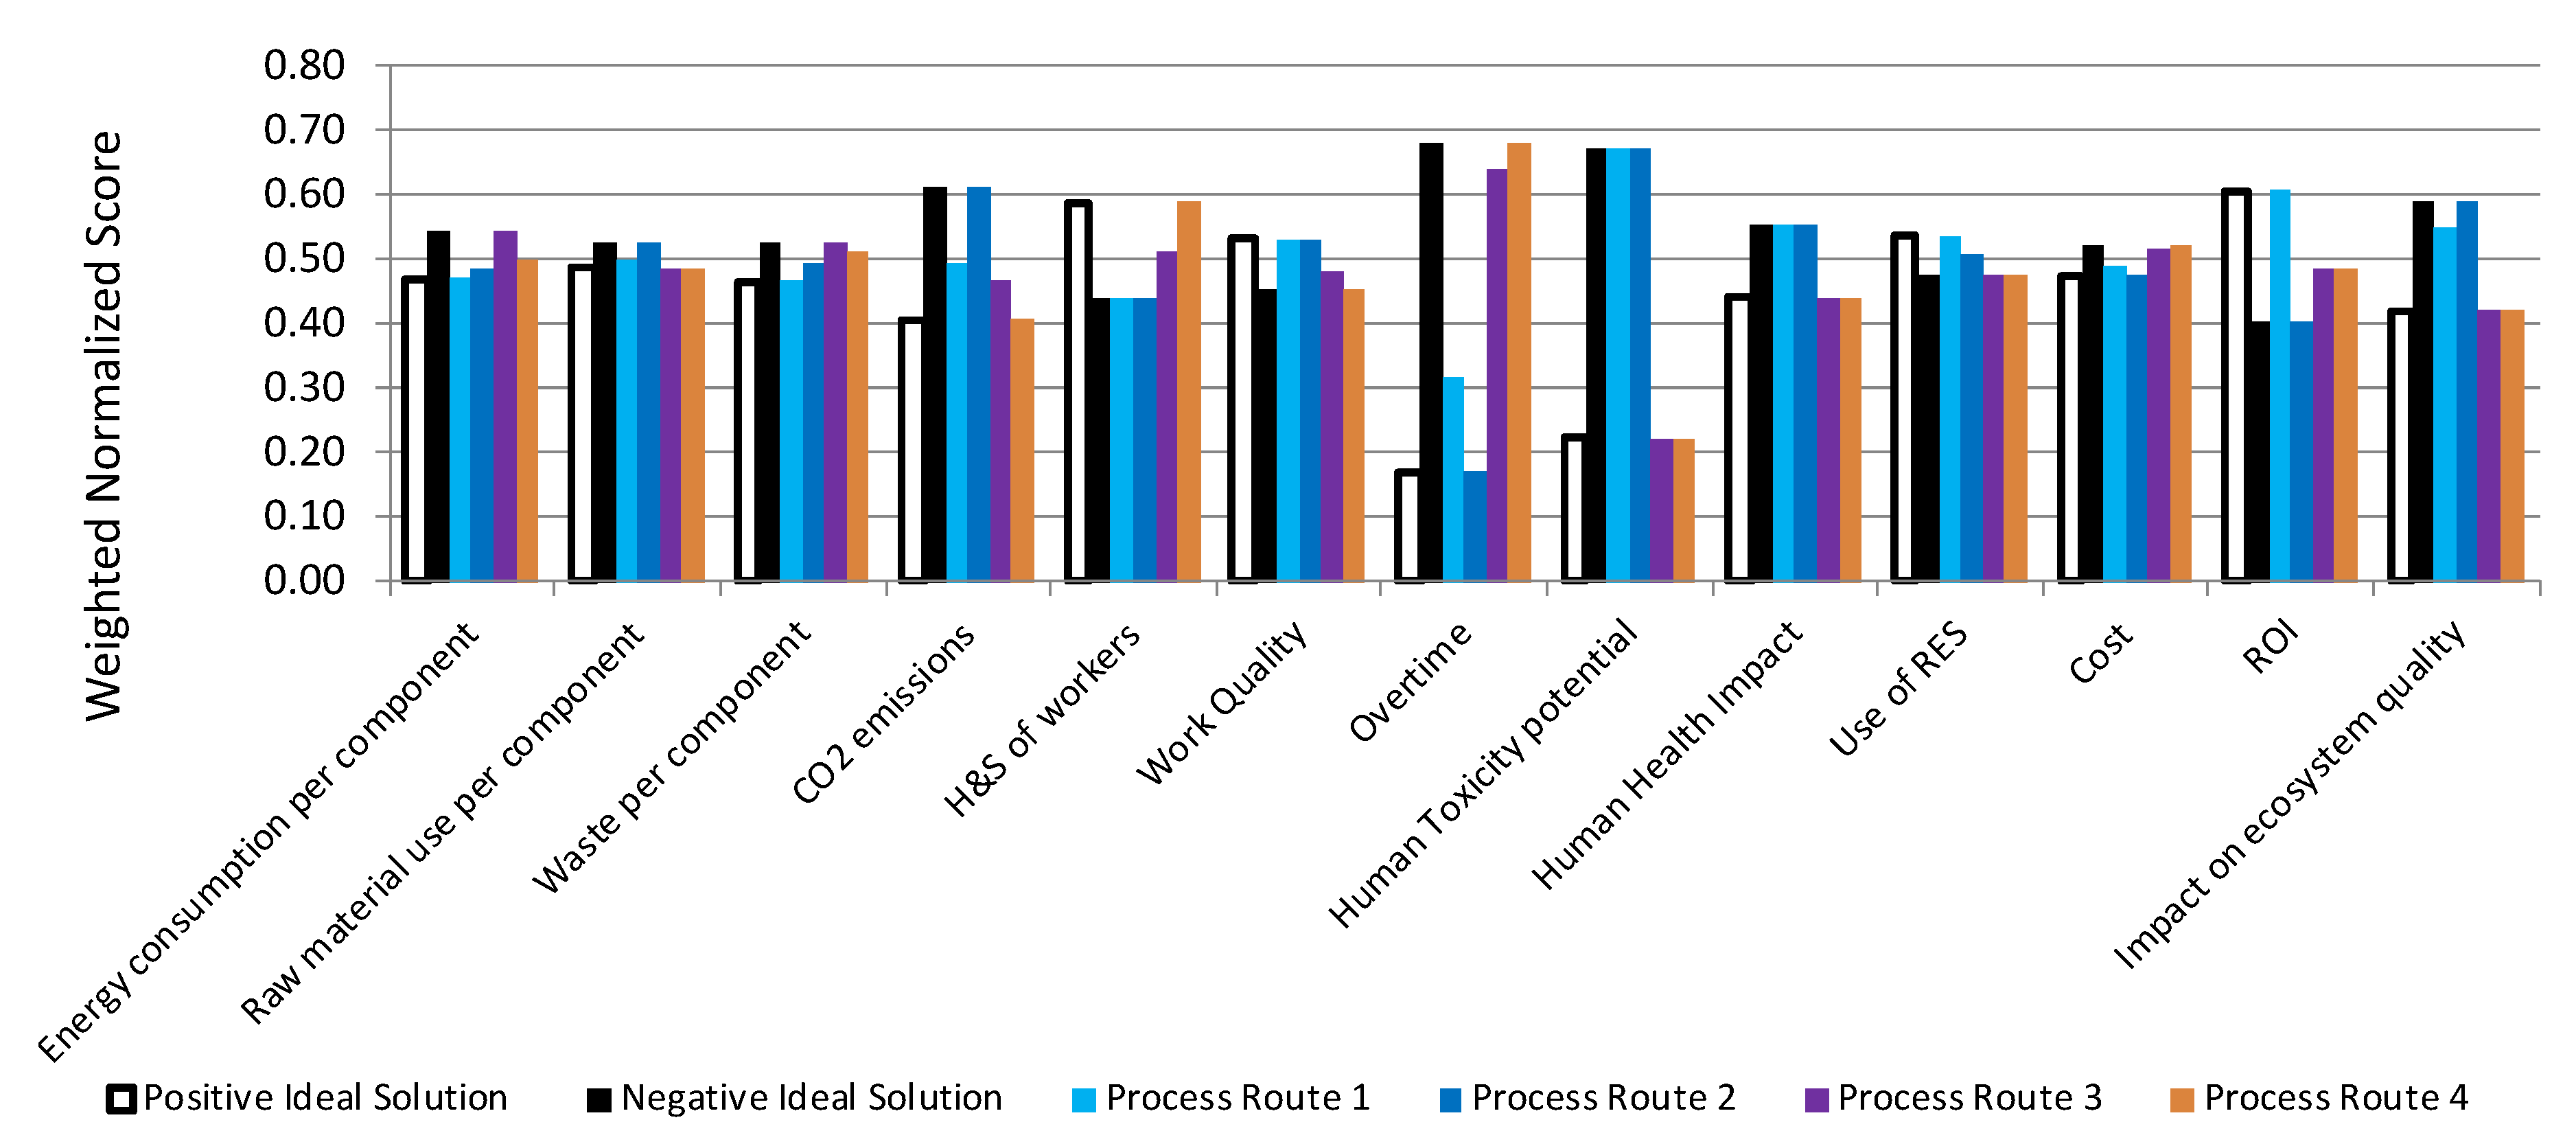
Table 3 presents the decision matrix and
Table 4 presents the normalization of the variable values.
The weight factors specifically affect the outcome of the process and are focused on the realistic technical skills of decision makers; thus, the more qualified the decision makers are, the more analytical the result. While most qualities can be represented in quantitative terms, this is a very daunting activity. For the needs of the present study, as in previous sections, the weighting factors are used in order to compare the routes when the focus is shifted to any one of the three pillars of sustainability. As a benchmark, the TOPSIS analysis results for the case of equally weighted criteria are shown in
Figure 14. For this benchmarking case, the optimum process route is identified based on the calculation of the relative closeness of each alternative process route to the ideal solution. Process Routes 2 and 3 were found to provide the best option (C
3 = C
4 = 0.51), followed by Process Route 2 (C
2 = 0.47) and Process Route 1 (C
1 = 0.44).
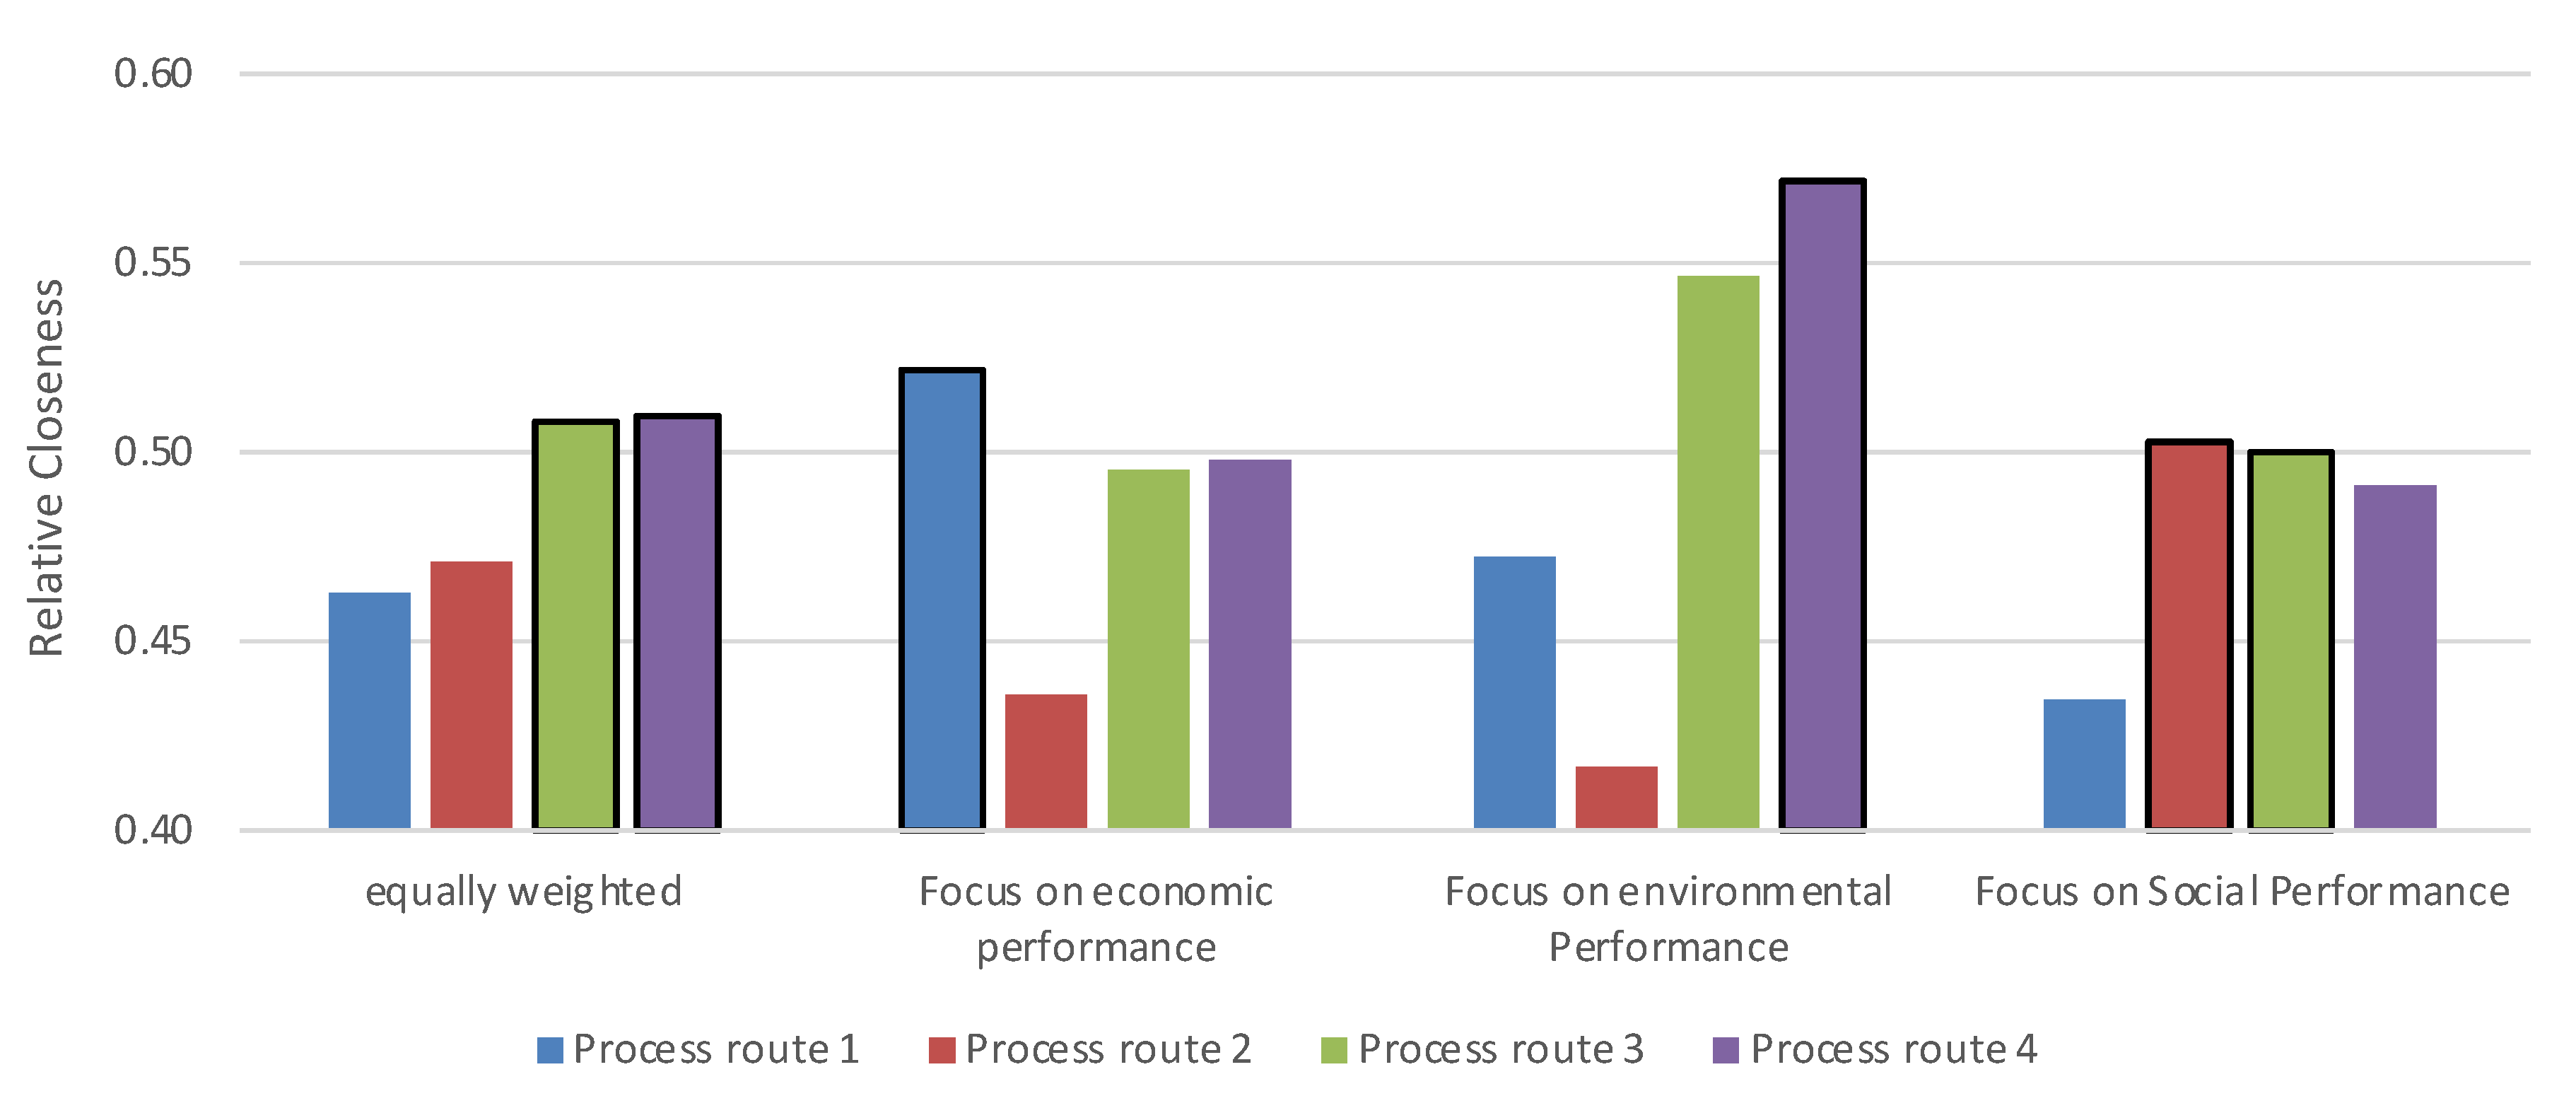
One of the key strengths of the TOPSIS method is the ease with which the importance is allocated to each variable. Therefore, if the focus was on the economic pillar of sustainability, by assigning a weighting factor for economic variables equal to one, and all the rest to 0.5, then, the preferred process route would be the first one. In
Figure 15, the relative closeness is presented for the case of altering the importance of economic, environmental, and social respective variables. Process Routes 4 and 3 are preferred as processing routes, but if the focus is solely on the economic performance then Process Route 3 is preferable, and if the focus is on the environmental performance then Process Route 4 should be selected. Finally, if the focus is on the social performance, either Process Route 2 or 3 should be selected.
8. Conclusions
This paper presents and discusses a framework for assessing the impact of manufacturing operations’ decisions on sustainable performance. It allows the ranking of different production routes, early in the design phase of a component, with regards to their performance in all three sustainability pillars. The methodology proposed helps in planning and scheduling manufacturing operations. The framework is composed of two phases, which include the rough ranking of the alternative process routes, in the first phase, and their detailed assessment and analysis, in the second phase. The tool was implemented in MS Excel coupled with MS Access databases. It was validated for the case of the manufacturing of hardened shafts using four different potential process routes. The validation highlighted that there was not an easy answer, and that it depended largely on the demand.
The potential for future innovations exists and a variety of topics have been defined, such as a material selection module to be integrated with the off the shelf software for selection of materials. The forecasting algorithms are implemented in MATLAB and interfaced with the market forecast module. Advance techniques such as artificial intelligence could further be explored and could be integrated for precise market forecast based on the historic dataset. The tool presented in this work can be used to couple sustainability and energy metrics which would be beneficial in identifying the optimal scenarios for energy-efficient manufacturing processes, particularly for energy-intensive processes (such as metal castings). Energy consumption costs could be reduced, while at the same time, identifying and incorporating clean manufacturing practices within manufacturing operations.


_Kechagias.jpg)


