6.1. Thermal Characteristics of a Biofuel Pellet
The numerical solution for applying the different thermal conditions in the torrefaction process was analytically examined with the help of the PDE thermal model for a biofuel pellet. On the other hand, the mass diffusion of volatile and water content was modelled through a pdepe module. The interpolated solutions at different spatial positions other than the mesh points were computed by a slicing technique. The torrefaction temperature was kept constant and the effect of time and heat flux on the temperature distribution and mass diffusion was determined. The temperature in the quasi-static state of the control volume was constant, while it varied linearly in the dynamic condition applied to the Joule heating system. Though the thermal history is known, how the biofuel pellet (system) responds to changes in the state of the surrounding (chamber) was targeted during finite element analysis.
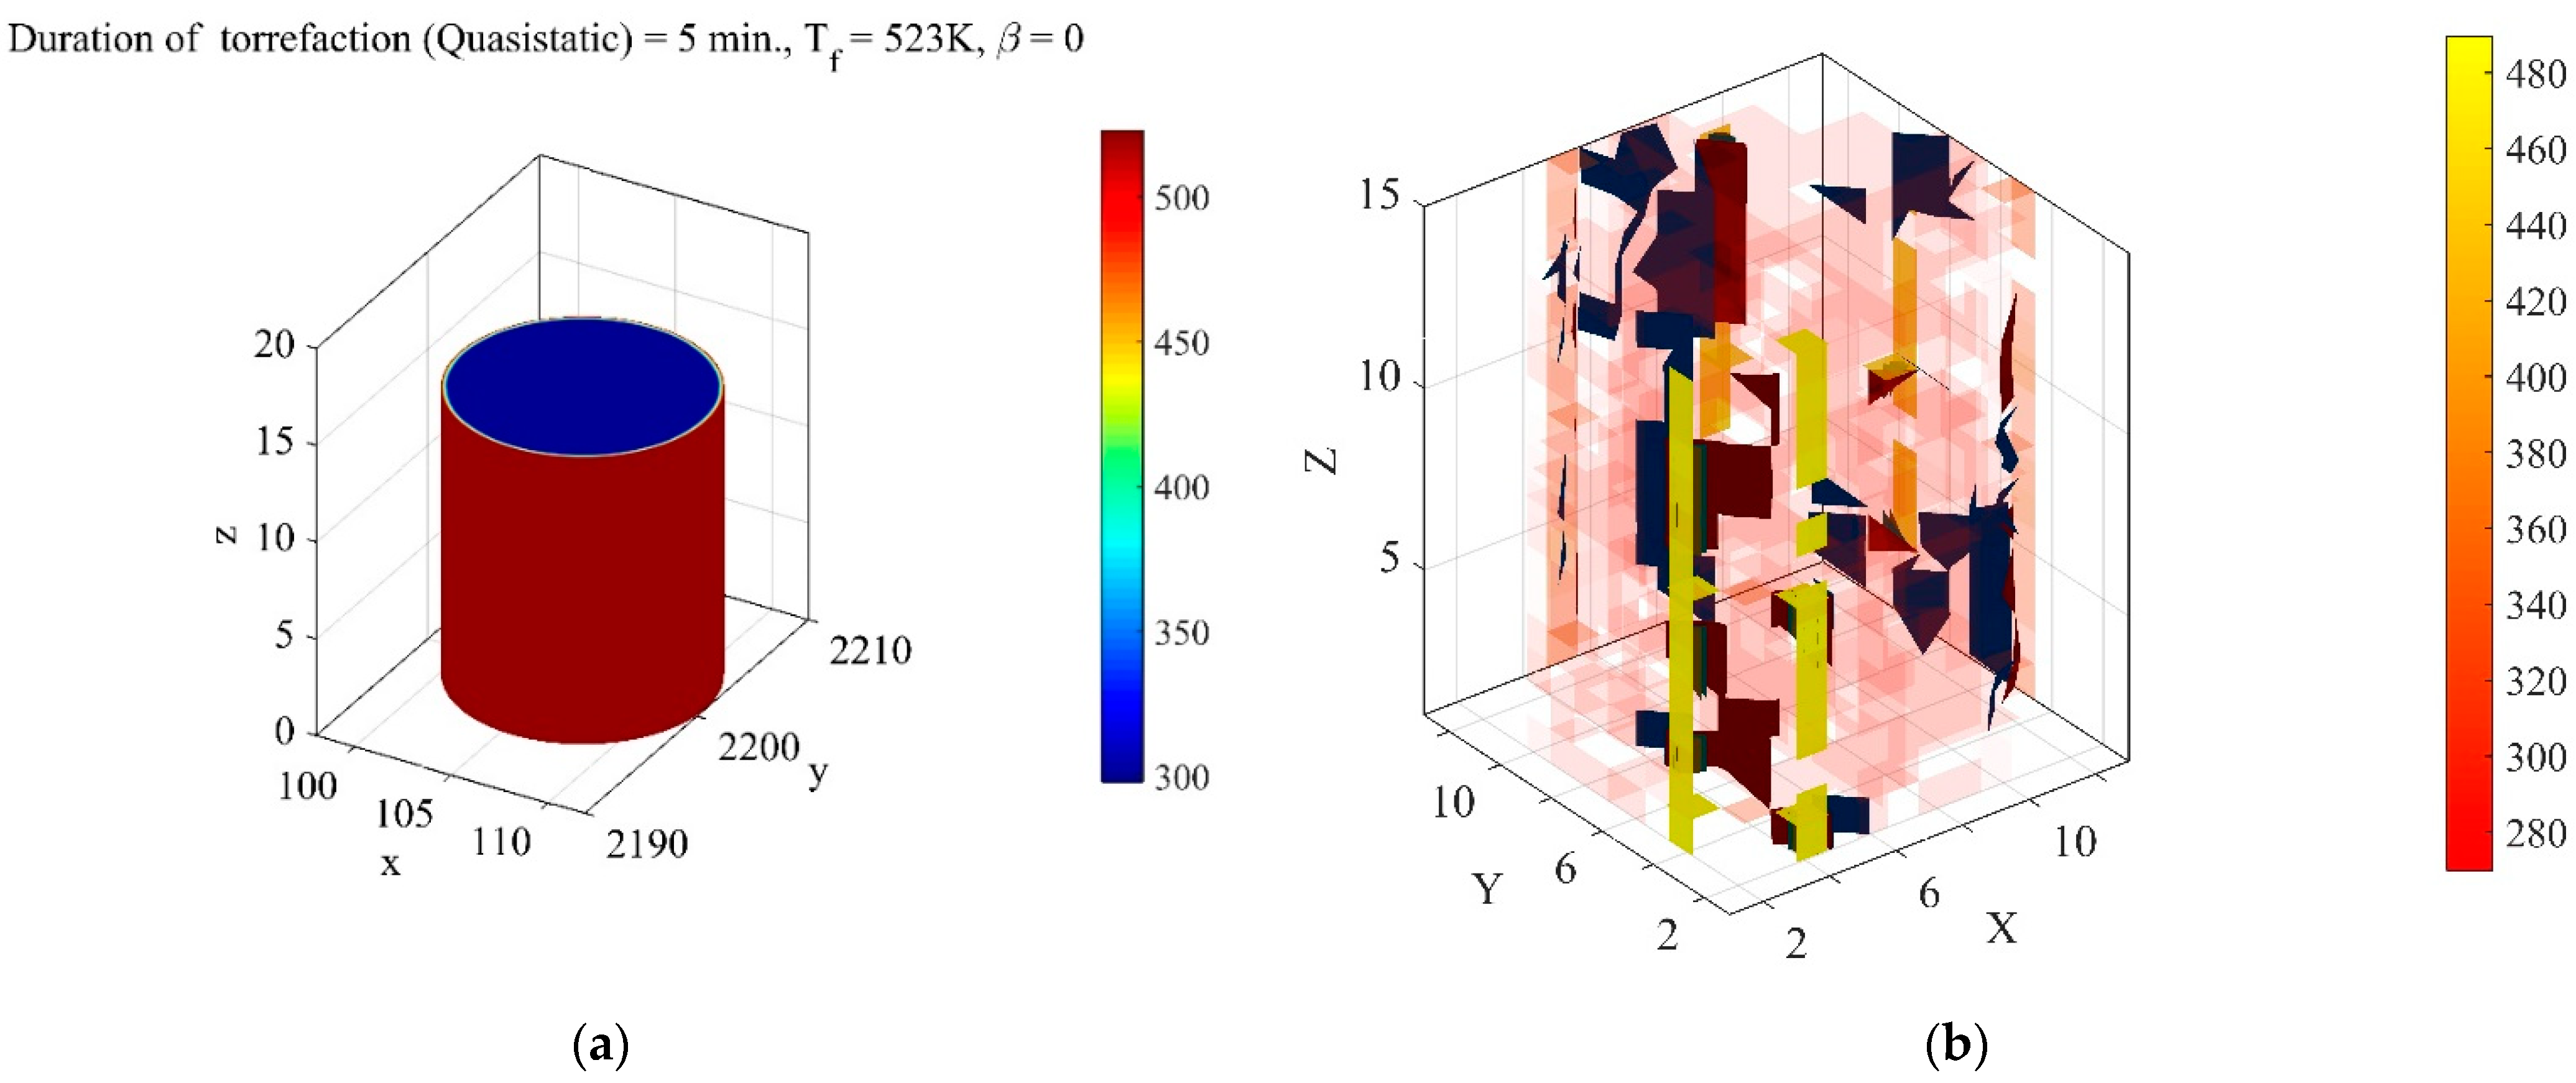
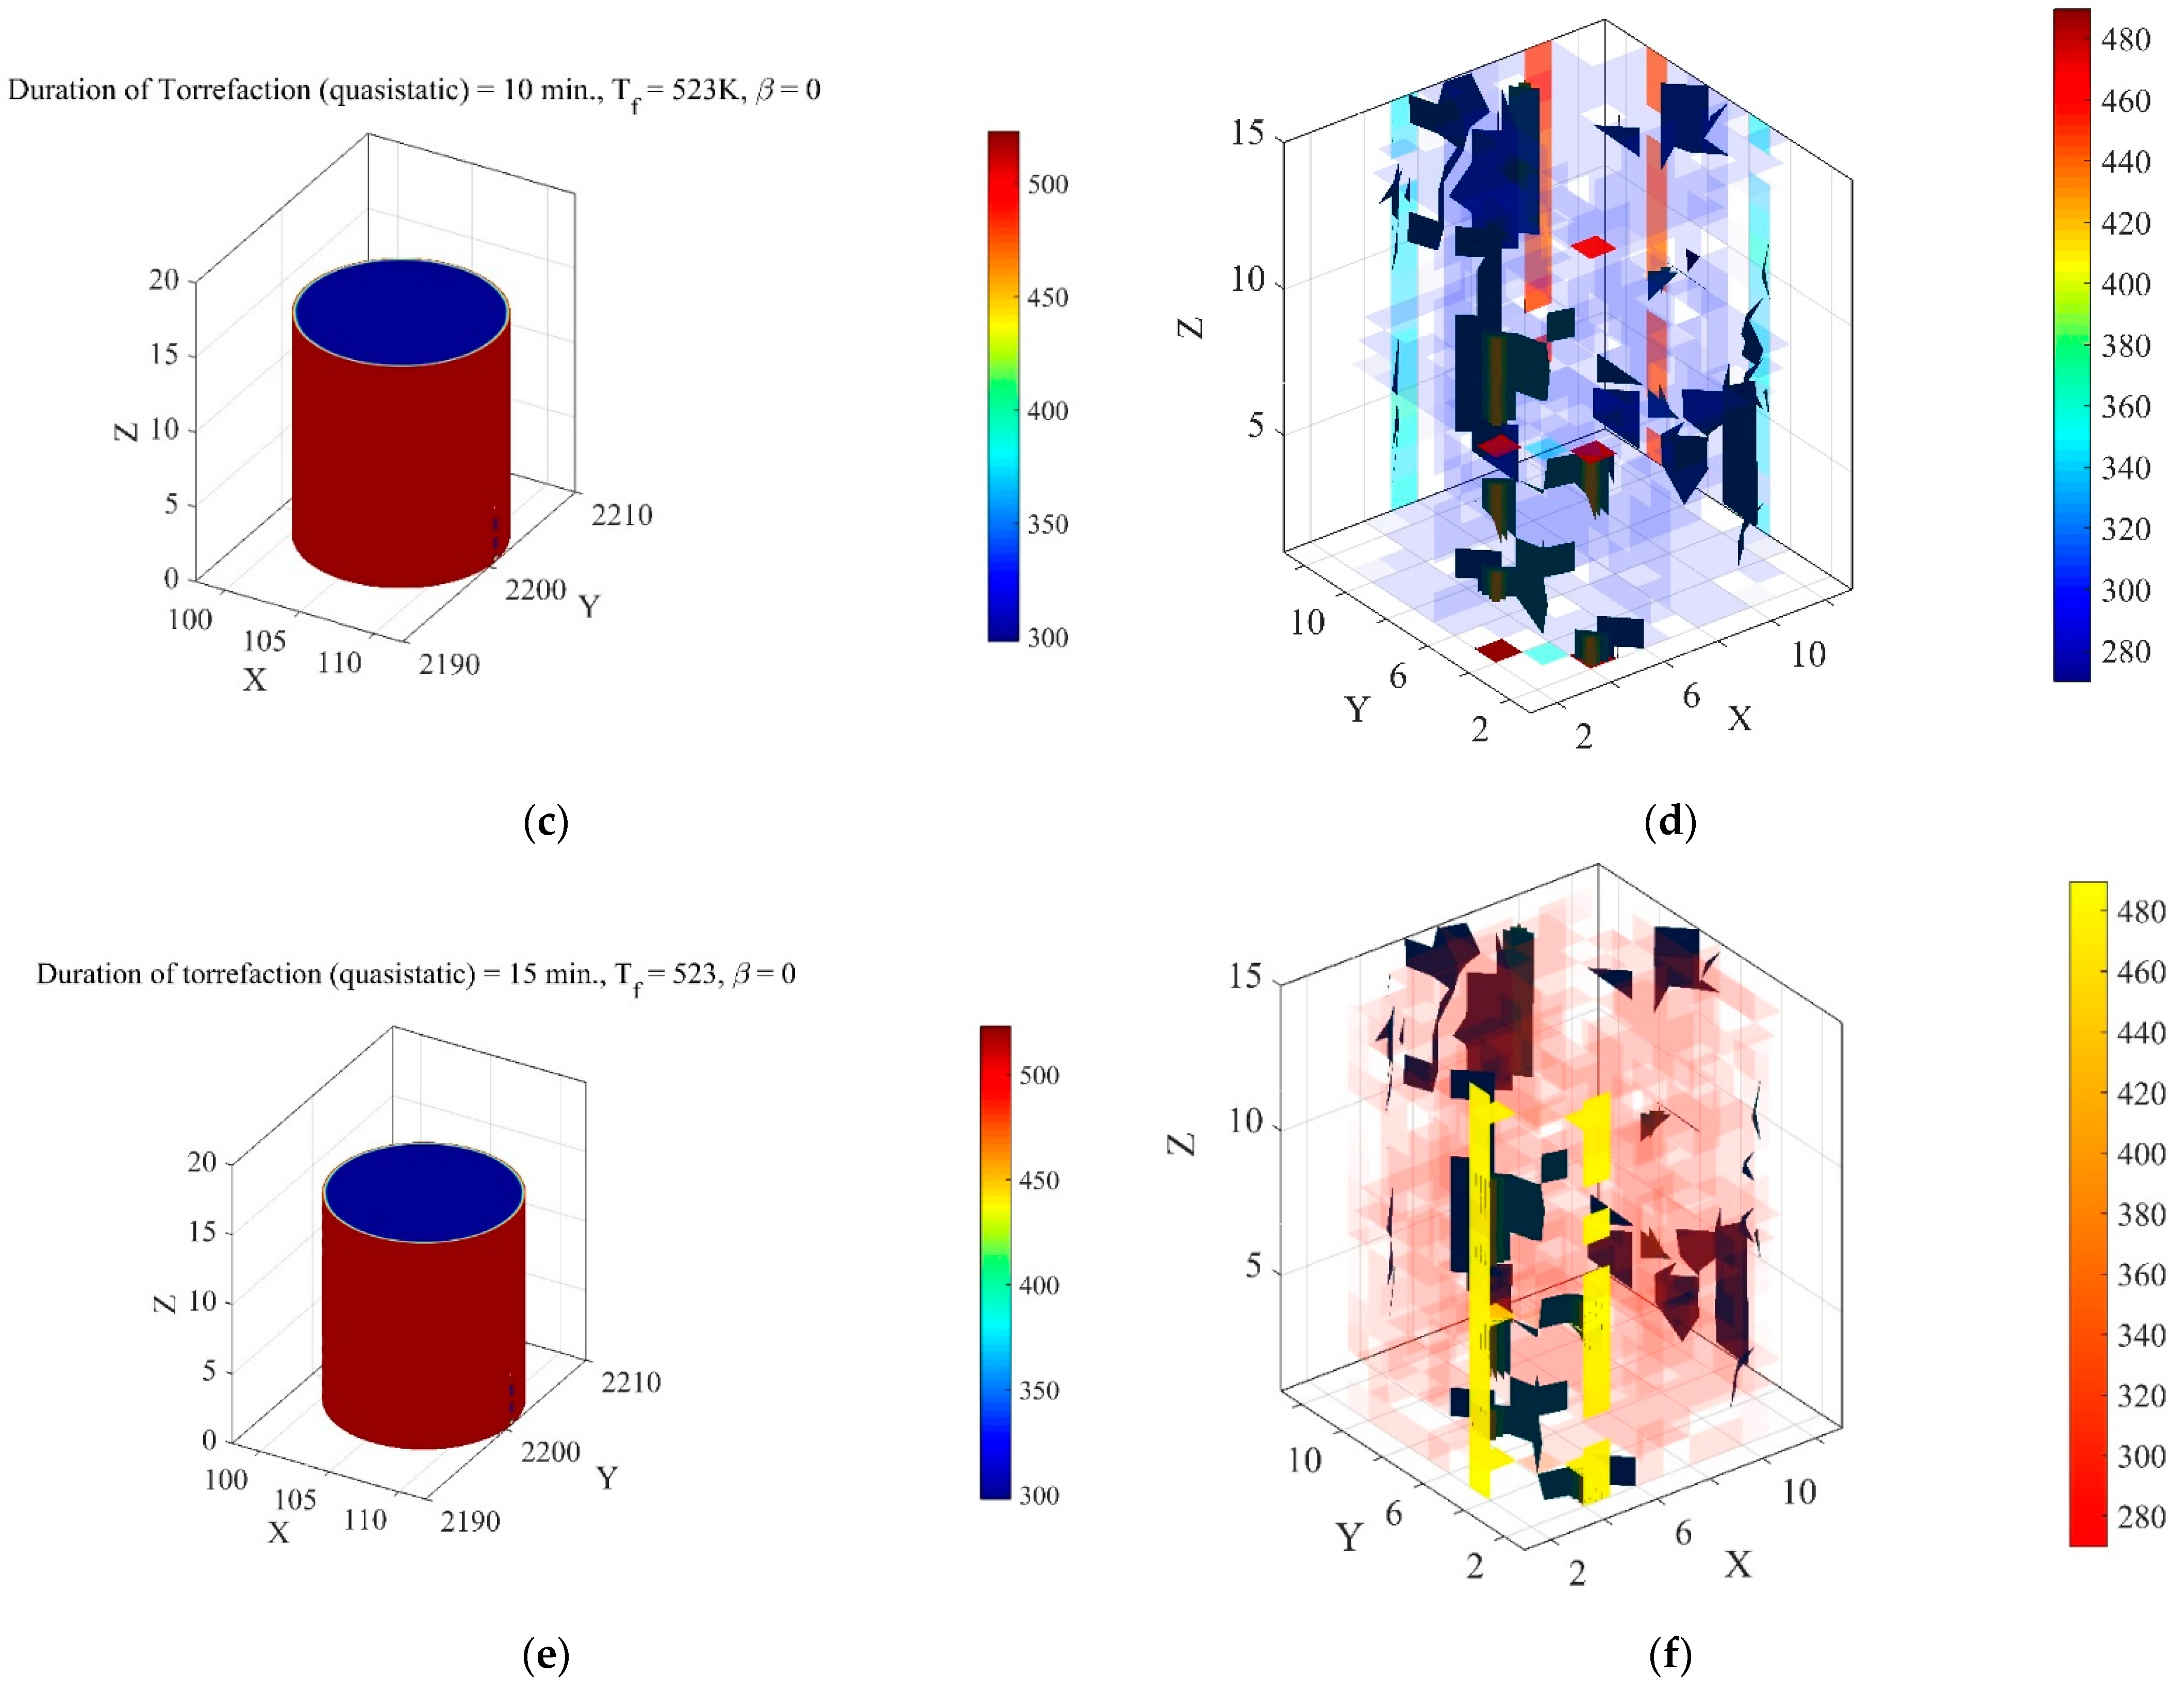
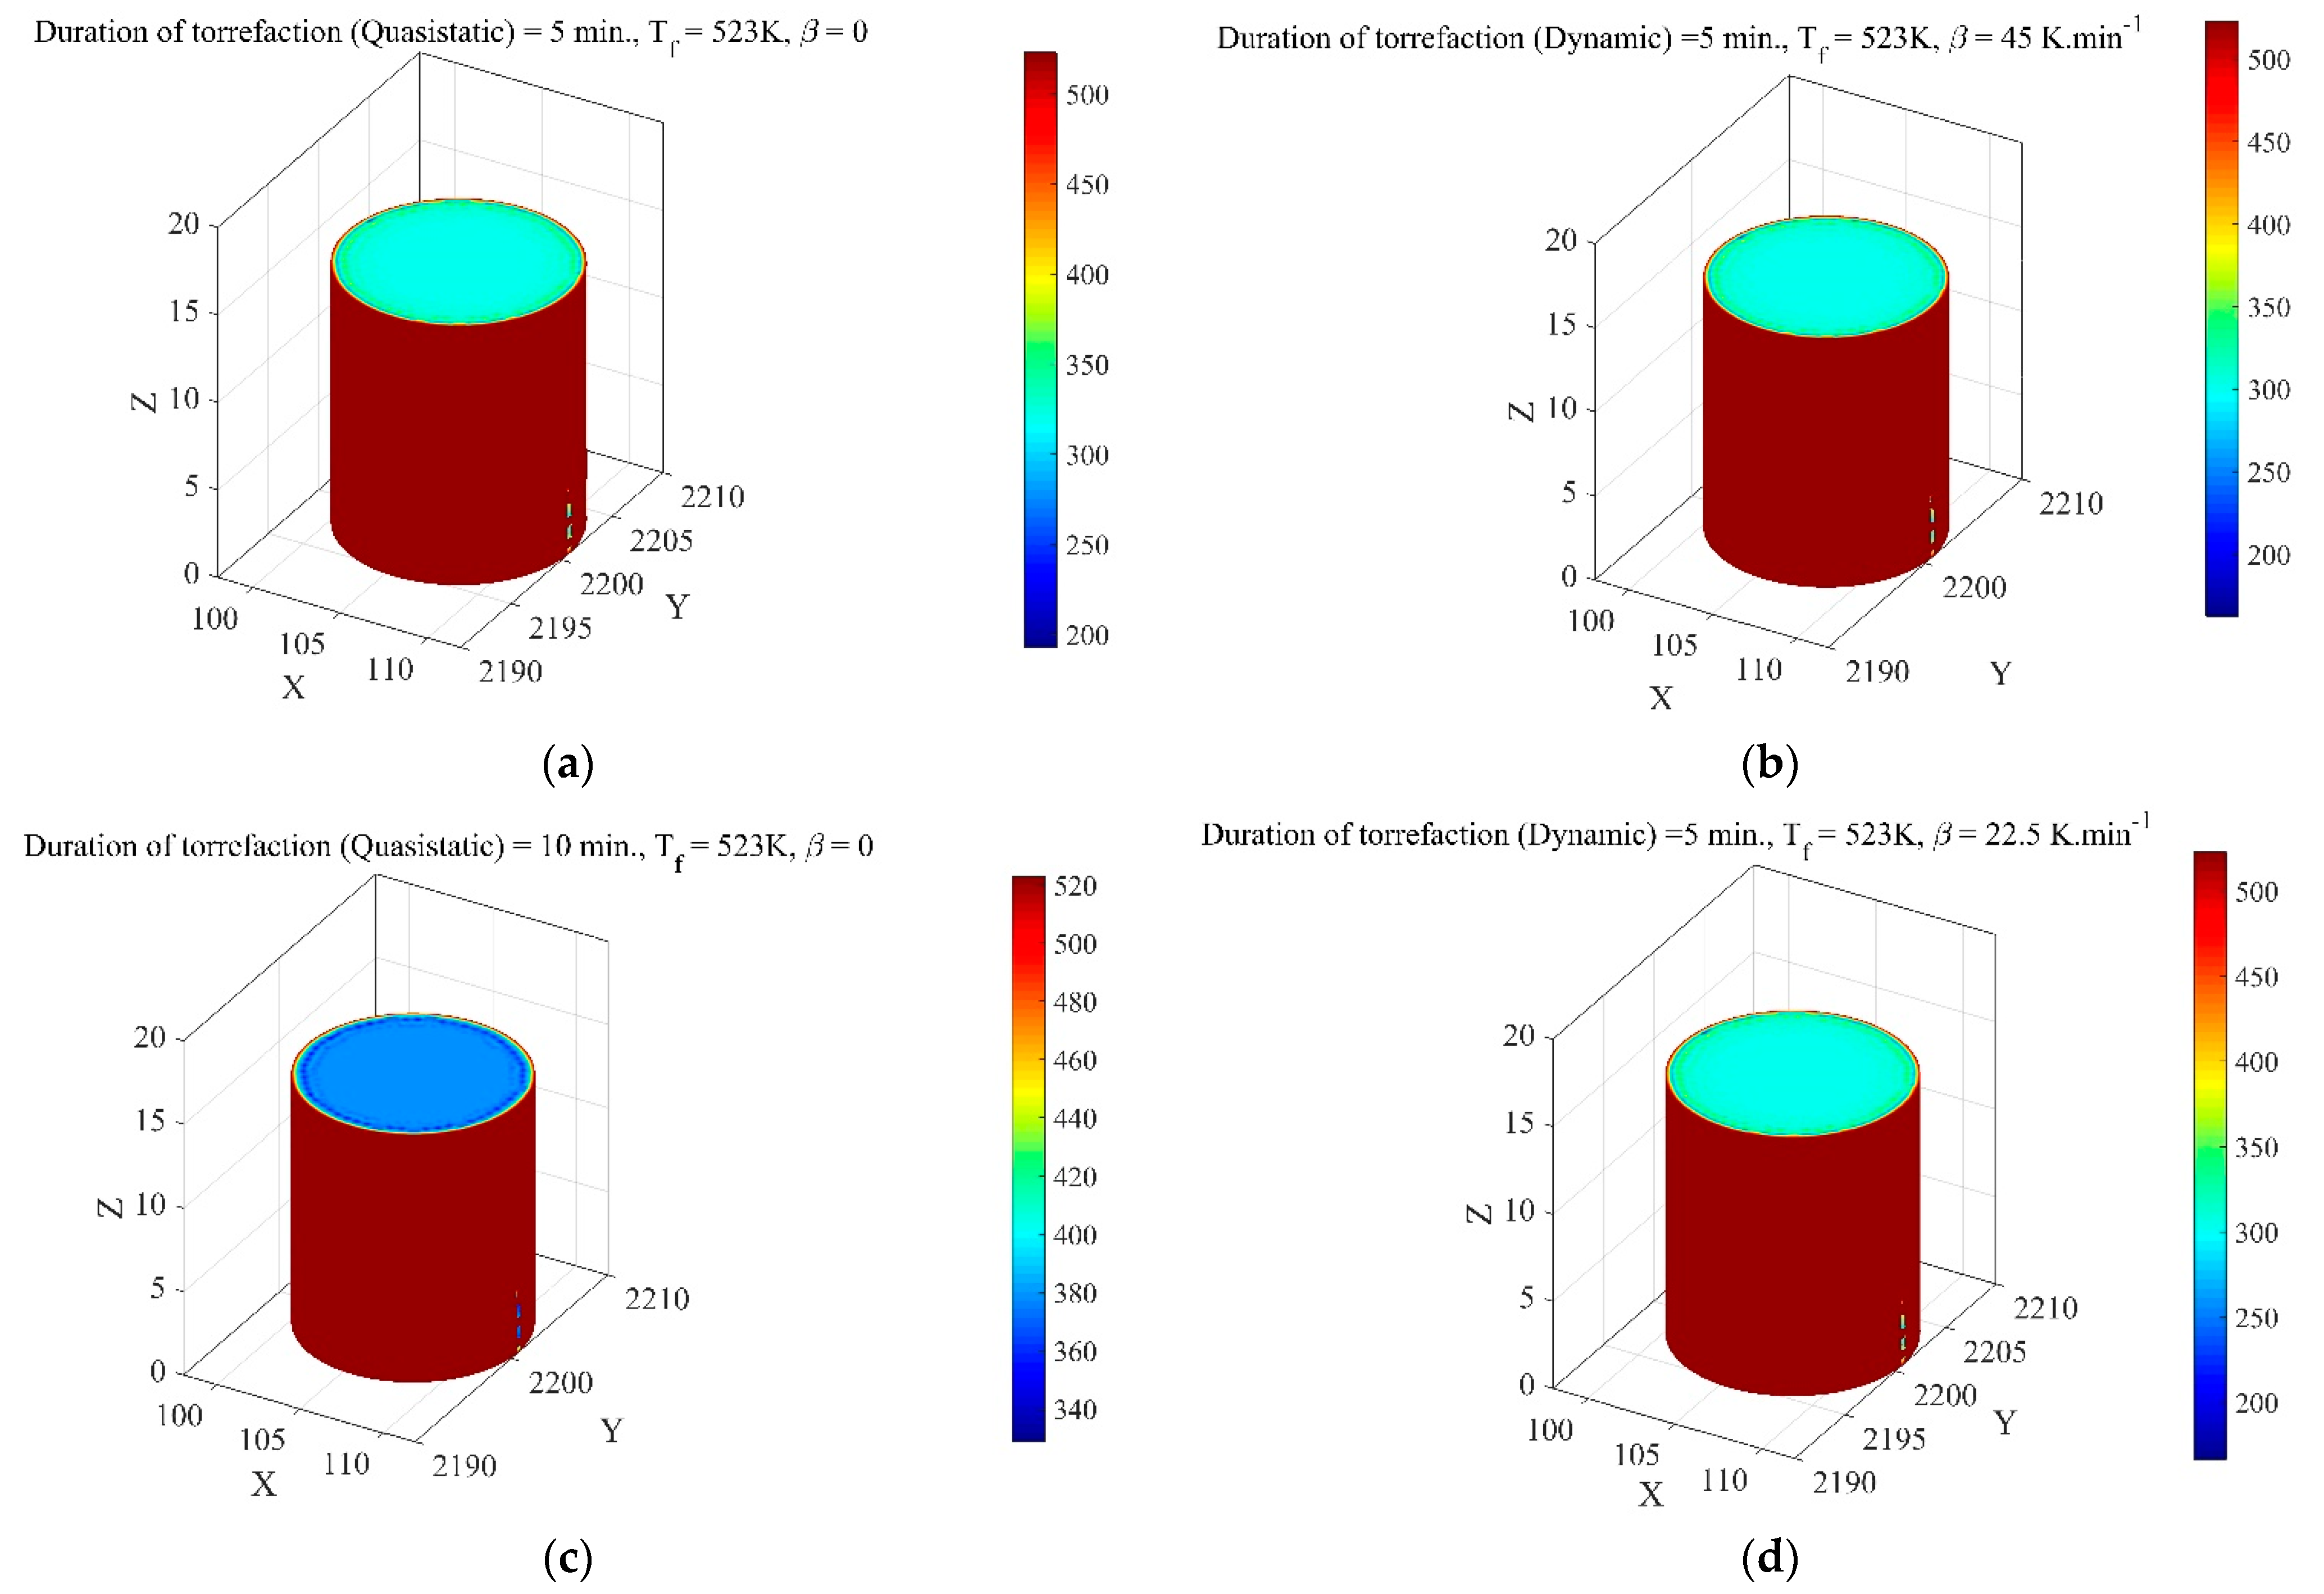
The temperature distribution on the surfaces of biofuel pellets along with the interpolated solution is illustrated in
Figure 4 at different processing times. It was noticed that the variation in temperature distribution (
τ = 5 min) for a quasi-static condition at constant heat supply is unperceivable and it affected merely the surfaces embedded between the interior and outer regions of the biofuel pellets (
Figure 4a). The temperature variation was found to be in the range of 500–523 K at the mesh points, whereas it varied from 400 to 450 K in the intermediate mesh region of the biofuel pellets. The interior zone of the pellet remained at a constant temperature of 300–350 K. Apart from the jiggled mesh points, through the slicing of the biofuel pellets into three different planes along each Cartesian axis, it was observed that the overall change in temperature along the tangential plane to the pellet surface would vary from 420 to 480 K. A temperature drop of 19–21% was noticed along the radial direction of the pellet. With the increase in processing duration, the temperature range was reduced, and the interior temperature of the pellet increased by 14–16% (
Figure 4d,e). There was no drift found in the surface temperature of pellets at the mesh points, but the drift was observed in the central plane of the biofuel pellets (
Figure 4c,e). The local temperature of a pellet was computed to be reduced by 66%. The effect of average Nusselt (
) and Reynold (
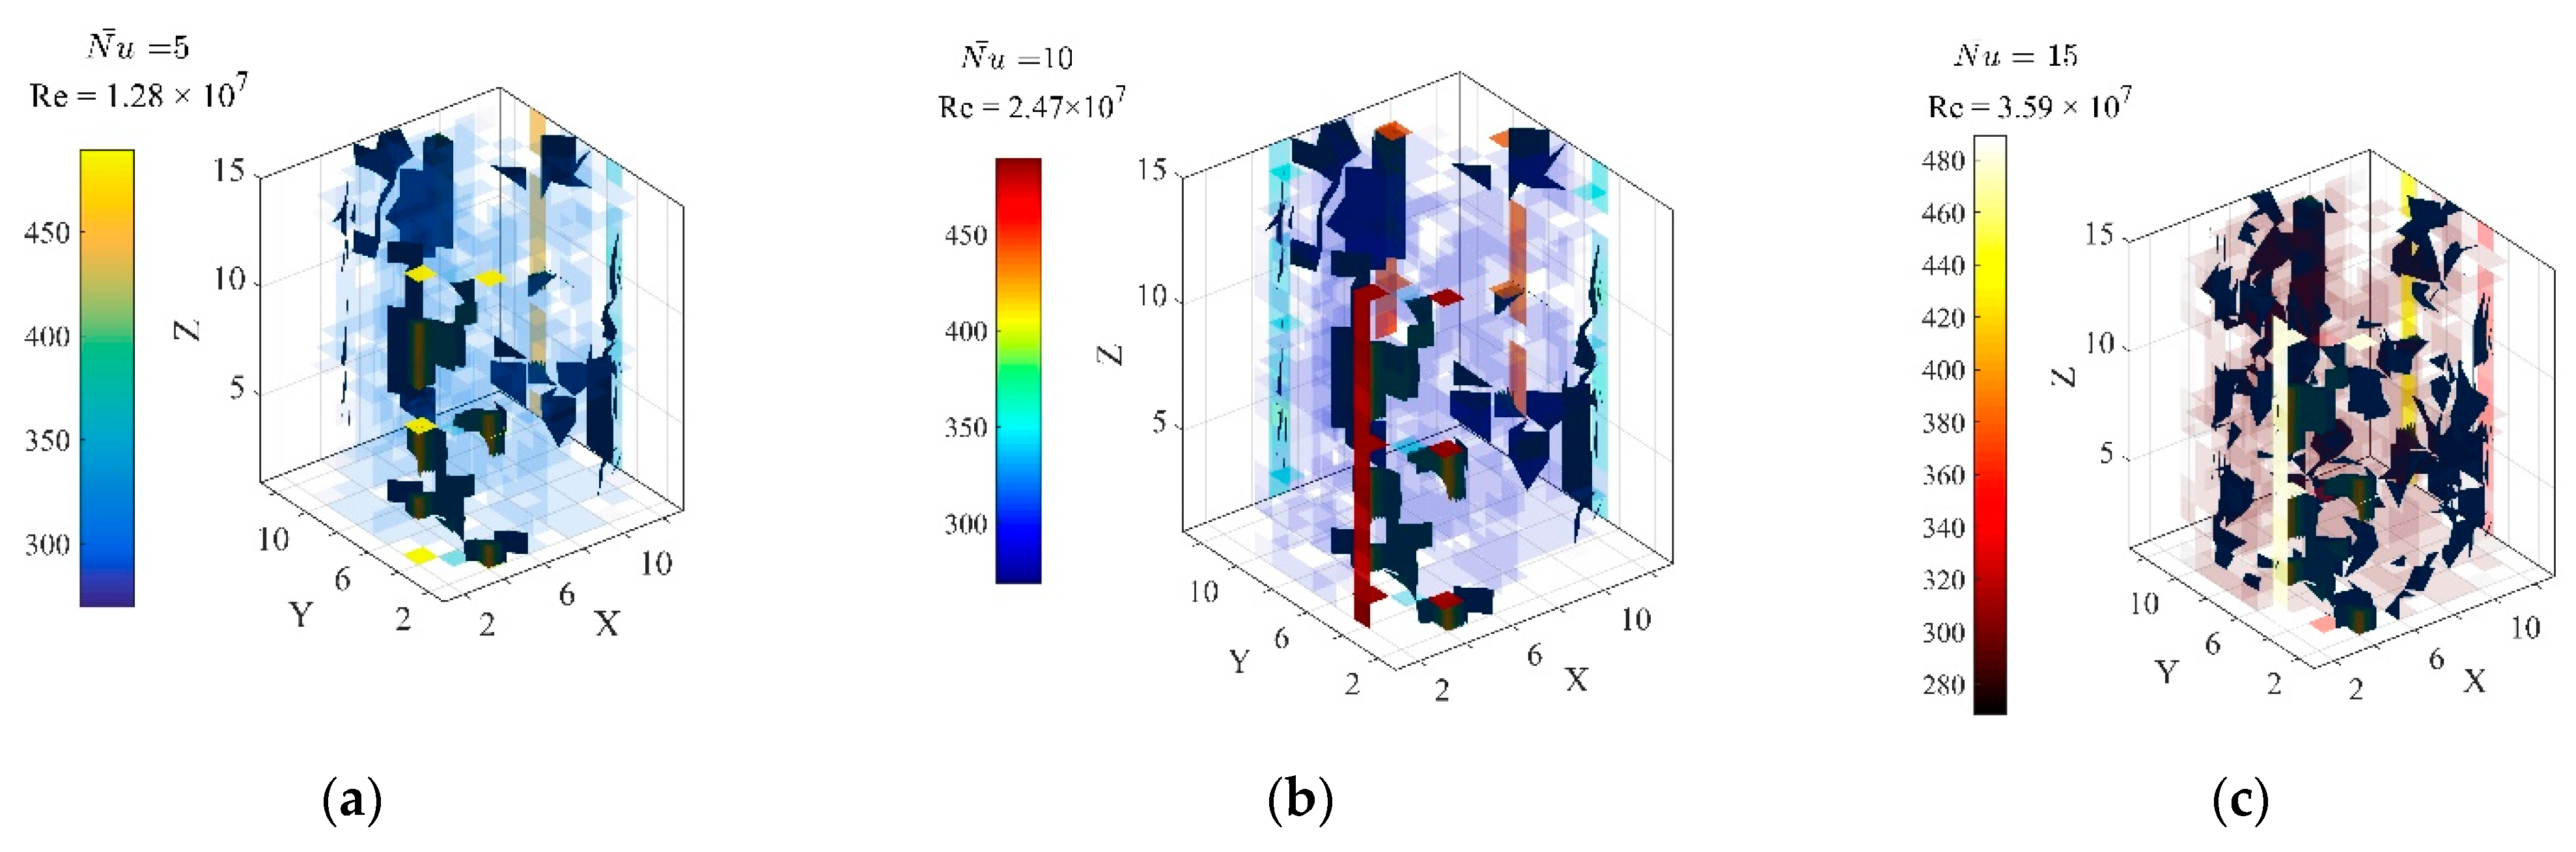
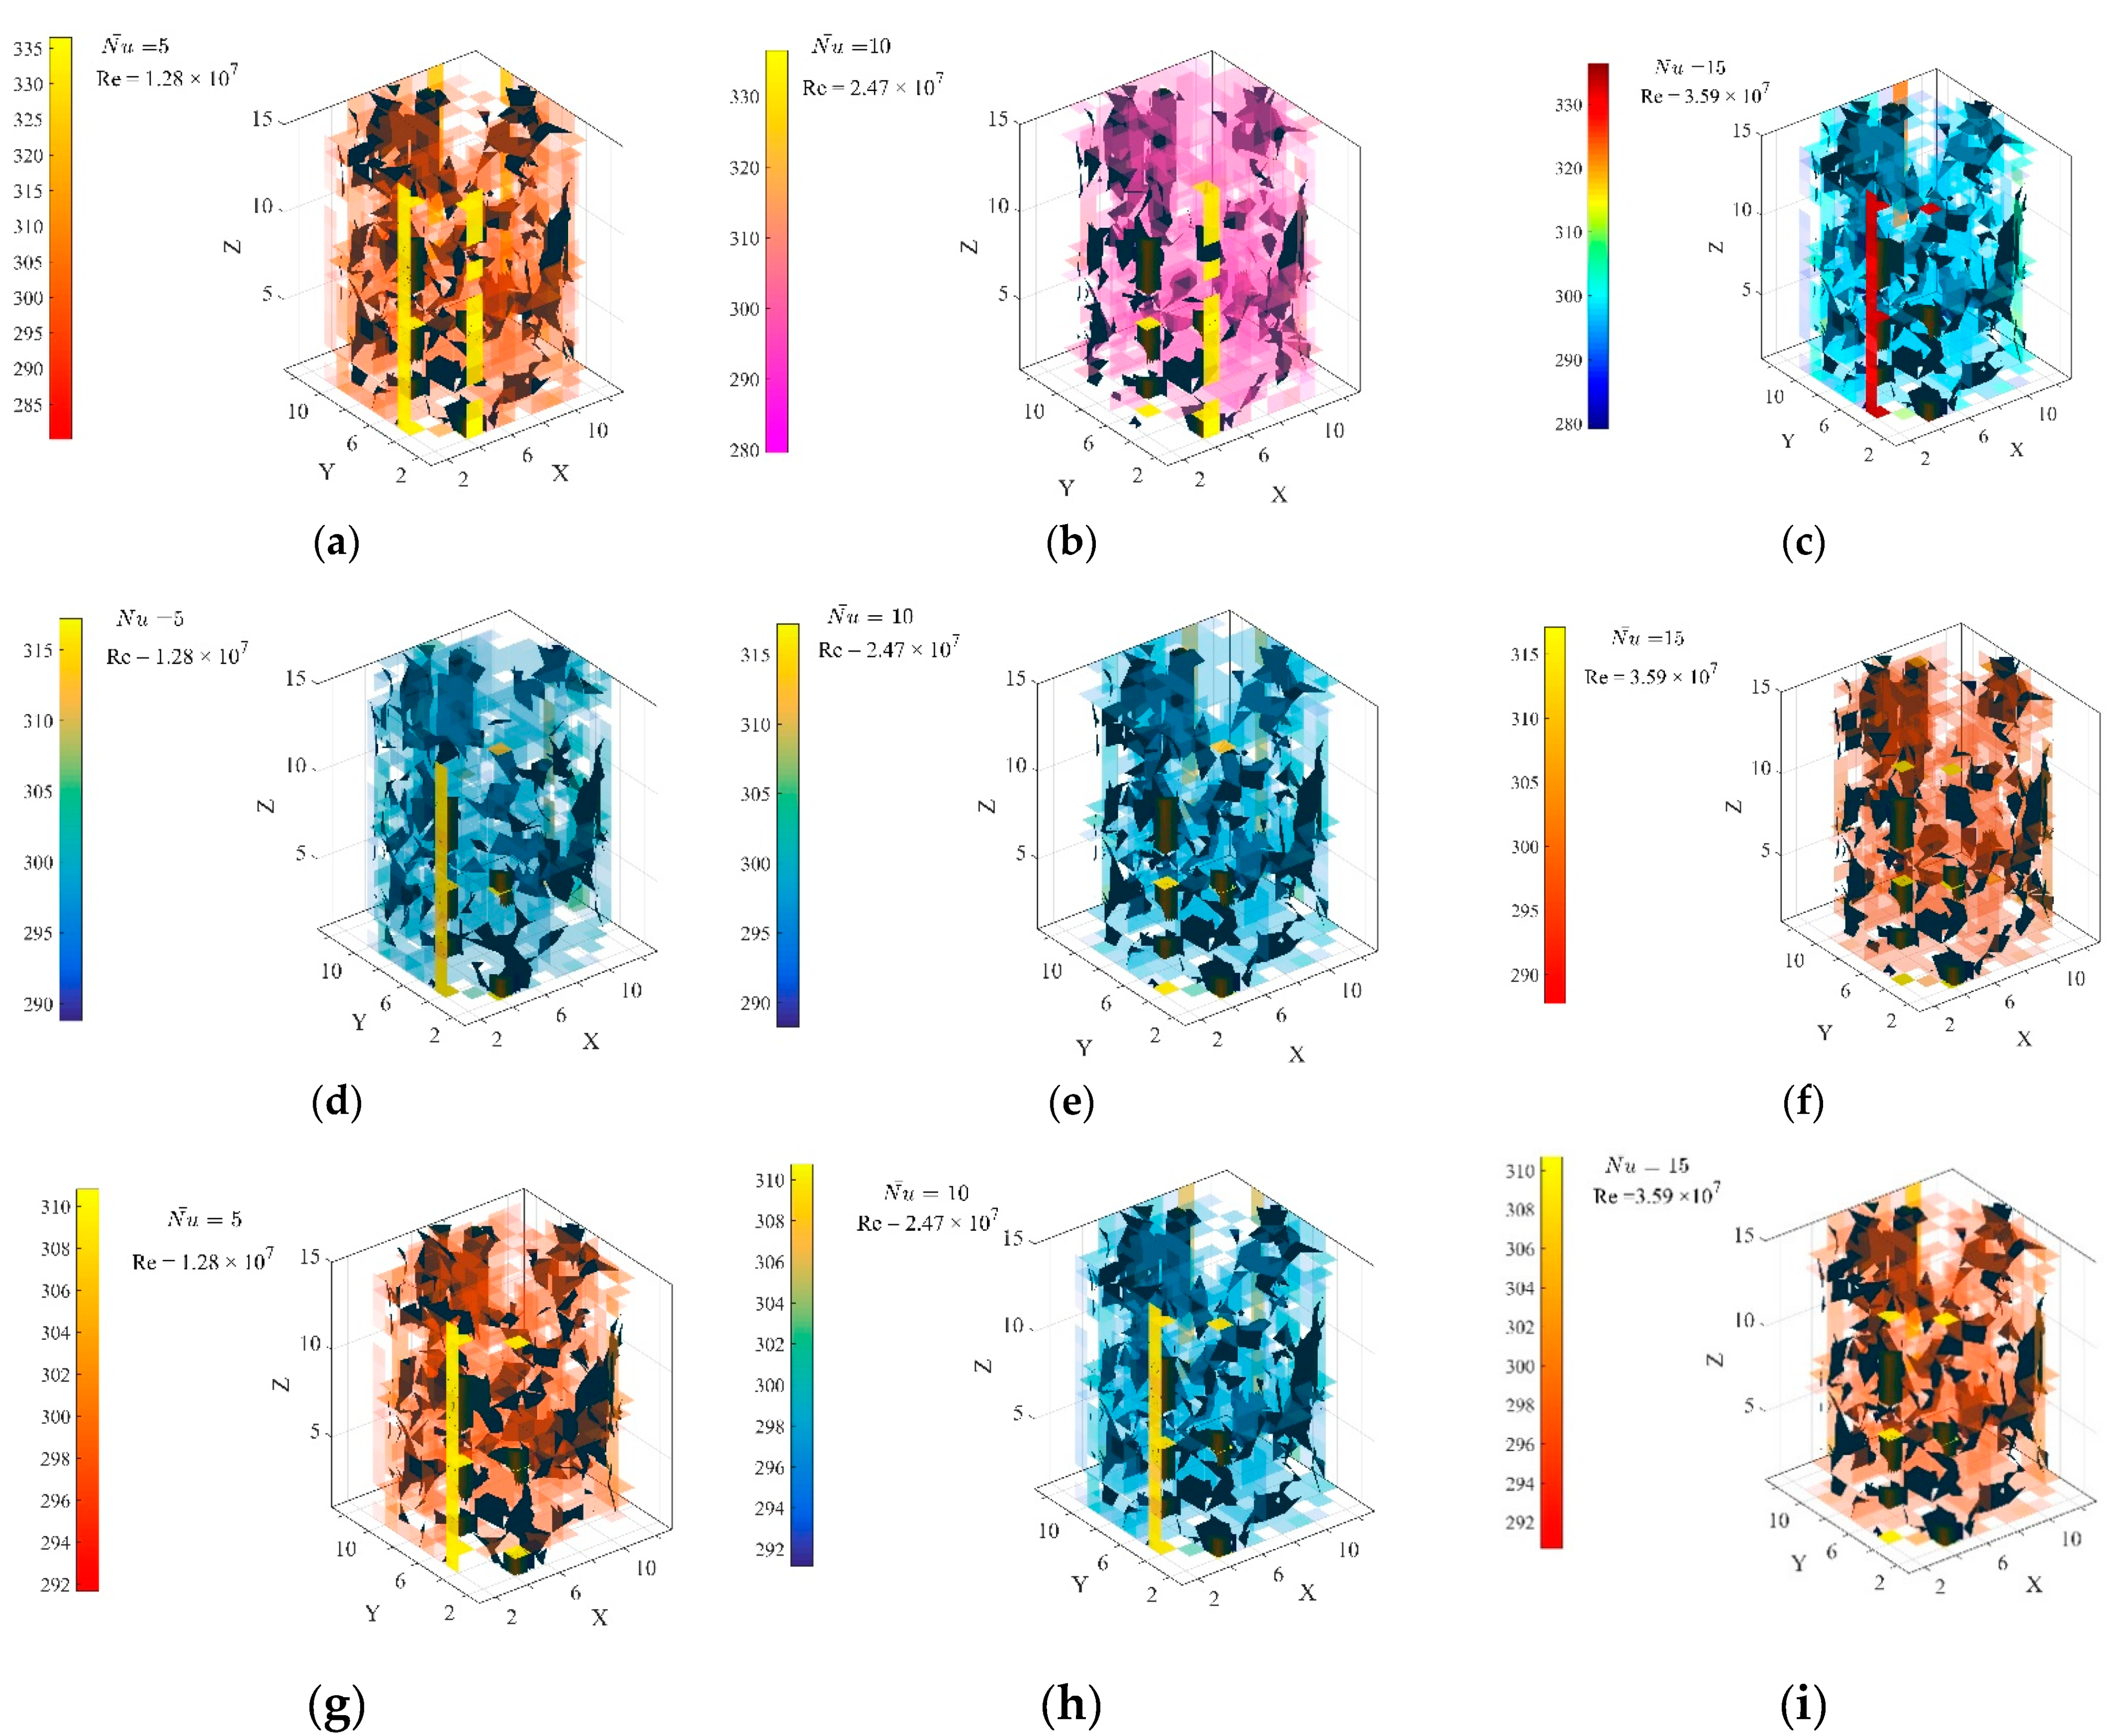
Re) numbers of an inert atmosphere on the local temperature distribution is shown in
Figure 5. It was observed that the increase in the average value of
and Re elevated the surface temperature of the pellet by 28–37% (
Figure 5a–c). Similarly, the increase in the processing time of biofuel pellets had a similar effect on the local temperature of the pellet, but the effect was more localised or concentrated at a particular spatial position. The thermal gradient increased and a vast drift in temperature scale was noticed at different circumferential as well as longitudinal layers of the pellet. The temperature on the tangential plane to the pellet surface was reduced by 33%. The common solution retrieved at each processing time (
τ = 5, 10, 15 min) was that the local thermal gradient on the surface was increased and thermal homogeneity was severely impacted (
Figure 5). However, it was also clear from the derived solution that the average value of
Nu = 10 and Re = 2.47 × 10
7 would make torrefaction more uniform and steadier in time at a constant Prandtl number and applied pressure of 1.5 bar. Further increasing the
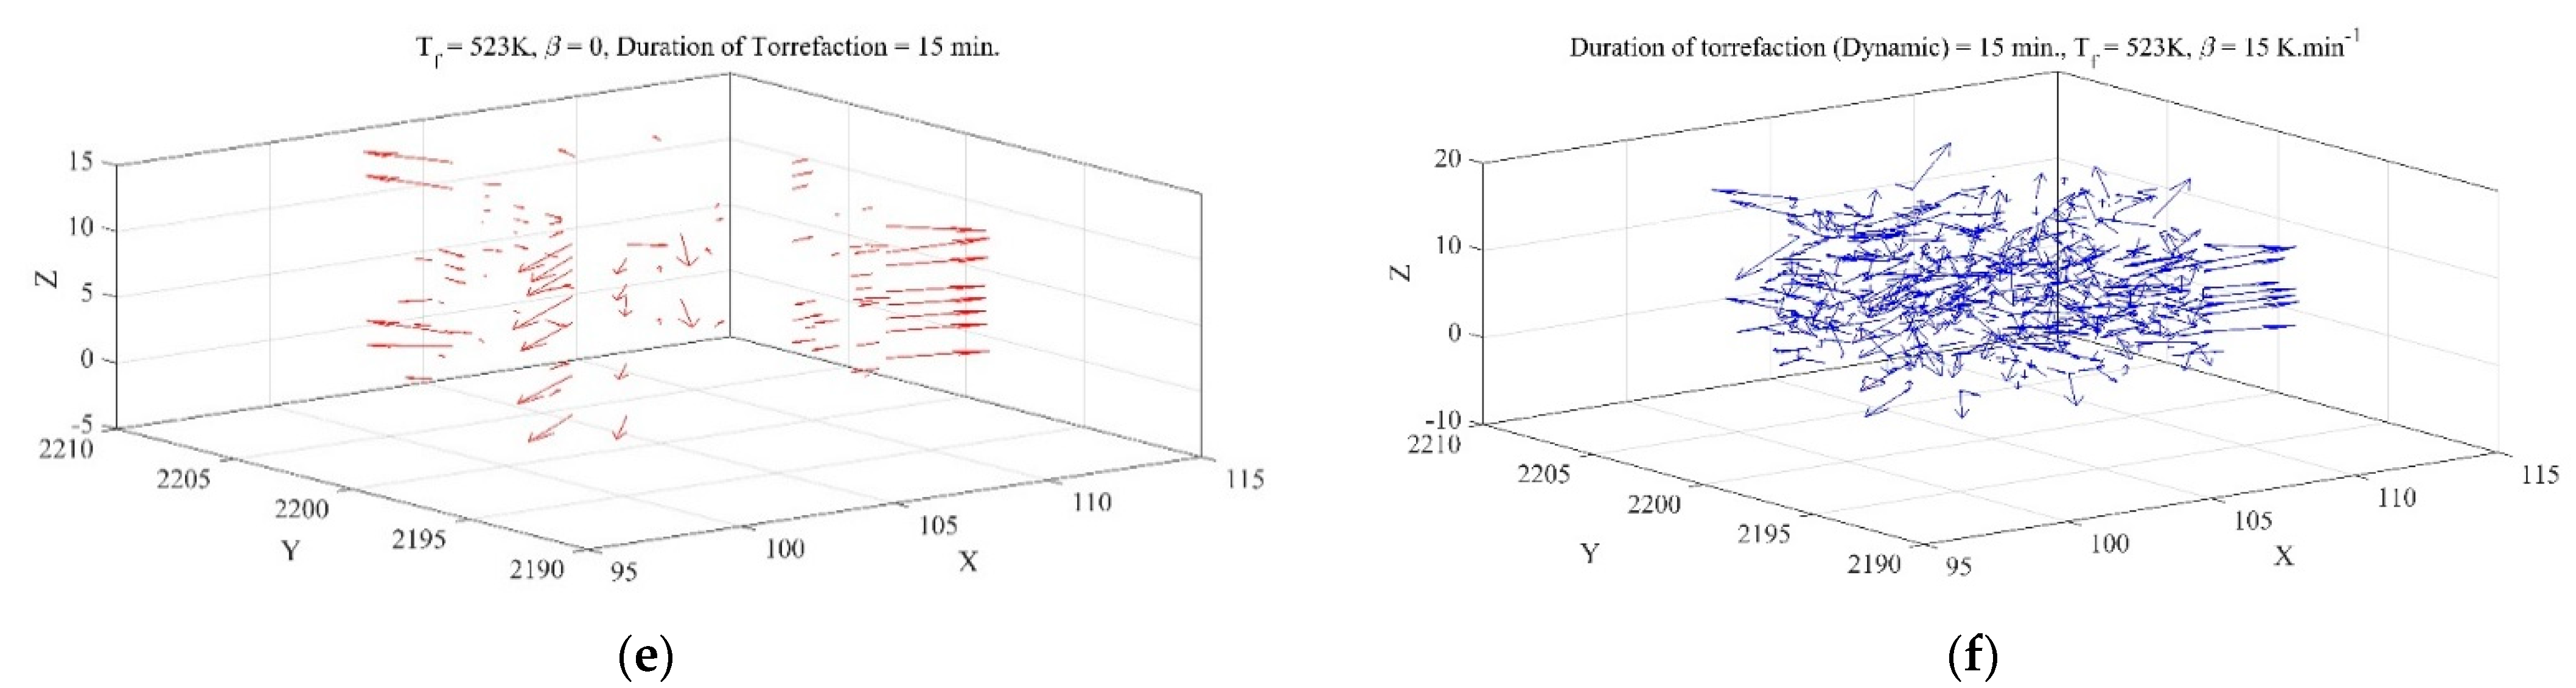
Nu and Re would affect the temperature distribution and advection of volatile components by nitrogen gas, which would eventually reduce the propagation of thermal energy at solid boundaries of biofuel pellets. The effect of changing thermal conditions on the local thermal gradient is shown in
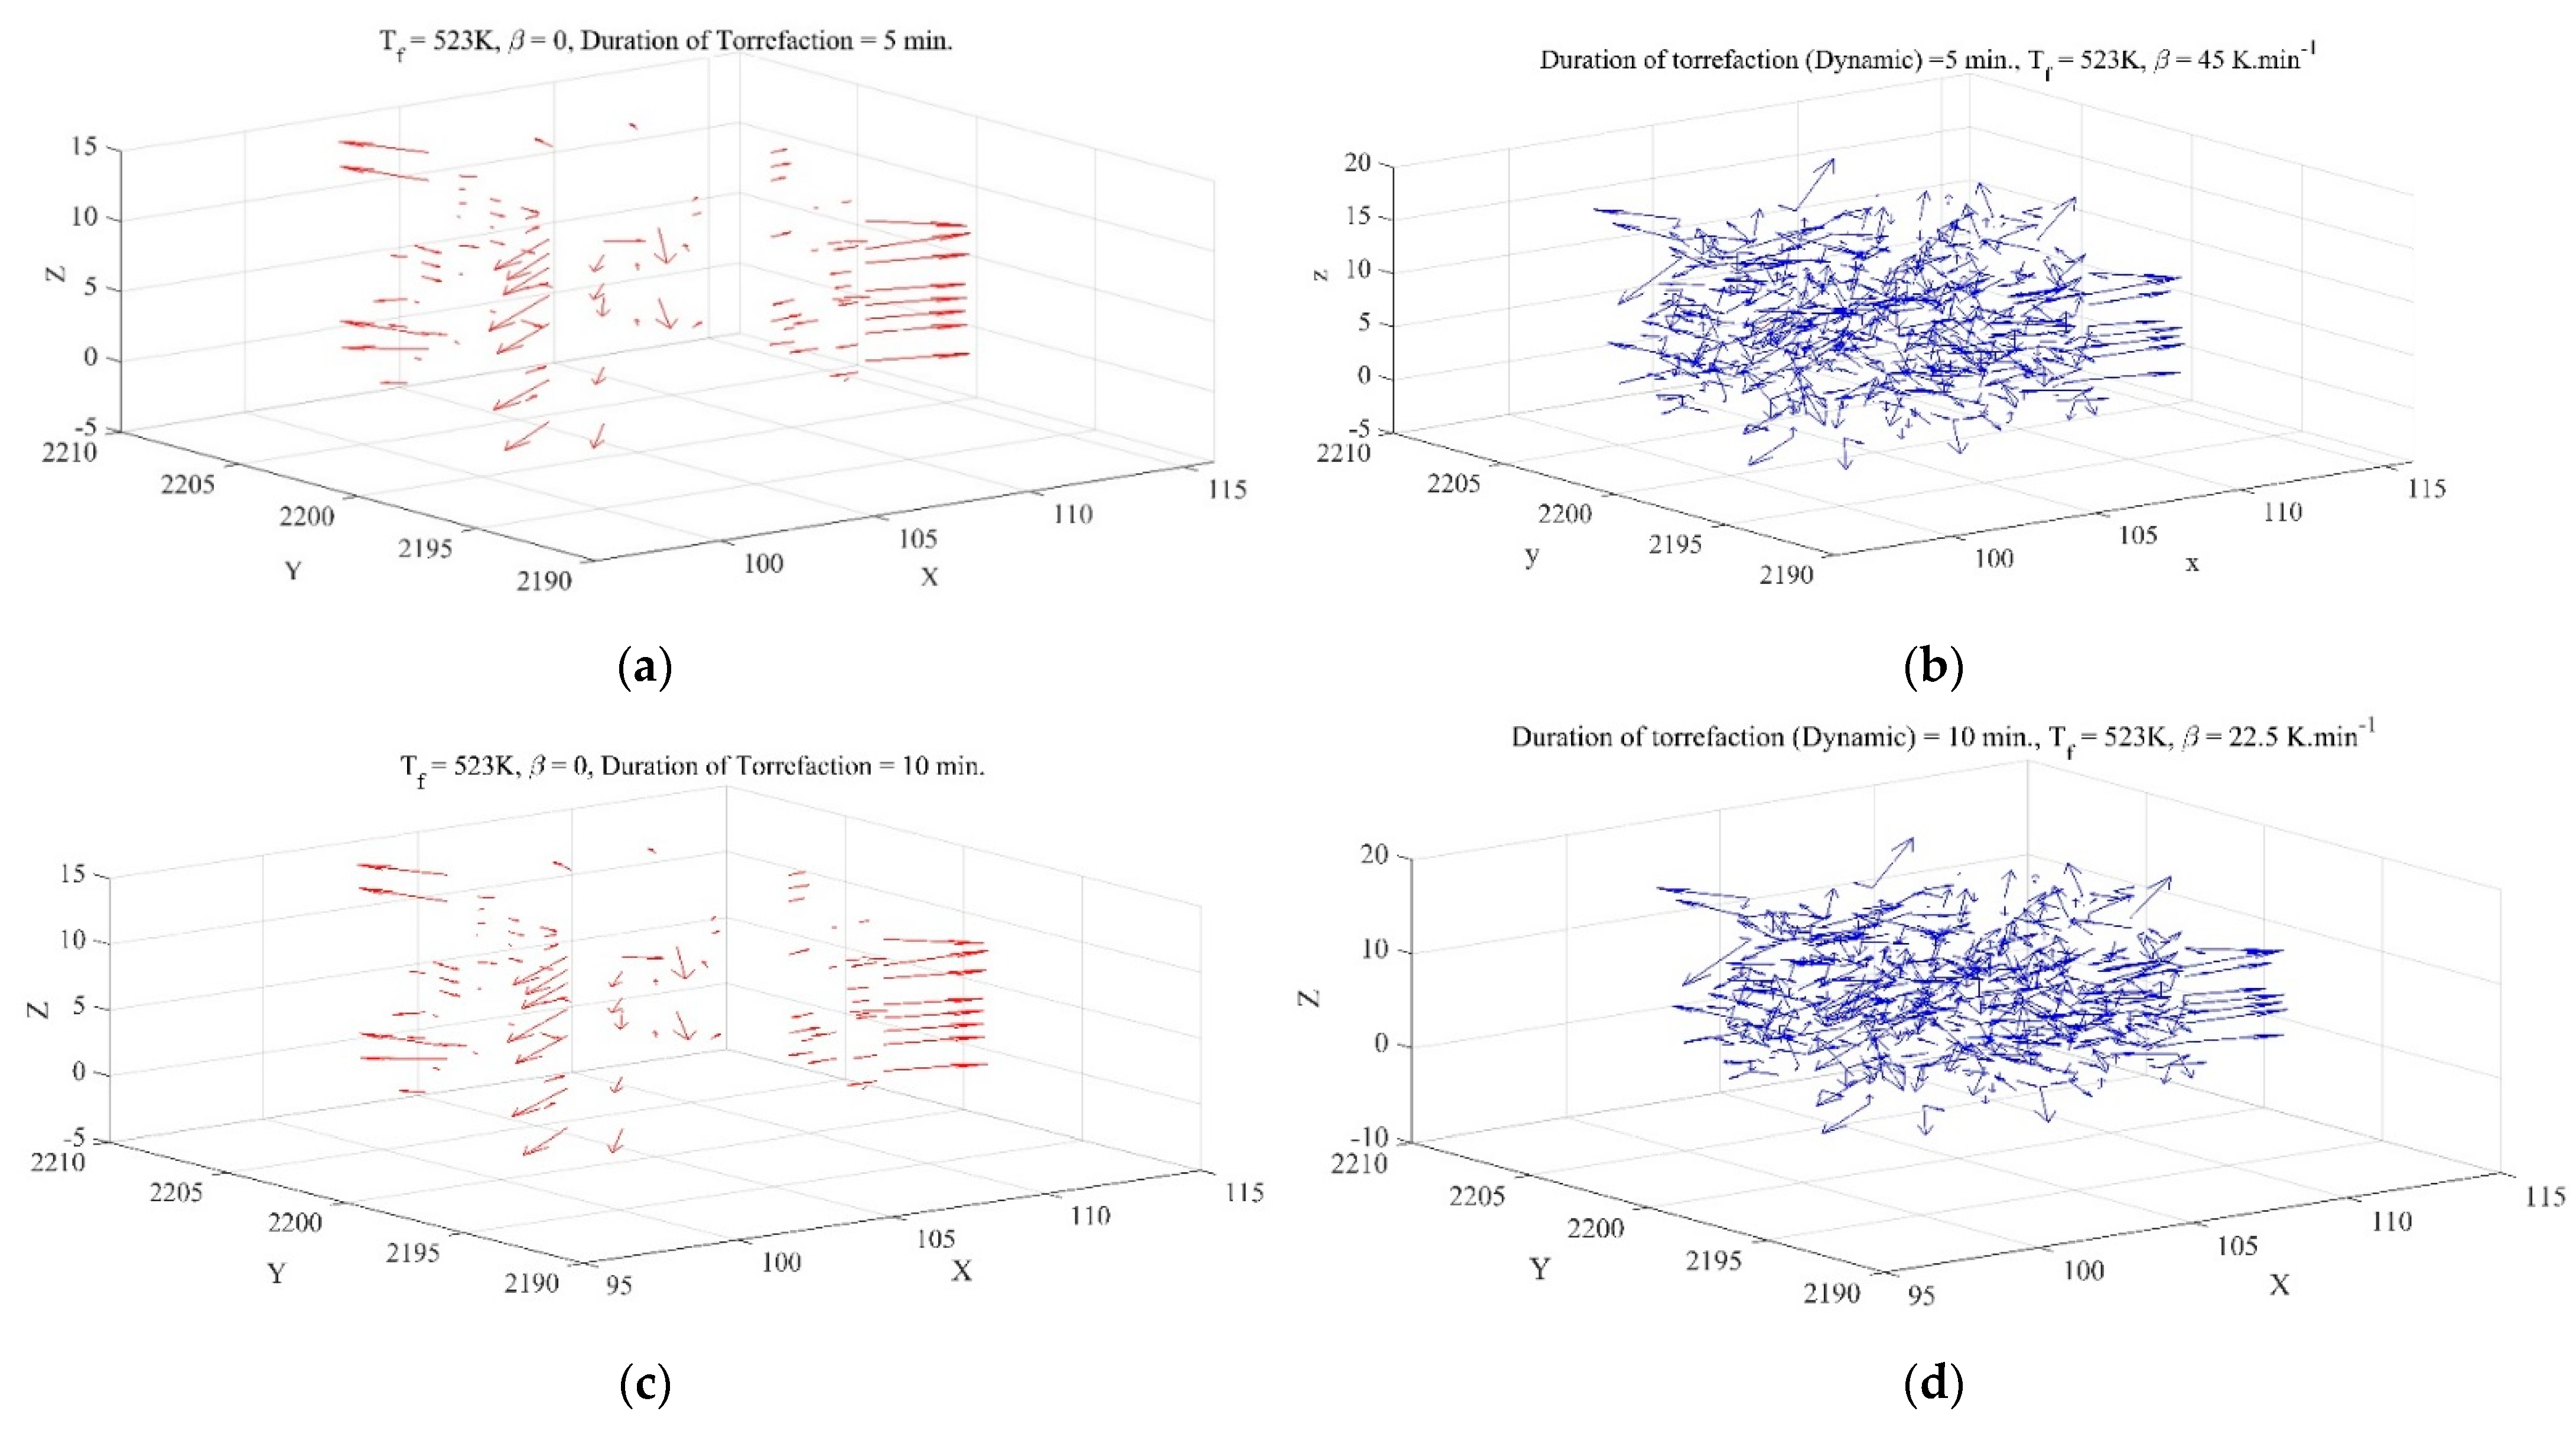
Figure 6. In a quasi-static condition, the thermal gradient would predominantly appear on the tangential planes, whereas it would be more concentrated at the interior cross-sectional planes of the pellet. From the quiver plot, irrespective of processing time, it was noticed that the quasi-static state of the control volume would have the least drift in its interior solid temperature, while a remarkable change in temperature distribution across various layers would be noticed in the dynamic state. Moreover, it would also influence the flow and residence time of the gases. This happens due to an increase in the pressure-driven flow across the pellet. The higher heating rate experienced at the interior would reduce the intra-particle residence time and eventually reduce the cross-linking, repolymerisation and cracking of the pellets [
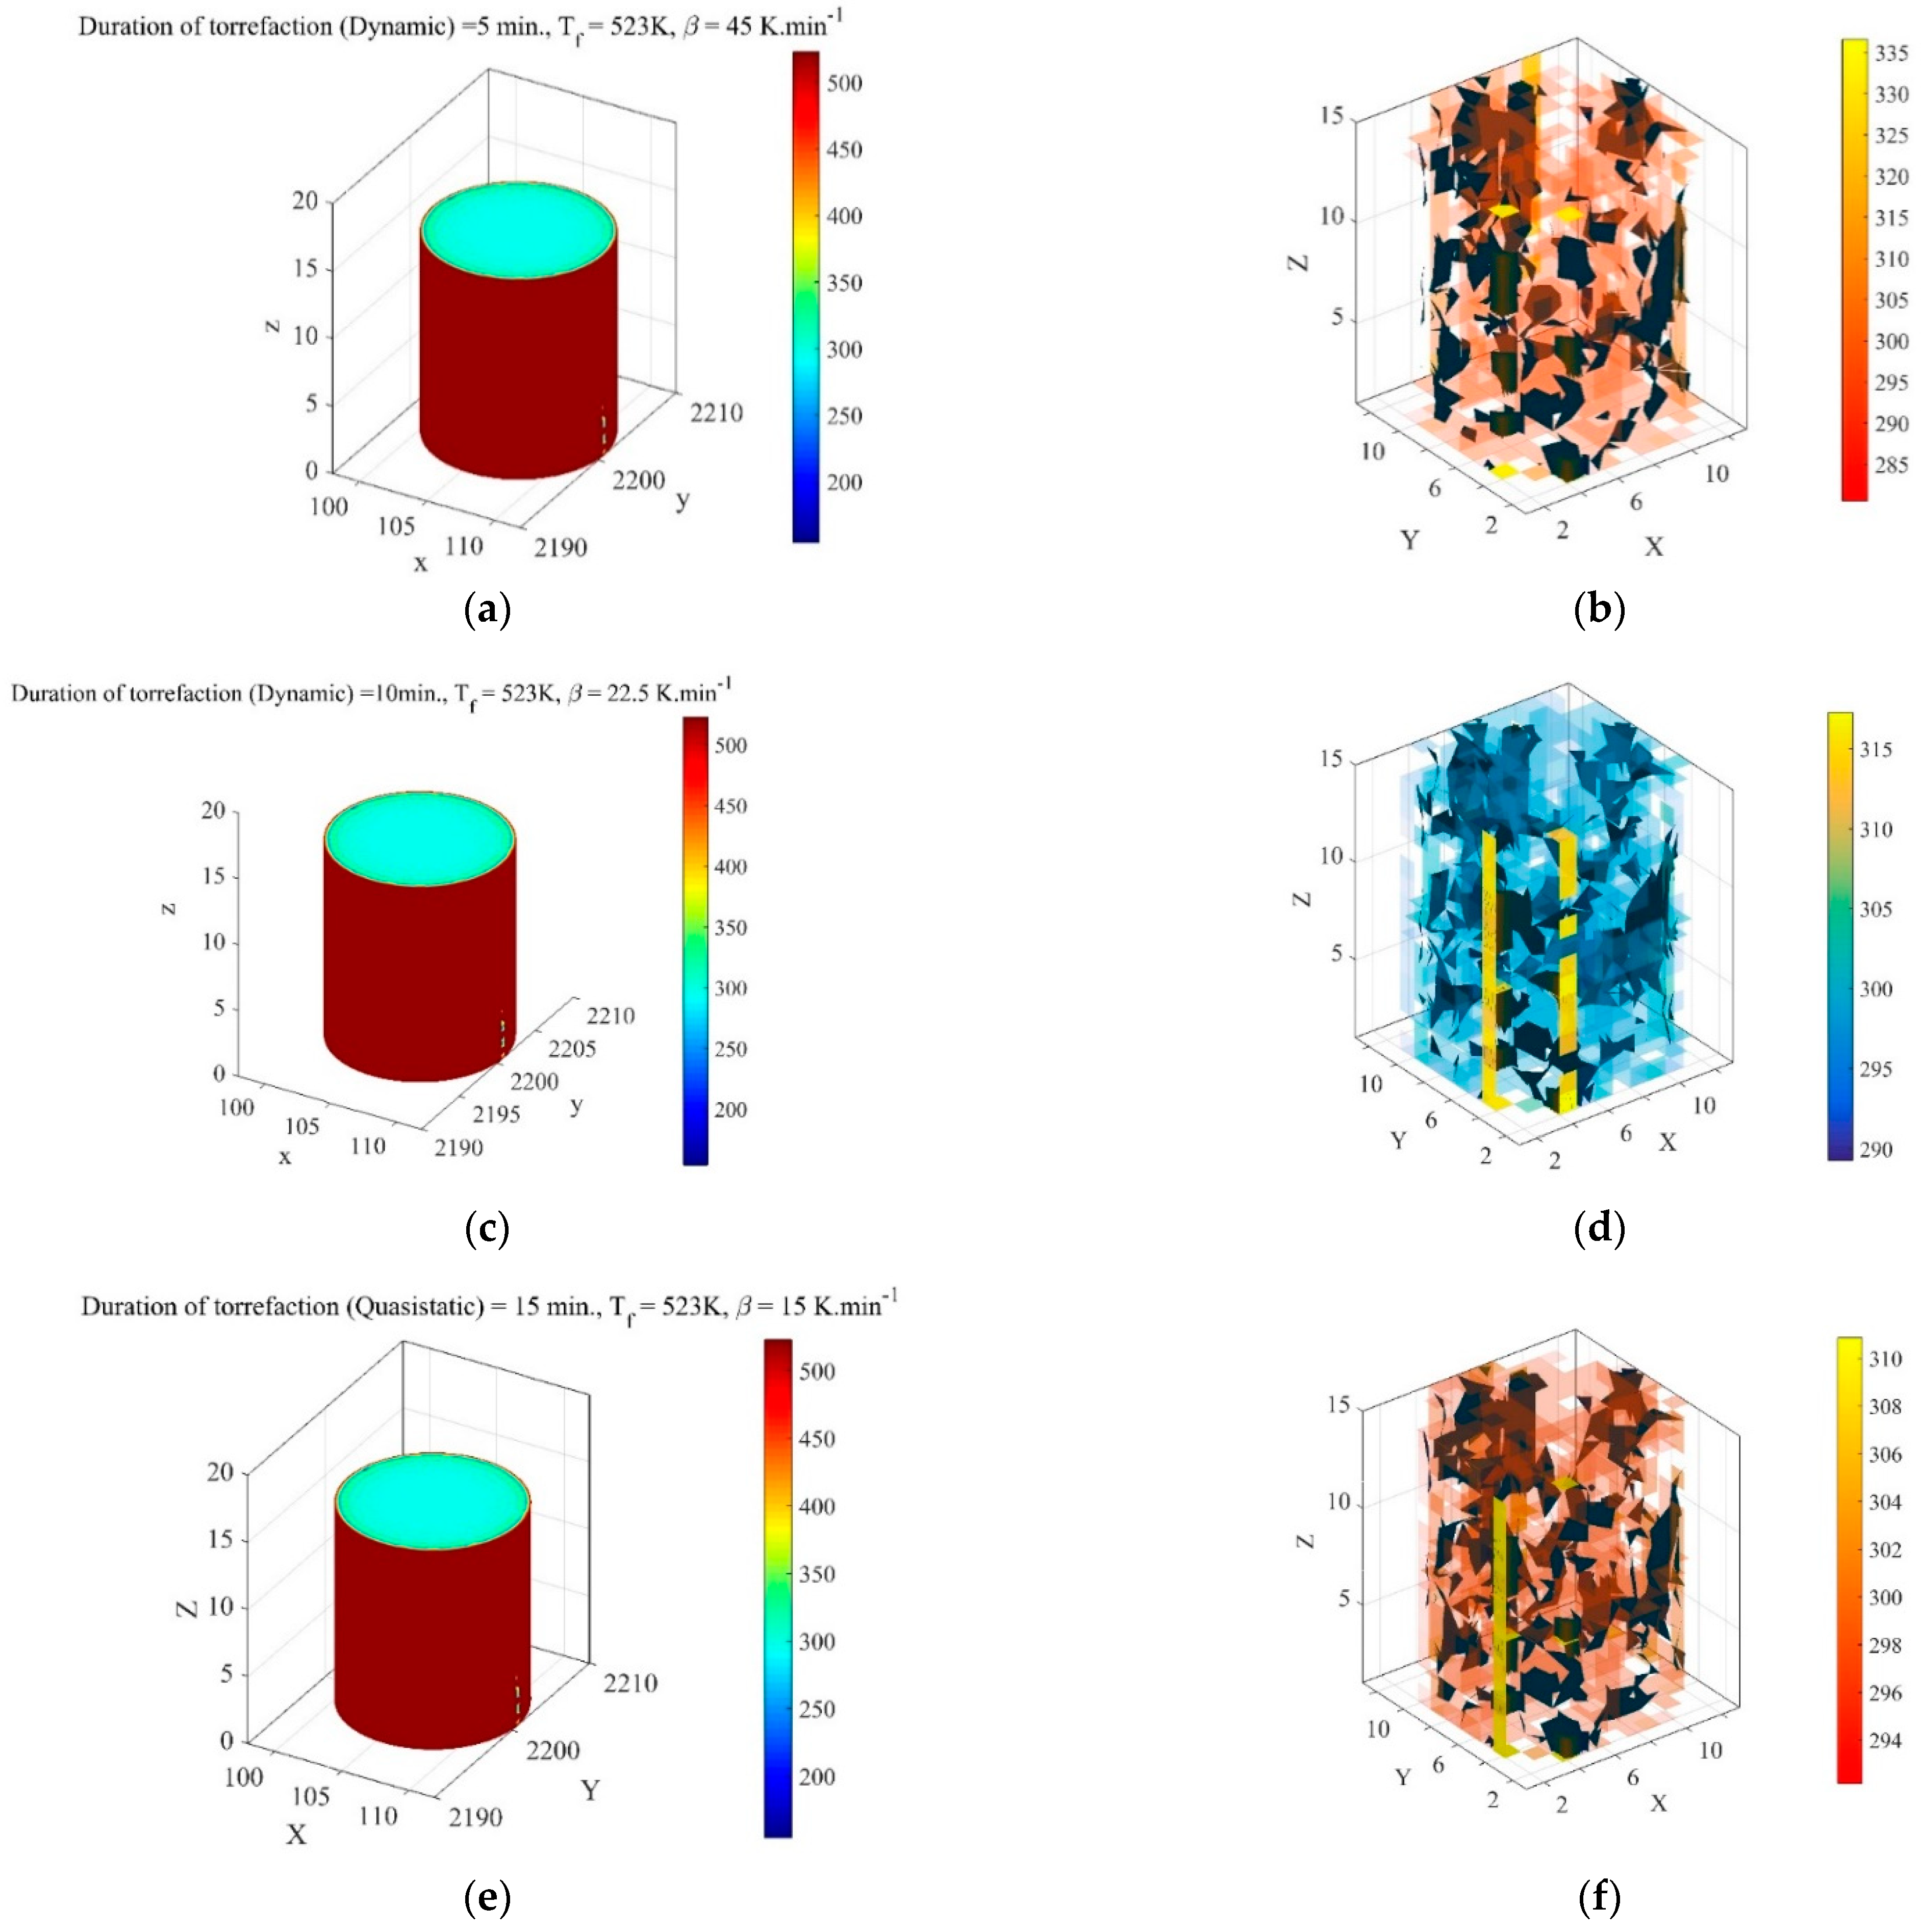
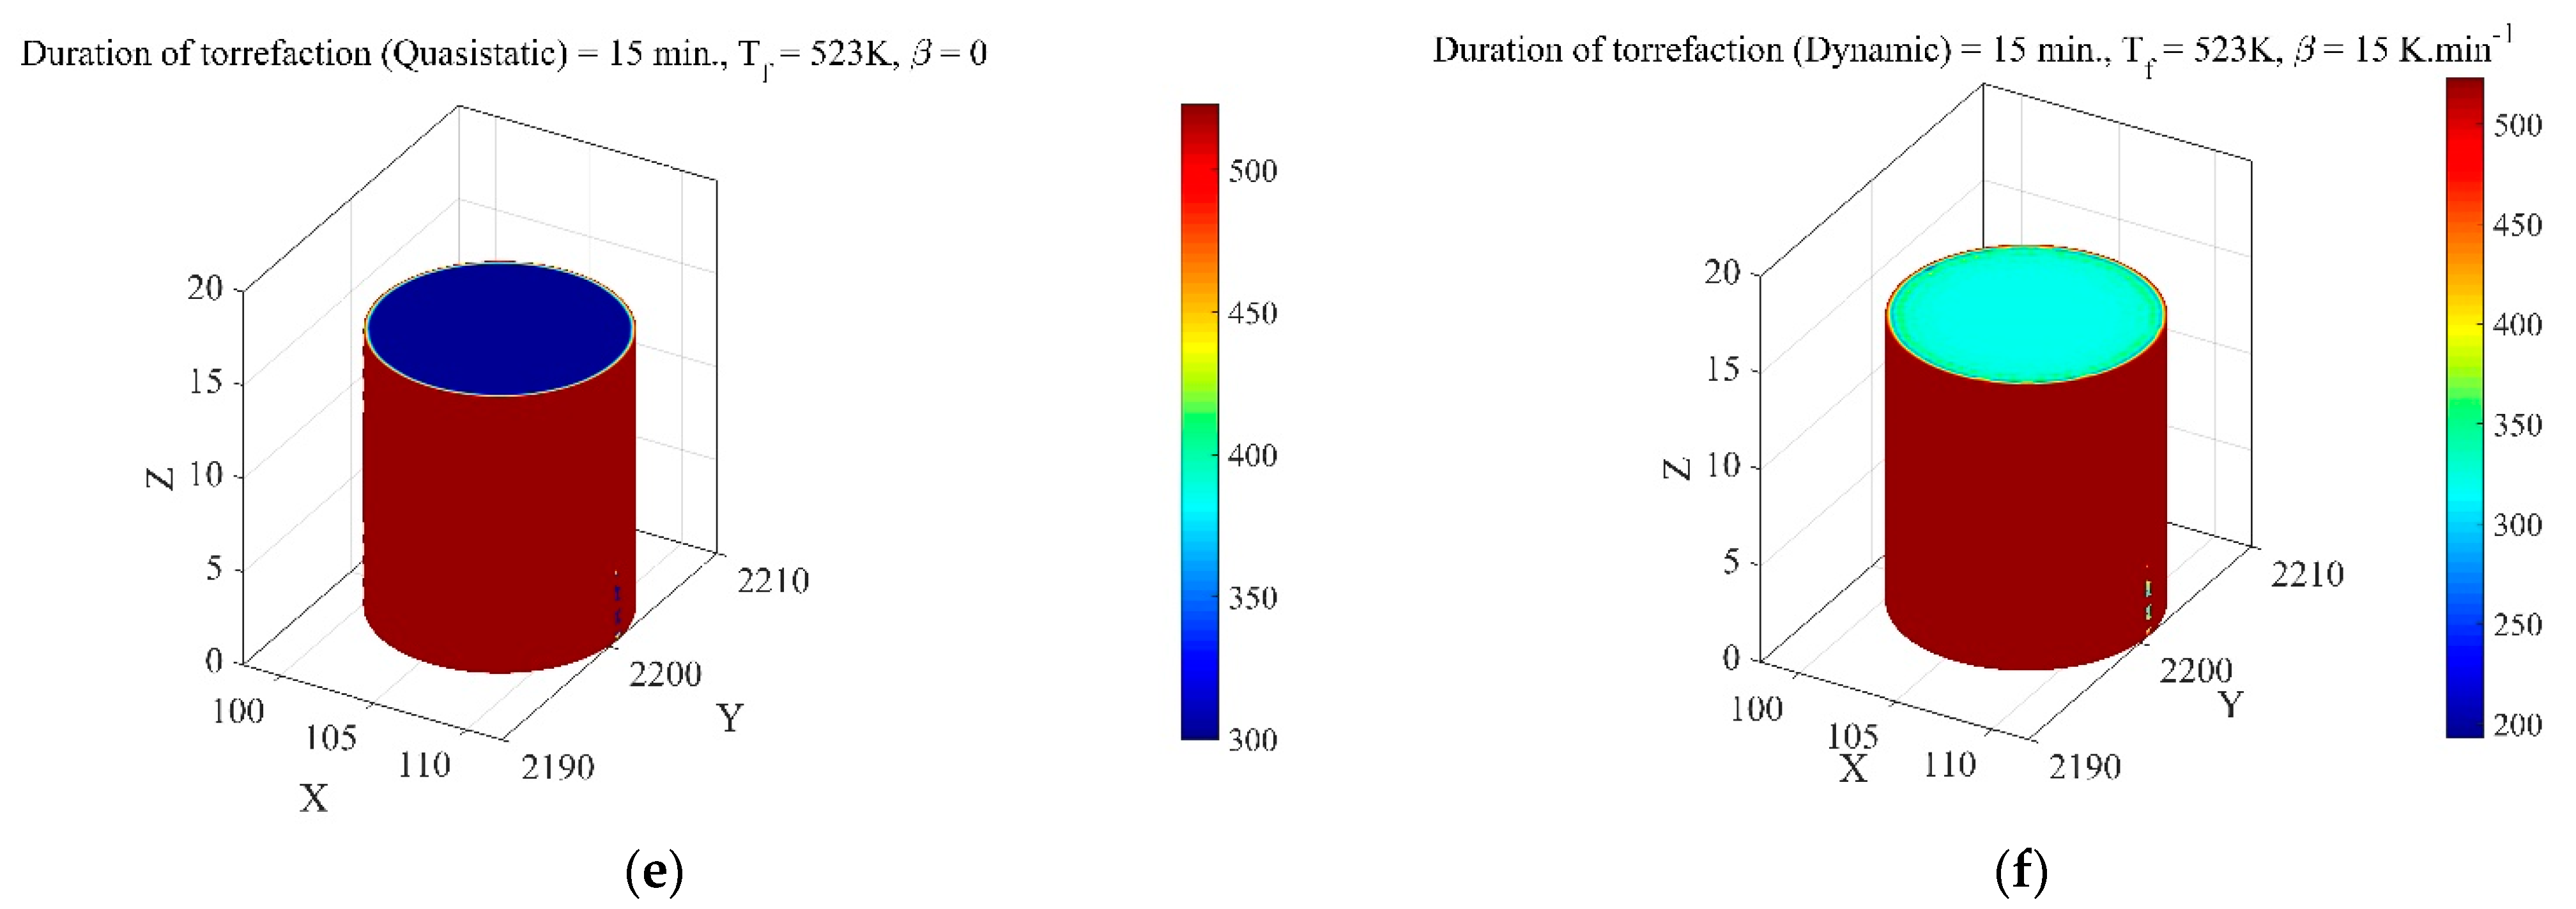
18]. Consequently, deterrence to the autocatalytic reaction would hamper heat transfer between the cooler pellet layers and the volatile gases. The higher deviation in temperature distribution also makes these volatile gases condense on the surface of the pellet. To support this fact, the effect of dynamic ramping of furnace temperature at the generated mesh points as well as at interpolated points is illustrated in
Figure 7. It was noticed through a thermal model (
Figure 7a,c,e) of a biofuel pellet that there was a 25% increase in temperature in the intermediate layers of the biofuel pellets, which was correspondingly 42% in a quasi-static condition. The only difference between dynamic and quasi-static was in the isothermal region between the core and outer surface of the pellet. A sporadic or discontinuity in the isothermal domain was found while the biofuel was subjected to a time-dependent thermal history. Thus, the temperature would be rather more homogeneous in quasi-static states of a system than in a dynamic state of a system. By comparing the isosurfaces for both the thermal conditions, a fine demarcation between the thermal boundaries at the interior and exterior regions of the pellet could be seen. The numerical solution predicted the maximum temperature for a dynamic system at non-mesh points was 30% lower than that of the quasi-static condition. It implies that the overall time of processing would significantly increase if the thermal pre-treatment was performed in the Joule heating system for a time-dependent thermal history. Moreover, the overall cost of production of torrefied pellets in a dynamic condition would also be very high to achieve the desired level of torrefaction. A reduction in the processing time of pine pellets or an increase in the ramp rate of the furnace would also increase the temperature scale, with higher uncertainties in the interpolated solution. According to the isosurface plot (
Figure 7b,d,f), the temperature of biofuel pellets would vary from 285 to 335 K, which is 6.4% higher than the temperature scale required for processing biofuel for 10 min, whereas this gap further widened by 8% when the same biofuel pellet was held for 15 min in the Joule heating system. A similar reduction in the temperature domain with time was observed for both quasi-static and dynamic types of torrefaction. The temperature of the biofuel pellets was found to reach thermal homogeneity with increasing processing time, whereas, in the case of the quasi-static condition, an inhomogeneous characteristic in the temperature scale along the different slicing planes was found. In other words, the transfer of heat flux along the sectional planes would be much faster with the increase in the processing time, whereas it tends to be constant in dynamic conditions. The effect of average Nusselt (
) and
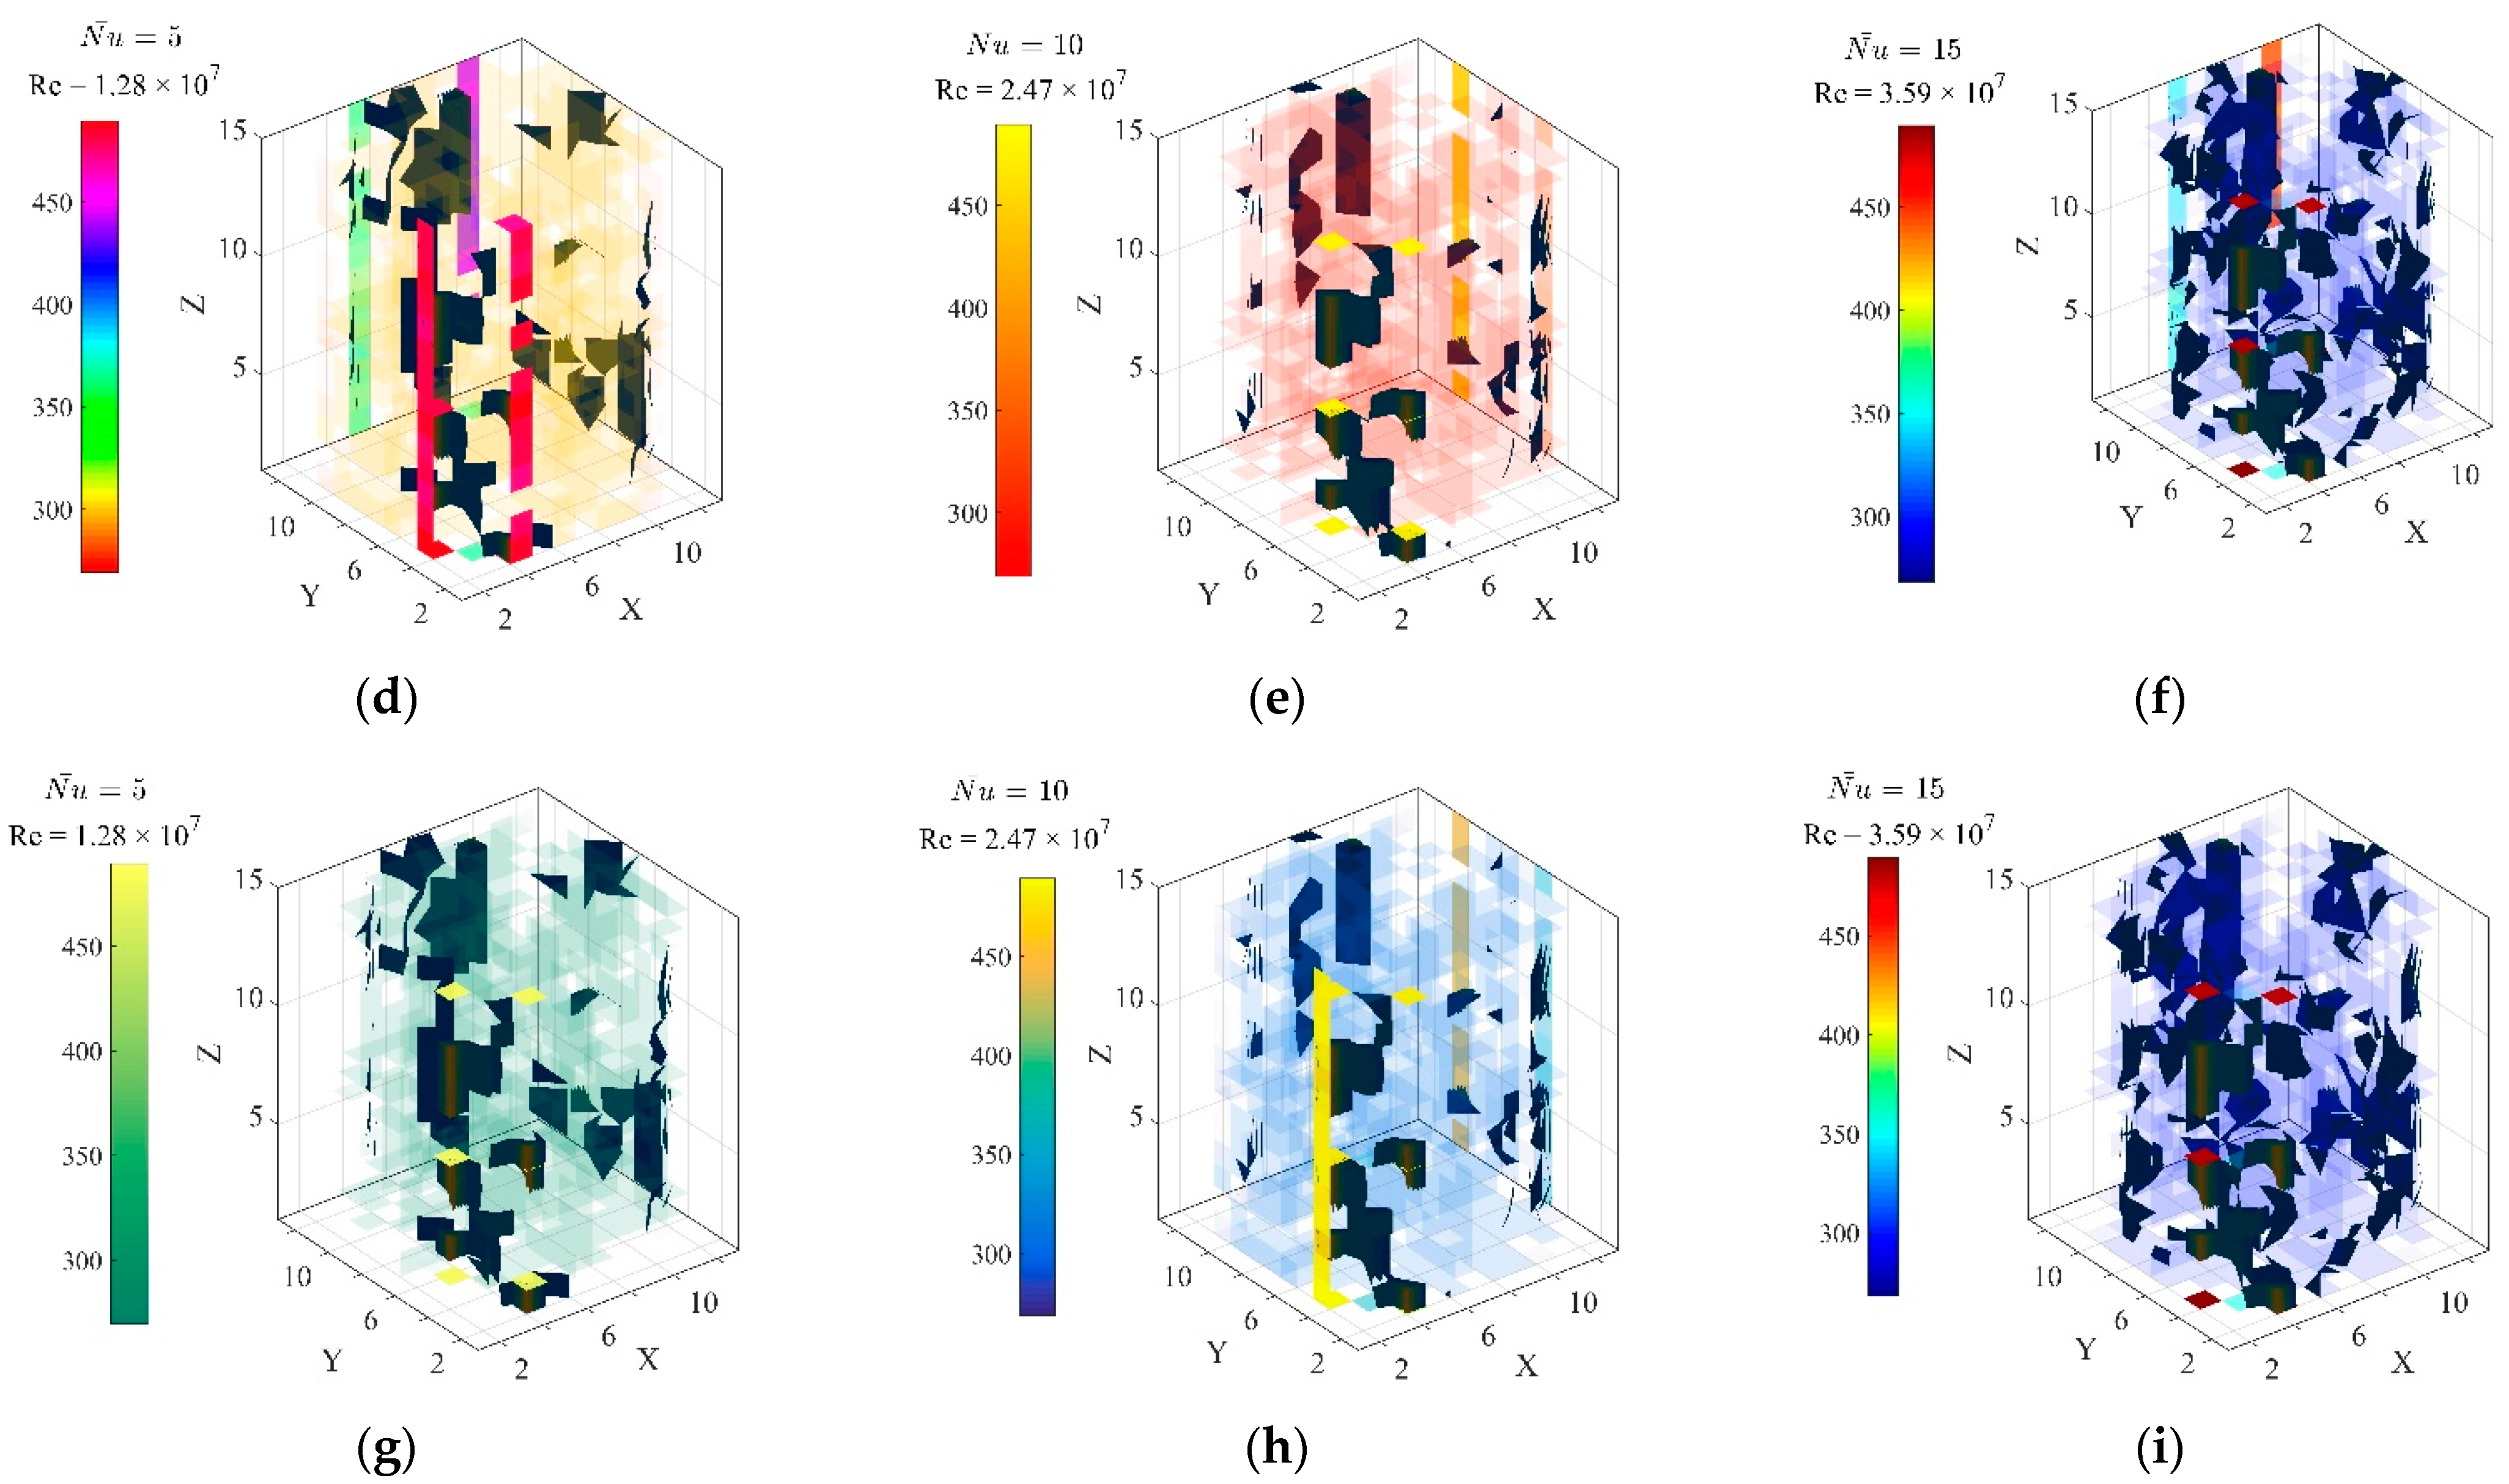
Re numbers on the temperature distribution of biofuel pellets in the time-dependent heating of biofuel is illustrated in
Figure 8. As compared to the quasi-static condition, the temperature profile at different sectional planes would be severely impacted by the simultaneous increase in the
Nu and
Re numbers. Unlike the phenomenon of redistribution of the thermal profile without affecting its magnitude on the sectional plane in the quasi-static condition of torrefaction, the temperature along the slicing planes is reduced by 1.2% to 1.8% at a constant inert gas pressure of 1.5 bar. However, the effect of nitrogen gas was found to be restrained with the increase in the torrefaction duration, and the redistribution of temperature across the slicing profile was not noticeable. Though the temperature range remained constant, an overall drop in the local temperature along the tangential plane was noticed for τ = 10 and 15 min. The temperature would be fairly constant during the torrefaction process if the average Nusselt and Reynold numbers remained low for a dynamic condition. The effect of processing time on temperature distribution at constant values of Nusselt and Reynold numbers would be on the magnitude as well as on the range of temperature scale. A significant change in thermal energy along the curvature of biofuel and in the radial direction can be estimated by applying time-dependent heat flux for both the quasi-static and dynamic conditions.
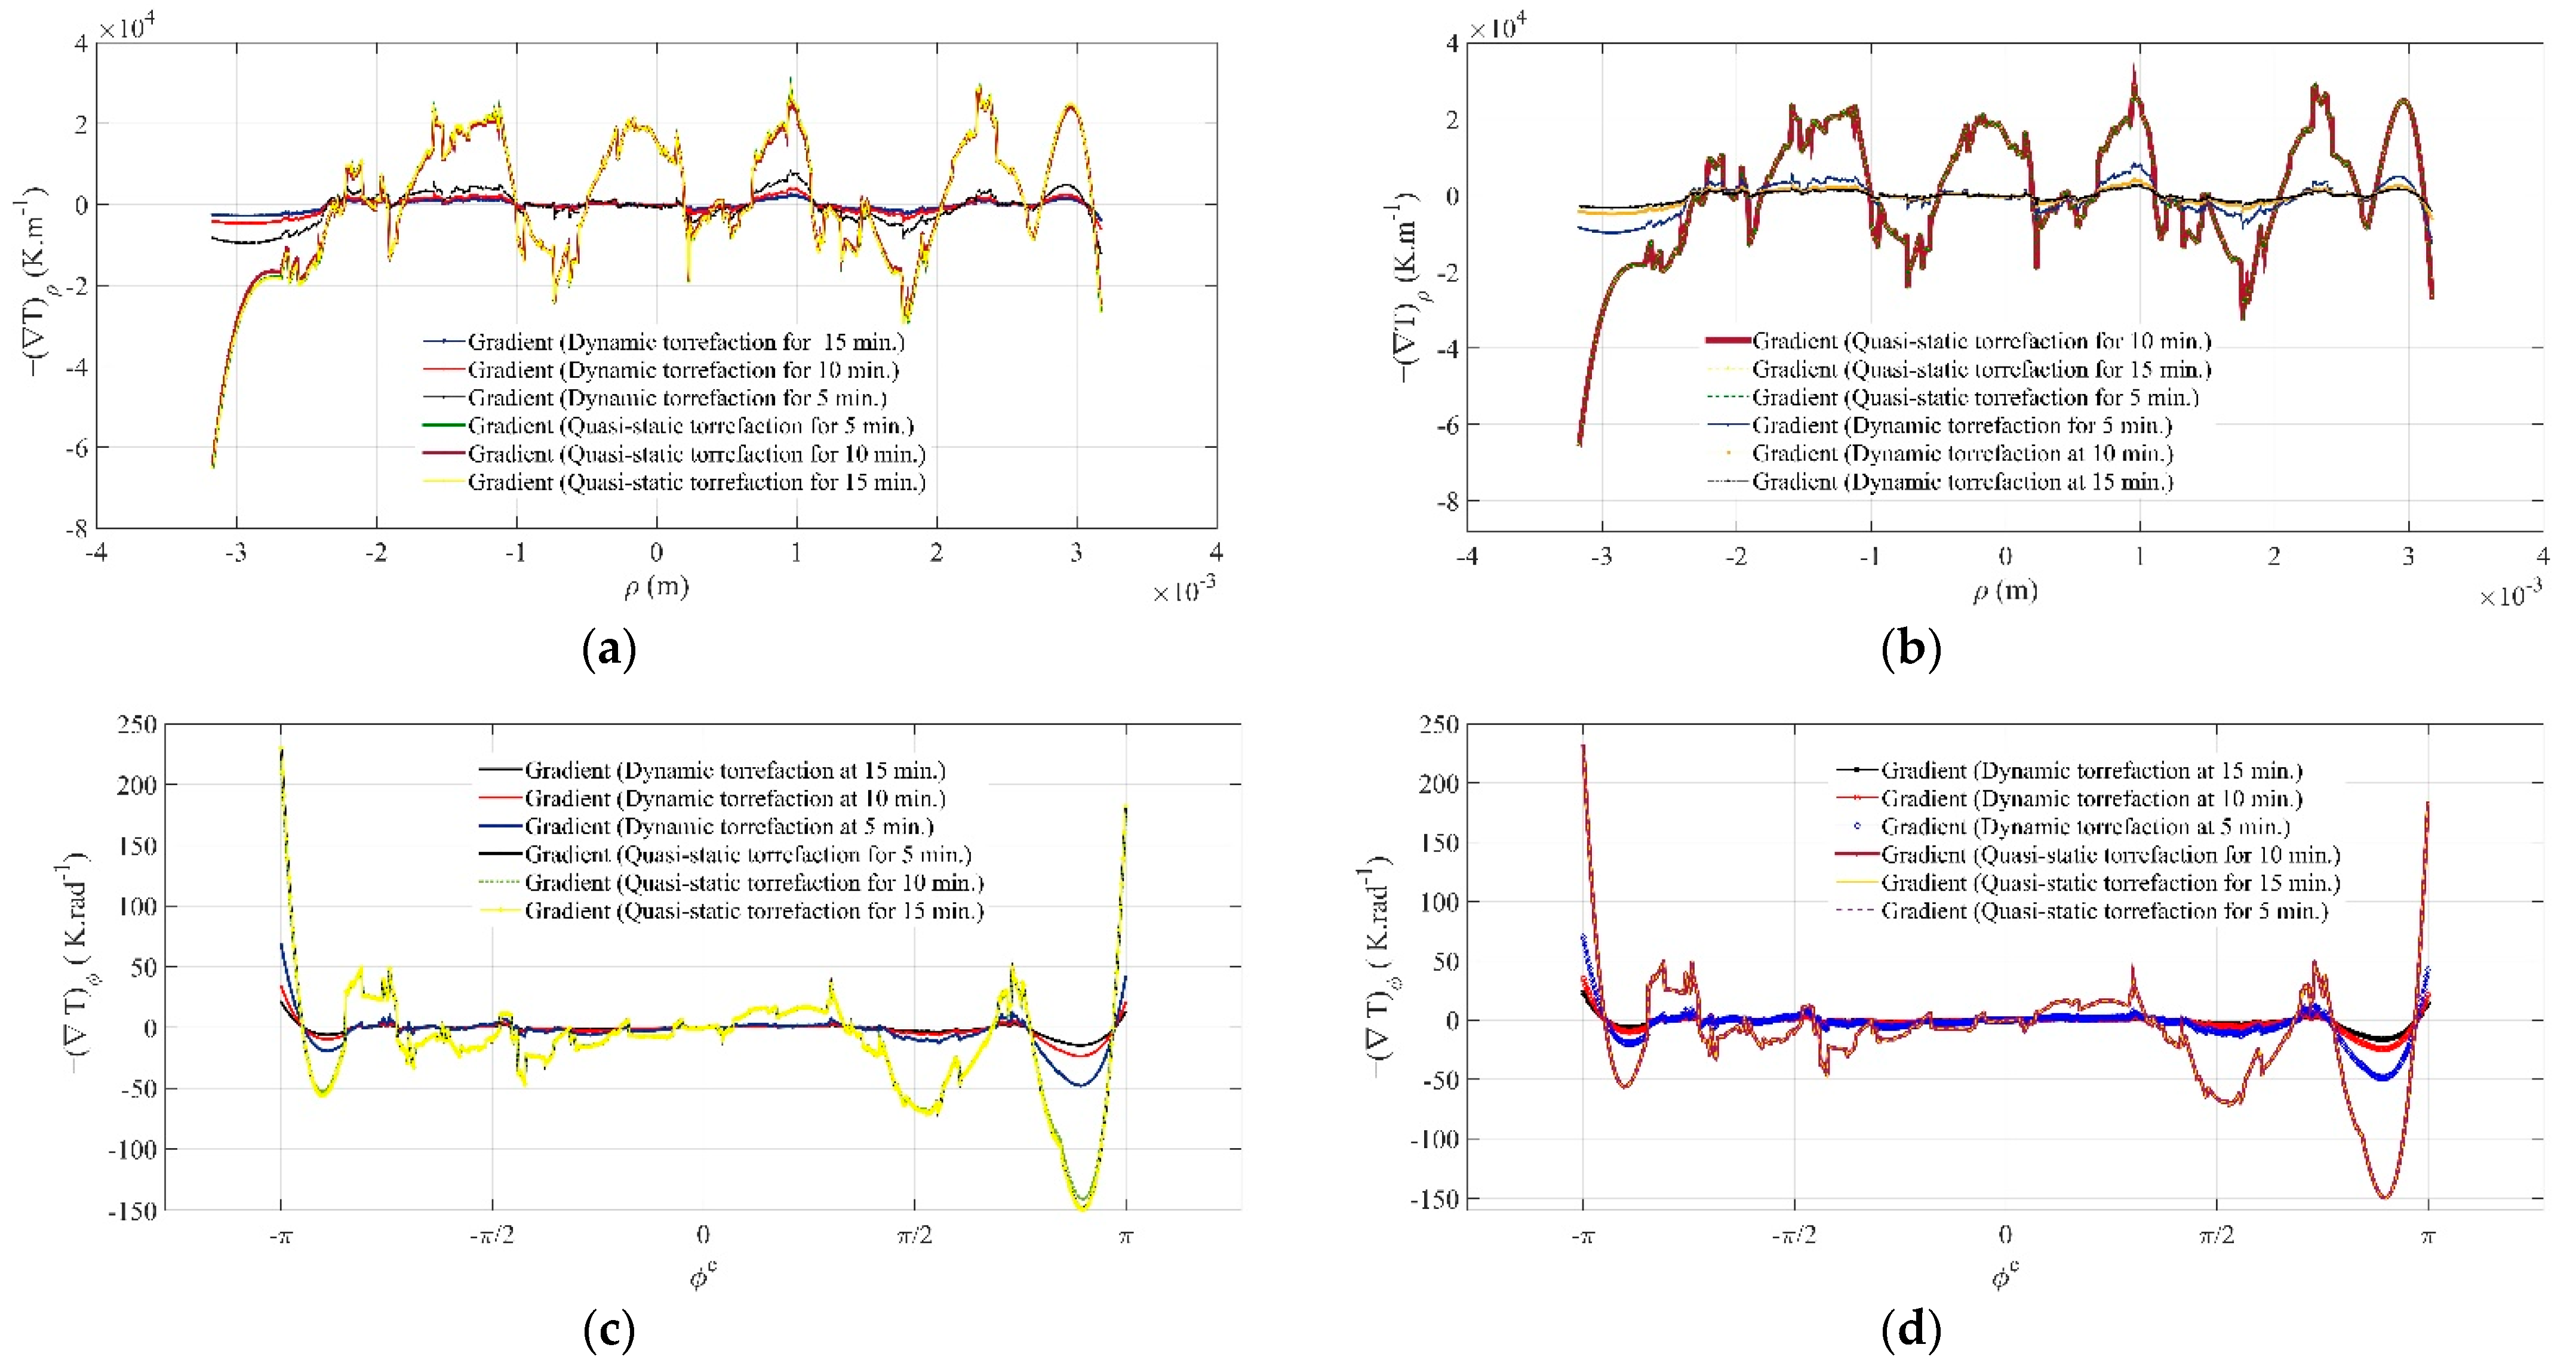
The temperature gradient along the polar coordinate under both varying and constant heat of a furnace is provided in
Figure 9. It was noticed that the temperature gradient along the radial direction (
Figure 9a,b) would marginally deviate with the increasing torrefaction duration. Consequently, the change in heat flux across the pellet would be imperceptible. On the other hand, deviation in the heat flux with time would substantially increase along the outer surface of the biofuel pellets when carrying out torrefaction in dynamic condition. Comparatively, the magnitude of the thermal gradient along the radial direction would be much higher in the quasi-static condition than that of a time-dependent thermal history. For the quasi-static state of the Joule heating system, the heat flux at the centre of the biofuel pellet was found to initially increase with torrefaction time. With a further increase in the torrefaction time, a drop of 4.4% was recorded in the heat flux. On the contrary, a surge of 3.75% was noticed when the torrefaction duration was increased by 5 min. The reverse trend was seen in the vicinity of the outer surfaces of the biofuel pellets. Initially, on the right layer of the biofuel pellet, the heat flux was found to be decreased by 36% as the torrefaction time increased by 5 min, and it suddenly increased by 41% when torrefaction time increased to 15 min. The cosine characteristic of the thermal gradient along the radial plane was noticed for the quasi-static condition. The thermal pre-treatment under the dynamic condition was seen to follow a similar trend, but the direction of heat flux was reversed at the centre of the biofuel pellet. Unlike quasi-static heating, the heat flux would increase with increasing torrefaction time under the dynamic state of the system. The heat flux increased by 50.42% as torrefaction time increased by 5 min. With a further elevation of processing duration, the heat flux was estimated to rise to 39.53%. It was noticed that the magnitude of the reversal of heat flow was reduced when the torrefaction duration was increased. This implies that heat transport would significantly influence the diffusion of volatile gases and the evaporation of water molecules. If it is noticed near the outer layers of biofuel pellets, a reverse pattern would be seen. The heat flux in the outer zone of the pellet was predominately flowing towards the core of the pellet and the heat flux increased with a decrease in processing time. A drastic drop of 52.17% in the heat flux was estimated at the outer region of the pellets when the torrefaction time was increased by 5 min. Upon a further increase in the processing time, the heat flux was additionally reduced by 39.52%. At a constant torrefaction time, the heat flux at the quasi-static state was computed to be five times higher than that under the dynamic state of the system. This implies that both the thermal conditions are accompanied by an alternating change in heat flux and thermal gradient along the radial direction of a biofuel pellet. The heat would simultaneously flow in and out with the change in the heat energy provided by the furnace. It was also noticed that the heat flux or thermal gradient was overly damped during dynamic heating of a pellet, whereas underdamped response was found for a quasi-static state of the system. This might happen due to the removal of the applied heat flux from the system in the form of thermal energy (for increasing internal energy of the pellets or absorption of heat by the fluid flowing across porous medium) if the thermal conductivity of the pellet remains independent of the grain orientation and direction of heating. This change would be more rapid if a Joule heating system was programmed in dynamic mode. For a short period of torrefaction in the dynamic heating system, the thermal gradient would succumb to the non-conservative energies at the central domain of the pellet. The overall fluctuation in the thermal gradient at the interior region of the biofuel would be insignificantly low when the thermal history follows a time-dependent function. Contrary to the varying heat supply, the characteristics of the thermal gradient along the radial direction would have a similar cosine characteristic except for a minuscule change in the magnitude of heat flux and thermal gradient at the centre and in the vicinity of the outer layers of the biofuel pellet.
Unlike the gradual increase in the inward flow of heat flux along the radial axis, it would decrease for the azimuth plane (
Figure 9c,d). At
ϕ = 0, the heat flux would have a similar pattern of variation as at the central axis of the biofuel pellet. The only difference in the behaviour of heat fluxes along the radial plane and azimuth plane for a quasi-static condition is the reverse characteristic. Specifically, the fluctuating heat flux would transform into an alternating heat flux, whereas it would have the opposite attribute for dynamic heating of the system. It was initially elevated when the processing time was increased from 5 min to 10 min, and with further increases in the duration of torrefaction, it reversed its path and reduced by 7.1%. However, it would be continuously increasing with the processing time when the pellet is subjected to a time-dependent thermal history. An increase of 39.51% was noticed while increasing the torrefaction time from 10 min to 15 min, whereas it was 52.15% during the initial transition of the system from 5 min to 10 min. Thus, the heat flux gap with the processing time was found to be reduced by 2% and it approached a thermal equilibrium state with increasing processing time. It must be noted that these traits are defined at a particular azimuth plane and would alter with a change in the orientation of the azimuth plane. With the further clockwise rotation of the plane,
, the characteristics of thermal gradient or heat flux curves were changed from alternating to fluctuating in nature. The heat flux inside the pellet was increased by 2.5% as the thermal pre-treatment duration changed from 5 min to 10 min, whereas it was noticed that it dropped by 2.6% upon further increasing the torrefaction duration in a quasi-static state of the system. Similarly, for the dynamic or time-dependent thermal history, the thermal gradient curves at
would share the same characteristic as the quasi-static system but increasing torrefaction time would make the curves asymptotic to the tangential plane to the thermal profile. The relative increase in the heat flux during a period of 5–10 min would be the same as that estimated at
ϕ = 0 for a dynamic condition. This implies that the heat flux or thermal gradient would fluctuate with a constant time-dependent phase difference. If the thermal gradient along the azimuth plane is compared with a thermal gradient along the radial direction, it can be seen that the change in heat flux corresponding to the thermal gradient at a particular spatial position would be far higher in the radial plane than the azimuth plane. It can be concluded that the penetration of the applied heat flux would be much quicker in a thin specimen than in a thick one. On the other hand, the removal of heat in the form of thermal energy would be much higher along an azimuth plane than in the radial direction for a quasi-static system. The opposite is true for a dynamic condition, where the thermal gradient would be much more homogenous along the radial plane than the azimuth plane and heat would concentrate more in the circumferential region of a pellet. As in the case of the radial plane (
Figure 9b), the effect of the steady heat supply (
Figure 9d) would be to merely influence the magnitude of the thermal gradient or the corresponding heat flux. It would bear no relationship with the characteristics of the gradient curves.
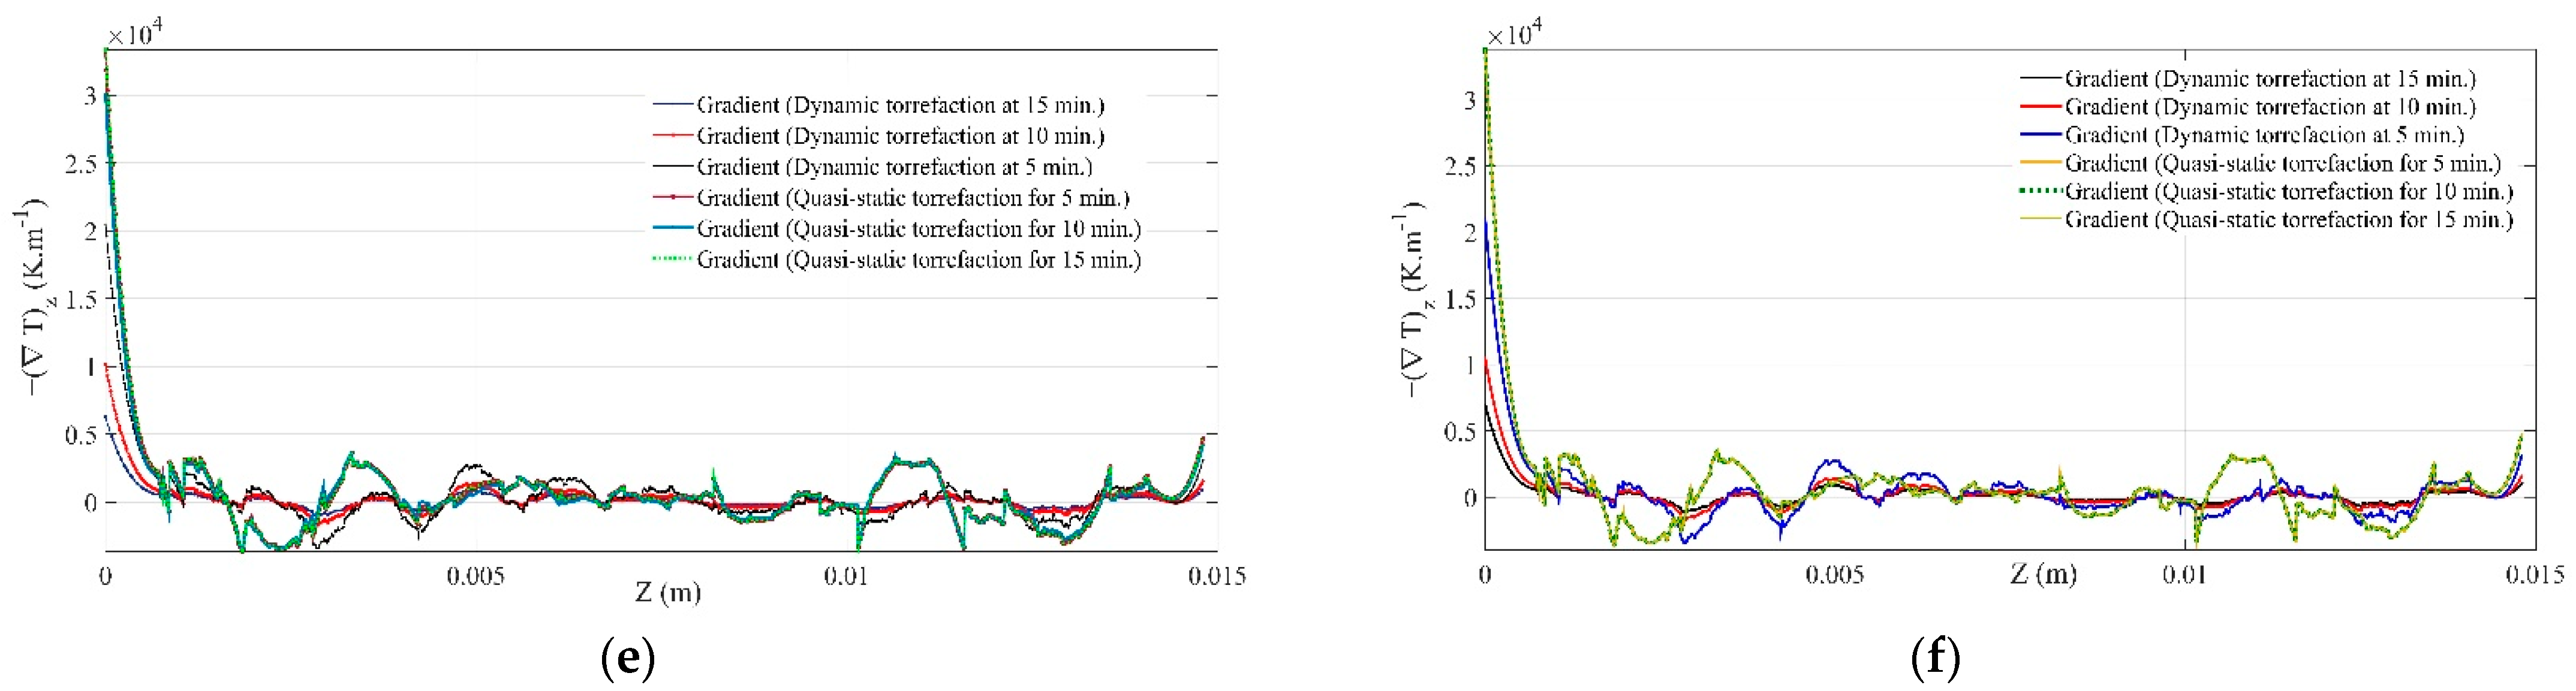
The variation in the thermal gradient or corresponding heat flux along the vertical plane of a pellet is shown in
Figure 9e,f. It can be seen that the amplitude of the thermal gradient along the vertical plane varies exponentially with processing time, with an over-damping cosine characteristic. As compared to the azimuth and radial planes, the pellet would attain thermal equilibrium more quickly with the applied thermal history along the vertical plane. Initially, for a quasi-static condition, the heat flux would decrease by 67.74% when the torrefaction period changes from 5 min to 10 min. Later, with a further increase in the processing duration, it was estimated to be increased by 87%. At the onset of the torrefaction process, a dead time or thermal lag between the curve for a processing time of 5 min and the curve of 15 min was noticed in a quasi-static condition. This implies that the biofuel pellet would have a constant heat flux for a pellet of length 0–0.5 mm. As the length of the pellet increased, the heat flux was also found to languish for a constant processing time. During the increase in the processing time from 5 min to 10 min, the heat flux was reduced by 12.41% at the centre of the vertical plane, whereas with a further increase in the duration of the torrefaction process, the heat flux along the vertical plane was elevated by 160%. The relative change in heat flux with the increasing height of the pellet was widened with the processing period. This energy gap was correspondingly augmented in a dynamic state of the system. For the same length of pellet, the change in heat flux during a torrefaction time of 10–15 min was 15.53% higher than that in a quasi-static condition. However, the amplitude of the thermal gradient in a dynamic state from the radial plane for the same processing time is 80% lower than that of the thermal gradient in a quasi-static condition at the centre of a vertical plane. Unlike the quasi-static condition, heat flux along the vertical plane in dynamic heating would dramatically decrease with increasing processing time. The overall change in heat flux along the vertical plane would be fluctuating in nature rather than cyclic or alternating. If a comparative picture is drawn, the thermal gradient or corresponding heat flux would vary significantly along the vertical axis with a standard deviation of 920.32 W·m
−2, followed by 0.148 W·m
−2 along the azimuth plane and 0.121 W·m
−2 in the radial direction at the centre of the biofuel pellet. Correspondingly, in a time-dependent heating system, the standard deviation in the heat flux along the vertical plane is merely 0.535 W·m
−2. On the other hand, it was 3.312 kW·m
−2 in the radial plane and 3.1 kW·m
−2 along the azimuth plane,
ϕ = 0. It can be seen that the deviation in heat flux or thermal gradient along different planes is significantly affected by the applied thermal conditions. The system has a more homogeneous distribution of energy and temperature with processing time, whereas the amplitude of heat flux along the radial direction is reduced by 15% if the same pellet undergoes torrefaction for a duration of 5 min in dynamic mode. Similarly, a 64.46% drop in the amplitude of the heat flux along the azimuth plane would be seen while performing torrefaction in a time-dependent thermal history. However, the relative amplitude of the heat flux at the centre of the pellet was estimated to be lowered by 98.41% along the vertical axis when heating a pellet in a quasi-static condition. The effect of heat flux on the thermal model is shown in
Figure 10. It was found that the domain of temperature (
Figure 10a), which was confined to 300–350 K for a constant heat supply, was dilated to 350–400 K at the circumferential plane of the biofuel pellet for a quasi-static condition. The increase in the processing time of the pellet (
Figure 10c) shifted the temperature range from 350–400 K to 340–380 K, which was later expanded to 350–450 K when the pellet was processed for 15 min (
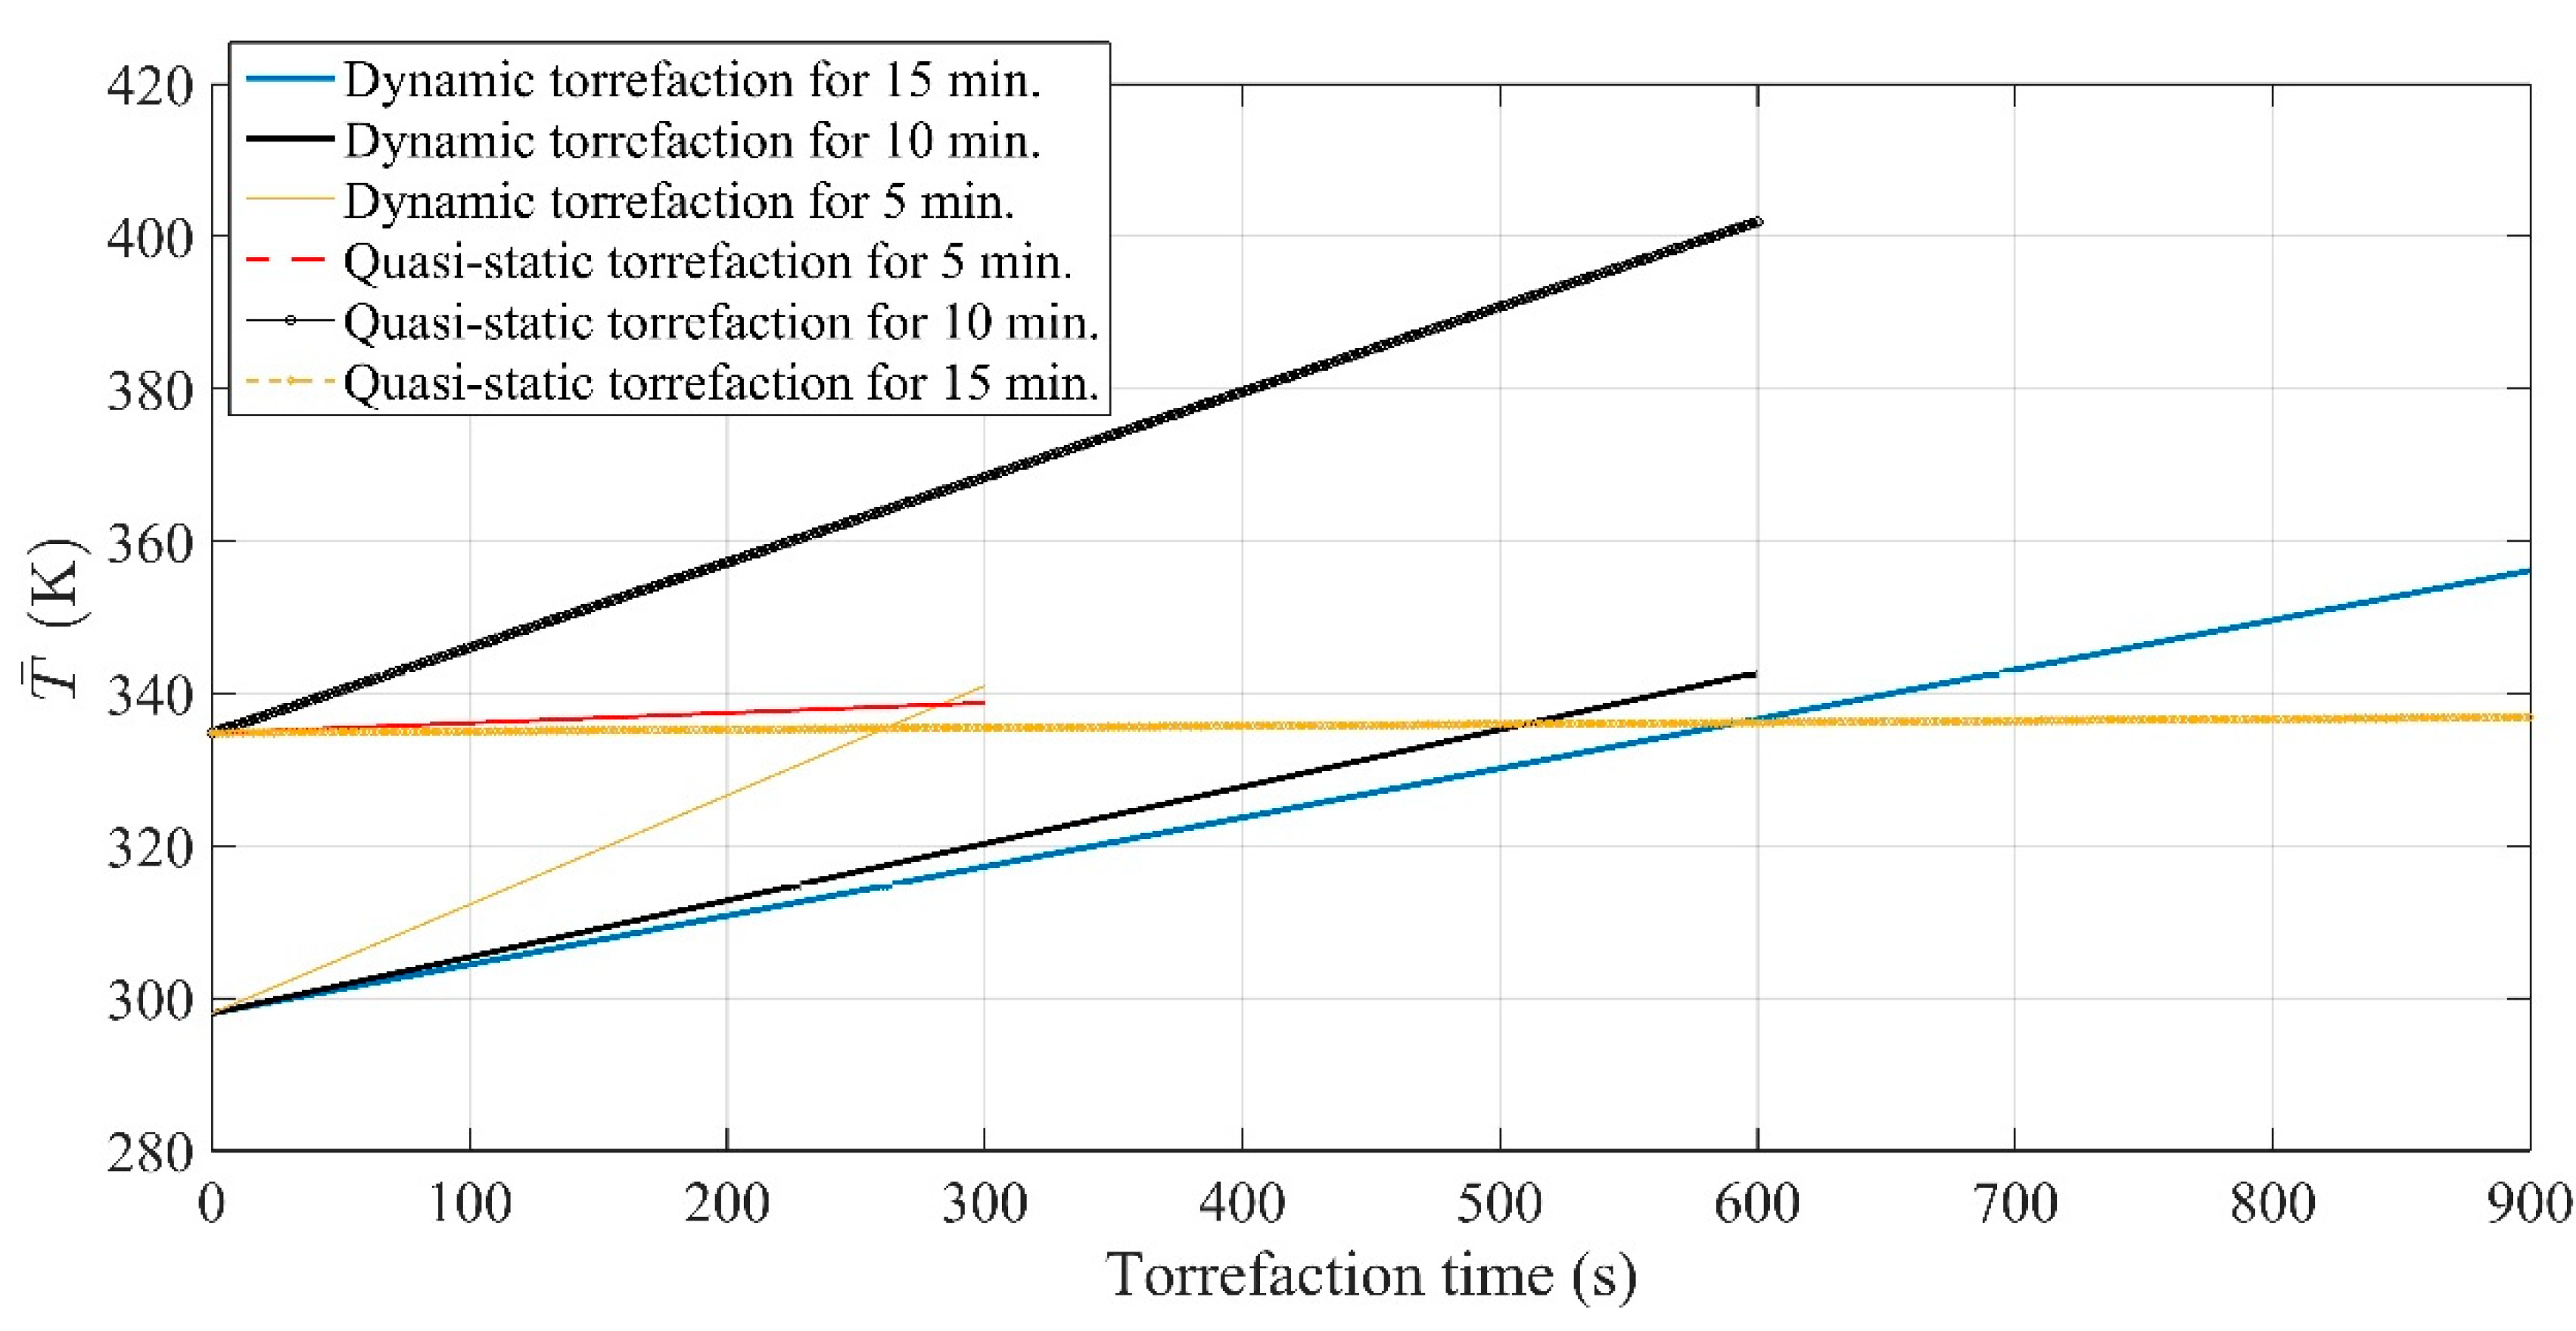
Figure 10e) in a quasi-static condition. This happened either due to a reduction in the supplied heat to the furnace or a nominal change in the volumetric flow rate of nitrogen gas. Similarly, the change in the thermal model upon applying a time-dependent thermal history shifted the temperature domain to 350–375 K. The average temperature of biofuel pellets found from the numerical solution under the experimental conditions varied from 340 to 400 K for quasi-static heating (
Figure 11), whereas it was 300 to 360 K when a similar size of the pellet was subjected to the dynamic heating condition. The numerical solution derived from a PDE model is presented in
Table 5. It can be seen that the deviation in the solution was estimated to be the highest at a lower processing time for both the tested thermal conditions. The average heat flux along the Cartesian coordinates is lowest for the torrefaction process carried out for 10 min. From the pdepe solution for mass diffusion of volatile and water, the adopted thermal model estimated the mass yield within less than 5% tolerance, while it was 6% when the same size of the pellet underwent torrefaction in a time-dependent thermal history. The mass yield was found to vary from 92.53% to 96.20% for the quasi-static torrefaction. On the other hand, it was 92.60–96.40% for the dynamic torrefaction. The gap between the numerical and experimental results for the dynamic states occurred due to the thermal lagging factor.
6.2. Characteristic of Mass Transfer during Torrefaction
The diffusion of volatile species (CO and CO
2) along with the evaporation of water content was modelled by using the pdepe module. The role of surface reaction and the presence of oxygen was considered to determine the boundary condition for a white-box model. The effect of the quasi-static torrefaction on the mass fraction
yi of volatile species, CO and CO
2, across the fixed boundary film is illustrated in
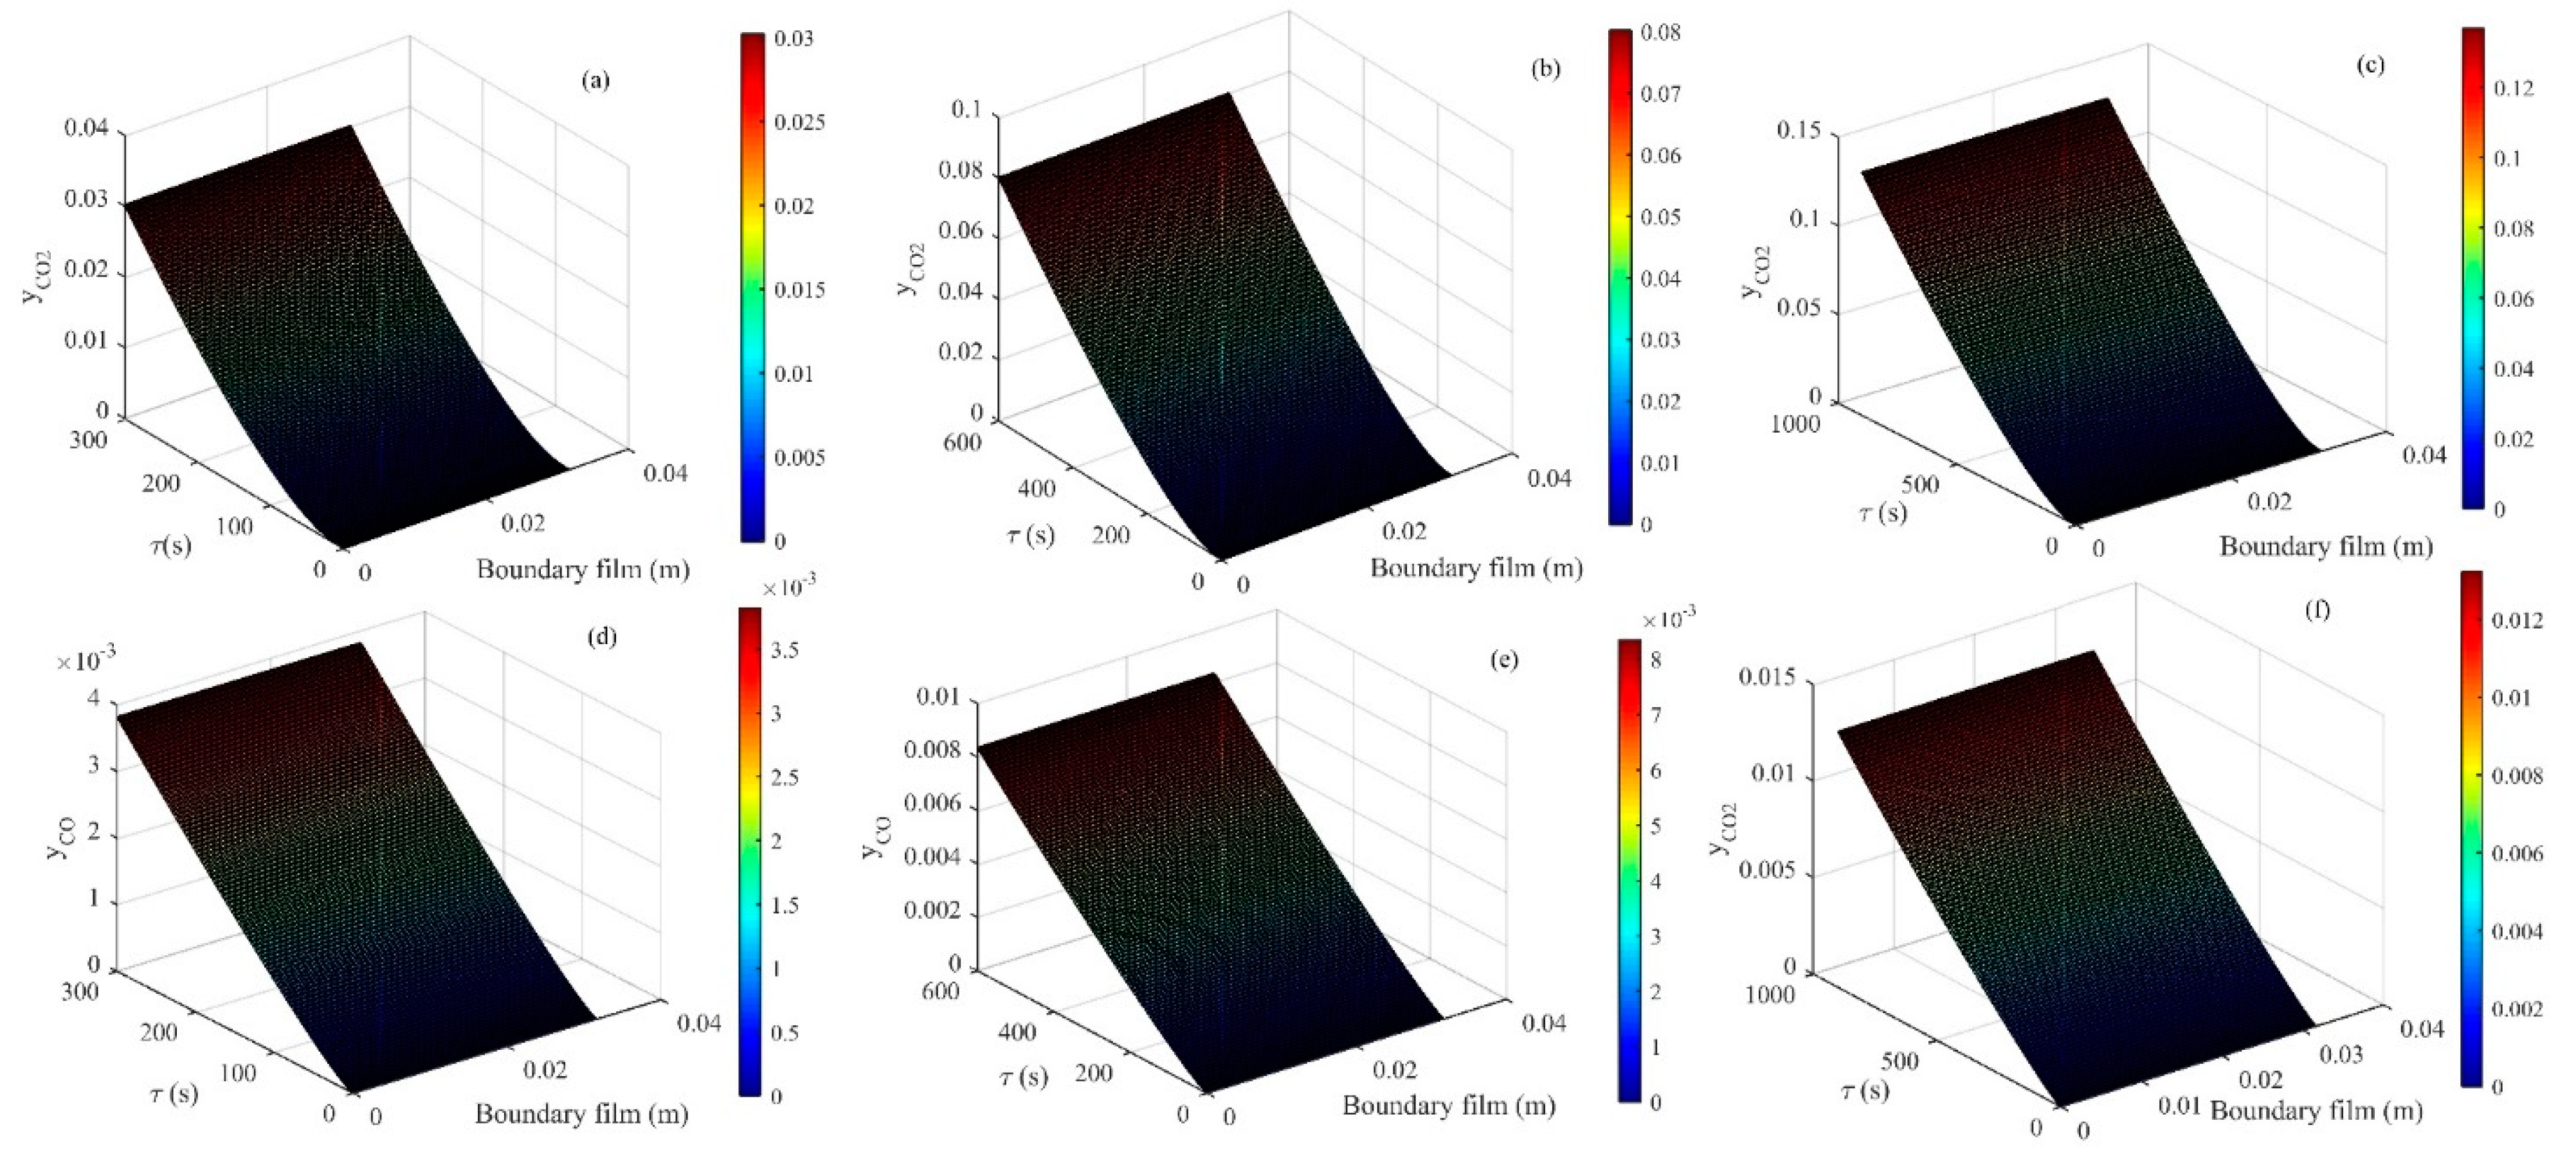
Figure 12. The mass distribution of carbon dioxide, CO
2, across the fixed boundary film shows a sigmoidal characteristic (
Figure 12a–c). The declaratory phase of diffusion occurred at the onset of the diffusion process, which was found to be subdued as the duration of torrefaction was increased by a fixed time interval. The mass fraction of carbon dioxide,
yi, was estimated to be increased by 166% with an increase in torrefaction time from 5 min to 10 min, whereas a further increase in the processing time enhanced the diffusion fraction of carbon dioxide by an additional 85%. As the duration of torrefaction was increased, the rate of diffusion of carbon dioxide across the boundary film also surged by 20.49–36.50% for a quasi-static condition. Unlike the diffusion of carbon dioxide across the boundary film, the change in the mass fraction of carbon monoxide was along a constant linear plane (
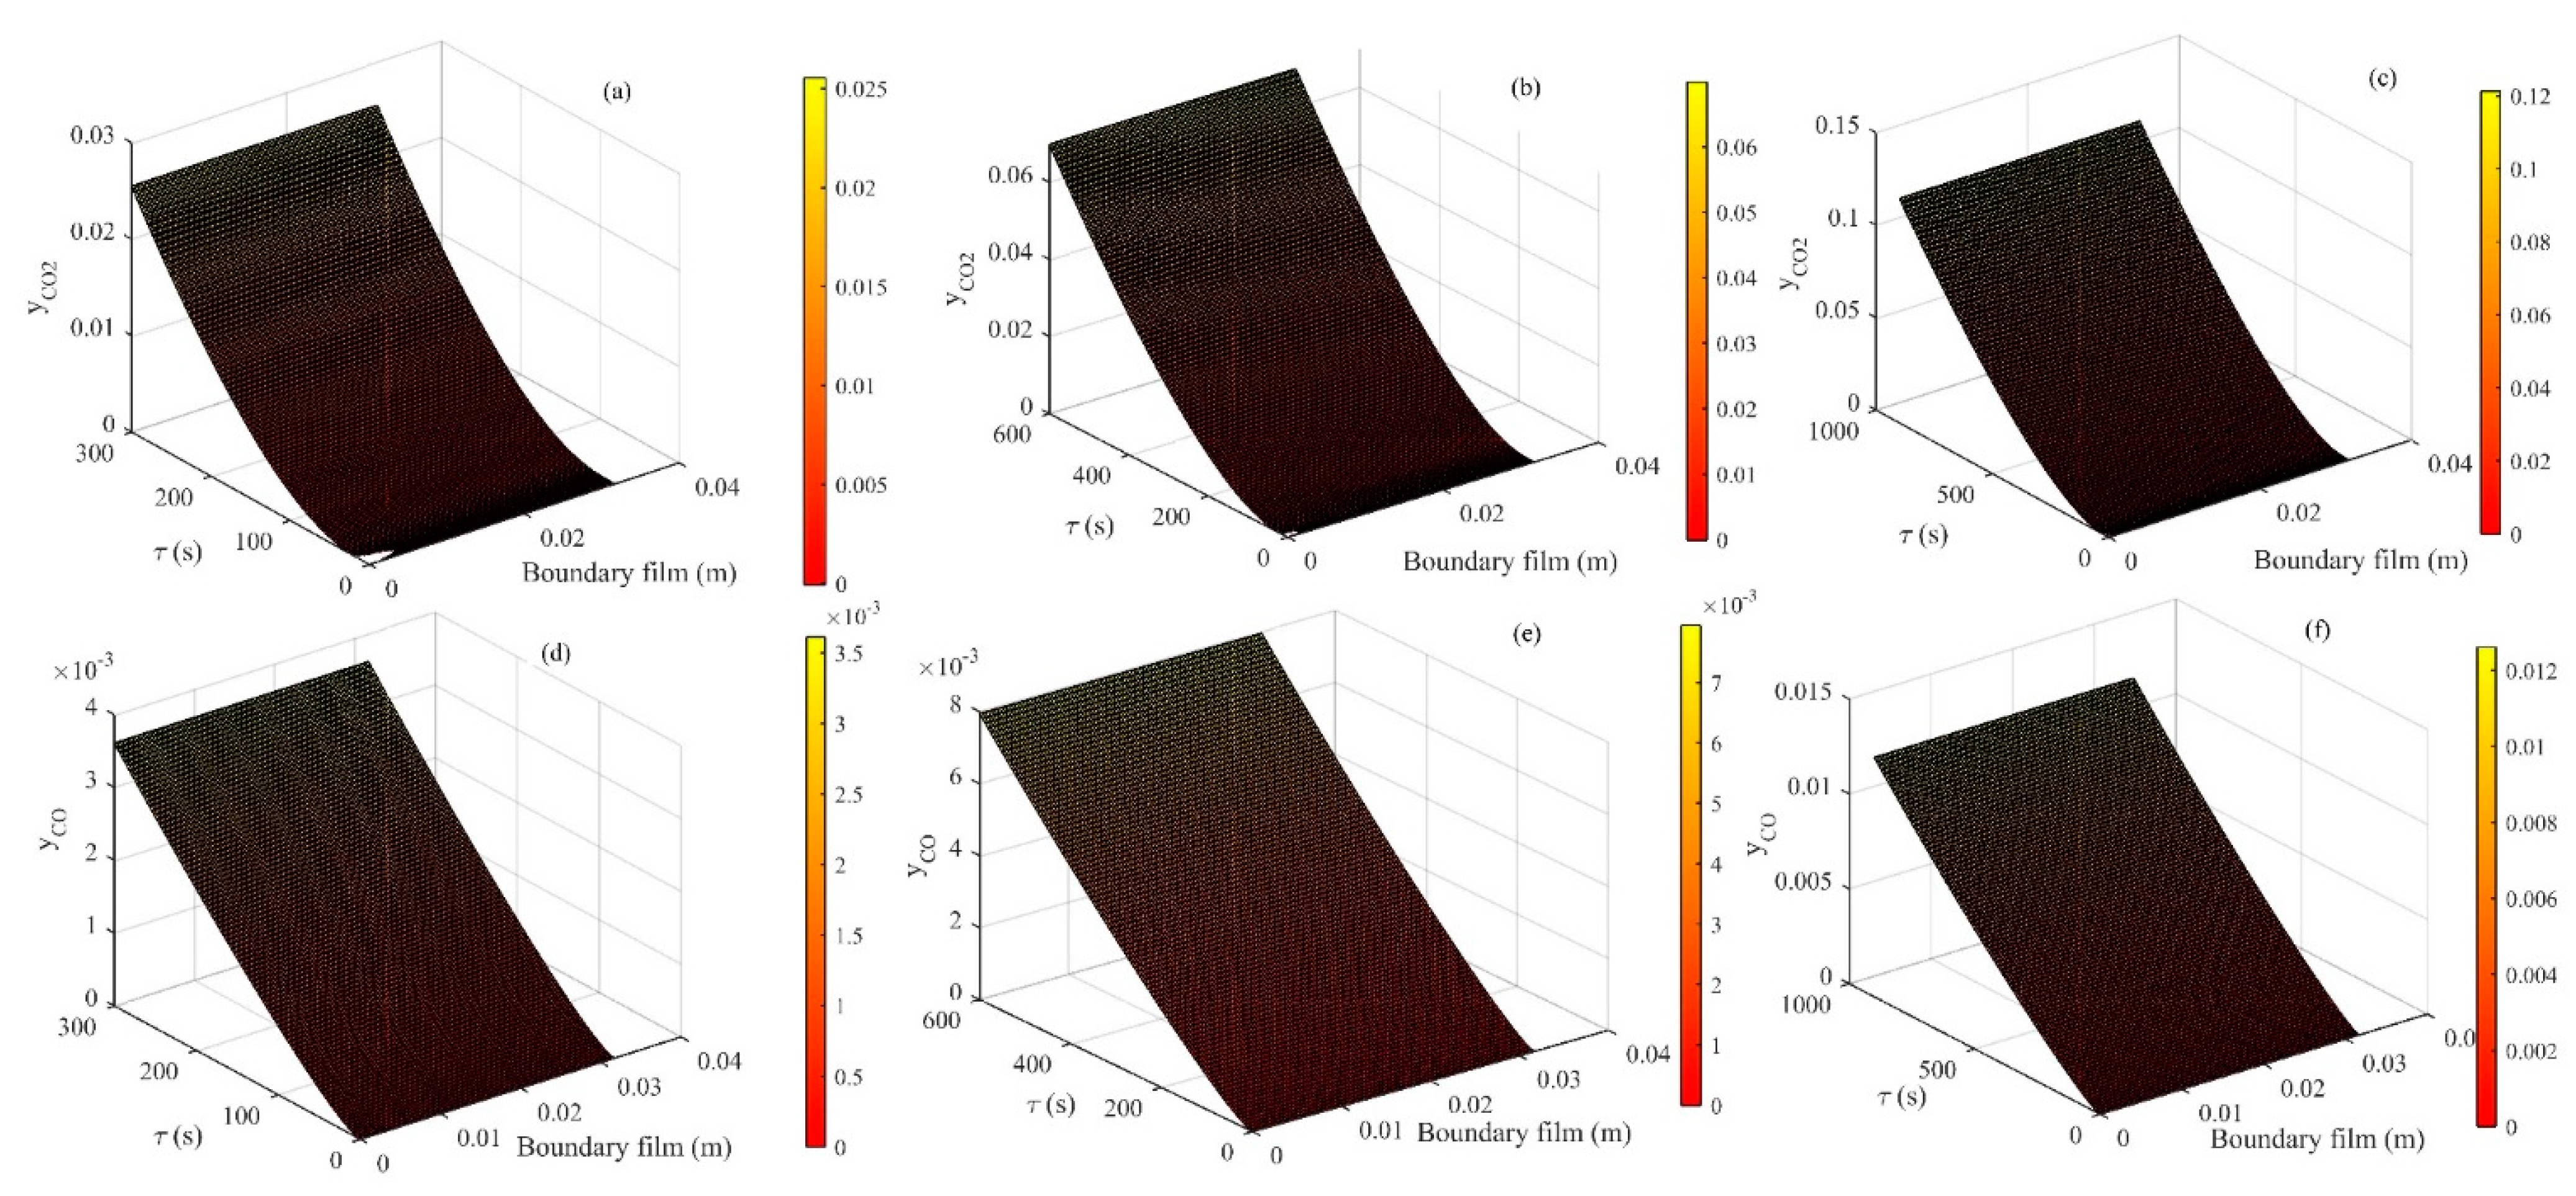
Figure 12d–f). The diffusion of carbon monoxide was increased by 118.59% upon increasing the processing time by 5 min, which was further heightened by 58.6% as the torrefaction period was increased to 15 min. The overall change in the mass fraction of carbon dioxide across the boundary film was found to be 40% higher than that of carbon monoxide. The rate of change of mass fraction of carbon monoxide across the boundary film was amplified by 7–11% as the duration of torrefaction was increased from 5 min to 15 min. Similarly, the impact of the dynamic torrefaction on the mass fraction of volatile components is shown in
Figure 13. The characteristics of the mass fraction curves are similar to the characteristics of the diffusion curves obtained for the quasi-static torrefaction. The only difference is at the onset of mass transfer across the boundary film. The behaviour at the onset of torrefaction showed discontinuity in nature for a very short duration of time (
τ) and a boundary film of 4 mm led to the reversal of carbon dioxide flow (
Figure 13a–c). However, as the processing time increased, the effect of discontinuity faded. The mass fraction of CO
2 was elevated by 174% as the period of torrefaction was increased from 5 min to 15 min. The diffusion of CO
2 in the dynamic torrefaction was found to be 5% higher than that of the quasi-static torrefaction. With a further increase in the processing time in the dynamic torrefaction, the mass fraction was additionally augmented by 73.70%, which is 13.2% lower than the obtained mass fraction of CO
2 for a quasi-static state of the system. It can be concluded that the diffusion of CO
2 across a fixed boundary film would be higher in the quasi-static torrefaction than in the case of the dynamic condition for a long duration of torrefaction. However, the effect of thermal lag is omitted in the diffusion equation, so the obtained solution is based on the assumption that the time required for the conduction of heat flux across the pellet would be longer than the time needed for carrying out the surface reaction, or, in other words, the pyrolysis number
is far less than unity, which causes the surface reaction to occur virtually instantaneously. The increase in the processing time of the pellet caused the rate of diffusion of carbon dioxide to be stepped up by 18.39–22.38%, which is correspondingly 10% to 38% lower than the rate of diffusion derived for the quasi-static condition. The diffusion of carbon monoxide across the fixed boundary film in both dynamic and quasi-static conditions has a similar characteristic (
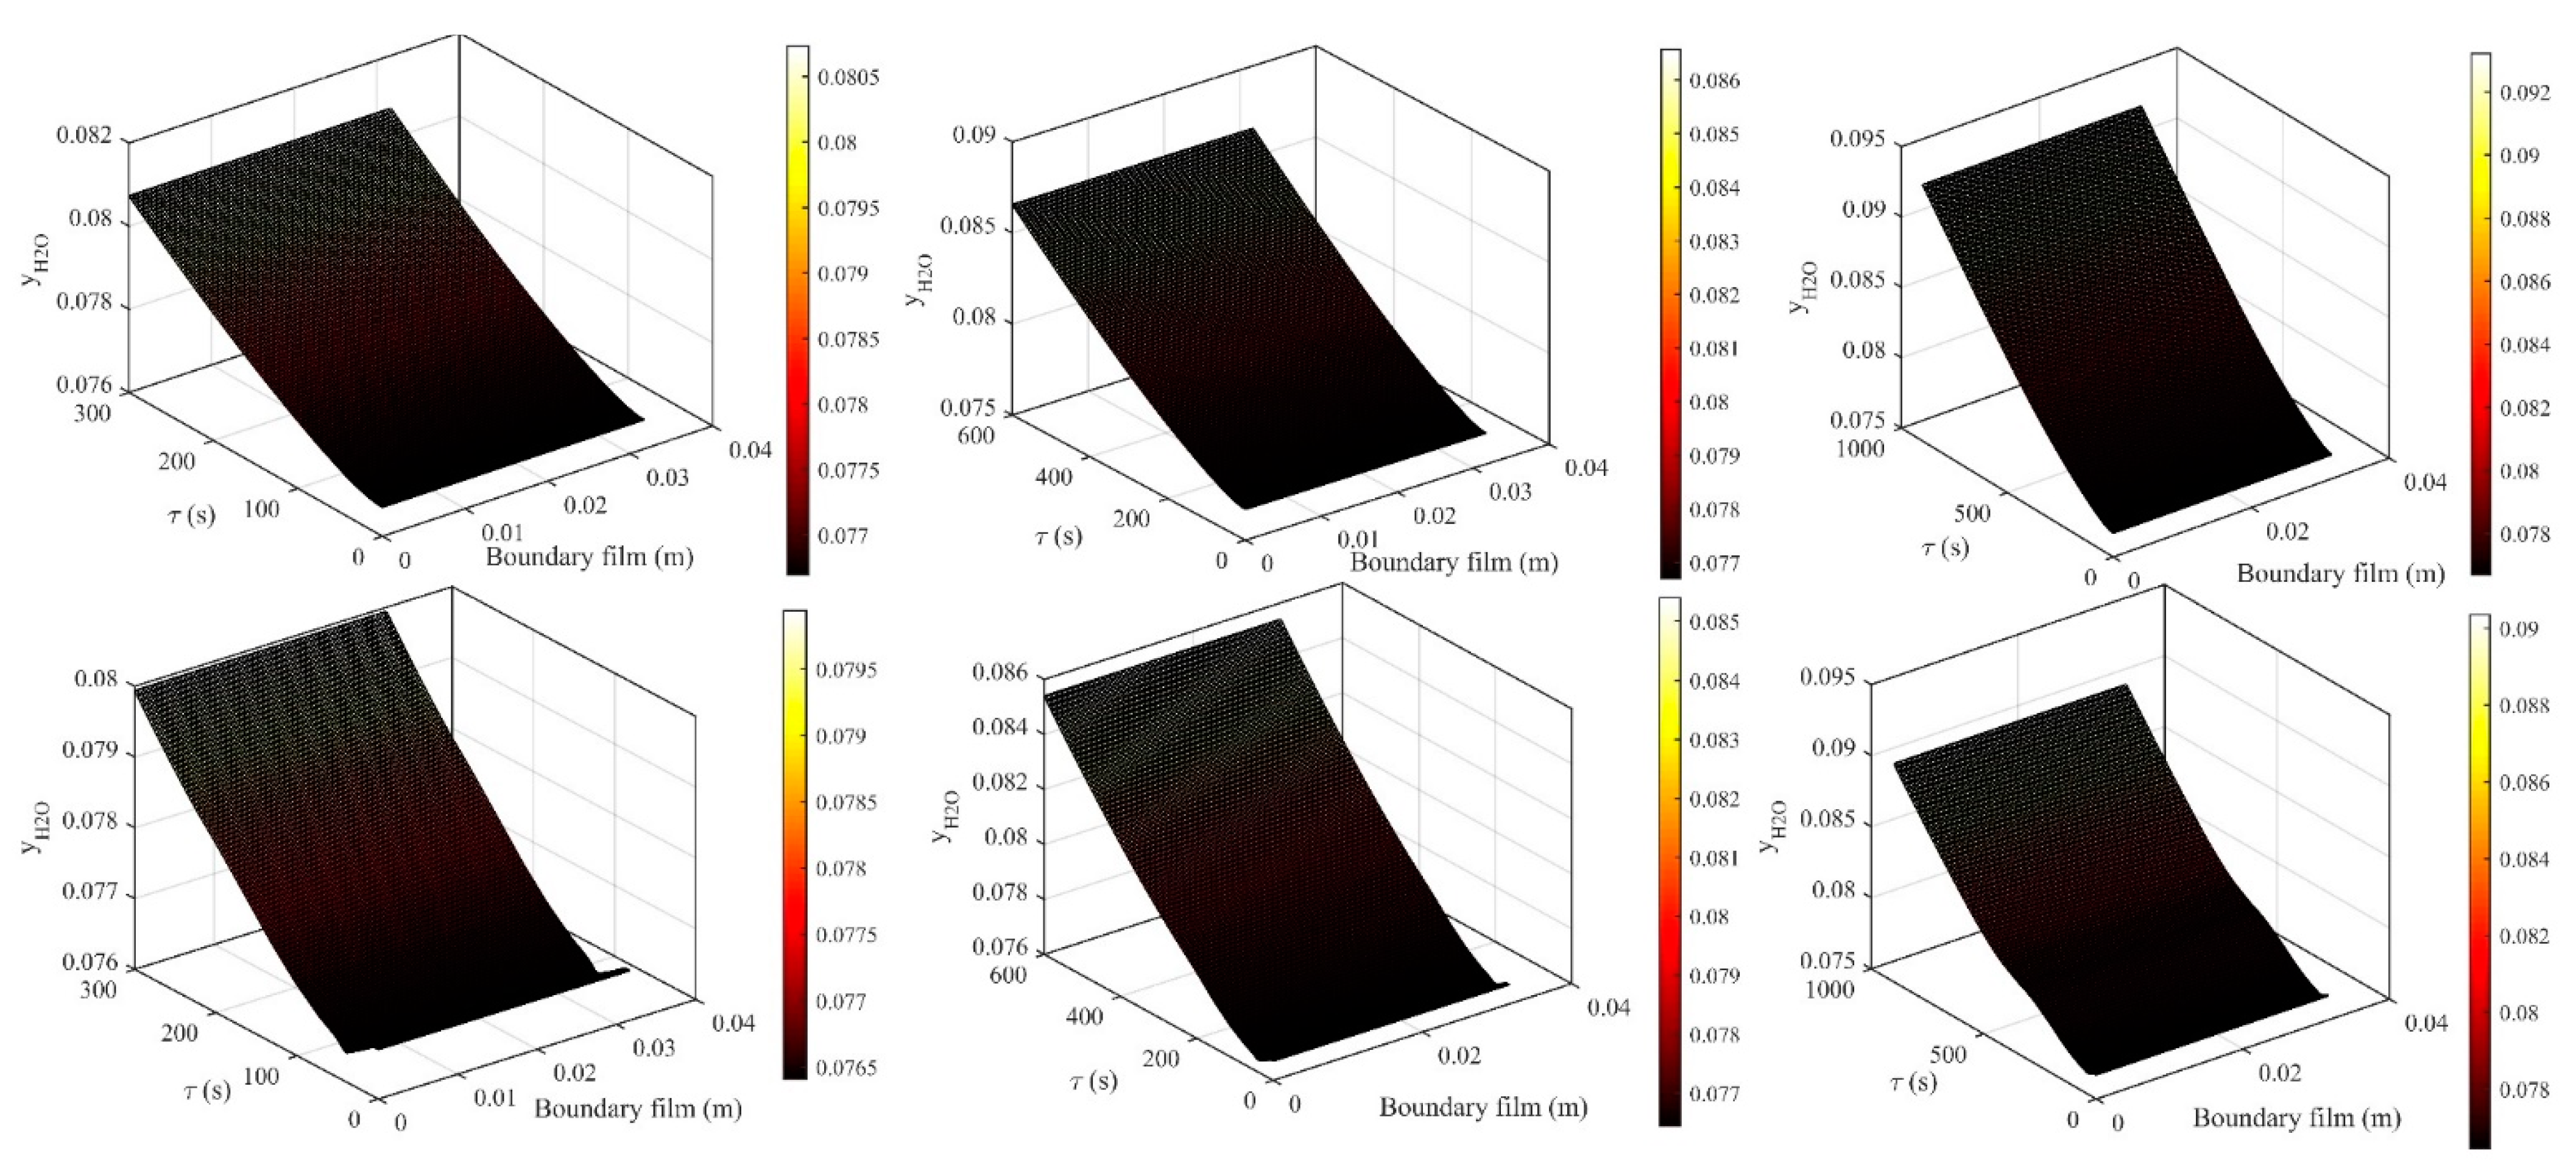
Figure 13d–f). The mass fraction of carbon monoxide was estimated to be raised by 120% in a time interval of 5–10 min. With a further increase in this interval, an additional increase of 58% was seen in the mass fraction of carbon monoxide. Thus, the overall rise in carbon monoxide during the dynamic torrefaction was relatively increased by 0.84% as compared to the release of carbon monoxide in the quasi-static condition. However, a marginal drop (1.02%) in CO fraction was noticed when it was compared with the corresponding mass fraction of CO in the quasi-static condition for a processing time of 15 min. The rate of change of mass fraction of CO was found to be increased by 11% when the pellet underwent torrefaction for a transition period of 5–15 min, which was fairly constant for both the thermal conditions. The evaporation of water across the fixed boundary film for the quasi-static as well as dynamic condition is illustrated in
Figure 14. The behaviour of the diffusion curves for water varied with the time of processing for the biofuel pellets. With the increase in torrefaction time, the sigmoidal attribute was reflected at the onset of the evaporation, which was initially varying along a linear plane (
Figure 14a–c). The evaporation of water increased by 7.22–7.68% as the duration of torrefaction was increased from 5 min to 15 min. Similarly, the rate of evaporation was also affected when the processing was increased within the same time interval. It was initially increased by 19.16% when torrefaction time was stepped up by 5 min, but later, with a further increase in the torrefaction time, the rate of evaporation dropped by 45%. This implies that the evaporation of water would not monotonically increase with time in a quasi-static condition. After a certain period of processing, the water evaporation becomes saturated in the boundary film and no further diffusion of water evaporation can occur.
A declaratory phase of diffusion was also noticed at the beginning of evaporation of water across the fixed boundary layer that implies that the rate of evaporation would be hampered if the conduction time decreases by a significant margin, and it depends on the size of the particle subjected to thermal pre-treatment. The effect of dynamic torrefaction on the evaporation of water across the boundary film is shown in
Figure 14d–f. Contrary to the quasi-static torrefaction, the dynamic torrefaction would promote a declaratory phase of diffusion at the onset of the pre-treatment process. A sudden drop of 0.37% from its initial value was noticed within a time interval of 39s. This change was reduced by 0.18% as the duration of dynamic torrefaction increased to 10 min. With a further increase in the duration, an increase of 7% was noticed in the diffusion of water vapour across the fixed boundary layer. The characteristics of the diffusion curves for water were found to be similar in pattern, except that a transit mass plateau was noticed in the numerical solution of the dynamic torrefaction for
τ = 15 min. A gradual rise of 1.33% in the mass plateau was observed within the time interval of 200–300 s. A 6.8% rise in the evaporation of water was noticed during the first half interval of torrefaction (from 5 min to 10 min). In the second half, from 10 min to 15 min, it merely increased by 5.8%. The relative drop of 17.24% in water evaporation was estimated in the dynamic state of the system. Relatively speaking, the reduction in evaporation would be 62% less than that in the quasi-static condition. The rate of evaporation increased in the dynamic torrefaction by 24.51% when the biofuel was pre-treated for a duration of 5–10 min. With a further increase in processing time, it would drop by 34.72%. It is clear from this fact that the evaporation of water in both quasi-static and dynamic conditions would have similar attributes, except that the magnitude of the rate of evaporation would be 23% higher in the dynamic torrefaction than in the quasi-static condition. However, the overall removal of water content from the material surface in the quasi-static torrefaction would be around 6.1% to 31% higher than that in the dynamic condition.


