1. Introduction
Most companies with high energy consumption are working continuously to reduce it and have typically completed several energy optimization projects in order to do so. In some cases, energy reduction can be identified but the monetary incitement to execute the project is lacking, which usually means the project will be turned down.
Strategies have been developed that include sharing resources between different actors/industries/companies. The resources can vary from energy, raw-materials, by-products as well as services and personnel [
1]. One thing to consider when sharing resources is the question of how to share the profit. Cooperation does not by default generate profit for all actors, as can be seen in the example in
Figure 1. If all companies act separately the possible profit can be represented by the left part of
Figure 1a, where all actors reach a profit of 1. If, however, the companies cooperate, then the total profit will increase, as represented by the right part of
Figure 1b. From the example we can see that cooperating Company B reduces its profit (0.5 in comparison to 1), even though the total profit of the complete system has increased (3.5 in comparison to 3). In order to make these cooperation solutions work there must be an incentive to participate from all stakeholders. Therefore, in
Figure 1, if all companies were to share the profit equally, all would increase their individual profit and the cooperation would more likely be agreed upon.
This process, where different parties share resources between each other, is known as industrial symbiosis (IS). Usually, the scenario is that one factory/process/company/actor sends their waste products to another factory/process/company/actor that uses this as a resource in their production. There are several known examples of sites in the world that use this principle. The goal of IS is to create a win-win situation for all parties involved [
2,
3].
Circular economy (CE) is another method that has generated interest in recent years. The definition of circular economy has varied and means different things for different people. A common definition was established by reading 114 articles and combining their result [
4]: “An economic system that replaces the “end-of-life” concept with reducing, alternatively reusing, recycling and recovering materials in production/distribution and consumption processes”.
There are several articles describing successful cooperation from around the globe. One example of a successful IS is an industrial district in southern Italy where both finances and environmental savings are quantified [
5]. In Brazil, a case study was performed on an IS to quantify the level of IS and show the benefits for all actors [
6]. In China, industrial parks work with sustainability and symbiosis, and in the Shenyang Economic and Technology Development Zone it has been shown that waste can either be reused or recycled, and even more can be carried out in the future [
7]. There are suggestions for improvements on an already active chemical complex site in Sweden and how the internal heat should be optimally used [
8].
Used correctly, these methods are effective. However, the typical case is set to work within a predefined system, usually one process. In this article, we will show how an energy optimization project can be made profitable by increasing the system borders. Studies have been performed on quantifying the benefits of industrial symbiosis—LCA has been suggested as a method for this [
9]. When the benefit of the cooperation has been defined, the next step is to decide how the profit of the cooperation is to be shared between the stakeholders. Studies have been made in this area where energy companies can cooperate with clients and vendors and in the end make a profitable solution for everyone by cooperating [
10].
One problem when it comes to cooperation is the fact that several individual actors need to cooperate to find the optimal solution, and these actors already have their own goals and agendas [
11]. It is, therefore, imperative to find common goals and make sure that there is an incentive for all actors to join. What can be considered good for one actor can be the opposite for another [
12]. Research has been carried out where the price for waste material was established with the perspective of industrial symbiosis [
13].
Several risks and barriers have been identified when looking at district heating and the use of excess heat. Examples of barriers are cost-competitive heat supply alternatives, policy incentives that push other forms of heat supply, too complex technical solutions, too low energy grade (too low temperature), too costly infrastructure and relations/interactions between the district heating company and the excess heat provider [
14]. One thing that often comes up is the risk of losing the excess heat due to potential closure of the supplying company [
15]. To help the industry overcome barriers, frameworks have been developed. In 2018, Kumari et al. created a framework based on a large questionnaire and statistics with the aim to increase sustainability and gain understanding of the mechanisms.
Local subsystem energy minimization can sometimes cause suboptimizations. We have not found any relevant research work in this field in the literature connected to dynamic modeling. Thus, the research gap is to define how a global system consisting of different actors can improve the minimization by sharing profits. The methodology gives a quantitative result comparison that shows the total potential and how all actors can benefit from it.
This case study focuses on cooperation between three different independent actors that are linked together via a district heating system in the Swedish city of Sundsvall. One paper mill, currently delivering excess heat to the district heating system, one pulp mill, also delivering excess heat to the district heating system, and an incineration boiler that delivers heat to the district heating system. This concept has been described by other researchers. District heating collaborations in Sweden have been investigated through surveys [
16]. A review of the district heating in Sweden has also been conducted in a structured way [
17].
For this specific case, the initiating point was a possible electricity reduction in the paper mill by 50% in the thermomechanical pulping (TMP) part of the process. This assumption is followed up from a previous article describing a potential energy optimization in a TMP process [
18] as well as research that, to a large extent, has led to the implementation of energy efficient TMP technology [
19,
20,
21]. From both a financial and an environmental perspective, this can be interesting. However, the energy applied in the mechanical pulp process produces steam that is later used in the drying process of the paper. A reduction in applied energy reduces the steam produced. This means that steam must be produced in another way, thus, more biofuels must be used in the steam boilers. The result of this is that an energy minimization in one unit process (here, TMP process in a papermill) might not be beneficial for the company. To make this optimization a viable option, we have looked at using high quality energy from an incineration boiler situated in the same city using waste and biomass as fuel to cover up for the steam shortage in the papermill. The incineration boiler produces excess steam multiple times during the year due to the waste having to be disposed all year-round. Furthermore, especially during wintertime, when the district heating load is high, energy still needs to be inserted into the system; this energy does not however, have to be of as high quality as the steam. The chemical pulp mill situated some 15 km from the papermill has a big surplus of energy of lower quality and can, therefore, be a great asset in covering the district heating system during winter. Our main research question was if it would be possible to expand system borders by including the three parties: the TMP-based papermill, the city incineration boiler with the district heating system, and the chemical pulp mill to enable energy efficiency improvements and economic benefits for all parties. We have focused on the quantitative parts of the dynamical modeling in order to optimize from a technical perspective. By using dynamic modeling. Seasonal variations in energy demands are taken into consideration as well as market energy prices. An issue, not addressed in this article, is to find reasonable agreements when it comes to splitting the economic benefits.
2. Materials and Methods
The method consists of five steps:
Define the case;
Define applicable scenarios;
Build a model for the case;
Collect the required data;
Agree on the result with stakeholders.
The case study consists of a three-company coalition connected via a district heating net. The paper mill was the company with the potential to reduce energy consumption by minimizing electricity through modifications in their TMP process but had difficulties doing so from a financial perspective. If we look at the system from a heat delivery point of view, the core consists of an incineration boiler that is used to insert heat into the district heating. Both the paper mill and the pulp mill can deliver heat to the district heating system.
The case study contains three different scenarios:
Reference case (operations as they are prior to introducing any changes);
Electricity reduction case (a reduced electricity consumption by optimization in the paper mill);
Energy substitution case (when the three actors share energy between each other).
The different cases studied have different variables that will affect the outcome (
Table 1). The reference case shows current operations. Combined with case 2 (the electricity reduction), it shows the impact of the electricity compared to the reference. The third case, the energy substitution case (cooperation), shows the total potential if other actors share their energy surplus, which allows the paper mill to not increase fuel to the steam boilers and instead enables electricity minimization. There are more possible cases that could be analyzed, for example, an energy substitution case but with the refiners still consuming 2000 kWh/adt.
A simulation model was built to be able to understand the different actors’ processes and to be able to quantify the energy savings as well as the potential profit from the cooperation—this is a common approach to use in this type of analysis [
22]. This model was fed with data from different sources to resemble reality. The reference case was built first and then the model was validated together with the three different actors, to approve the starting point.
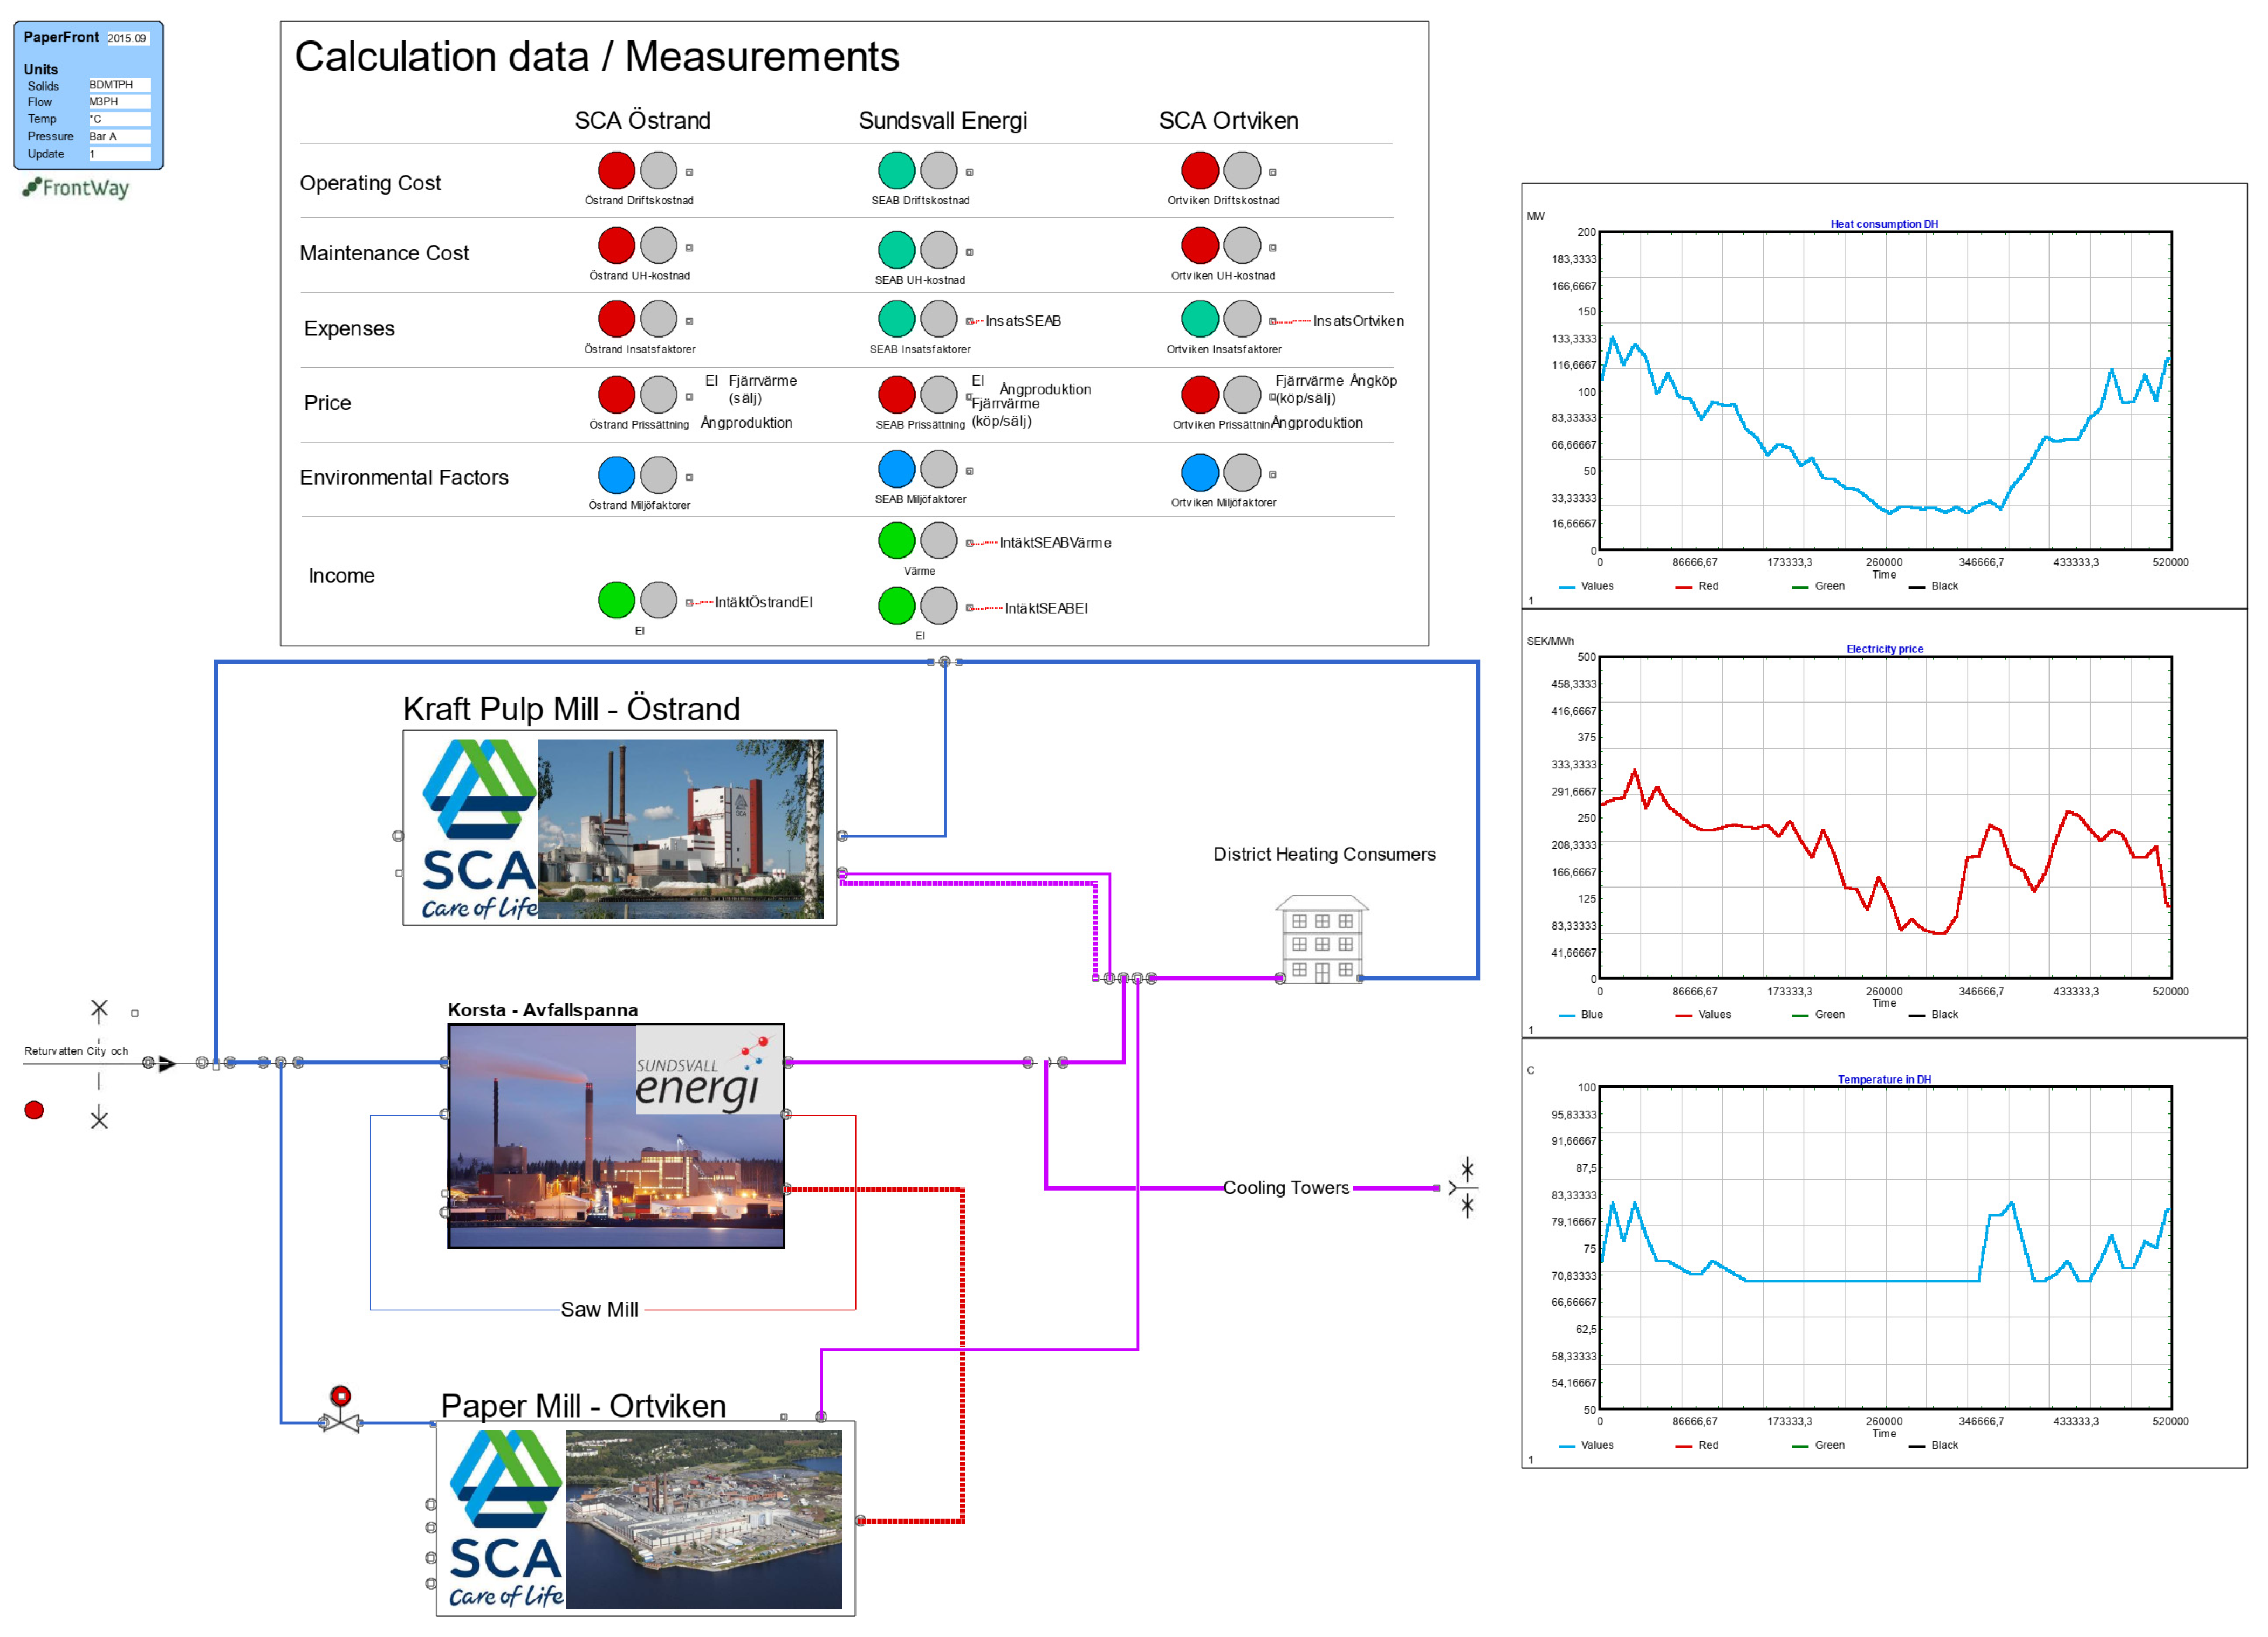
PaperFront
® (PaperFront
® version 2015.09 is a commercial software by FrontWay AB, Norrköping, Sweden available at
www.frontway.se (accessed 29 March 2022)) was selected as the simulation tool and the model contained material and energy balances over the complete system including the kraft pulp mill, mechanical pulp and papermill, incineration boiler, district heating net and heat consumers. This specific system was selected because it presented the possibility to easily and continuously improve and rebuild the calculation to test different alternatives. The standard blocks in the tool are made from a flow sheet standard, which makes it easy to explain how the model is designed to different parties that are not familiar with the simulation tools used in projects like this.
The simulation model built in PaperFront
® describes a continuous process including the dynamics,
Appendix A. PaperFront
® software contains blocks that are connected as a CAD interface. Each block contains settings that resemble the different process steps. From the model, material and energy balances are retrieved that are used to evaluate the different cases. For this model, as a dynamic model, it means that the heat demand and prices change over the year and the data used was from 2015. The timestep size used in the model was per hour. The yearly total is later summarized and presented—both financial profit and consumption numbers. As a timestep, a resolution of hours was used in the model. A minute timestep was also evaluated but did not show significant differences in the result, less than 1%, but the calculation time increased by approximately 20 times. The model was validated by comparing calculated results with mill data together with data from the different actors within the cooperation.
The recognition factor of a dynamic simulation model is advantageous compared to a static simulation model when it comes to sharing the results since it makes it easier to explain what is happening in the different parts of the model. The reason for this is that a dynamic simulation model resembles the real world and materials that are normally used.
Expenses (Input/consumption):
Incineration fuel;
Biofuel;
Electricity.
Income (Output/delivery):
District heating;
Waste treatment;
Electricity delivery.
To find a way to make the cases comparable, an operating margin (OM) for each case were output from the simulation. The OM was calculated by summarizing all the income and subtracting the summary of all input variables. The incineration fuel was excluded from the calculation since its effect would be the same for all cases:
The benefit of the case is presented by using the OM and removing the OM from the refence case to show the potential of the current situation.
where B is Benefit
There are two main CO2 sources that will be included in the calculation. The most important source is the CO2 reduction that originates from the 50% electricity reduction. The other is the change in CO2 that originates from the boilers fed with biofuel.
The electricity reduction has been identified as 500 GWh/year. Statistics from EEA [
23] states that approximately 250 g CO
2 eq/kWh leads to:
When looking at the fuel consumption, the electricity reduction scenario consumes 234 GWh/year more than the reference case. The energy substitution scenario consumes 128 GWh/year less fuel than the reference case.
We can assume that the heat value of the biofuel is 2500 kJ/kg fuel, which means that 93.6 t of fuel/year needs to be added to the electricity reduction case, and 51.2 t of fuel/year can be reduced in the energy substitution case.
Looking at the fuel composition it can be assumed that 75% is cellulose or hemi cellulose and 25% lignin. To convert the kg of fuel into mol we need to define the molar weight of each component (
Table 2):
The mass of the fuel is then converted into mol by the following formula:
where
m = mass
MW = molar weight
With unit conversions, the formulas are:
By looking at the photosynthesis with a focus on cellulose, a simplified way to look at the reaction can be:
For lignin, the reaction is:
This tells us that 1 mol C
6H
12O
6 corresponds to 6 mol CO
2 and 1 mol C
10H
12O
3 corresponds to 10 mol CO
2:
Finally, convert the mol back to mass:
3. Results
When all three cases were evaluated after the completion of the simulation calculations, it was shown that the cooperation case, where the incineration boiler connected to the district heating system and the two different mills worked together, was more profitable compared to the current state and the reduced energy consumption case.
The financial summary is generated by following the operating margin (OM) over the year. Two cases (electricity reduction and energy substitution) are compared by looking at the current case subtracted by the reference case. The profitability of each suggestion can be seen in
Figure 2. Worth noting is that during parts of the summer, the electricity reduction case is a worse choice than the reference case when looking at the economics.
The potential profit of the two cases is:
By looking at the definition of the different methods described in the introduction, a part of IS or CE is to optimize the process and make use of as many resources as possible. In this project, it was found that the energy per year inserted in the system can be decreased by cooperation and this is also a main part of the potential profit. Less fuel in different forms needs to be used and the mills will still produce the same end product with the same production speed.
When investigating the fuel consumption of the different cases in comparison with the reference case, we can see that the fuel consumption increases for the electricity case. This is related to the steam requirement in the dryers of the paper machine. If less steam is generated in the refiners, the shortage must be produced and, in this case, the only viable option is in the steam boilers. However, when cooperating, the steam can be sent from the incineration boiler, which will reduce the total fuel consumption.
The fuel consumption is increased in the electricity reduction case since less steam is generated in the refiners and must be produced in the steam boilers. For the energy substitution case, the total fuel consumption decreases since the energy that is normally cooled off from the incineration boiler during summer can now be used (
Figure 3).
In the scope of the project, it is mentioned that the electricity consumption in the refiners is cut by 50%.
Figure 4 shows the yearly consumption for each case.
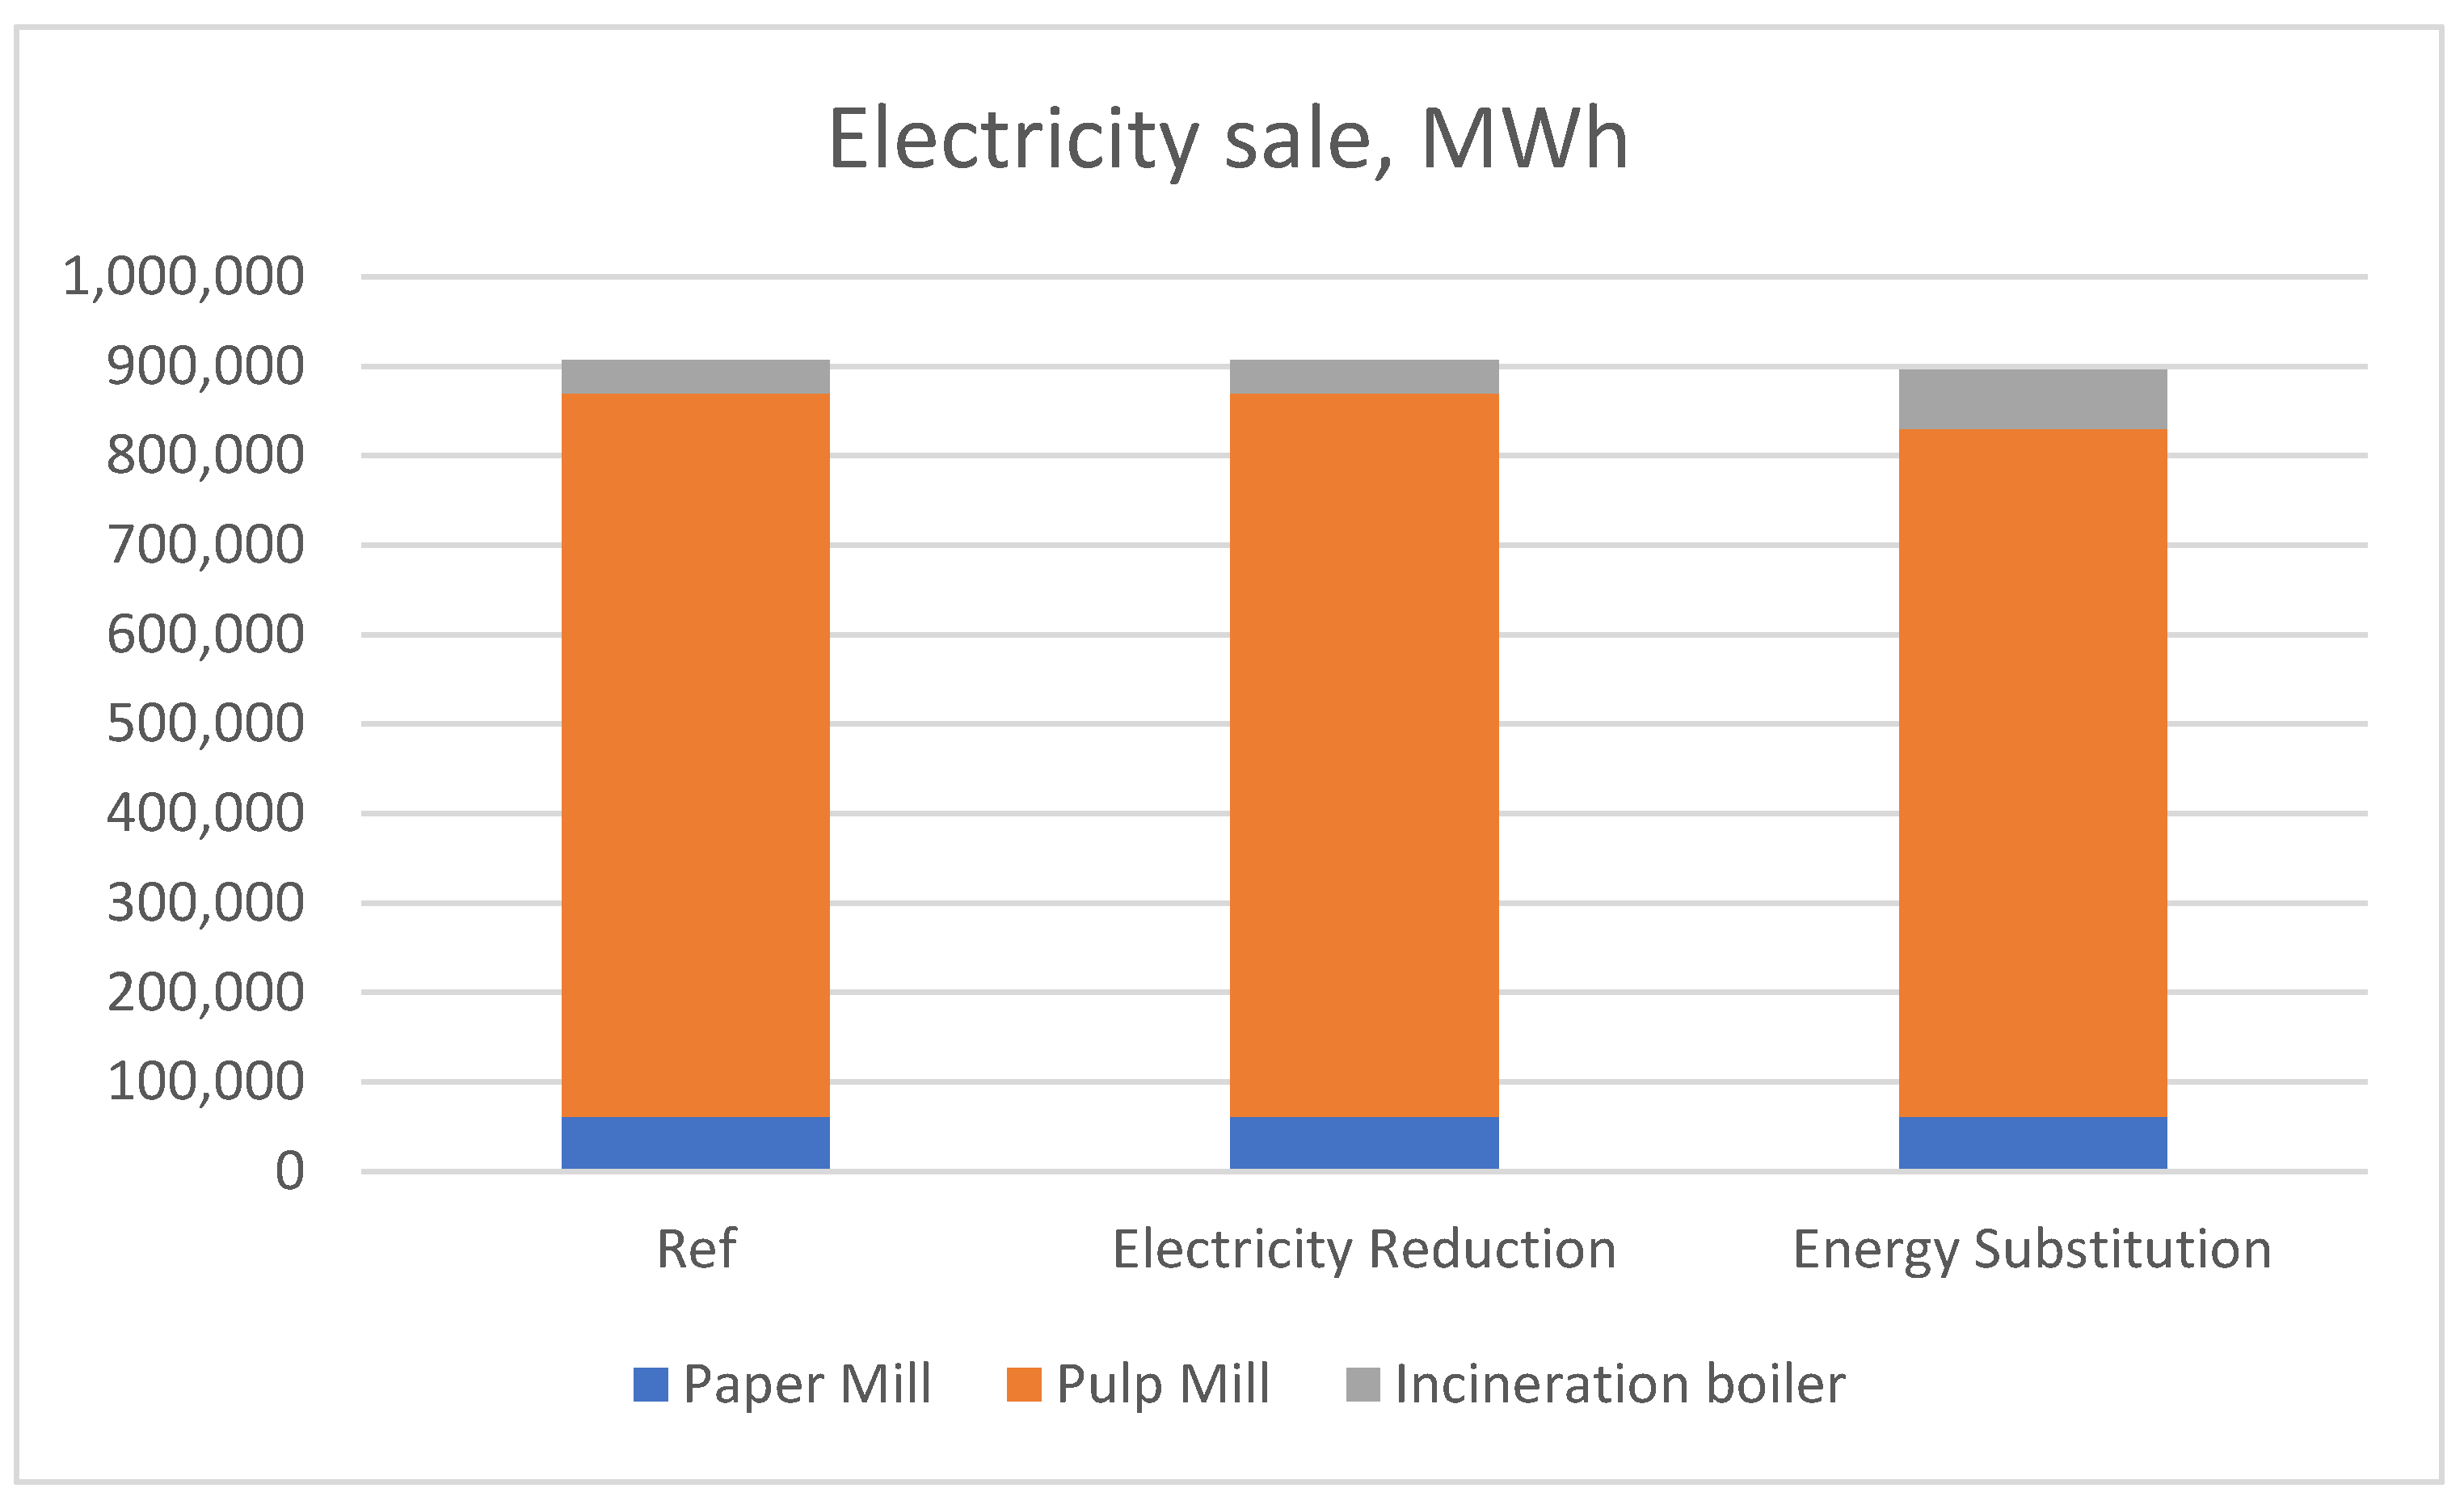
The possibility to sell power (electricity) is an extra income for the mills and energy company. For the pulp mill to cover the required heat in the district heating system in the energy substitution case, less power can be sold (
Figure 5).
In terms of environmental effect of the cooperation, CO2 reductions have been investigated. There are two main areas that will reduce the CO2-generation, the electricity savings in the paper mill and the total fuel consumption reduction that is achieved by cooperating.
CO2 reduction from the potential electricity reduction is 125,000 t CO2/year (regardless of if we are looking at the electricity reduction scenario or the energy substitution case). The addition or reduction in CO2 from the fuel consumption compared to reference case is:
This corresponds to a total CO2-reduction of:
Electricity reduction 124,840 t/year
Energy substitution 125,088 t/year
To put this value into perspective, 125,000 t/year CO
2 equals to driving 27,185 regular cars for one year (
www.epa.gov accessed on 27 March 2022).
4. Discussion
This research project shows that, by expanding the system borders, each actor gets a new role in the system. The energy company is now supplying energy of high quality to the paper mill, while the paper mill and the pulp mill supply energy of lower quality into the district heating when needed.
When the steam from the incineration boiler is sent to the paper mill, the pressure is reduced by running it through a turbine, which will generate electricity. An alternative, that was not evaluated, is running the steam through reduction stations, which will produce more steam by inserting extra water. The main question will come back to whether the electricity price or fuel price is most beneficial at that time.
As mentioned in the methods chapter, simulation was selected because of benefits such as dynamics and being easy to explain and modify. One thing that has not been mentioned, is the possibility to add non-linear equations into the calculation. In short, it is an excellent way to explain reality in a mathematical form. To get the same result without a simulation tool would probably require another approach to the questions and a steady state calculation. This calculation could be divided into four scenarios: summer, winter, spring and autumn. From these cases, an average estimate is required to divide the year into appropriate segments.
We have evaluated different timesteps in the simulation and found that with the degree of detail made possible there were no benefits of using a timestep size in minutes for the calculation, in contrast to hours. The time to execute the calculation increased, and the result did not provide a more accurate result. This is most likely related to the simplifications made in the model generating larger deviations than the timestep.
The method developed is created to be re-used and the results from this research indicates that it is very useful. However, it can most likely be improved and made more effective by analyzing the work process.
In this research project the total profit is defined, but what is not included, and is interesting, is how the profit should be shared between the different stakeholders and why. This would most likely require a more qualitative research approach and there are many factors that will affect the result. Issues such as input vs outcome from the separate actors will likely weigh heavy in the discussions, and issues such as politics and psychology will matter, too. The level of trust between the stakeholders will also have an impact on the share of the split.
It is worth noting, that in Sweden, there is no carbon tax when using biofuels, which is common in the industry. This means that the potential is even higher in other countries where fossil fuels are used. CO2-reduction also means a lower carbon tax.
The model itself provides a good base to start negotiations since it quantifies the profit based on real data (that the stakeholders have shared). It also prevents ideas that are not fact-based from being included in the discussion. Hopefully, this also helps to prevent parties from feeling cheated after the negotiation.
Future work, in addition to profit sharing, includes replacing one of the actors in the model with a new actor, or to add another stakeholder to the current model. Moreover, with a cost and profit split between the actors, the model can use new data to follow-up in real time, which is useful in times with significant and quick changes in energy prices.
As a final note, the potential profit calculated with 2021 electricity prices shows a potential profit of 28 M€/year. Thus, the potential of this type of work in finding solutions to minimize energy consumption by sharing resources has increased over the last couple of years in which energy prices have increased.
5. Conclusions and Implications
The study shows that by expanding the system borders and initiating a cooperation, the potential of a greater profit;
Process simulation is an effective tool to handle dynamics and non-linear correlations which helps to analyze a complete system over a period of time;
Different actors in the system can be added or replaced but the output will differ;
An implication discovered is the profit sharing between the stakeholders;
With present fast changes in energy prices, it is easy with this tool to follow-up cause and consequences.


