1. Introduction
Anaerobic digestate is the byproduct of biogas production through anaerobic digestion (AD) of the organic matter. Broadly speaking, AD is a waste valorization technology that has the simultaneous purposes of recovering energy while treating the waste before disposal or land application as soil amendment [
1]. The easiest way of modeling anaerobic digestion is with the use of an unstructured unsegregated model. A model is considered unstructured if it does not involve the metabolism of the microorganism, and it is regarded as unsegregated if there is no differentiation between the species that are degrading the biomass [
2]. First-order kinetics have been traditionally the most widely used for the modeling of substrate consumption and biogas release during AD [
2,
3,
4]. This lumping approach has limitations, as, recently, a new approach (i.e., combining the first-order kinetic model and the Gamma distribution function) has been applied to elucidate that the so-called kinetic constants are not constant during the whole AD [
5]. Acetic acid is synthesized in the penultimate stage of AD (known as acetogenesis) and is the simplest fermentable substrate for the production of biogas, as described in Equation (1). In the area of wastewater treatment, where AD has wide application for the treatment of sewage sludge, the concentration of substrates is expressed as Chemical Oxygen Demand (COD) because this generalization allows the use of the same concentration units for different organic pollutants. Thereby, the reaction of biogas production can be further generalized as illustrated in Equation (2), taking into account that the COD of 1 g of CH
3COOH is 1.6 g of O
2, (following the stoichiometry of Equation (3)). It is important to mention that the biogas composition still depends on the type of substrate and, in the case of acetic acid, it corresponds to equal moles of CH
4 and CO
2 being produced (Equation (1)). The general relation between the consumption of substrate and the production of biogas corresponds to Equations (4) and (5). In order to model the production of biogas, it is necessary to introduce the theoretical yield or conversion coefficient of COD to biogas (α). Once again, α depends on the initial substrate and the biogas composition.
being
It has been suggested that the basis of COD be replaced by volatile solids (VS), particularly at the time of conducting the biochemical methane potential (BMP) test with other residues different from wastewater, such as solid organic wastes and energy crops, because the determination of COD in solid heterogeneous substrates is difficult and open to uncertainty [
6]. Since expressing the biogas production as mL/g VS is even a more general approach than the use of the COD basis, it is not possible to calculate analytically the theoretical yield of biogas in these units because the stoichiometric relation of these parameters needs to be determined empirically with a BMP test. According to the British regulation BSI PAS 110:2014 [
7], the threshold value of stability of the anaerobic digestate is 450 mL/g VS. This means that the biogas released in the Residual Biogas Potential (RBP) test (i.e., following a particular protocol to conduct the BMP test) should not be greater than that upper limit by the end of the 28-day anaerobic assay, in order to allow the organic manure to be applied to land:
The concentration of volatile fatty acids (VFA) in a sample may be determined ahead of an RBP test, by means of gas chromatography. If a digestate sample’s VFA result exceeds 0.774 g COD/g VS, this might indicate that the sample will fail a subsequent RBP test [
7]. It should be noted that initially tighter upper limits were proposed, both for the pre-screening of the anaerobic digestate samples (0.43 g COD/g VS) and for the RBP value (250 mL biogas/g VS) [
8]. In a revision of the protocol, Banks et al. [
9] suggested that reducing the incubation from 28 days to 10 days might be possible considering a threshold value of 200 mL biogas/g VS [
9]. The early parameter estimation (of the kinetic constant and the biogas yield) is much appreciated by companies and plant operators whose decision-making processes cannot be held for the whole BMP test, which could run over 100 days [
10]. In fact, the reason for all these adaptations of BMP/RBP protocols is to enable their widest application by the stakeholders of the agroindustry, in the simplest manner possible. This standardization pretends a better management of the organic waste: preventing the putrefaction of the organic sludge after land application and reducing the emissions of greenhouse gases. However, this explanation of AD in layman’s terms should not hinder the scientific community from using rigorous computational methods for further understanding the underlying biochemistry of the anaerobic fermentation, improving the design of the bioreactors, and assessing the technical feasibility of other operations around the AD plant. Similarly, taking advantage of the meticulous property and thermodynamic calculations supported by commercial packages for process engineering, such as Aspen Plus
® [
11], could also offer a better understanding of the AD process and enhance the monitoring of the upstream, mainstream, and downstream operations [
12,
13]. Particularly, this would allow the performance at the industrial-scale plant level to be analyzed, by following closely the interactions of the atomic elements and molecules of the feedstocks, during all processing steps.
The appraisal of novel processing conditions, such as the biomass ash-based treatment of the anaerobic digestate [
14], is much more justified by the use of the Aspen Plus
® simulation package, which allows a wide range of parameters to be specified. The biomass ash-based treatment of the anaerobic digestate aims to improve the properties of the organic material as a slow-release fertilizer, due to the sorption processes taking place. Advances in this technology should continue until reaching a high efficiency in the solid–liquid separation, given the high moisture content of the anaerobic digestate (95 wt.%) [
15], the large quantities produced of this material (30,000 tonnes per year and per AD plant), and the cost of storage, transportation, and land application (GBP 10/tonne for a 10-mile delivery) [
16]. The present article informs about the development of the process simulation model (PSM) of Rajendran et al. [
11] in Aspen Plus
® to monitor the biogas production and the valorization of anaerobic digestate by means of biomass ash-based treatment [
14]. An assessment of the synergistic approaches that could reduce the cost of processing and handling the anaerobic digestate, aims to increase the viability of the treatment of anaerobic digestate and promote an overall enhancement of the circular economy [
1]. The Aspen Plus
® model that has been developed for simulating the conditions of the stabilization of the anaerobic digestate via ash-based treatment and the concentration profiles of the WS fraction of the digestate and the upgraded biogas were compared to the experimental findings and data from the literature. Therefore, the results of implementing upstream and downstream operations in the commercial package are presented, with emphasis on stabilizing the anaerobic digestate, upgrading the biogas, and producing a stream of CO
2 and NH
3 suitable for the manufacturing of ammonium bicarbonate (NH
4HCO
3).
2. Materials and Methods
The model that Rajendran et al. [
11] made available was used as the base to build the PSM (
Figure 1). It is regarded as a library model because 46 reactions were implemented in Aspen Plus
® v10, some of them with the use of FORTRAN programming language [
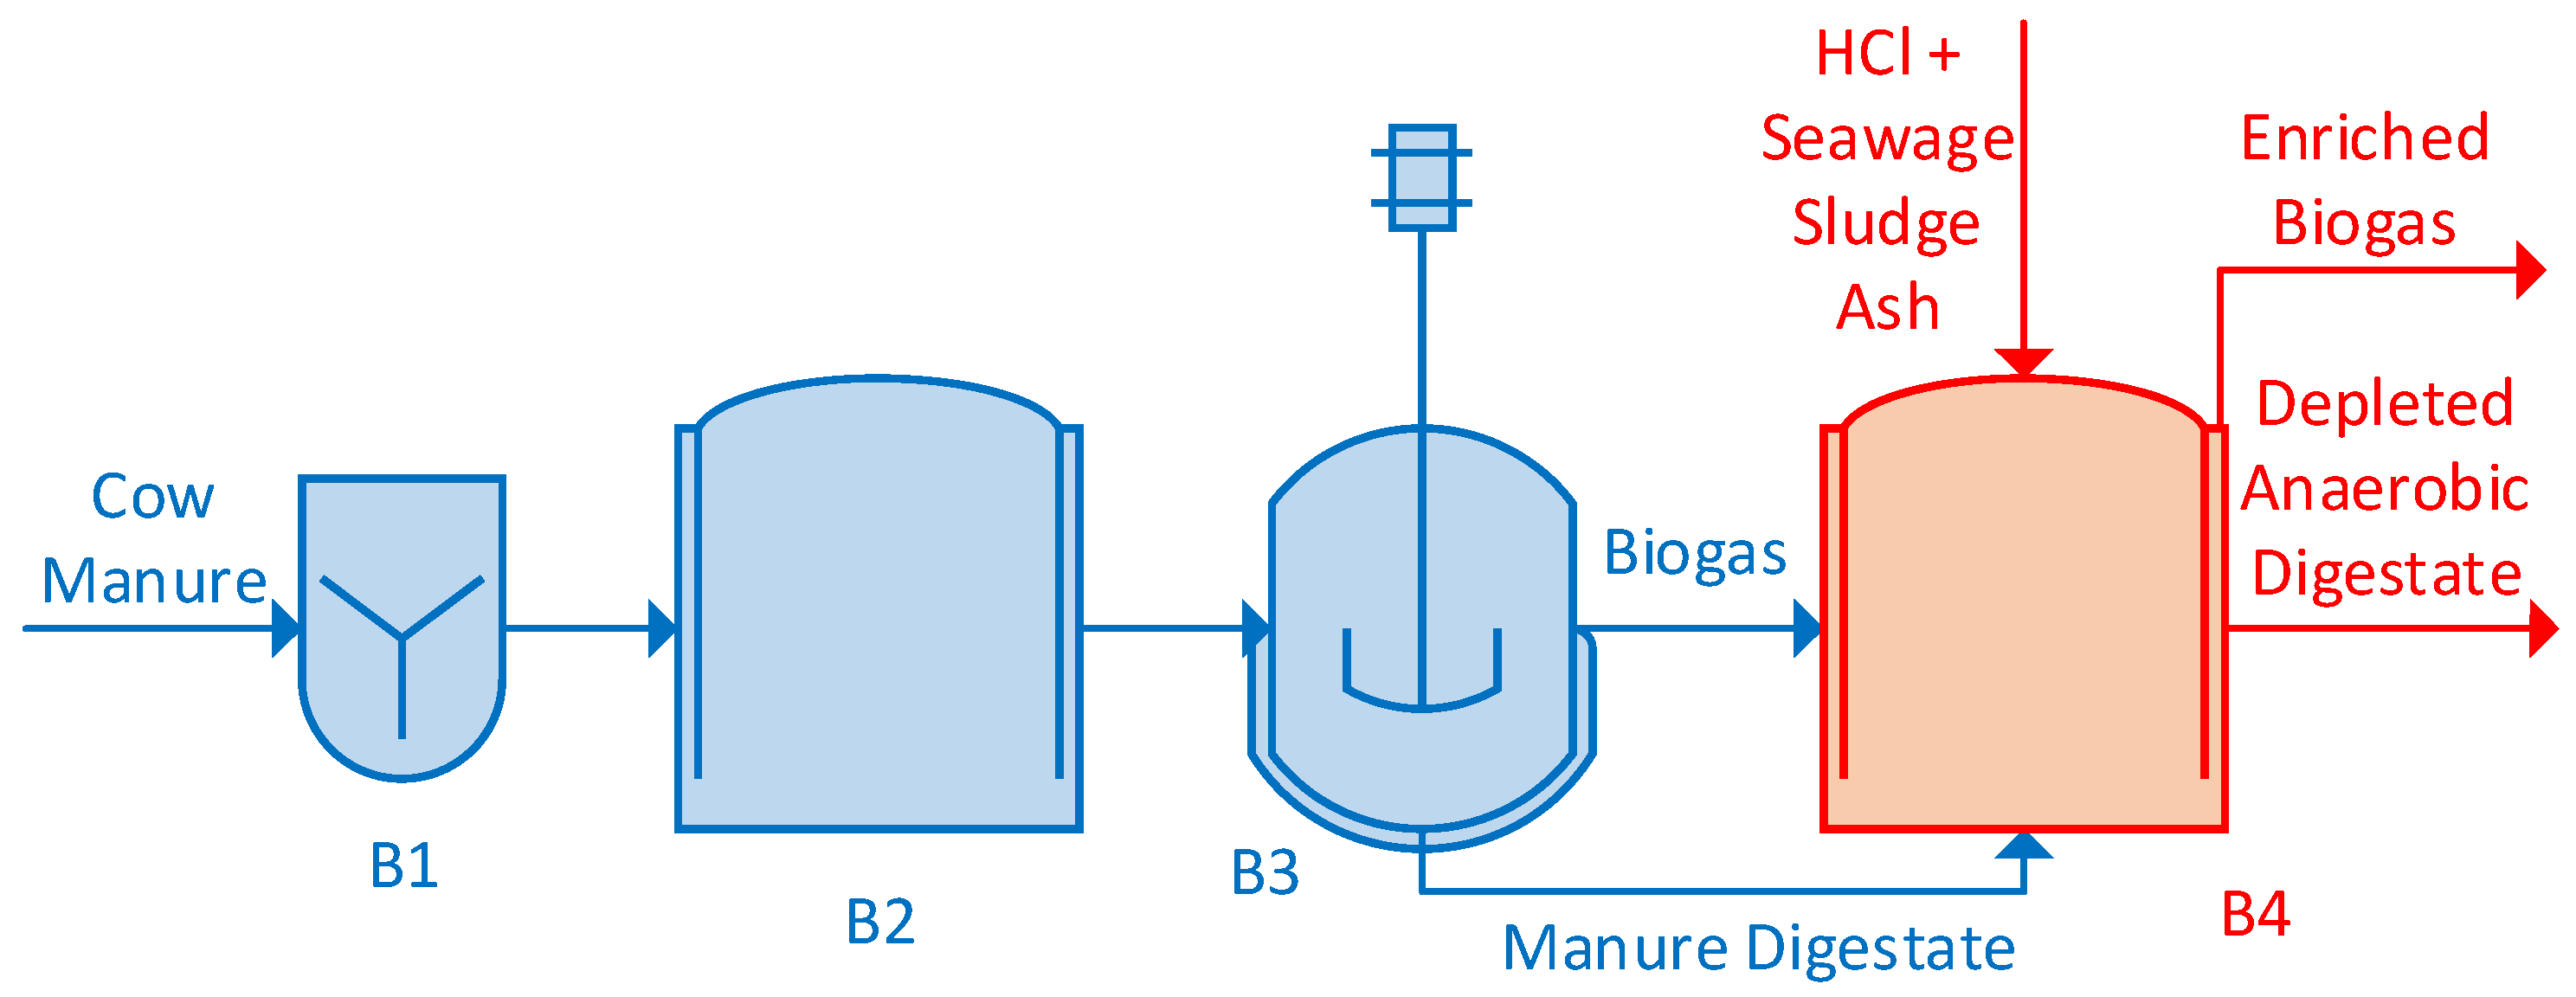
11]. The AD was represented by a two-stage process comprising a stoichiometric-equilibria reactor (B2) for the hydrolysis of the molecules of the substrate and a kinetic reactor (B3) involving the stages of acidogenesis, acetogenesis, and methanogenesis. The utilization of the model of Rajendran et al. [
11] already represents an improvement with respect to the use of Anaerobic Digestion Model No 1 [
17] because the latter is a lumping model while the former is a structure-based model (i.e., molecule-by-molecule), which gives greater insight that cannot be seen with the lumping approach. The model of Rajendran et al. [
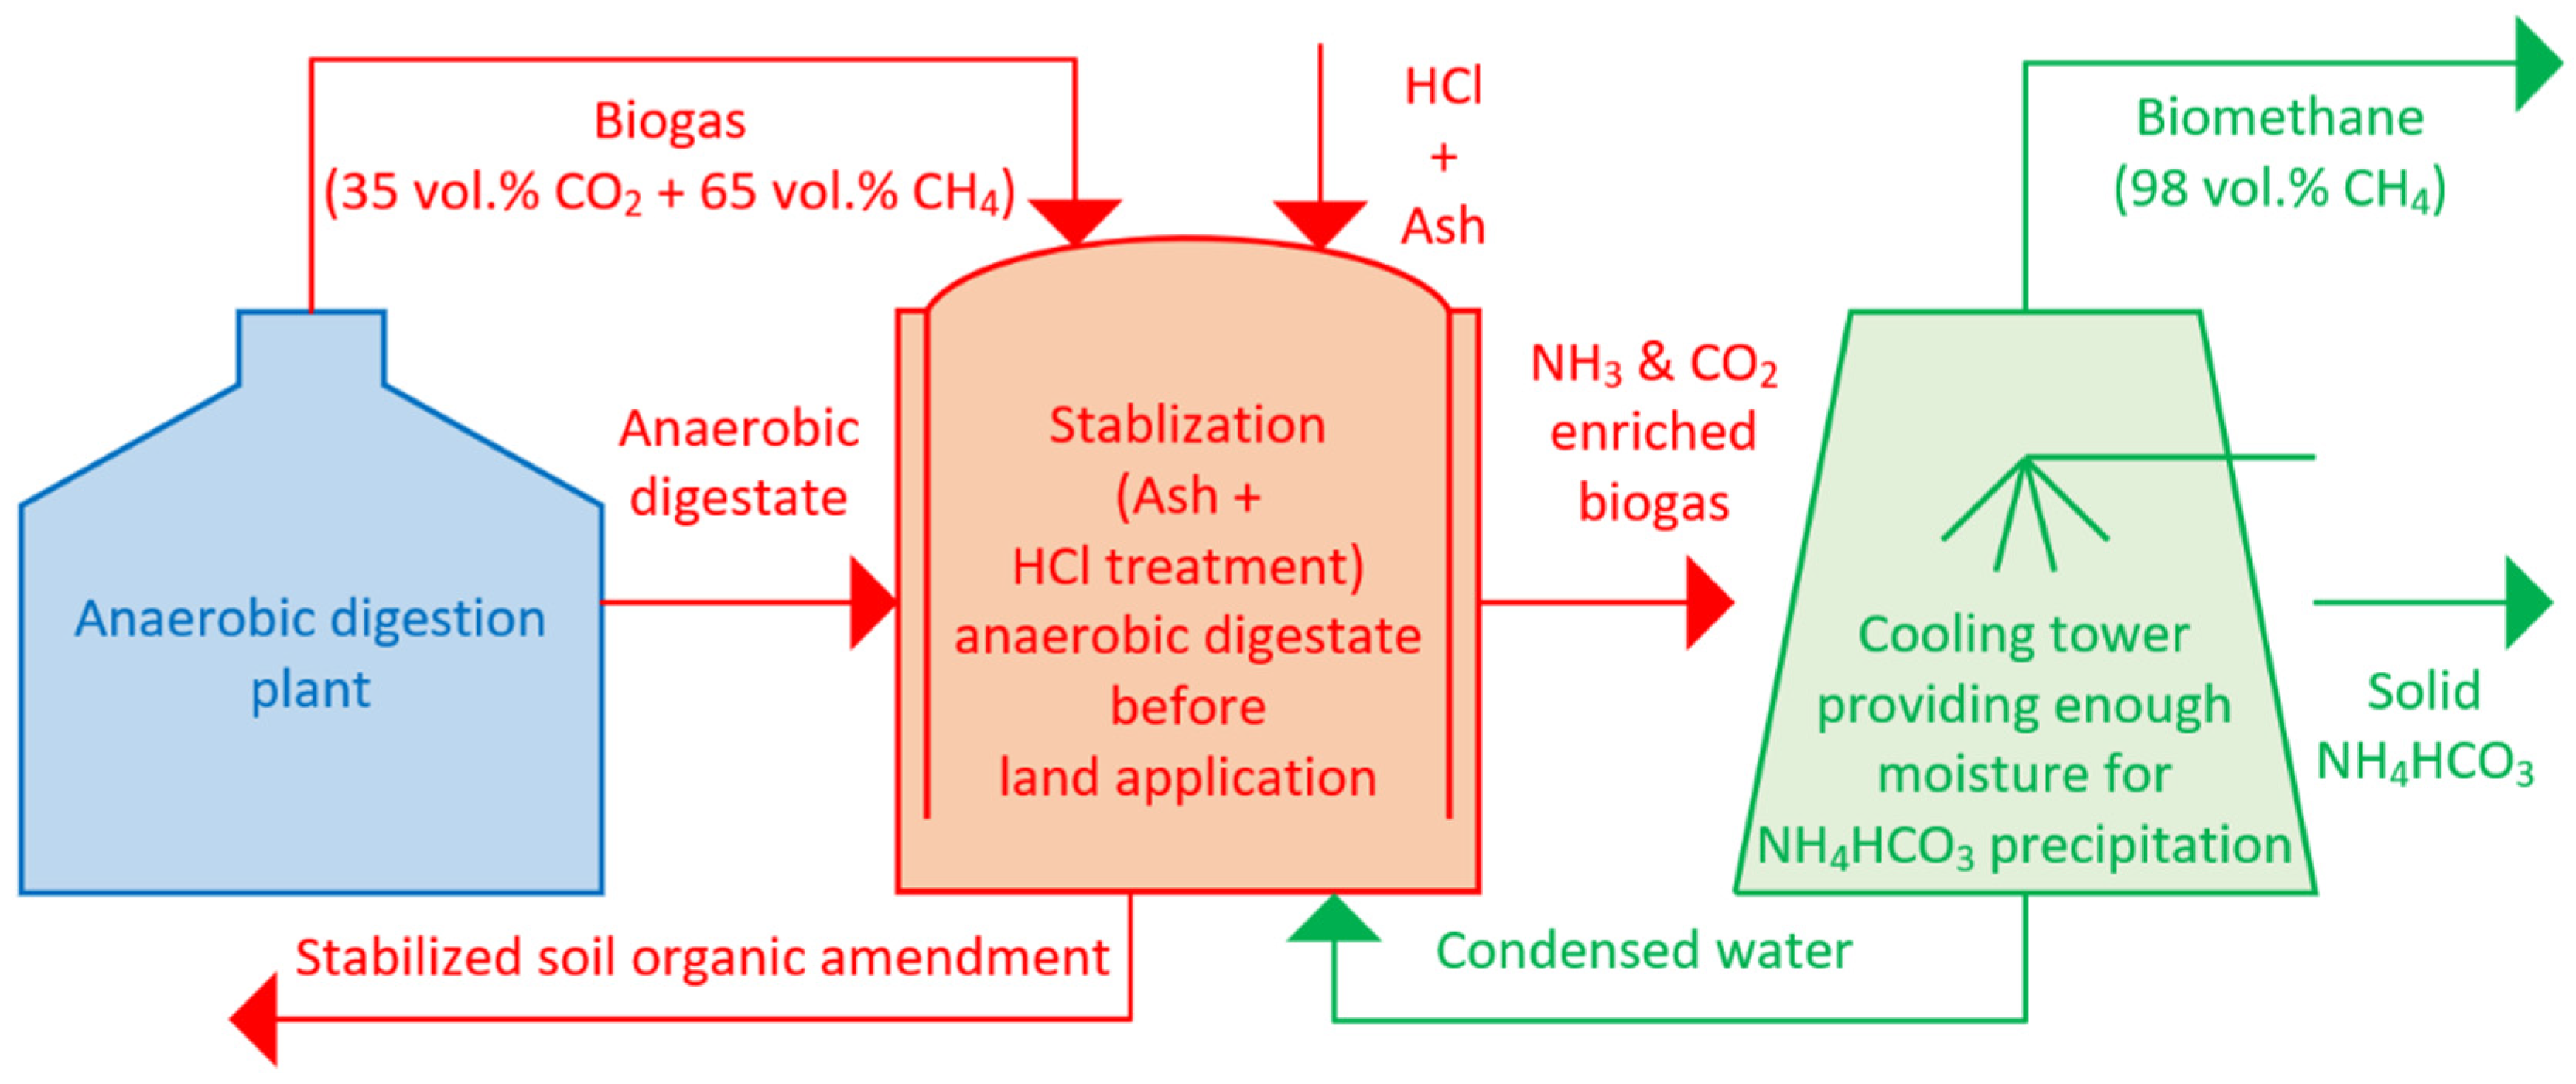
11] offers accurate predictions of biogas production under the testing conditions in which it has been designed. However, the chemistry of the anaerobic digestate has been neglected and it is necessary to include an ionization reactor for simple characterization purposes (e.g., determination of the pH of the anaerobic digestate) and to be able to build the subsequent downstream steps. For the modeling of the biomass ash-based treatment, the streams of HCl, sewage sludge ash (SSA), and manure digestate (MD) were mixed in an ionization reactor (B4) in which the rate of mass transfer and the dissociation of the compounds present in the gas, liquid, and solid phases were implemented (
Figure 1). The calculation block B4 can be further justified by the need of stripping the CO
2 and NH
3 off the anaerobic digestate for the NH
4HCO
3 manufacturing process described by Wang et al. [
18]. A theoretical analysis of this downstream synthesis operation is included in the discussion section; although, this needs to be confirmed experimentally. Several challenges are expected, such as the fact that using biogas as stripping agent is less efficient than the use of biomethane (>98 vol.% CH
4) for that purpose [
19]. On the other hand, the minimization of the requirements of energy and resources for the manufacturing of the NH
4HCO
3 is in line with the outcomes of the techno-economic assessments of Drapanauskaite et al. [
20] and Centorcelli et al. [
21], who simulated the preparation of the inorganic fertilizer as part of distillation processes.
The stoichiometric-equilibria reactor (B4) was ruled by the instantaneous equilibrium of gas, liquid, and solid phases. For this purpose, it was necessary to assume a Damköhler number (i.e., reaction rate/mass flow rate) greater than 100 [
22] and chemical reactions involving compounds in the same phase (either liquid, gas, or both), which would not be limited by the rates of chemical kinetics and mass transfer between the phases. The Electrolytes Wizard function of Aspen Plus
® was applied to correlate some of the ionic species in the liquid phase with the temperature (Equation (6)). The parameters A, B, C, and D of Equation (6), where the equilibrium constants (K
eq) are the subject, were derived from either Aspen Plus
® Components Databank (
Table A1) or the literature (
Table A2). Particularly, the Electrolytes Wizard does not include the acidic dissociation of amino acids and other organic compounds present in the anaerobic digestate as per the original PSM of Rajendran et al. [
11] and some of these compounds would need to be added manually. The original PSM only considers the conversion of amino acids to acetic acid and the dissociation of the remaining amino acid molecules that were not converted to biogas was not taken into account. In order to successfully implement the ionization reactor in the Aspen Plus
® model, it was necessary to estimate the properties of the system characterizing the blending of the MD and the SSA, such as the critical temperature and the heat of vaporization. The property method model used in this simulation was the Non-Random Two-Liquid model. The Aspen Plus
® Components Databanks provided most of the properties for the components of the system, and when this information was not available, the parameters were determined with the method developed by Joback and Reid [
23] and the R-PCER method. The ideal gas heat capacity for the components present in the system was calculated with the Aspen Ideal Gas Heat Capacity Polynomial Equation, while the Heat of vaporization was calculated with Watson’s correlation [
24].
The mixer (i.e., B1 in
Figure 1) was employed to merge the composition of multiple feedstock streams and to consider the impact of the SSA on the AD of cow manure (
Table 1). In fact, Rajendran et al. [
11] initially included this calculation block to appraise the co-digestion of several substrates. The present investigation considered the SSA (
Table 2) with the greatest phosphorus content reported by Franz [
25], which was obtained over the co-combustion of 85 wt.% sewage sludge and 15 wt.% phosphate-rich bone meal as fuel. It is important to mention that the consideration of the SSA as one of the input streams of the blender (i.e., calculation block B1 in
Figure 1) did not affect the AD process because the subsequent calculation blocks B2 and B3 (
Figure 1), which were originally developed by Rajendran et al. [
11], did not included the effect of the inorganic elements of
Table 1. In the present work, the ash-based treatment of the anaerobic digestate was completed by combining the acidification with a second dose of ash in the downstream ionization reactor (B4). The purpose was to balance the stability granted by the isoelectric point of the anaerobic digestate [
26,
27] and the pH of zero-point charge (pH
zpc) of the wood ash [
28].
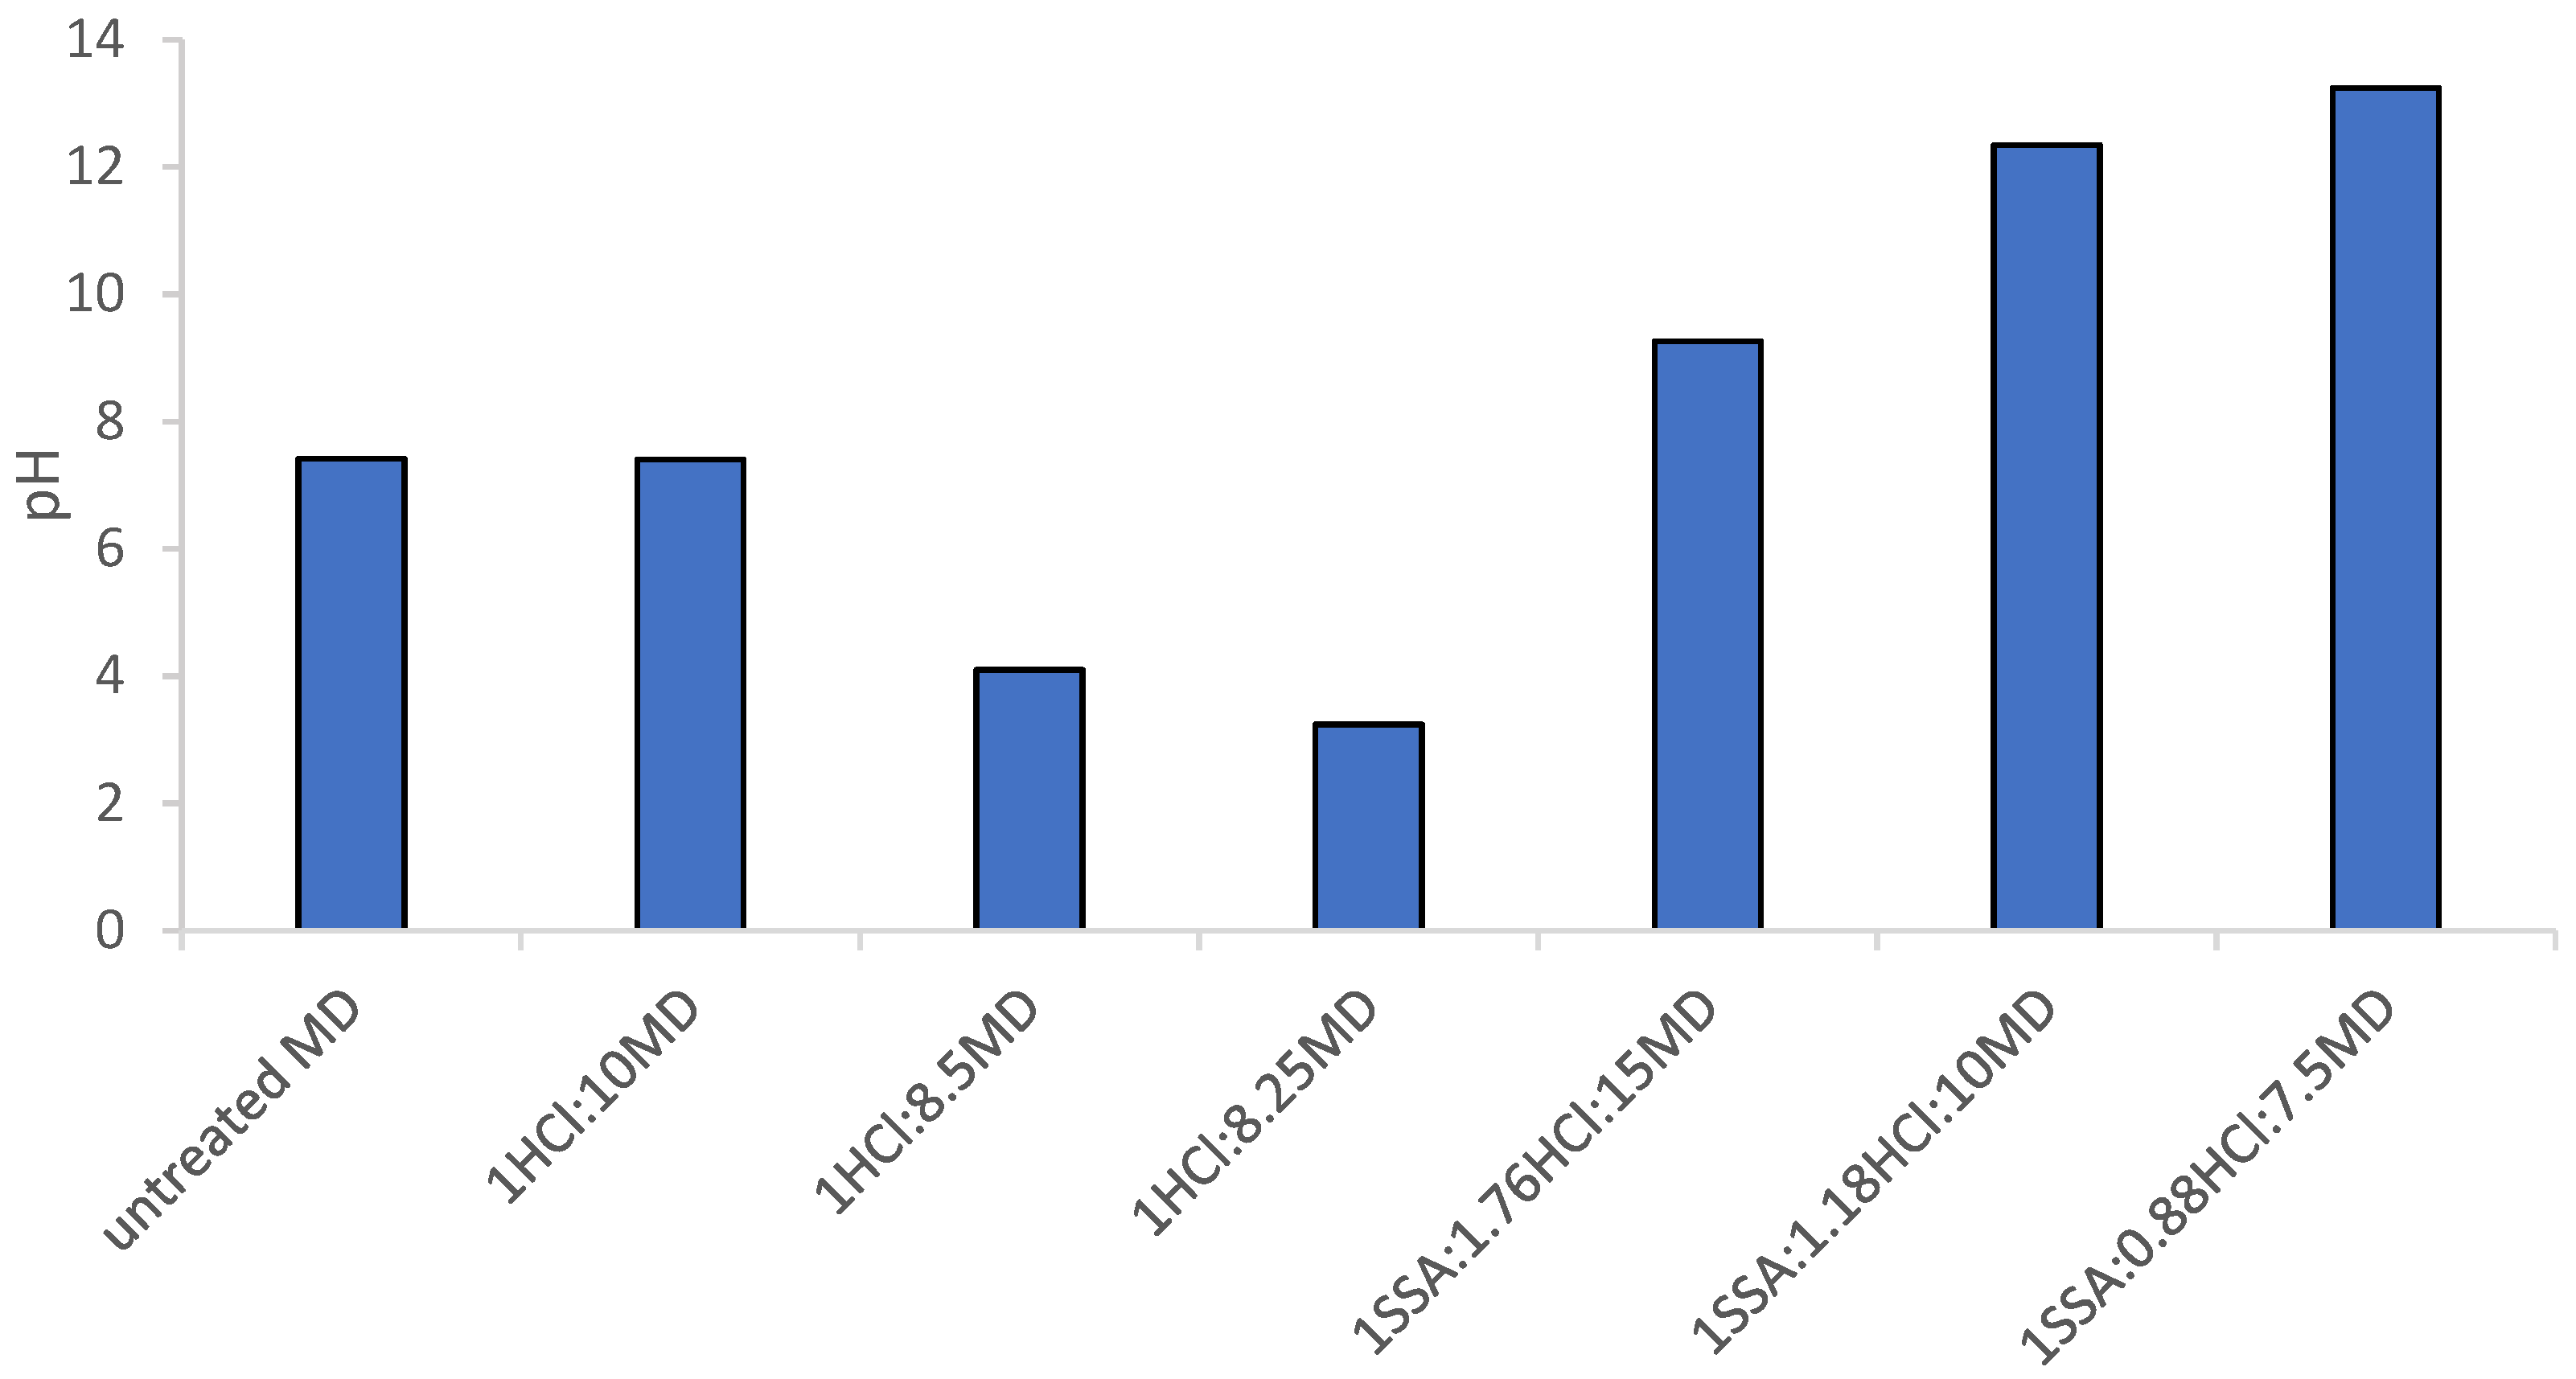
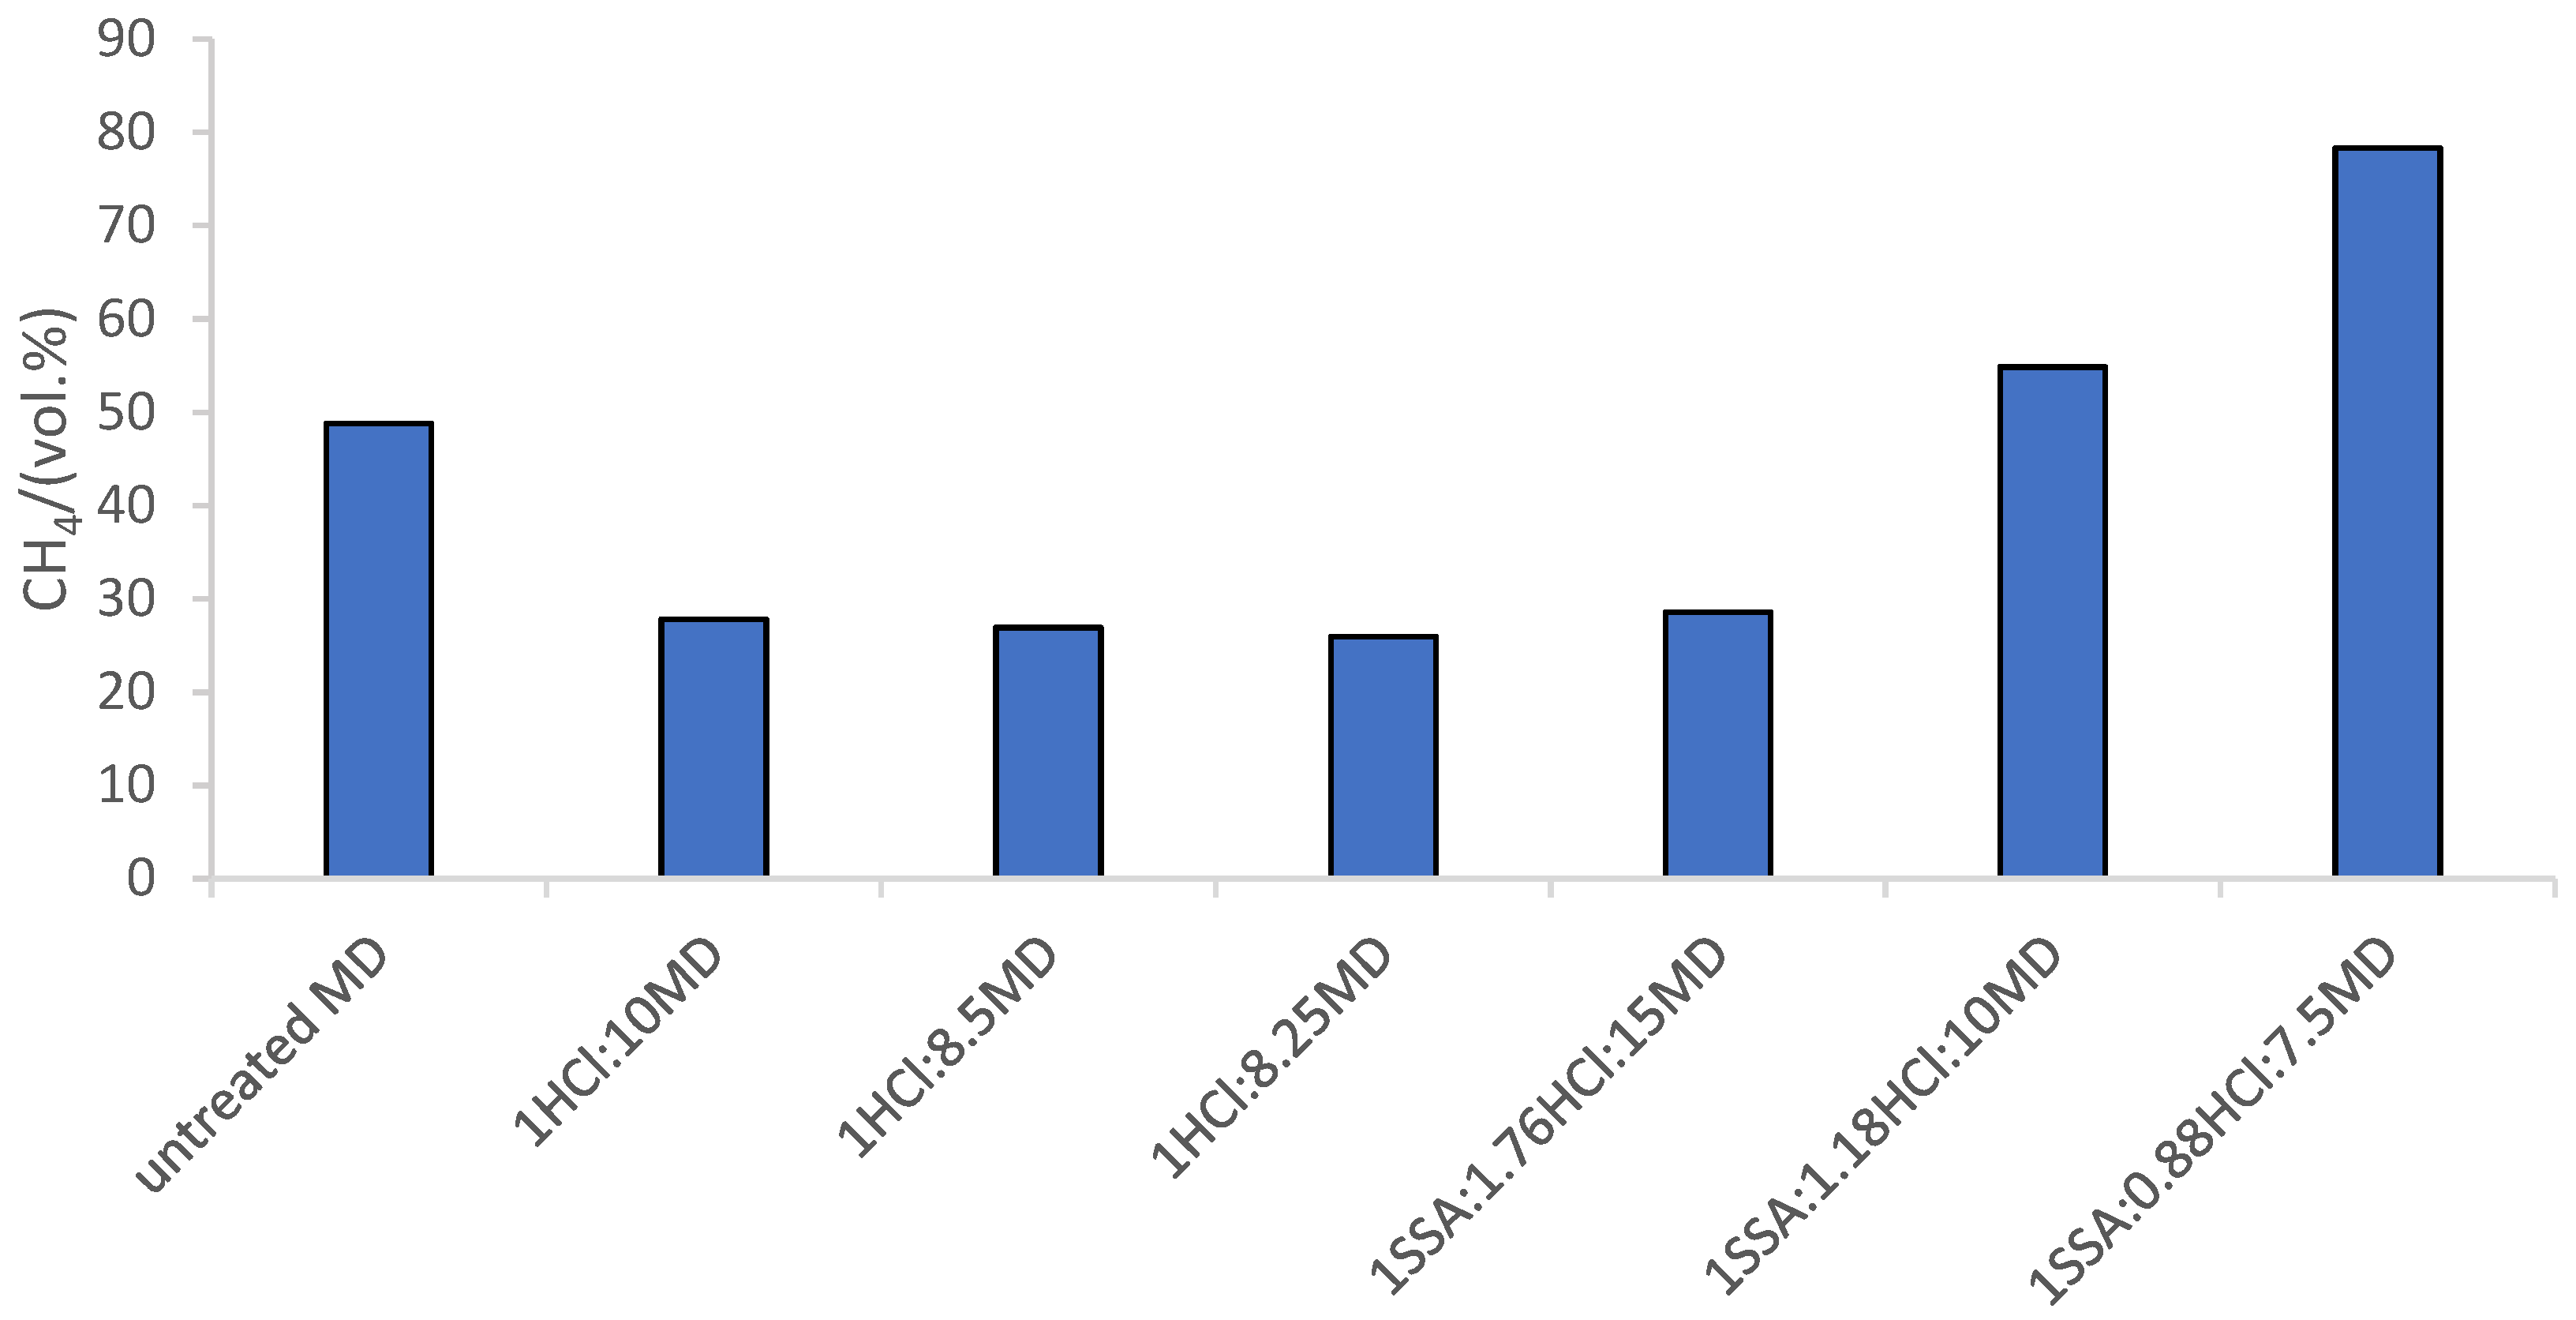
The results reported in this article correspond to 7 different process strategies: Case 1 is the foundation case (labeled as untreated MD) that served as a benchmark and it implied the production of MD using the original PSM of Rajendran et al. [
11]. In Case 2, a stream of pure hydrochloric acid was incorporated at 0.1000 times the flowrate of the MD toward the ionization reactor (1HCl:10MD). In Case 3, a stream of hydrochloric acid was incorporated at 0.1176 times the flowrate of the MD towards the stoichiometric-equilibria reactor (1HCl:8.5MD). In Case 4, a stream of hydrochloric acid was incorporated at 0.1212 times the flowrate of the MD toward the ionization reactor (1HCl:8.25MD). The remaining 3 cases are built on Case 3 (i.e., considering the previous acidification of the MD with the dose of 3.18 mEq HCl/g). In this way, in Case 5, the stream of SSA (
Table 1) was incorporated at 0.0040 times the flowrate of the MD towards the stoichiometric-equilibria reactor (1SSA:1.76HCl:15MD). In Case 6, the stream of ash (
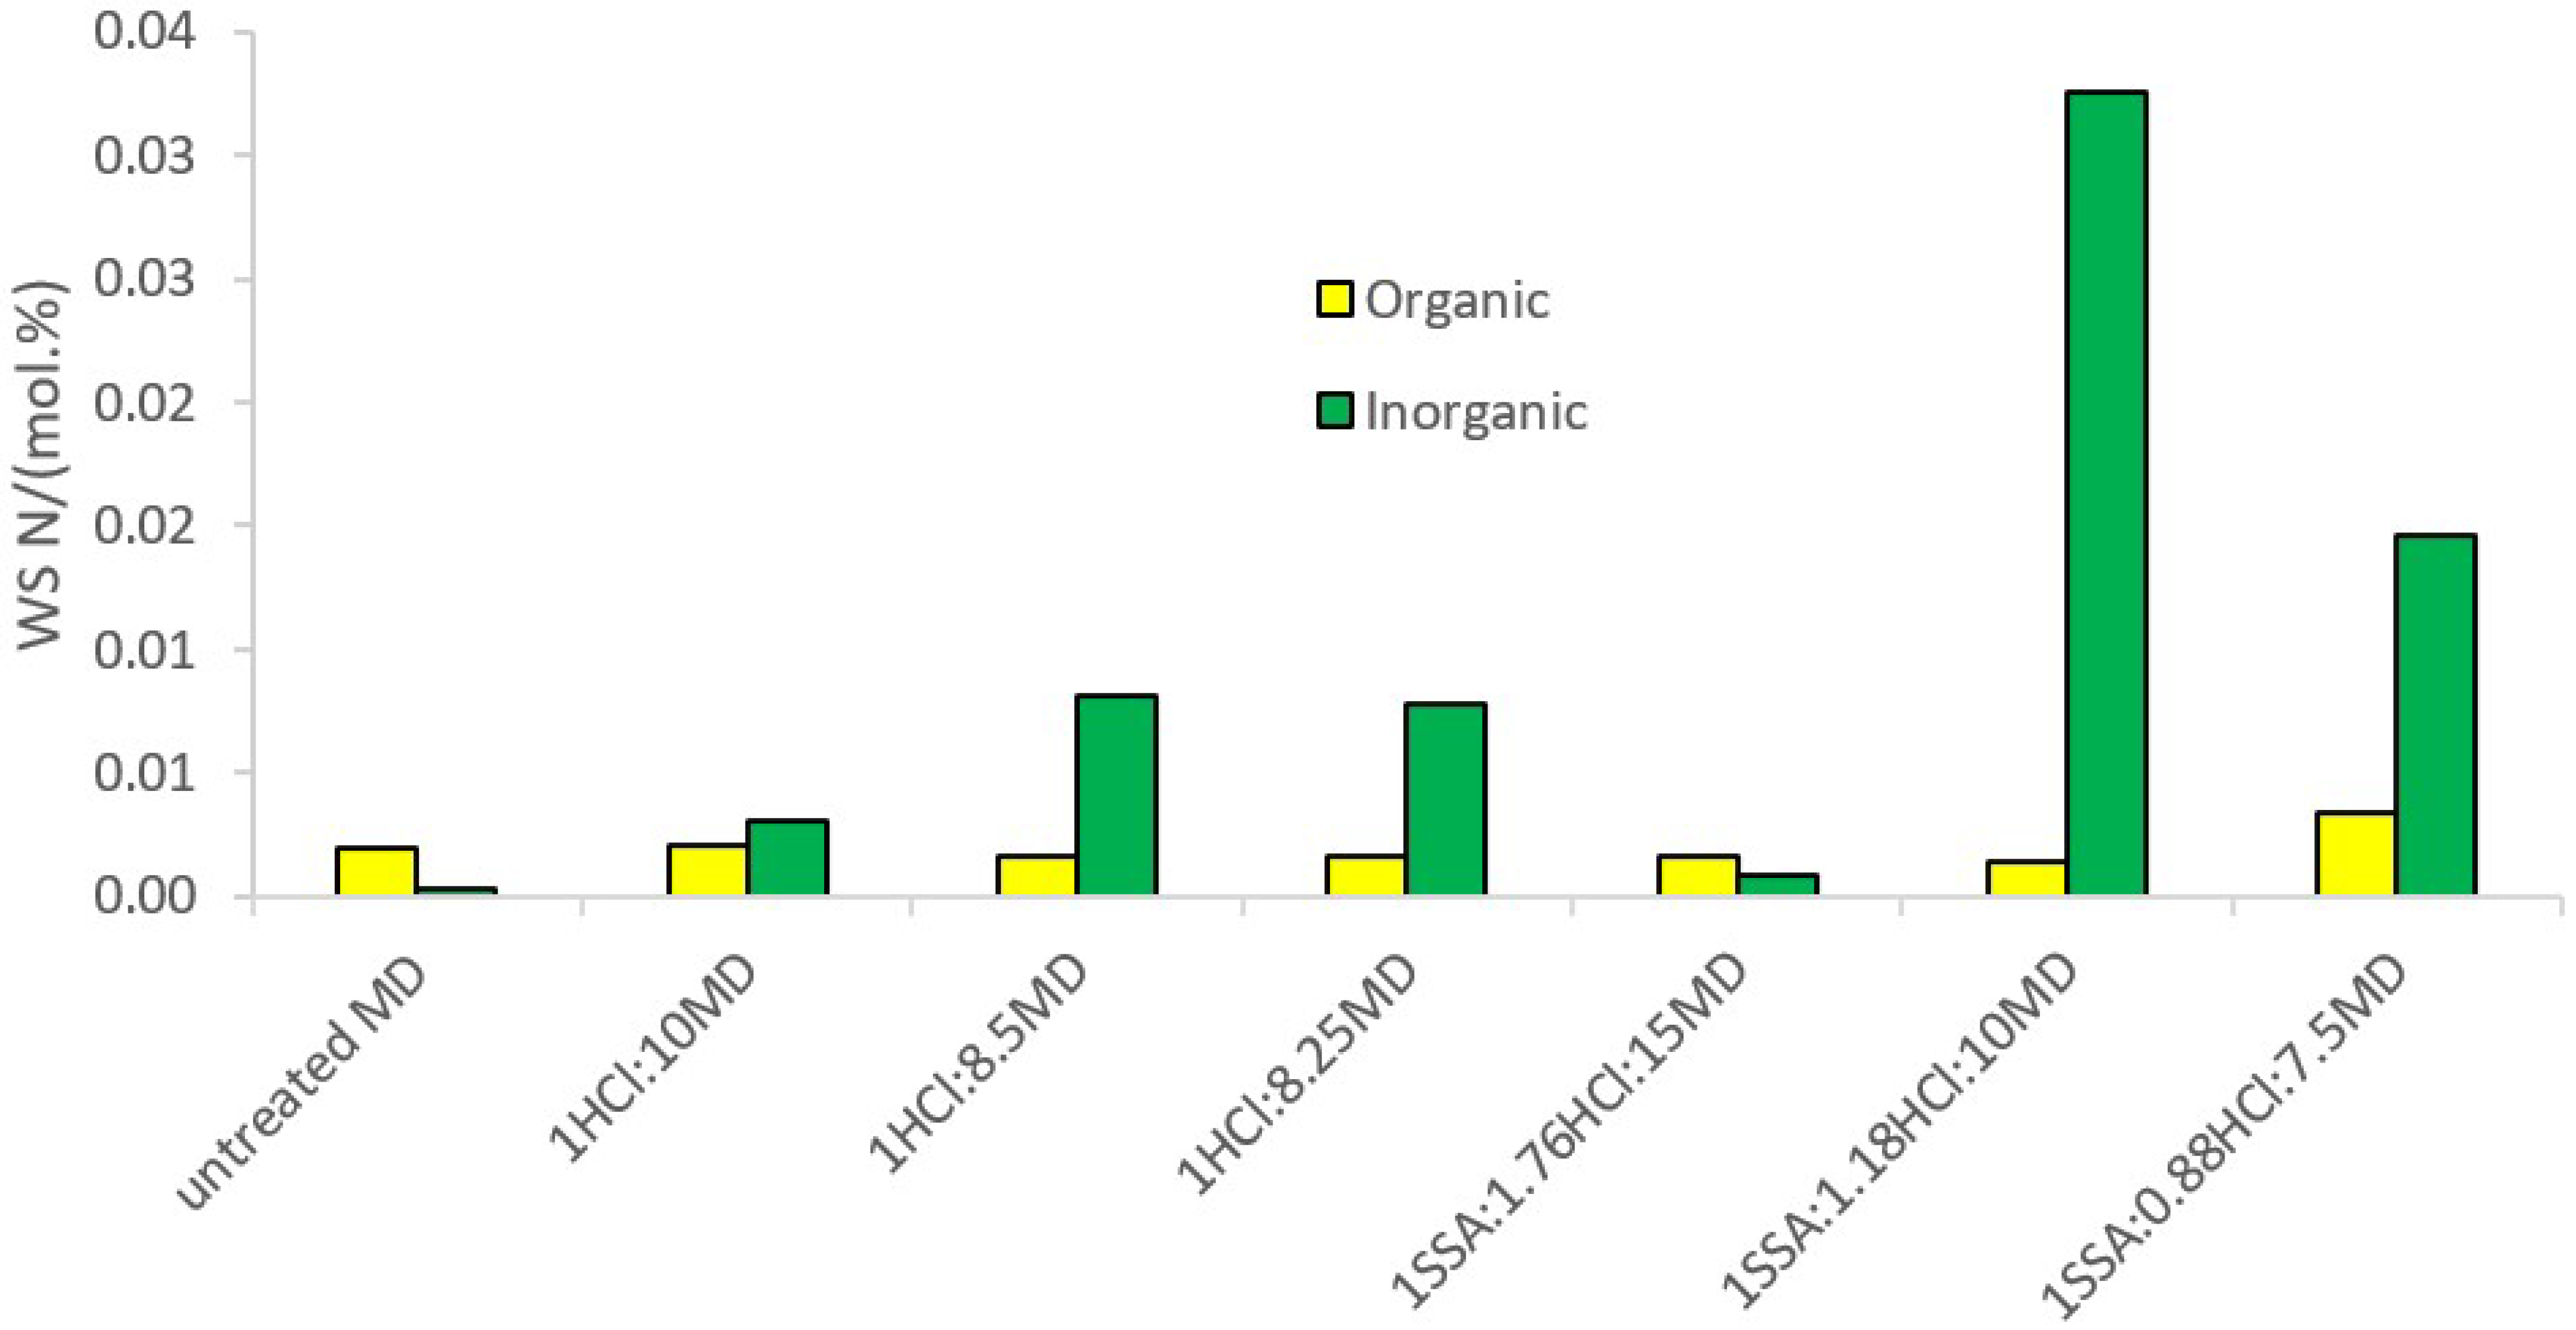
Table 1) was incorporated at 0.0060 times the flowrate of the MD towards the ionization reactor (1SSA:1.18HCl:10MD). In Case 7, the stream of ash was incorporated at 0.0080 times the flowrate of the DM to the stoichiometric-equilibria reactor (1SSA:0.88HCl:7.5MD). According to the study of Zheng et al. [
32], the amount of ash that should be added to the digestate to attain the most efficient dewatering is the same as the total solid content of the latter material, which, for the samples of SSA and MD, would correspond to a ratio of 0.06 (
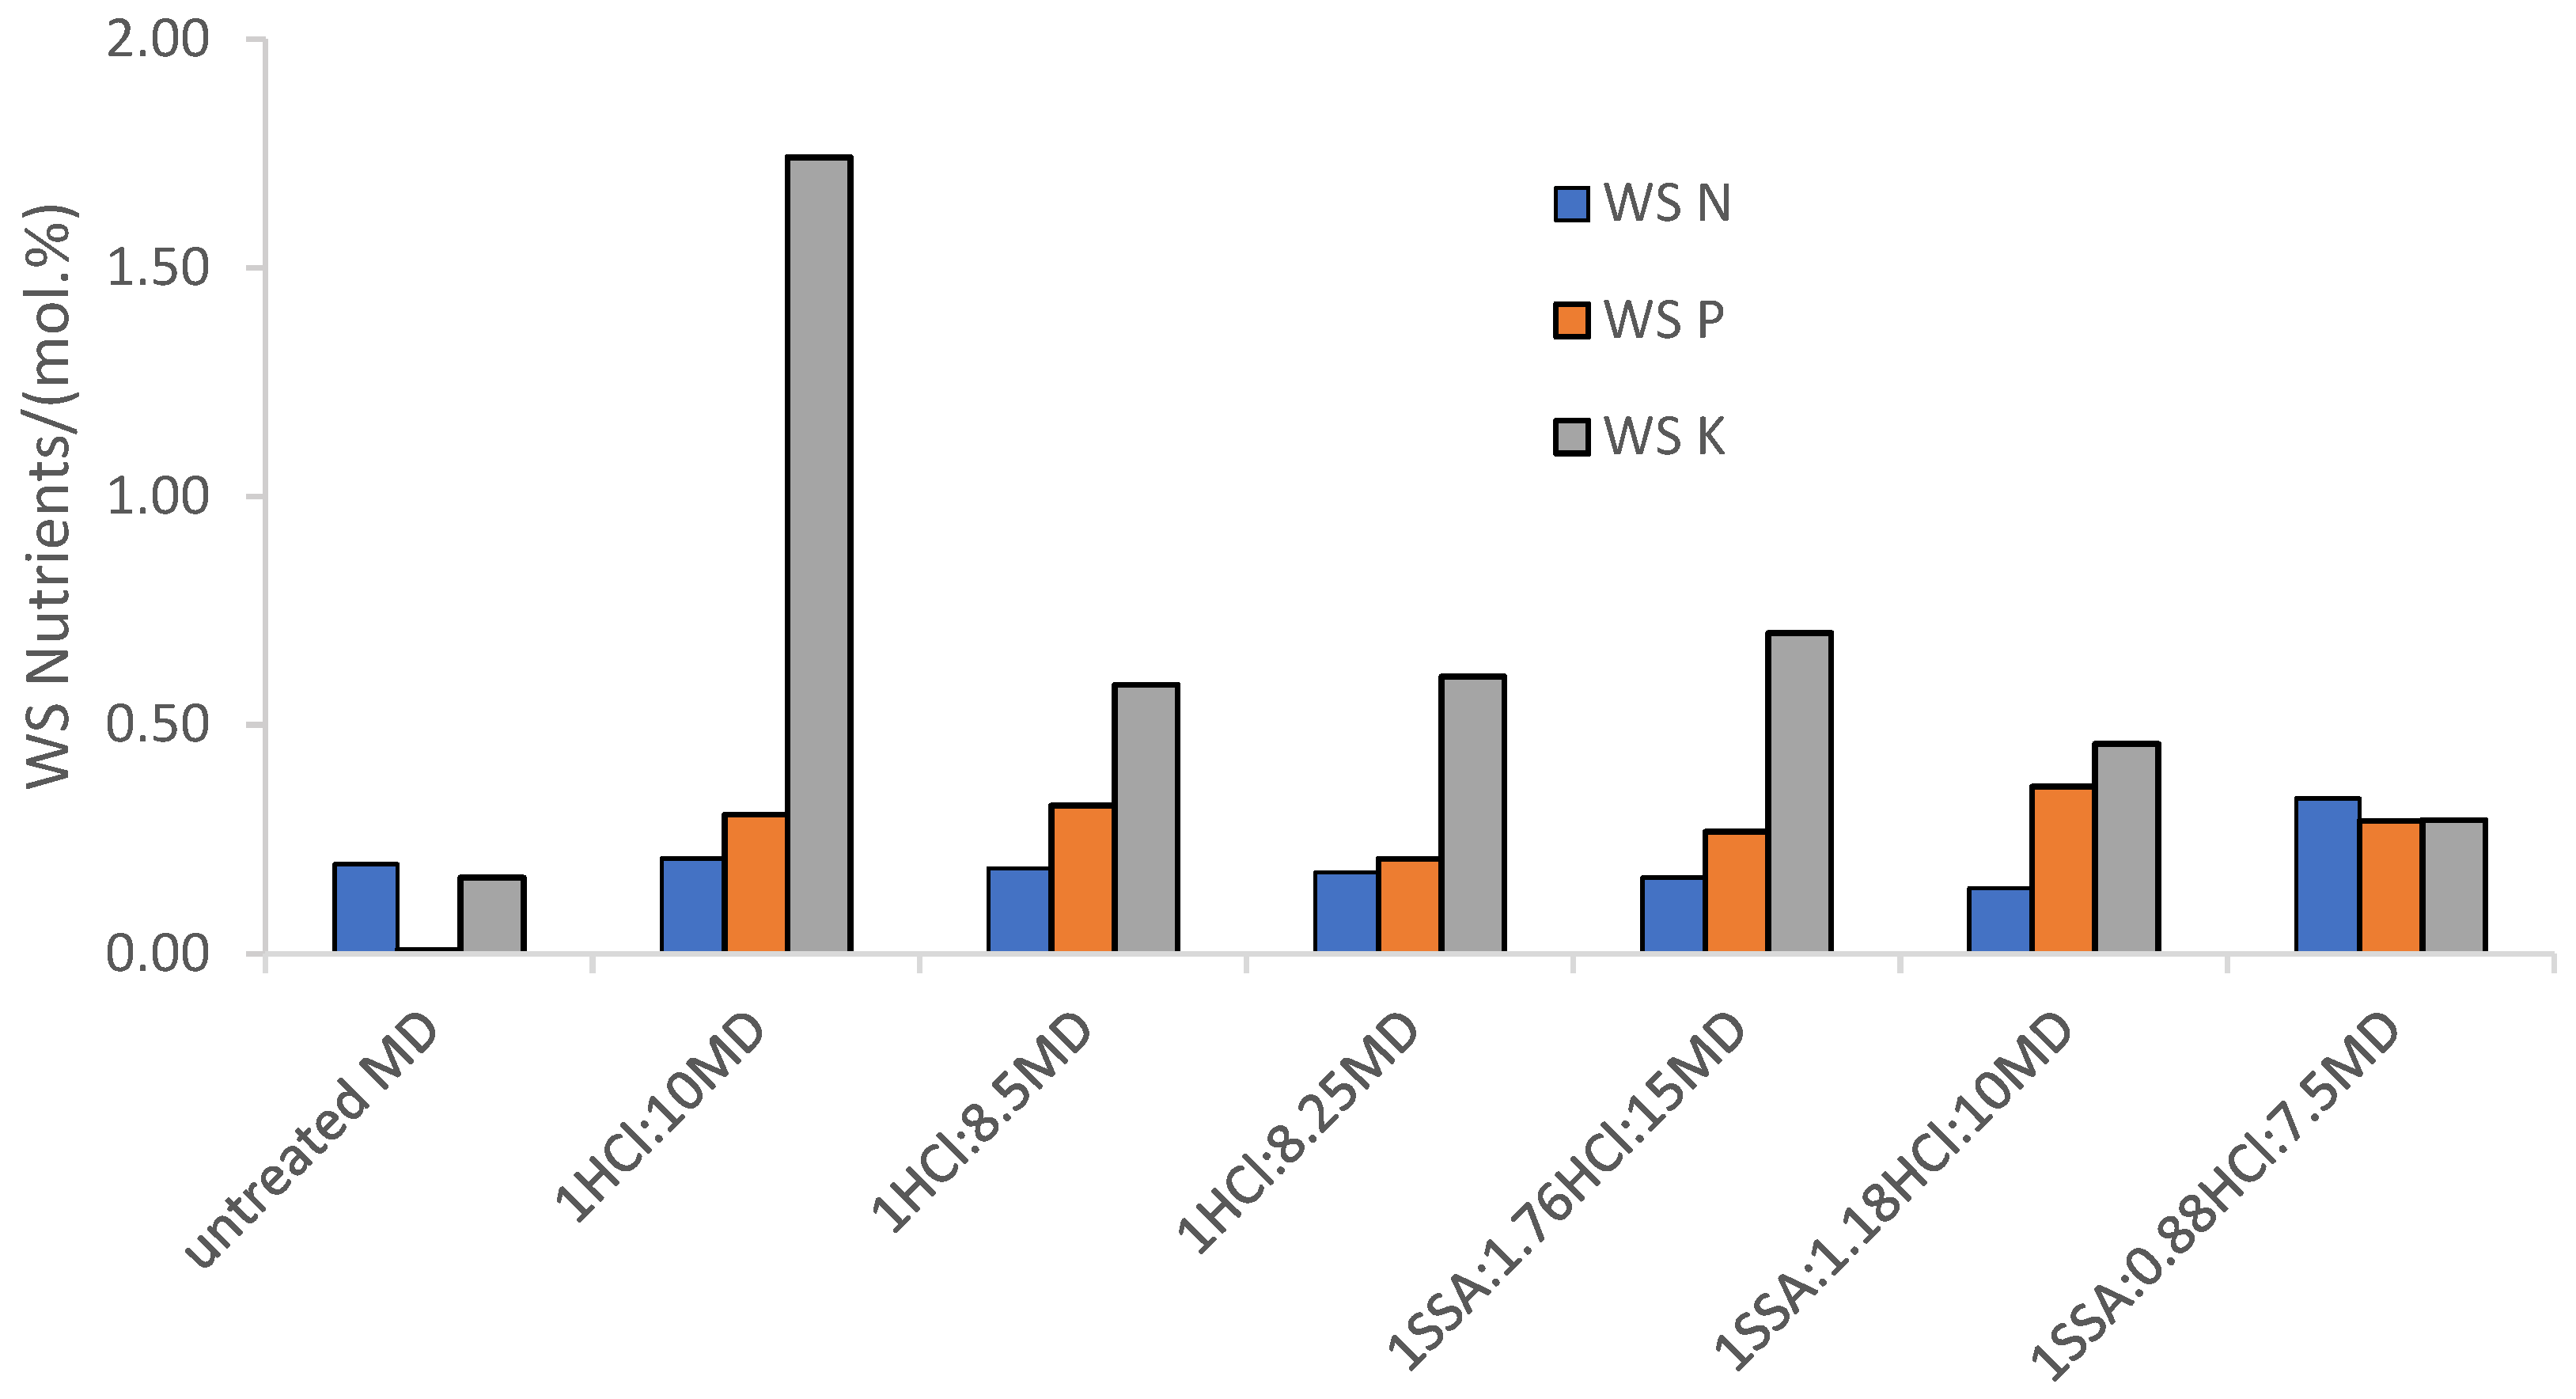
Table 2). The doses of SSA to MD employed in Case 5, Case 6, and Case 7 (0.0060 ± 0.0020) were an order of magnitude lower than the specification provided by Zheng et al. [
11], due to the intended preparation of a solid granular fertilizer with the targeted nutrient profile N/P/K 3/1/1 [
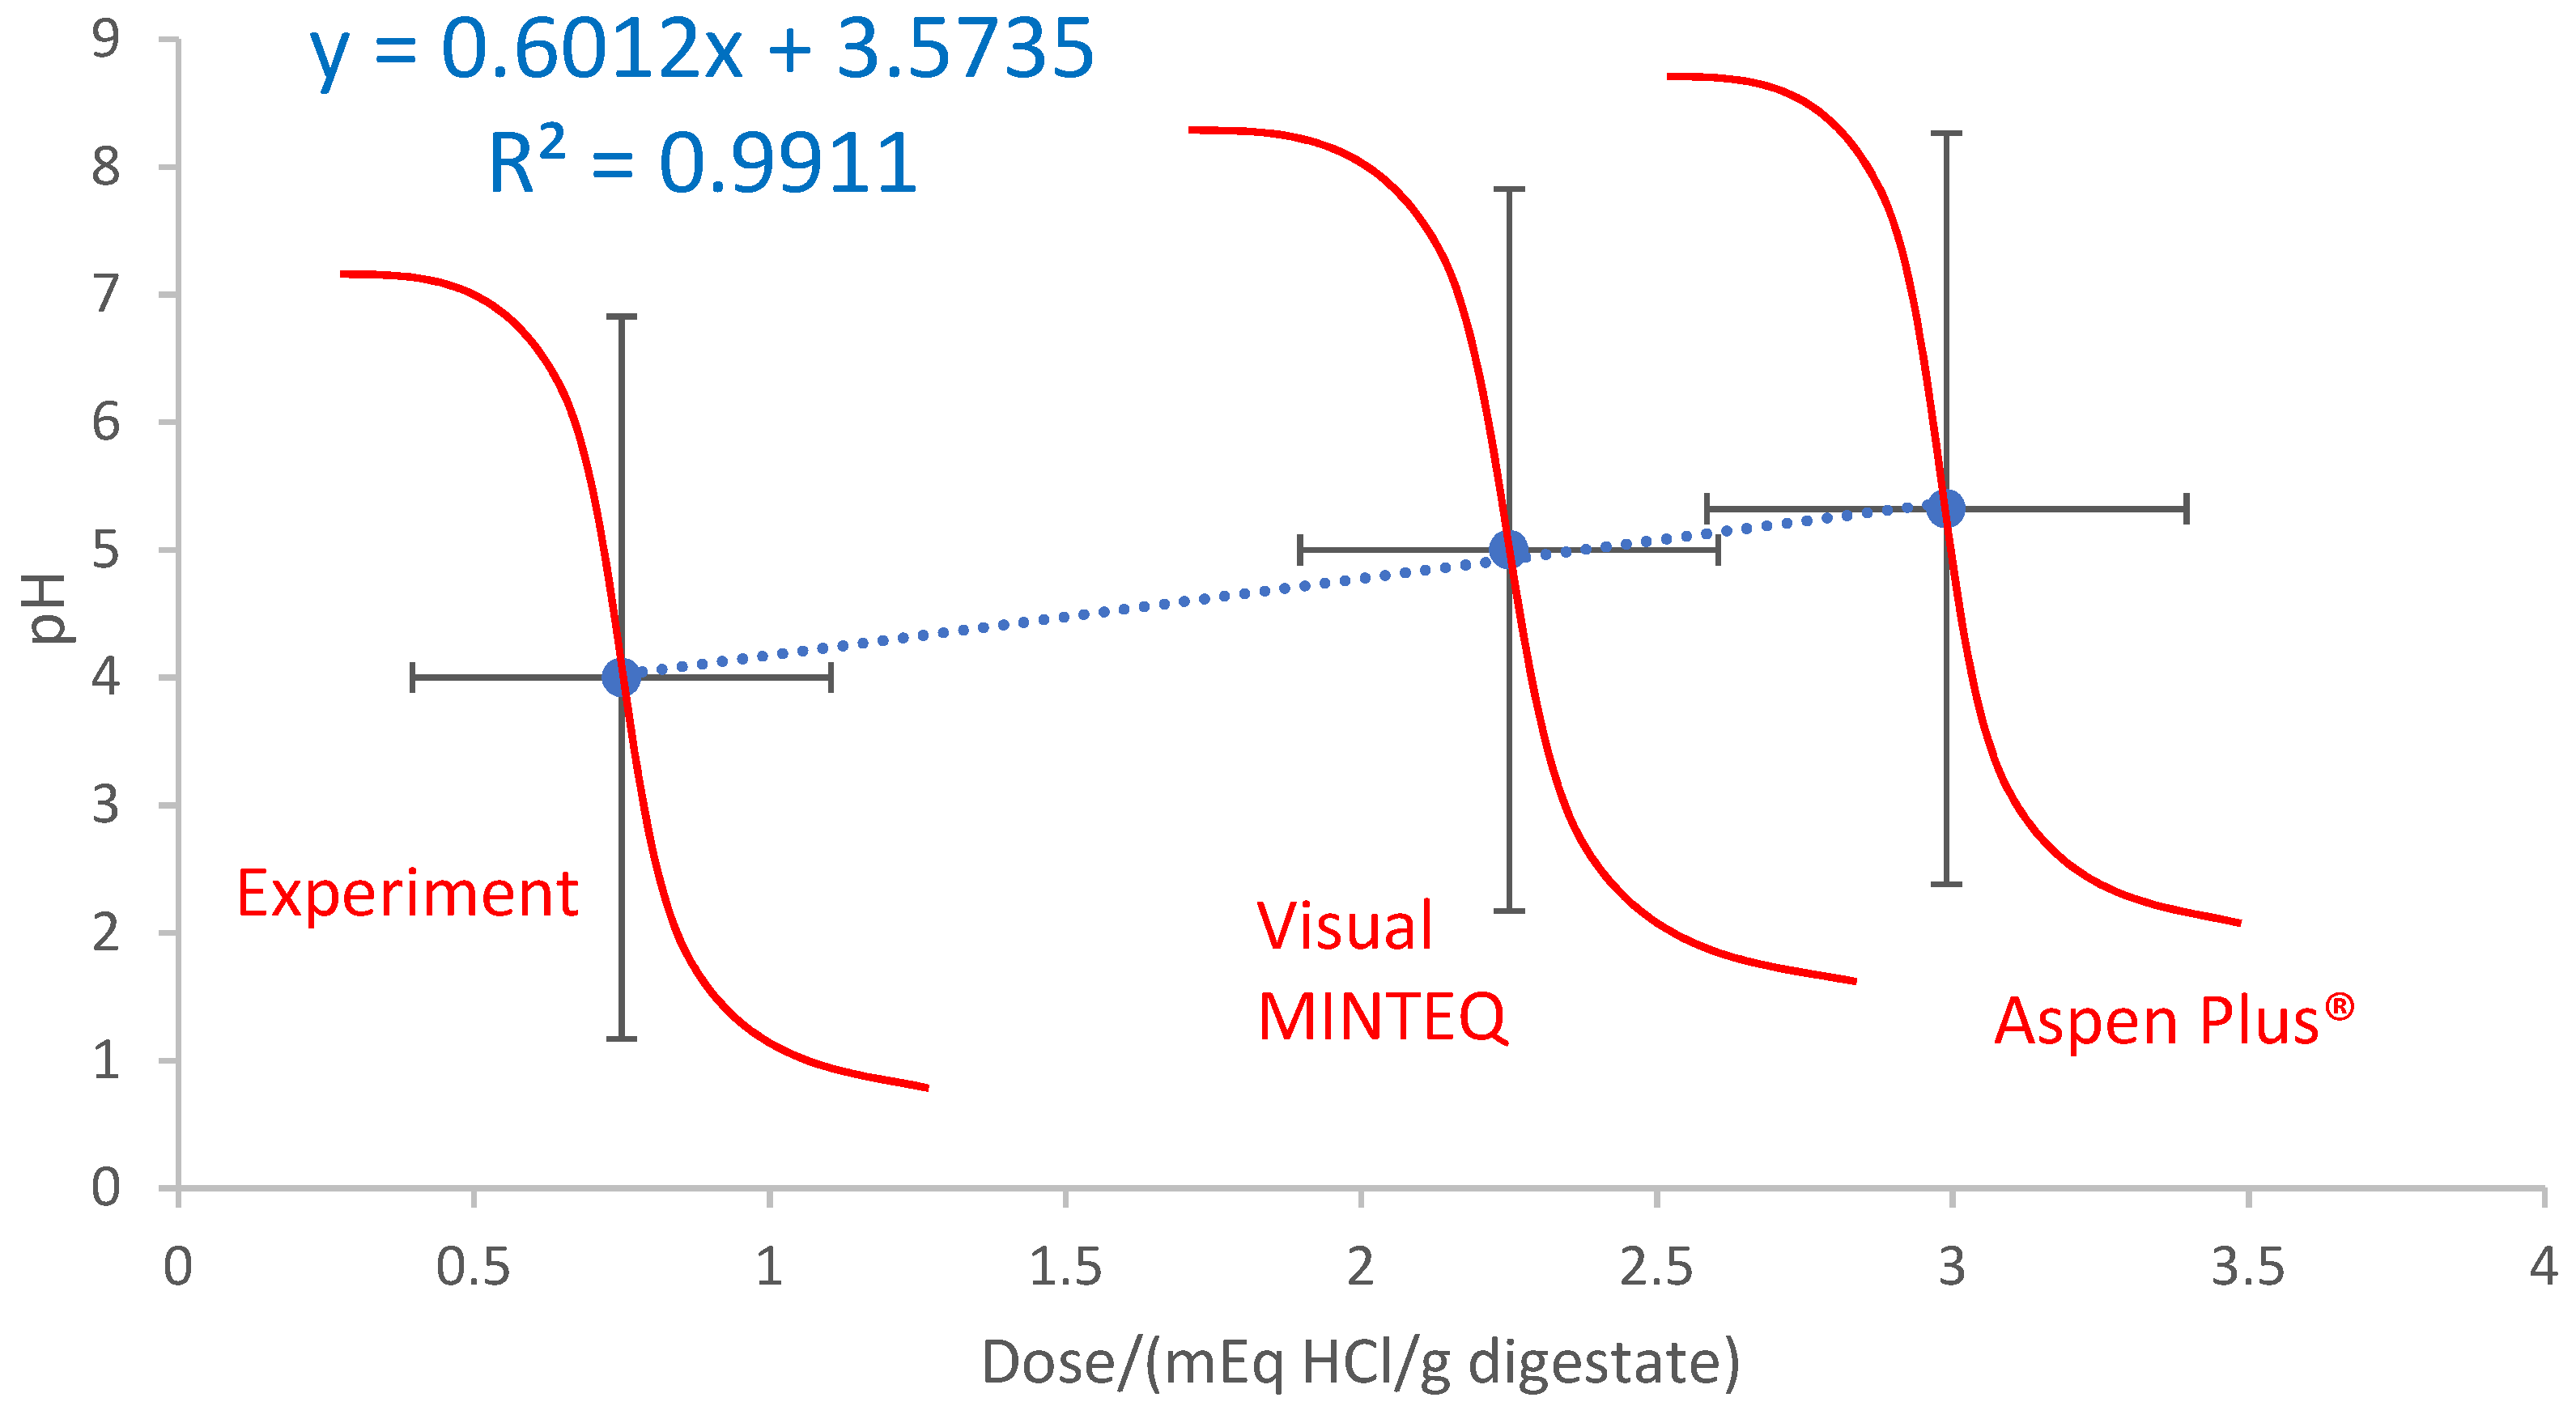
14]; although, attaining this ratio depends on the number of nutrients that remain in the water-soluble (WS) fraction after the solid–liquid separation. The results of the Aspen Plus
® simulation were compared against those previously obtained experimentally and with the software visual MINTEQ [
28]. The ANOVA test (
p < 0.05) was performed with Microsoft Excel
® to identify significant differences between the trends observed.
4. Discussion
A third of all gaseous emissions (including CH
4, CO
2, and NH
3) associated with the management of organic residues via AD technology are derived from the last stage of storage [
39,
40]. Although the rate of biogas production reaches its peak during the controlled mesophilic or thermophilic fermentation that occurs in the anaerobic digester, the time of the psychrophilic storage can be 10 times longer [
35,
41,
42]. For this reason, there are storage systems with facilities for the recovery of the biogas [
43]. However, open lagoons are also used to hold the anaerobic digestate before land application, where these gases are simply emitted into the atmosphere [
40,
44]. The values reported in the literature (
Table 3) are below the upper limit of 450 mL biogas/g VS established in the British regulation PAS 110 [
7]; hence, these digestates would be suitable to be used as organic amendments.
Table 3 offers a summary of the residual biogas and methane potentials of different types of digestate (i.e., produced from different substrates and employing different types of solid–liquid separation equipment). Except for the results reported by Gioelli et al. [
40], a direct relationship could be established between the solid content of the fractions of the anaerobic digestate and the biogas production. This could be explained by the greater concentration of fermentable organic matter (solid fraction > whole digestate > liquid fraction) and the greater surface area of a material that is not submerged in liquid [
14]. The results of Sambusiti et al. [
45] agree with the higher concentration of biodegradable material in the solids, with a theoretical methane yield of 415 mL CH
4/g cellulose, 424 mL CH
4/g xylan, and 420 mL CH
4/g proteins. They further proposed that the liquor might have a greater concentration of less degradable humic substances in addition to ammonia that inhibits the fermentation in concentrations higher than 2.5 g/L.
The role of CH
4, CO
2, and NH
3 in the upstream (i.e., conditioning and pretreatment of the feedstock), mainstream (i.e., operating conditions of the main AD bioreactors), and downstream (i.e., storage, nutrient recovery, and solid–liquid separation) should be recognized for the overall monitoring of the valorization technology [
12,
13,
47]. Particularly, the CO
2 injection is employed as manure pretreatment to increase the production of CH
4 by promoting the bioconversion of the inorganic source of carbon directly through hydrogenotrophic methanogenesis, indirectly through homoacetogenic acetate formation followed by acetolactic methanogenesis or via electron transfer [
47]. Therefore, the stabilization reactor was fed with the streams of biogas and anaerobic digestate as described in
Figure 1 and
Figure 7. In order to enhance the chemistry of the multiple reactions between the NH
3 (aq) and the CO
2 (g) data obtained from the investigations related to the absorption of CO
2 (g), in aqua-ammonia solutions were considered. According to Mani et al. [
48], the reactions between the CO
2 (g) and the NH
3 (aq) are exothermic and occur at room temperature (293 K) and atmospheric pressure to produce NH
4HCO
3, ammonium carbonate ((NH
4)
2CO
3), and ammonium carbamate (NH
2COONH
4). The multiple reactions between the weak acid (Equation (7)) and the weak base (Equation (8)) correspond to a complex system, which is difficult to represent unless neglecting some equilibria, due to the short availability of thermodynamic data. Based on Equations (7)–(11), the composition of the system CO
2-NH
3-H
2O depends on the concentrations of CO
2 (g) and the NH
3 (aq), which together with the dissociation of VFA, determine the pH of the system [
49].
In terms of the rate of the reactions, the hydration of the CO
2 (g) represents the bottleneck of the series (Equations (7)–(11)), as displayed in
Table 4.
According to Mani et al. [
48], if the concentration of CO
2 (aq) is equal to or greater than that of NH
3 (aq), the formation of ammonium bicarbonate prevails (Equation (9)). However, under an excess concentration of NH
3, the formation of carbamate (Equation (10)), and to a lesser extent, the formation of ammonium carbonate (Equation (11)), takes place. According to Budzianowski [
53], the solid formation (in a scrubber) can be neglected if the concentration of NH
3 does not exceed 5–10 wt.%, which corresponds to 50–100 mg NH
3/L H
2O. The concentration of ammonia used in the study of Mani et al. [
48] to avoid the formation of solid precipitates (2.5 mol NH
3 (aq)/L, 4.3 wt.%, or 42.5 mg NH
3 (aq)/L) is in agreement with the threshold value given by Budzianowski [
53].
If the NH
3 (aq) is not completely consumed by the neutralization reaction with the CO
2 (aq), it is more correct to express the equilibria between the NH
3 (aq) and the CO
2 (g) as Equations (12) and (13). With regard to Equations (11) and (13), it is important to highlight that the UNIQUAC model in Aspen Plus
® predicts the subsequent formation of (NH
4)
2CO
3, according to Equations (14) and (15) [
55]. Looking at the thermodynamic data available for both reactions at ambient pressure, the formation of ammonium carbamate is more abundant than the ammonium carbonate [
48,
56]. From the point of view of the kinetics, the formation of carbamate is quicker (k
CO2 = k
NH3 = 3.37 M
−1·s
−1;
Table 4) because it avoids the hydration of the CO
2 (g) (3.25 × 10
−2 s
−1;
Table 4). Therefore, the formation of ammonium carbamate is more likely with dry ice (i.e., solid carbon dioxide) [
57], and it is converted to ammonium carbonate once is freely in an aqueous solution [
56]. The combination of ammonia and carbon dioxide under high pressure (110 atm) and temperature (200 °C) leads to the production of urea [
56,
58].
Considering the solubility of the ammonium salts (
Table 5), heterogeneous equilibria could be considered for the system NH
3-CO
2-H
2O and homogeneous equilibria could be avoided by pumping CO
2 (g) into the system, according to Equations (16) and (17) [
48], given the lower solubility of the ammonium bicarbonate (
Table 5). In fact, the manufacture of NH
4HCO
3 as fertilizer has been proposed following a similar procedure by means of distillation of the liquid fraction of the anaerobic digestate [
20].
It is important to highlight that carbamate, ammonium carbamate, and ammonium bicarbonate appear in the original code of the PSM (
Tables S4–S6) and only the ammonium carbonate is missed [
49]. In the study of Mani et al. [
48], the relative abundances of carbamate, bicarbonate, and carbonate were 43.3%, 22.5%, and 34.2%, respectively, at the end of the first hour of CO
2 (g) absorption in the NH
3 (aq) solution and a reasonable relative proportion of all these chemical species were found after 8 h of continuous operation (
Table 6). However, there was a consistent decrease in carbamate and carbonate in favor of the formation of bicarbonate. An increase in the relative amount of bicarbonate would be expected if the absorption study continued for longer than 8 h. As described in
Table 6, the profile of these chemical species in the liquid fraction of anaerobic digestate, which can be understood as an aqueous solution with all the species in equilibrium, can be found in the work of Drapanauskaite et al. [
20].
When evaluating the synthesis of NH
3HCO
3 it is necessary to propose an experimental design that minimizes the uncertainty in the collection of the empirical data, for example, using the response surface methodology [
59]. This experimental design can be coupled with contemporary machine learning methods, such as the Gaussian process regression, to construct a robust model [
60].
5. Conclusions
First of all, the titration of the MD with the HCl showed that a dose of 3.18 mEq/g would be required to attain the pHzpc upon addition of the SSA to the MD following a ratio of 0.6 ± 0.2%. These doses of HCl and SSA that were applied to the MD to reach the pHzpc in the simulation were significantly different from those found in the experiments employing several acidification agents, ashes, and digestates of different natures. Only the use of a very high dose of lactic acid (68.31 ± 36.00 mEq/g digestate) prevented the blend of acidified digestate and wood ash to reach the pHzpc.
Secondly, with regard to the concentration of nutrients in the WS fraction of the MD, only an outlier value was found in the profile of potassium that showed the relative fragility of the Aspen Plus® model and the need to revise it and make it more robust to be able to operate over a wider range of conditions.
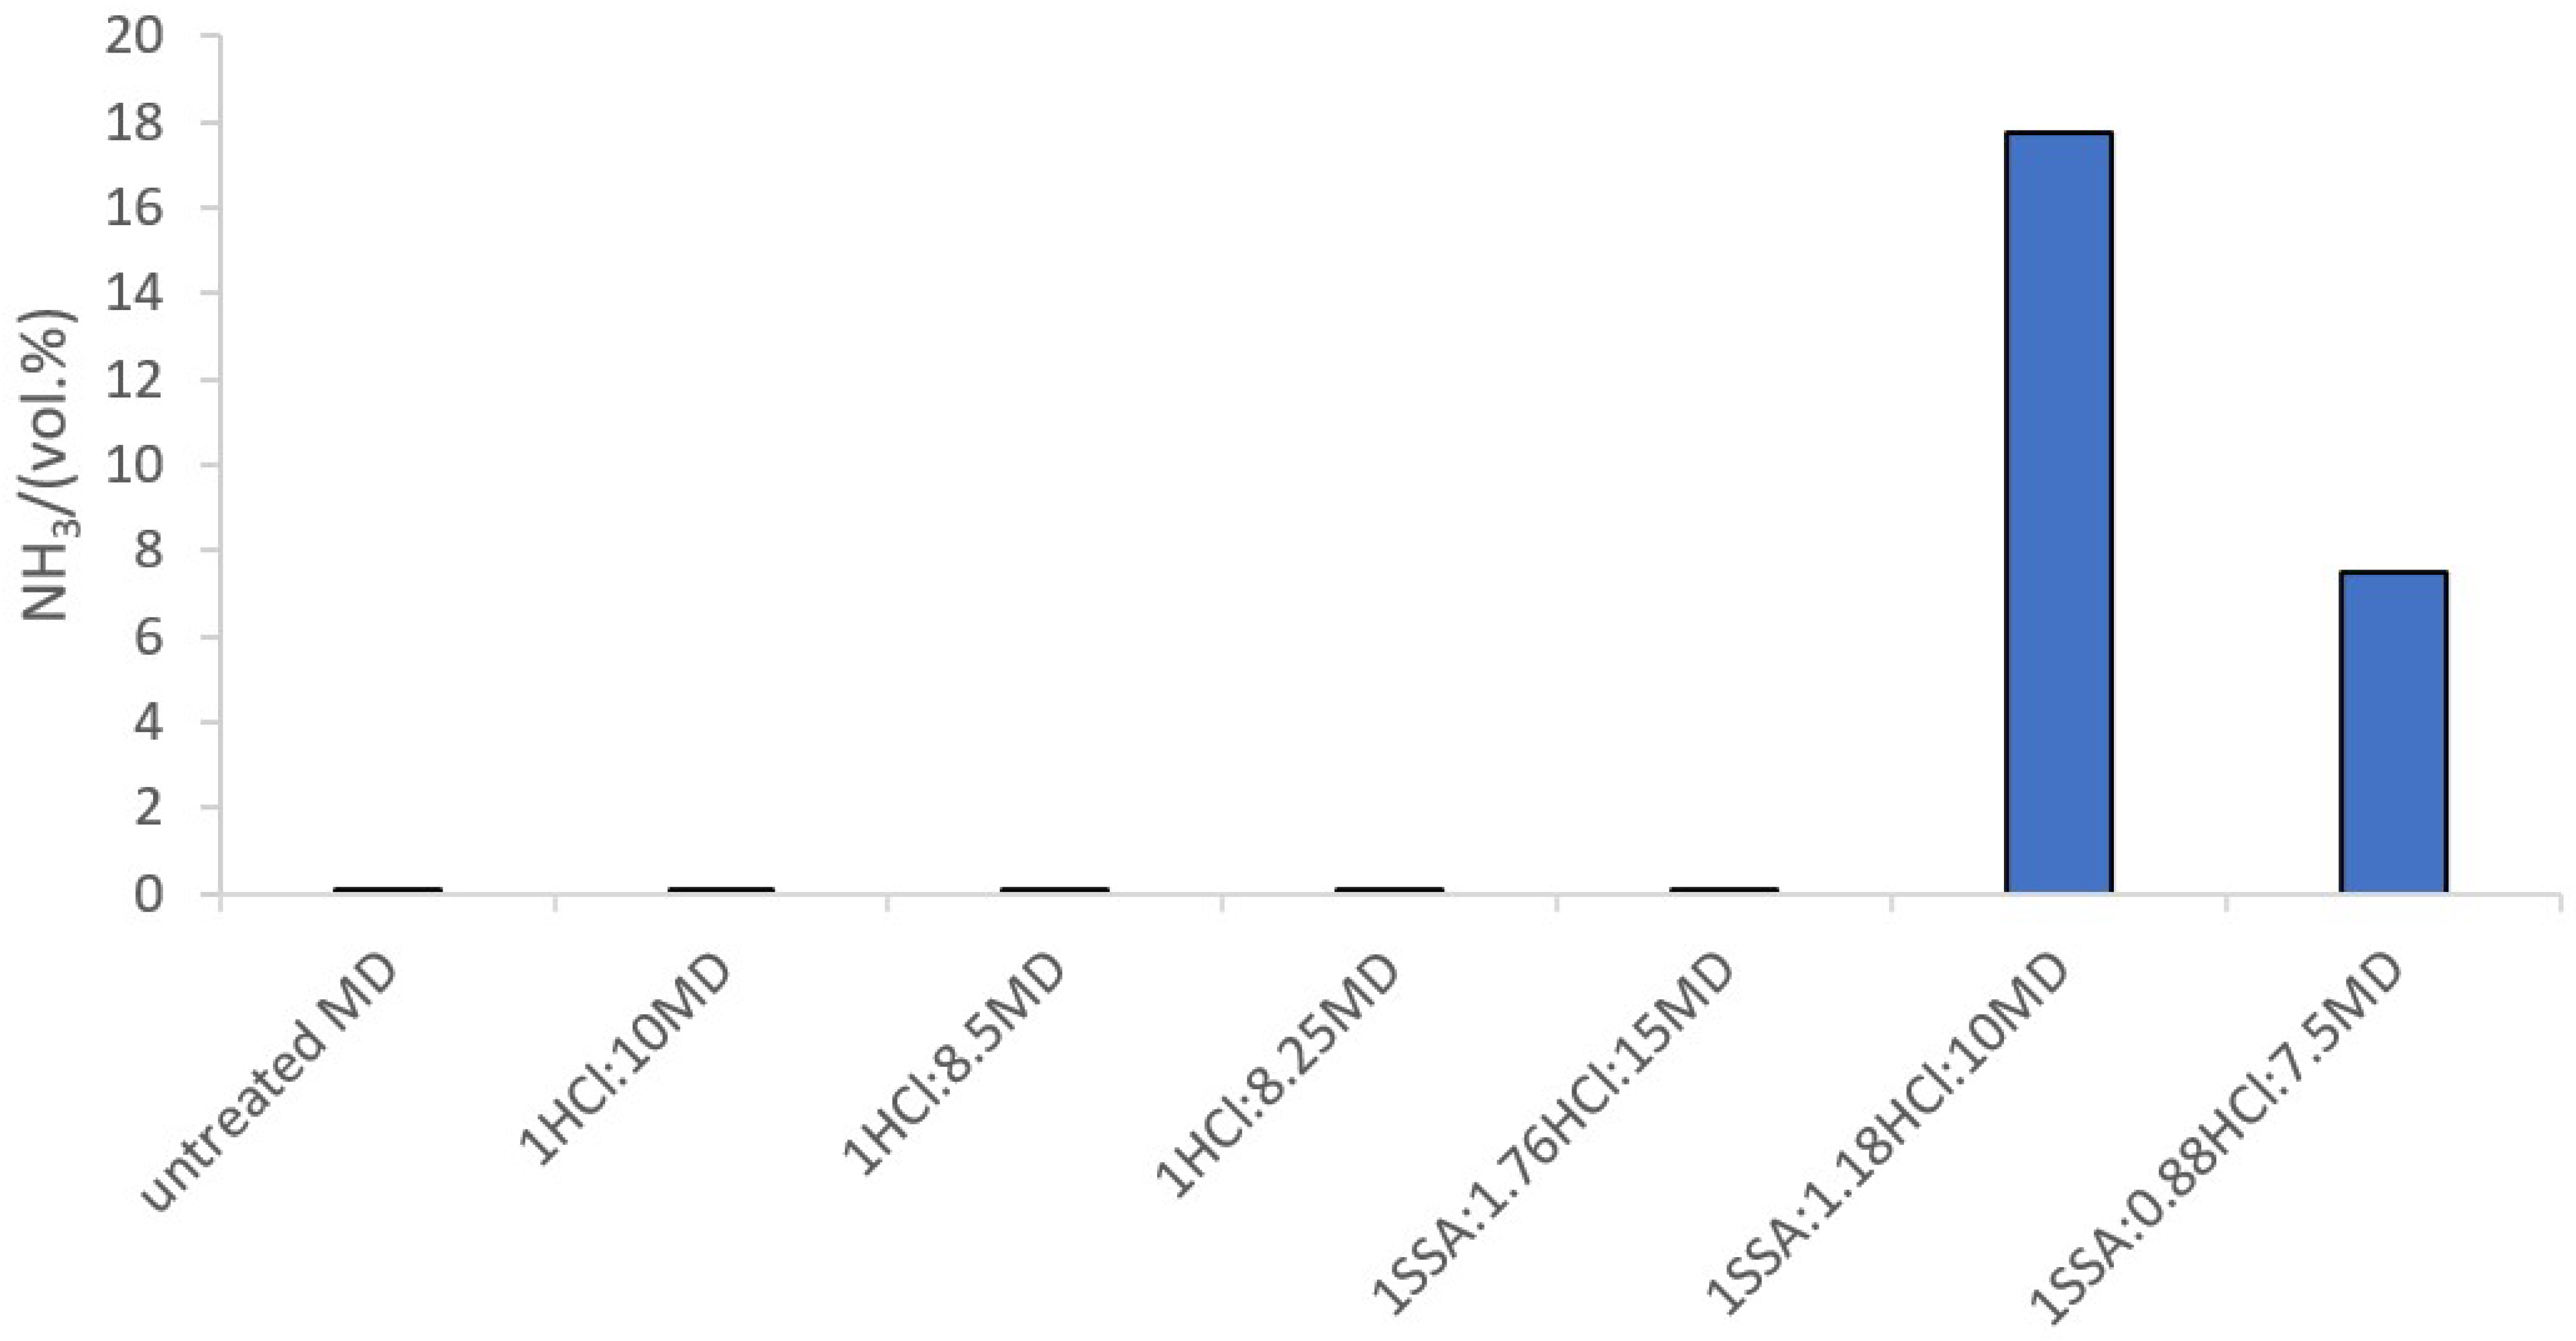
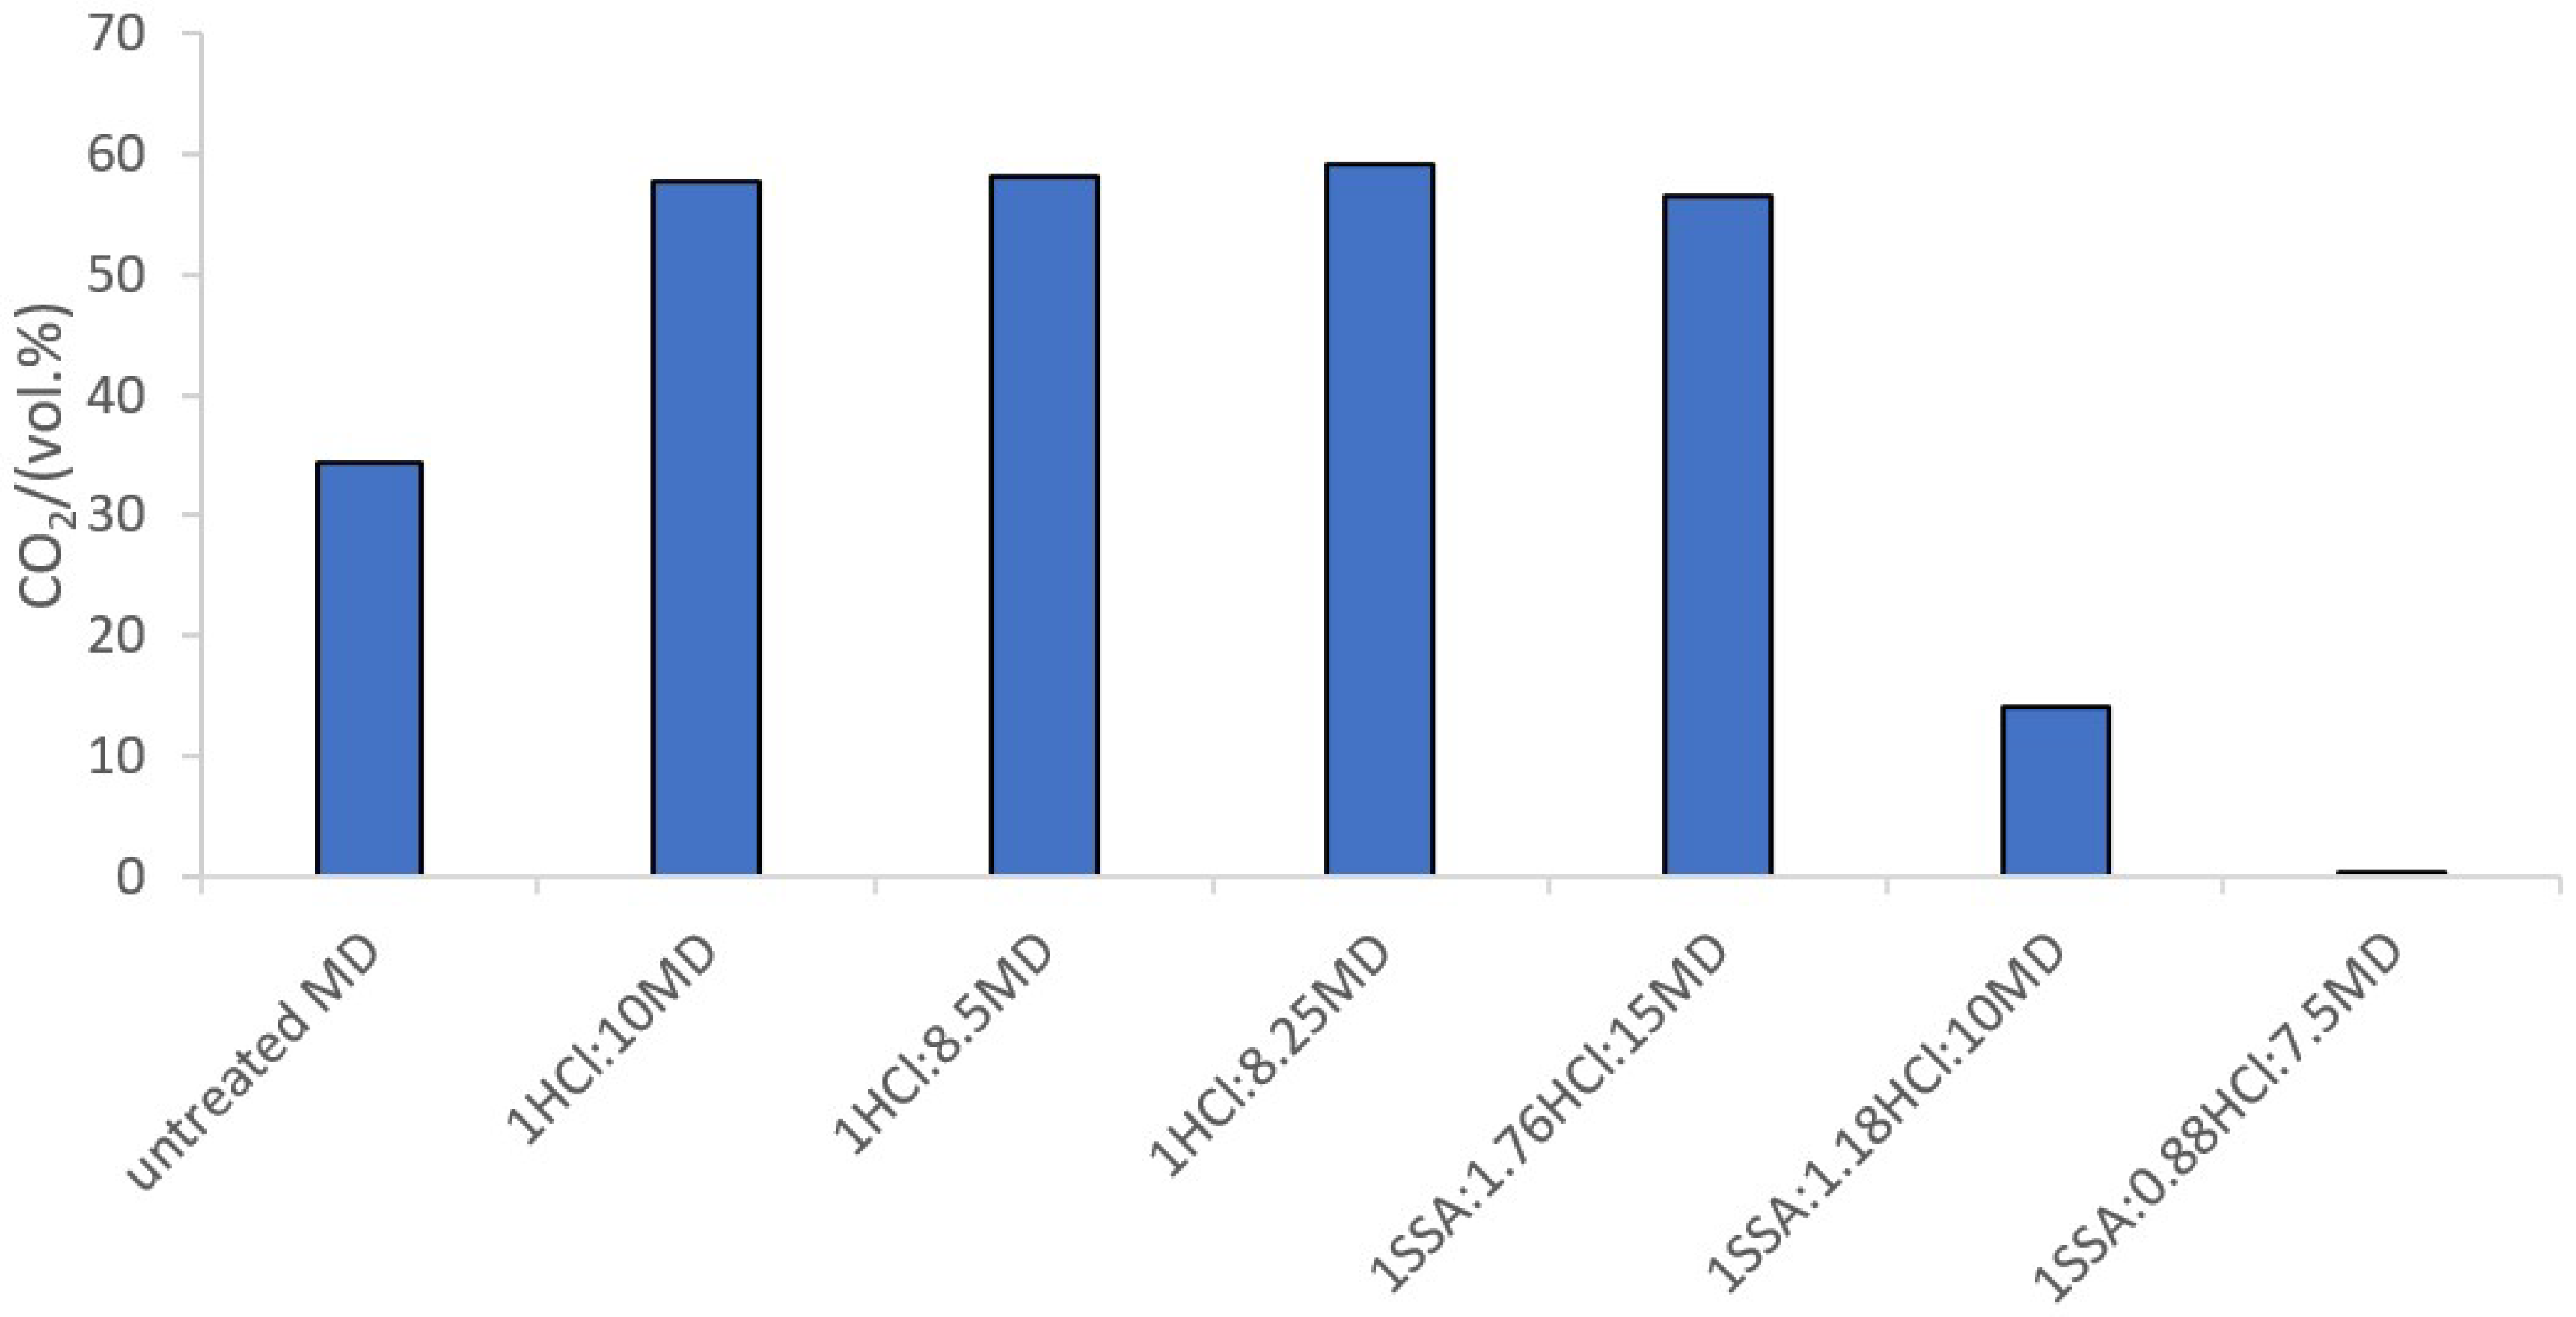
Thirdly, the profiles of NH3, CO2, and CH4 found in the biogas agree with the processes described for the simultaneous upgrading and production of NH4HCO3. In this way, the acidification to attain the isoelectric point of the anaerobic digestate (pH < 4) promoted the release of CO2 and minimized the volatilization of NH3. Once the SSA was added to stabilize the MD at the pHzpc (11.61 ± 2.09), the opposite trend occurred; thus, the volatilization of NH3 increased and the sequestration of CO2 in the blend took place. As the concentration of CO2 in the blend is much greater than that of NH3, the increase in the volatilization of the later compound and the mitigation of the former one led to an upgrading of the biogas to ~80 vol.% CH4.
For future work, further development of the model of the biomass ash-based treatment of the anaerobic digestate is proposed by optimizing the downstream manufacturing of NH4HCO3 and upgrading the biogas. It is required to confirm experimentally the exhaustive review of the underlying chemistry of the liquid–gas system with NH3, CO2, H2O, and CH4. This will be followed by the implementation of refined kinetics and equilibria, both physical and chemical, in the Aspen Plus® PSM.


