1. Introduction
The promotion and industrial development of smart grid technology is accelerating worldwide. However, service construction and research on intrusion detection, one of the most important security considerations in the smart grid, is lacking. Moreover, generality and security by applying standards is required.
The smart grid industry, which is a fusion between traditional industries and emerging industries continues to grow with other technologies. At this time, the security of data transmission and application of standard technology is an indispensable element. In addition, compared to the existing power grids, the smart grid environment is a new business platform fused with information and communication technology. Security problems in information technology still exist in smart grids, and without guarantee of security the impacts are more serious than in the existing information technology. Cyber vulnerabilities and violations are actually increasing, and causing cases of damage. In particular, various types of attacks including physical attacks continue to increase, and intrusion detection methods for this are needed.
IEC 62351-7 [
1] is a developing standard in International Electrotechnical Commission (IEC) Technical Committee (TC) 57 on security that is focused on developing standardized Network and System Management (NSM) object definitions for monitoring and controlling the information infrastructure. What is needed is the promotion of generality, extendibility and security through NSM, so that these international standards are applied to the smart grid intrusion detection service.
In this paper, we analyze the security requirements of NSM data objects, which are defined by IEC 62351-7 for intrusion detection, and analyze detection of SYN flood attacks and buffer overflow attacks as a Denial of Service (DoS) attack. For this, we construct a smart grid environment, and select attributes for analysis of those attacks. We then collect data of each attribute actually used in the trial attack. Subsequently, we make a comparative analysis of the data mining algorithms, to detect the attack efficiency. We prove that our selected attack attributes and the proposed detection process are efficient. The overall detection rate is enhanced after selection of key attributes. The rest of this paper is organized as follows:
Section 2 presents the network and system management.
Section 3 presents the attack method.
Section 4 illustrates the system environment, and presents the proposed modeling and detection process.
Section 5 analyzes the experimental results, to evaluate the effectiveness of our scheme. Finally, we conclude this paper in
Section 6.
2. Network and System Management
The IEC smart grid standardization roadmap is based on the recent work of IEC SG3. IEC 62351 [
2] addresses power systems management and associated information exchange—data and communication security. The scope of IEC 62351-7 focuses on network and system management (NSM) of the information infrastructure. The goal of this standard is to provide a service related to security requirements, of confidentiality, integrity, availability, and non-repudiation. As a protocol approach, it provides a security service in terms of two aspects. First, it protects information, using encryption from the origin point to the target point, or a secure electronic communication system by means of a protected power distribution system. Second, it provides end-to-end security.
2.1. Denial of Service Attack
The NSM requirements in IEC 62351-7 deal with detecting resource exhaustion as a DoS attack, for example, a SYN flood attack and a buffer overflow attack.
2.1.1. SYN Flood Attack
A SYN flood is a form of DoS attack, in which an attacker sends a succession of SYN requests to a target’s system, in an attempt to consume enough server resources to make the system unresponsive to legitimate traffic [
3].
The passive intrusion detection system (IDS) can detect rapidly increasing SYN flooding, based upon time and/or bandwidth consumption. The NSM is required to detect resource exhaustion attacks [
1]:
- -
Exceeding the maximum number of connection permitted over the network;
- -
Count of number of connections actually in place over the network;
- -
Exceeding the maximum number of connections which can be in use simultaneously;
- -
Count of the number of connections in use simultaneously;
- -
Exceeding minimum/maximum idle time;
- -
Actual idle time over a specified time period;
- -
Exceeding CPU load limits;
- -
Exceeding memory usage limits;
- -
Below low level battery power limits or too high rate of change.
2.1.2. Buffer Overflow Attack
A buffer overflow is an anomaly where a program, while writing data to a buffer, overruns the buffer’s boundary and overwrites adjacent memory [
4]. The passive IDS is not intrinsically able to determine whether a buffer overflow attack is underway. This is especially true for IEC 61850 [
5] and IEC 60870-6 TASE.2 [
6] where the application buffer size is negotiated at runtime. However, the application/communication stack could be aware of such overruns [
1]. The NSM is required to detect buffer overflow attacks:
- -
Number of buffer over runs;
- -
Number of buffer under runs;
- -
Audit ability to detect which source caused the buffer overflow/underflow.
3. Attack Method
In recent smart grid attack trends, the false data injection attack [
7] proposed in 2009 has taken center stage as a new type of attack, and relevant work to respond to this treat is being proposed continuously [
8,
9,
10].
Other attack papers are as follows. Chen
et al. [
11] investigate the use of Petri nets for modeling coordinated cyber-physical attacks on the smart grid. Yuan
et al. [
12] propose a Smart Grids Distributed Intrusion Detection System (SGDIDS), by developing and deploying an intelligent module—the Analyzing Module (AM)—in the multiple layers of smart grids. Xie
et al. [
13] are the first ones attempting to formalize the economic impact of malicious data attacks on real-time market operations. Mohsenian-Rad and Leon-Garcia [
14] propose a cost-efficient load protection strategy, which minimizes the cost of the load protection. Lu
et al. [
15] use experiments to quantitatively evaluate the impact of DoS attacks on a power substation network with a distributed network protocol (DNP3). They prove that long DNP3 packets are more vulnerable to DoS attacks than are short DNP3 packets, and that the performance of the power network does not degrade gradually with the increase of the DoS attack intensity. Kundur
et al. [
16] propose an impact analysis framework, based on a graph-theoretic dynamical systems approach, for modeling the cyber-physical interactions. Little research exists on the topic of DoS attacks on smart grids. In particular, research of a similar type to a SYN flood attack and a buffer overflow attack has not been conducted.
4. Intrusion Detection
This section covers the system environment for our experiments, and the modeling and detection process to find an efficient detection rate.
4.1. System Environment
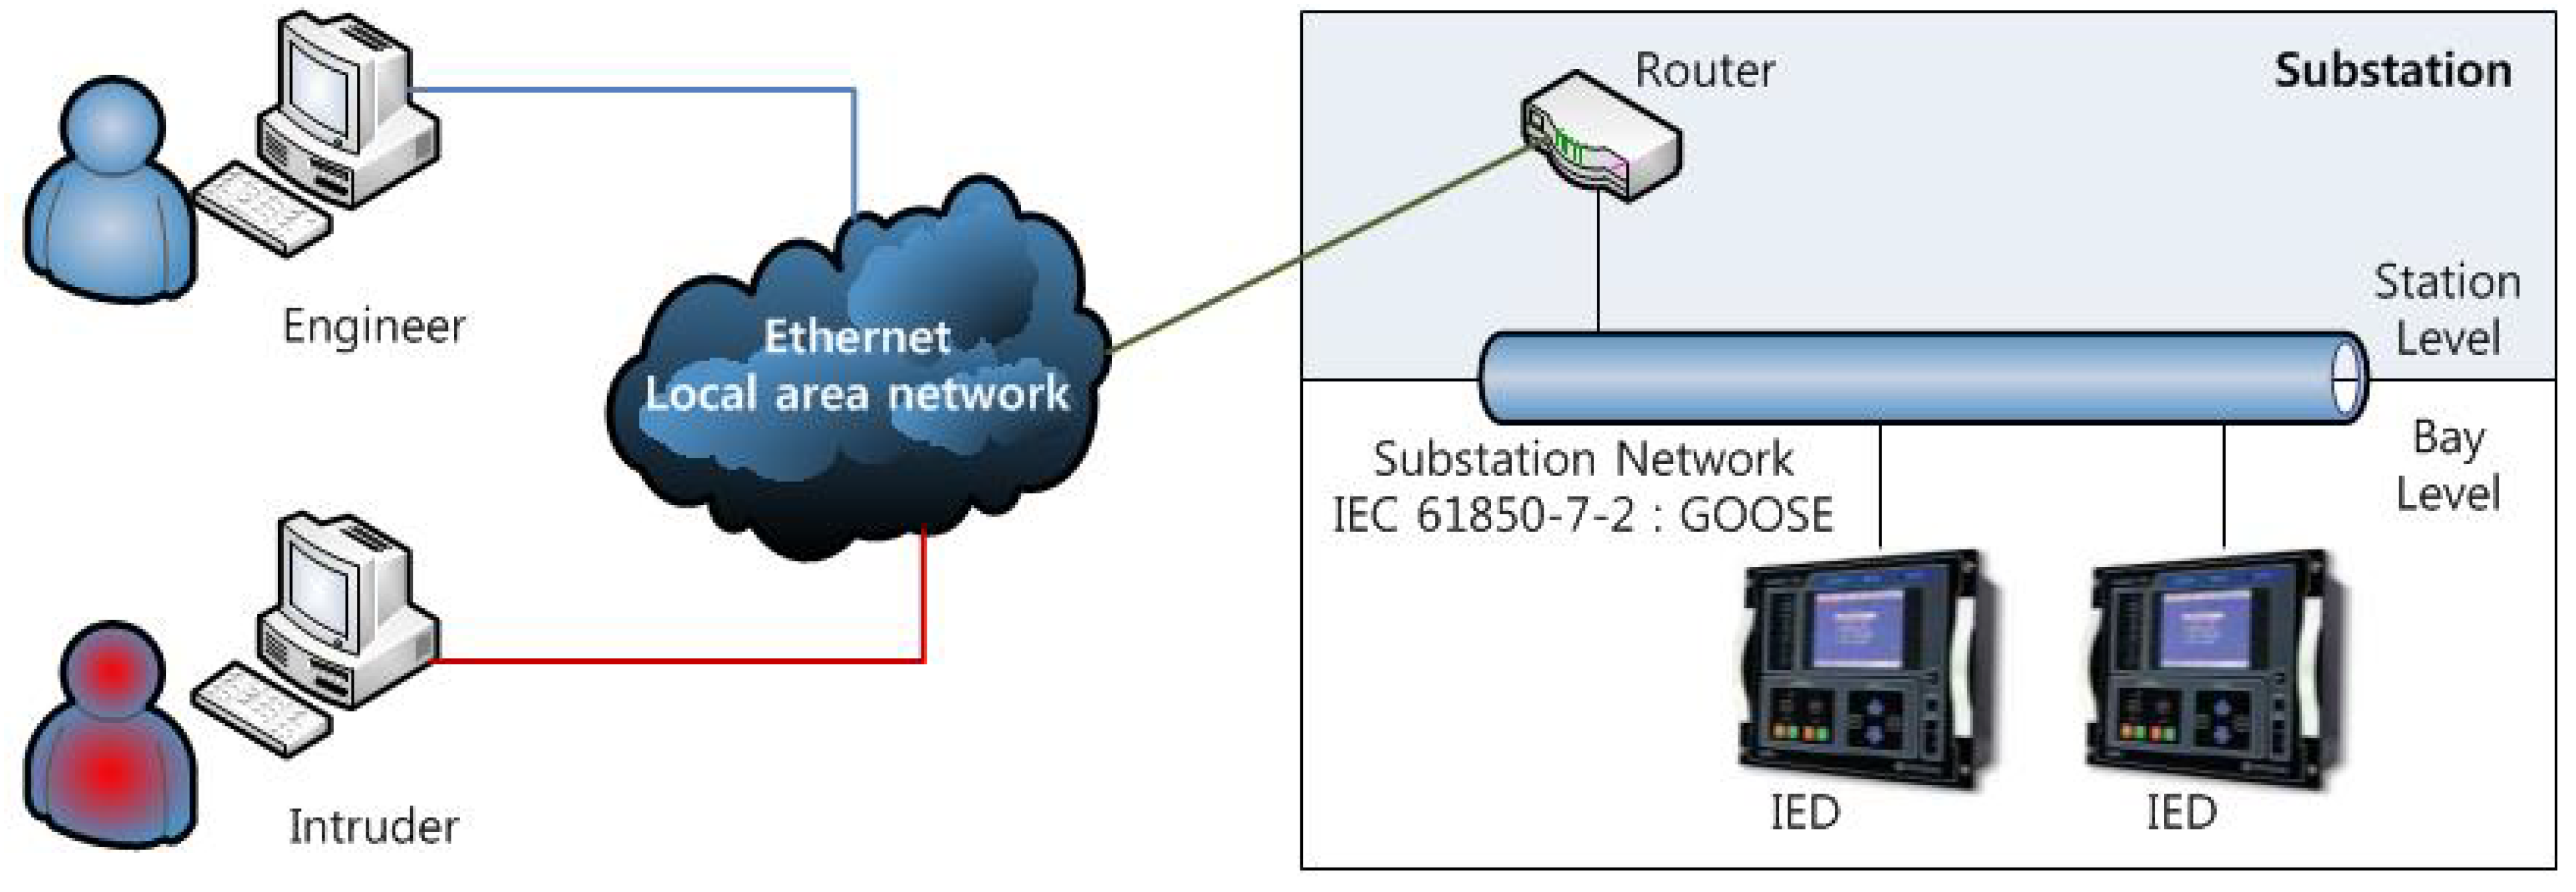
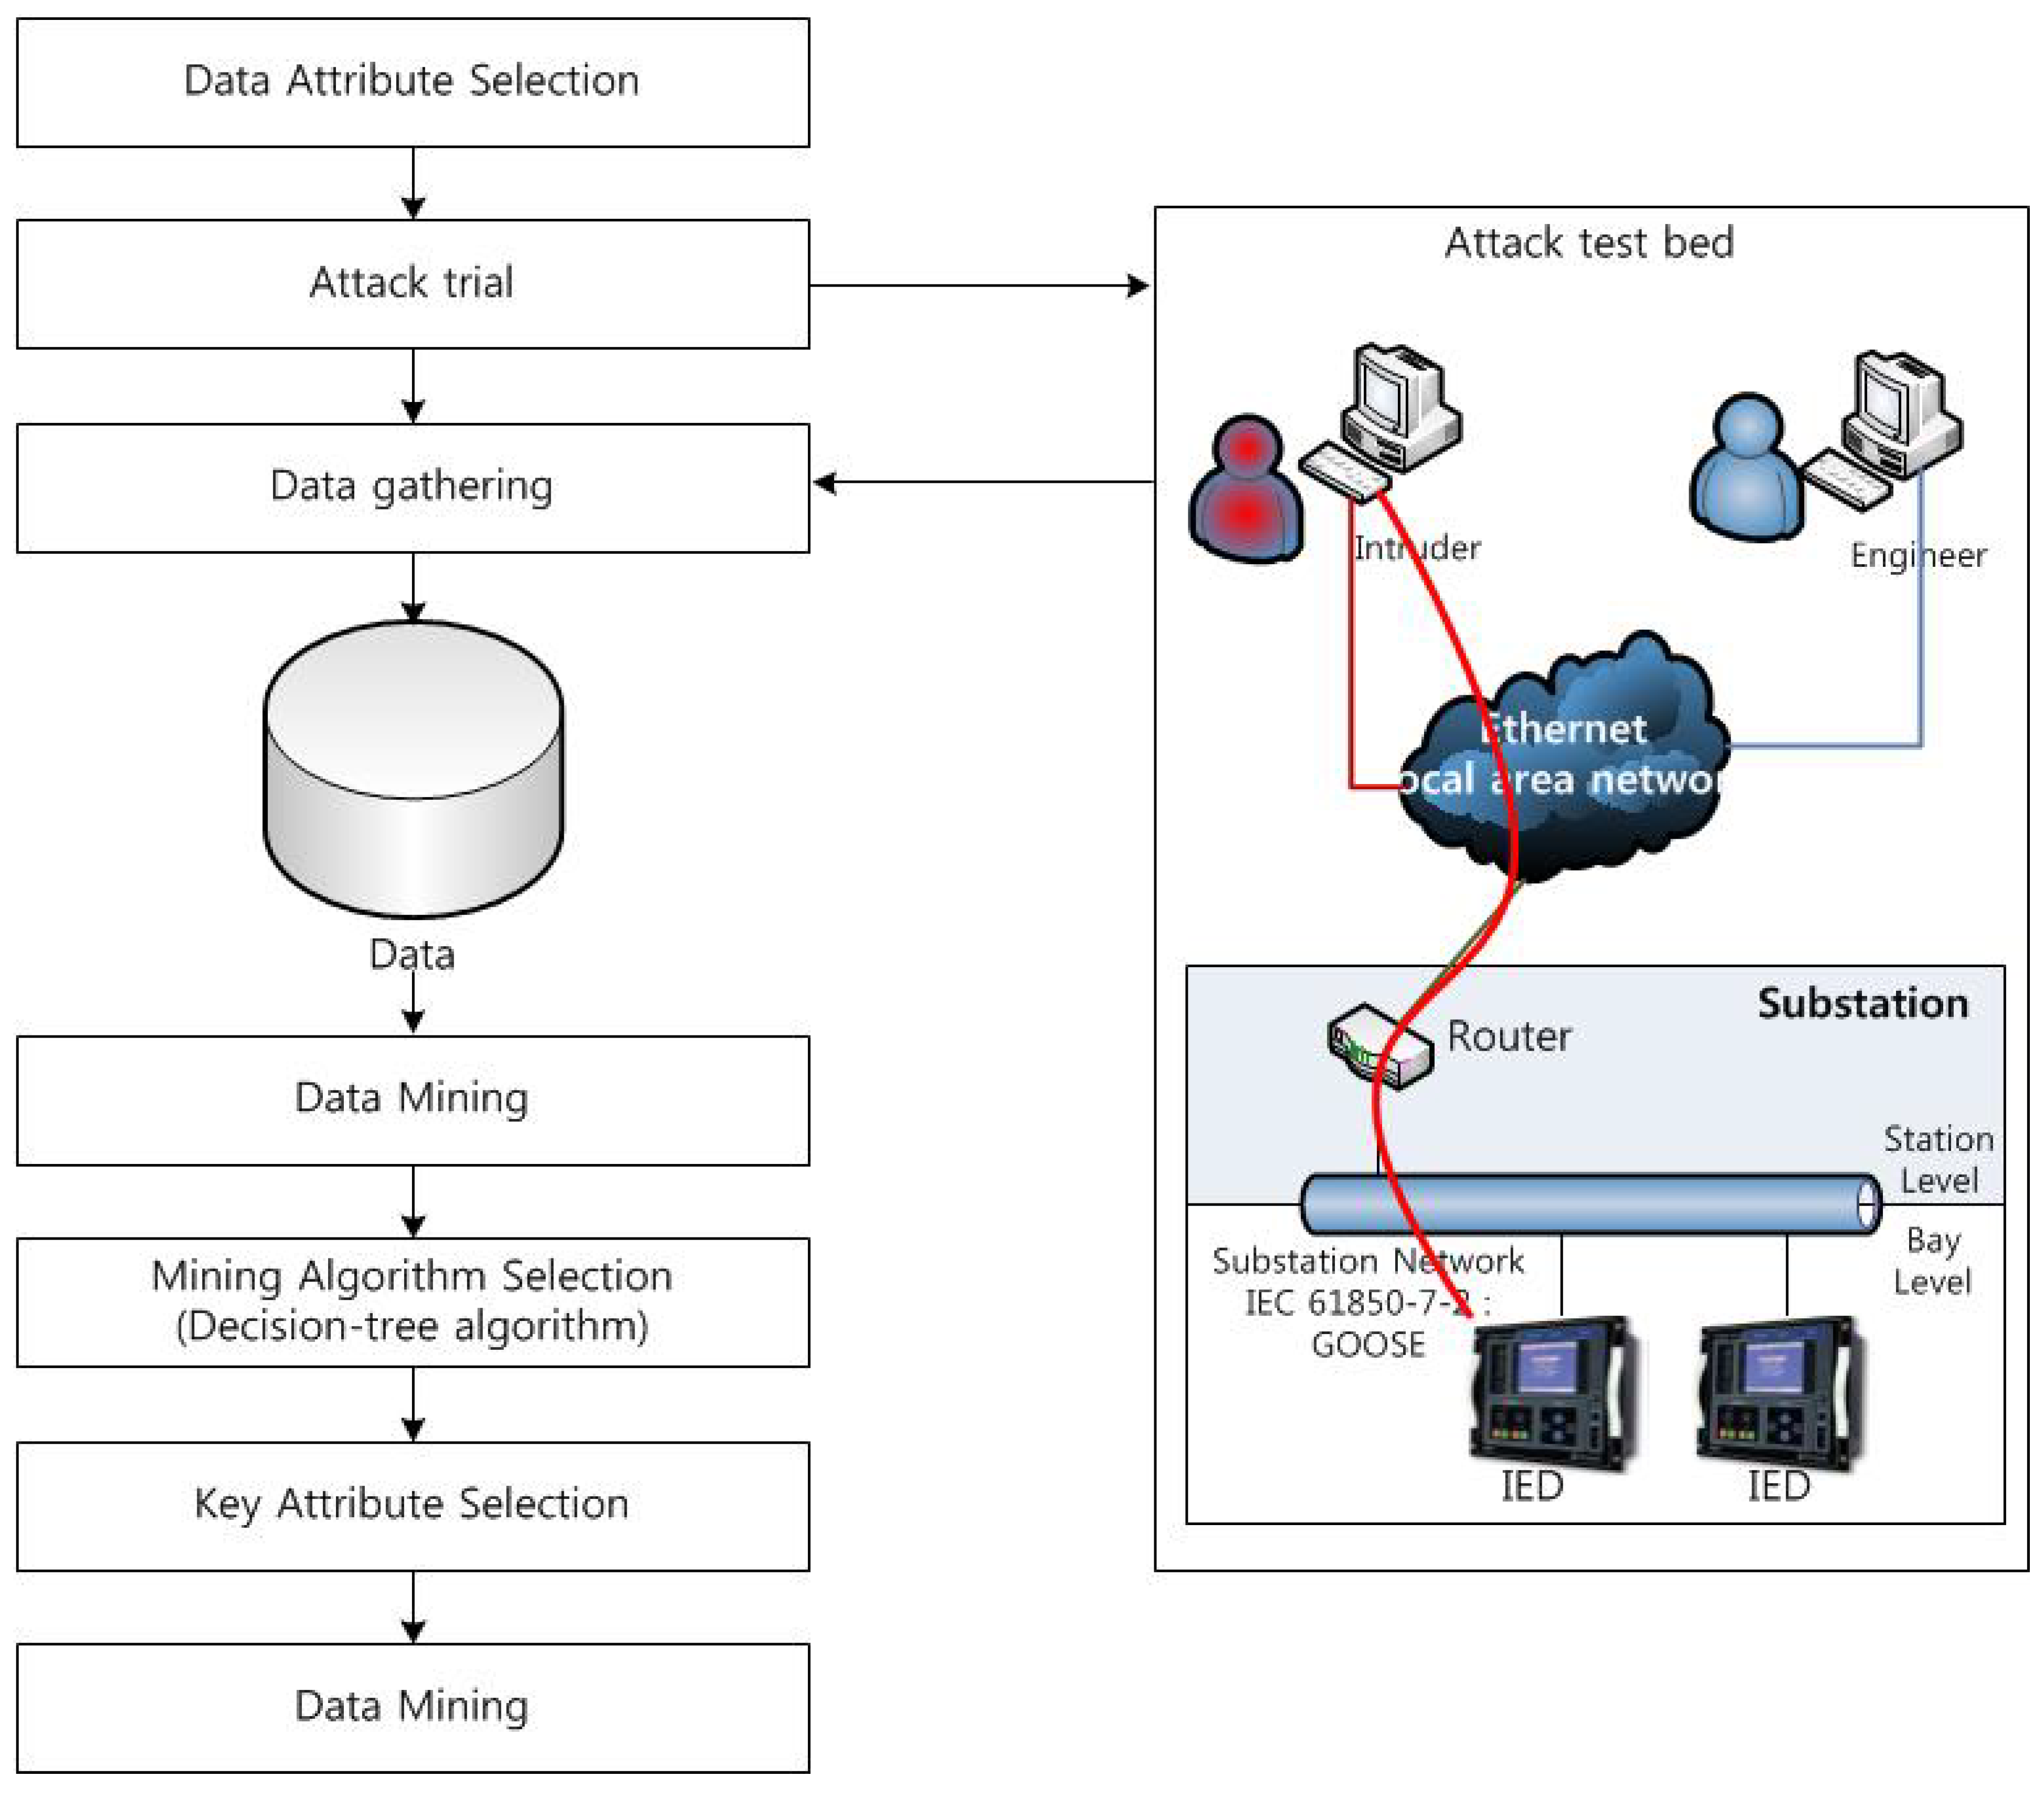
We try a SYN flood attack and a buffer overflow attack to cause a DoS attack on a smart grid environment, and experiment to find an efficient data mining mechanism for intrusion detection. The attack test bed is as shown in
Figure 1. Our attack test bed consists of the substation and local area network. The substation originally divides into three levels: process level including the I/O devices, intelligent sensors and actuators, bay level including the protection and control IEDs, and station level including the substation computer, operators desk, and the interfaces with outside the substation [
15,
17,
18]. However, we depict only two levels: bay level and station level because our attack experiments only need two levels. We use a personal computer (PC) that is similar to an intelligent electronic device (IED)—CPU: 550 MHz, Memory: 256 MB—that is a target, and transmit an attack message using a general object oriented substation event (GOOSE) [
19] data format.
Figure 1.
Attack test bed.
Figure 1.
Attack test bed.
An IED is a microprocessor-based controller of power system equipment. IEDs receive data from sensors and power equipment, and can issue control commands, such a tripping circuit breakers if they sense voltage, current, or frequency anomalies, or raise/lower voltage levels in order to maintain the desired level.
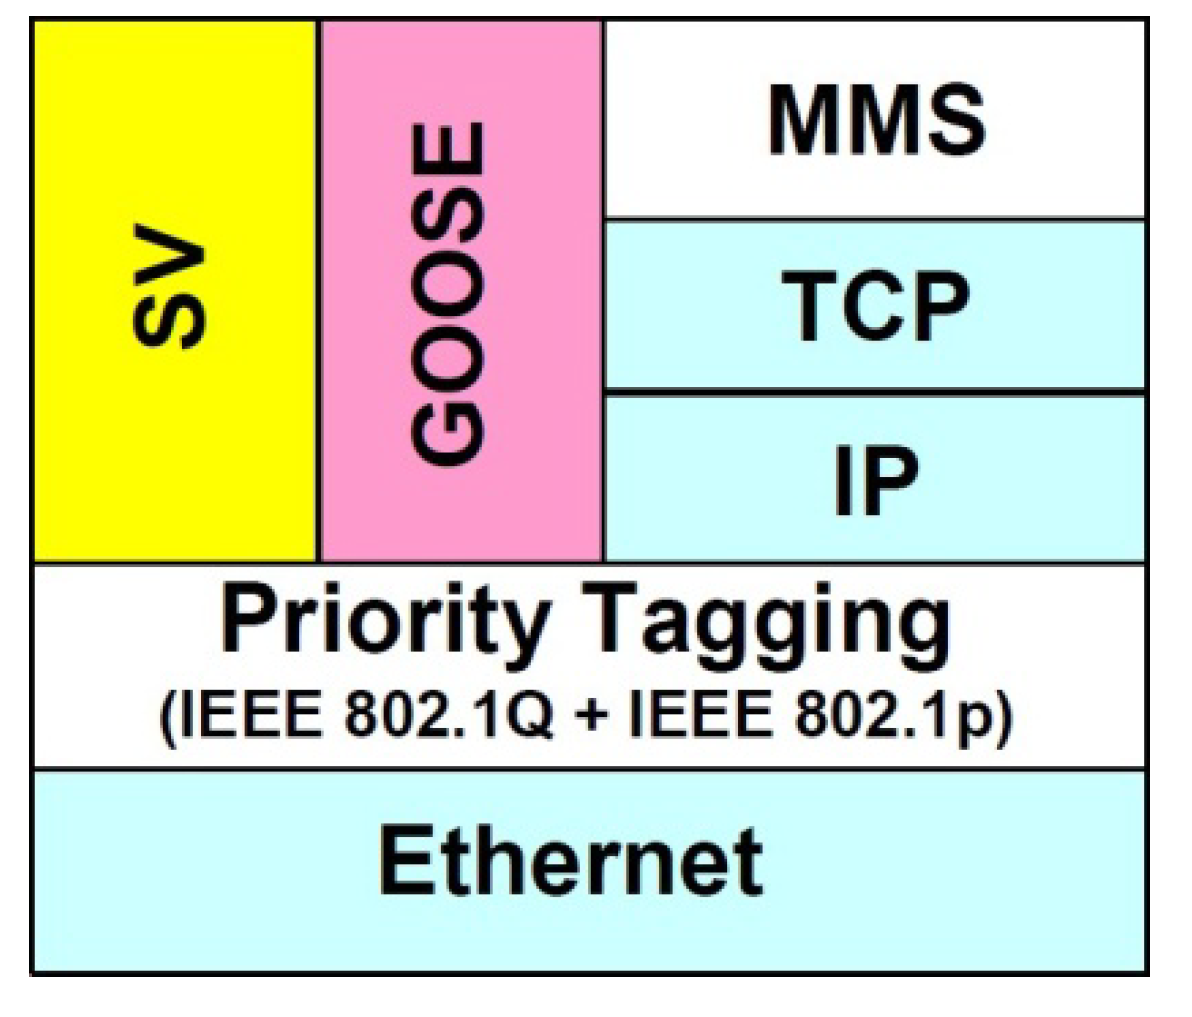
IEC 61850-7-2 [
19] is a standard for communication between IEDs, and defines GOOSE communication stacks. GOOSE transmits trip commands and interlocking information with high priority frames, and ensures that these frames are handled with priority within all participating IEDs [
20].
Figure 2 depicts a GOOSE communication stack.
Figure 2.
GOOSE communication stacks [
20] (Copyright ABB).
Figure 2.
GOOSE communication stacks [
20] (Copyright ABB).
An attacker tries a SYN flood attack and a buffer overflow attack using a GOOSE message through a router. We use a publish/subscribe communication model as a routing mechanism in this test system. The publish/subscribe communication model is designed for serving this special GOOSE communication requirements of the IEC 61850 standard. The publish/subscribe communication model is basically an added feature to the normal TCP/IP client/server model, any GOOSE message can be multicast by the sender (so called publisher) to the receiver(s) [so called subscriber(s)]. The main difference is that multicast group addresses are used instead of IP addresses [
21]. The attacker tries a SYN flood attack and a buffer overflow attack by simultaneously sending a number of point to point GOOSE message through a router.
We analyze those attacks, and select data attributes for the use of data mining methods, and then collect data based on these attributes. Next, we run several data mining methods with collected data, using the Waikato Environment for Knowledge Analysis (WEKA) [
22], and derive data mining methods showing the highest detection rate.
4.2. Modeling and Detection Process
We therefore implement a possible DoS attack in a smart grid environment, to experiment to find data mining methods with a better detection rate.
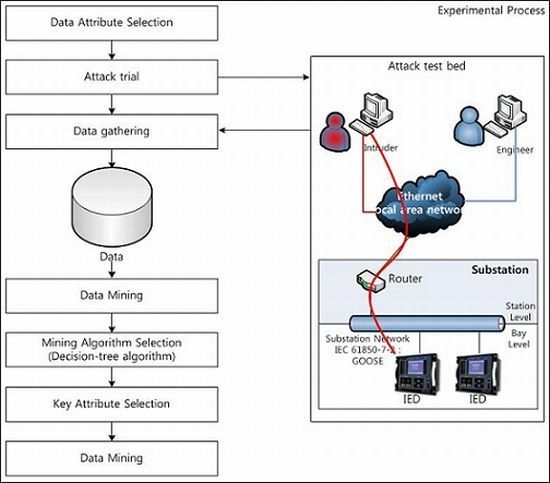
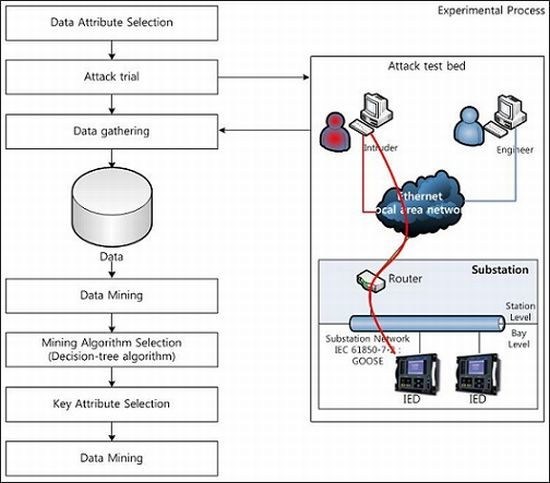
Figure 3 depicts the experimental process.
4.2.1. Data Attribute Selection
We analyze attacks, and select data attributes for collection and detection. In this experiment, we analyze a SYN flood attack and a buffer overflow attack, and select data attributes for better detection of the SYN flood attack. First, we analyze the NSM requirements for each attack and select data attributes. After that, we monitor each attack with our monitoring tool during each attack experiment and select additional data attributes.
4.2.2. Attack Trial
We construct an attack test bed as shown in
Figure 3, run a SYN flood attack and a buffer overflow attack, and then collect data related to data attributes.
4.2.3. Data Gathering
Before the attack attempts, we collect data related to data attributes in the normal status. After the attack attempts, we create a data set collected by the relevant data attributes.
4.2.4. Data Mining
The normal state data and attack state data are input into the WEKA program, all of the mining algorithms that are automatically selected are run, and the results are compared with the detection rate.
Figure 3.
Experimental process.
Figure 3.
Experimental process.
4.2.5. Mining Algorithm Selection
After all mining algorithms in the previous step are compared and analyzed, decision tree algorithms with the best detection rate are selected.
4.2.6. Key Attribute Selection
Selected decision tree algorithms in the previous step show the decision tree with attributes as a result. We select key attributes in the top levels of the tree.
4.2.7. Data Mining
All mining algorithms are run with selected key attributes. After that, we compare and analyze between results, with key attributes, and results with all attributes.
5. Experimental Results
In this section, the proposed experiments and the results of this experiment about two attacks show respectively depending on the process.
5.1. SYN Flood Attack
The SYN flood attack is a classic means of DoS attack. The SYN flood attack exploits the TCP’s three-way handshake mechanism and its limitation in maintaining half-open connections. When a server receives a SYN request, it returns a SYN/ACK packet to the client. Until the SYN/ACK packet is acknowledged by the client, the connection remains in a half-open state for a period of up to the TCP connection timeout, which is typically set to 75 s. If a SYN request is spoofed, the victim server will never receive the final ACK packet to complete the three-way handshake. Flooding spoofed SYN requests can easily exhaust the victim server’s backlog queue, causing all incoming SYN requests to be dropped [
3].
5.1.1. Data Attribute Selection
Table 1 details the selected attributes after analysis of the SYN flood attack.
Table 1.
SYN flood attack—attributes.
Table 1.
SYN flood attack—attributes.
| Attribute | Description |
|---|
| Traffic count | all count of packets during communication |
| Time of round trip (s) | the time that the traffic spent |
| Average packets/s | average count of packets per second |
| Average packets size | average packets size |
| Total transmission packets (bytes) | all count of bytes during communication |
| Average B/s | average count of byte per second |
| Average Mbit/s | average count of megabit per second |
| 40–79 packets count | the count of packets which packet length is between 40 and 79 |
| 40–79 rate | average count of packets per ms (1 s = 103 ms); the packet length is between 40 and 79 |
| 40–79 percent | the percentage that the packet occupied ; the packet length between 40 and 79 |
| 320–639 packets count | the count of packets which packet length is between 320 and 639 |
| 320–639 rate | average count of packets per ms; the packet length is between 320 and 639 |
| 320–639 percent | the percentage that the packet occupied ; the packet length between 320 and 639 |
| CPU percent | the usage of CPU when traffic stopped |
| Memory used (kB) | the memory used when traffic stopped |
| Buffer size (kB) | the buffer used when traffic stopped |
5.1.2. Attack Trial and Data Gathering
The attacker tries 100 times to attack the victim IED. The attacker continually transmits a SYN packet to the victim IED. When the attack trial starts, the data relevant attributes are captured three times, once every minute, so a total of 300 data are collected. Normal data is also captured once every minute, so 300 normal data are captured. As a result, 300 normal state data and 300 attack state data are collected.
5.1.3. Data Mining
The 300 normal data and 300 attack data generated in the previous step are input into the WEKA, and then the available data mining algorithms are run to obtain the detection rate. The results are show in
Table 2.
Table 2.
SYN flood attack—data mining results.
Table 2.
SYN flood attack—data mining results.
| Detection rate | Mining algorithms |
|---|
| 99.833% | bayes.BayesNet, bayes.NaiveBayesUpdateable, bayes.NaiveBayes, lazy.KStar, functions.SimpleLogistic, functions.RBFNetwork, functions.SMO, functions.Spegasos, lazy.LWL, lazy.IB1, lazy.IBk, meta.AdaBoostM1, meta.AttributeSelectedClassifier, rules.DTNB, meta.FilteredClassifier, meta.RandomCommitte, meta.RotationForest, meta.RandomSubSpace, meta.MultiBoostAB, meta.Bagging, rules.DecisionTable, tree.NBTree, tree.LADTree, tree.RandomForest, rules.Ridor, tree.DecisionSutmp, tree.ADTree (30) |
| 99.667% | meta.OrdinalClassClassifier, tree.RandomTree, meta.nestedDataNearBalancedND, meta.nestedDichotomies.DataNearBalancedND, meta.ClassificationViaClustering, meta.END, rules.PART, meta.nestedDichotomies.ND, rules.Jrip, tree.J48graft, tree.J48 (11) |
| 99.5% | misc.VFI, rules.ConjunctiveRule, misc.Decorate, meta.ThresholdSelector (4) |
| 99.333% | meta.MultiClassClassifier, functions.Logistic, meta.Dagging (3) |
| 98.833% | functions.VotedPerceptron (1) |
| 98% | rules.NNge (1) |
| 96.833% | tree.REPTree (1) |
| 96.333% | misc.HyperPipes (1) |
| 95.5% | meta.ClassificationViaRegression, rules.OneR (2) |
| 54.833% | tree.BFTree, tree.SimpleCart (2) |
| 50% | meta.CVParameterSelection, meta.MultiScheme, meta.RacedIncrementalLogitBoost, meta.Grading, meta.Stacking, meta.StackingC, meta.Vote, rules.ZeroR (8) |
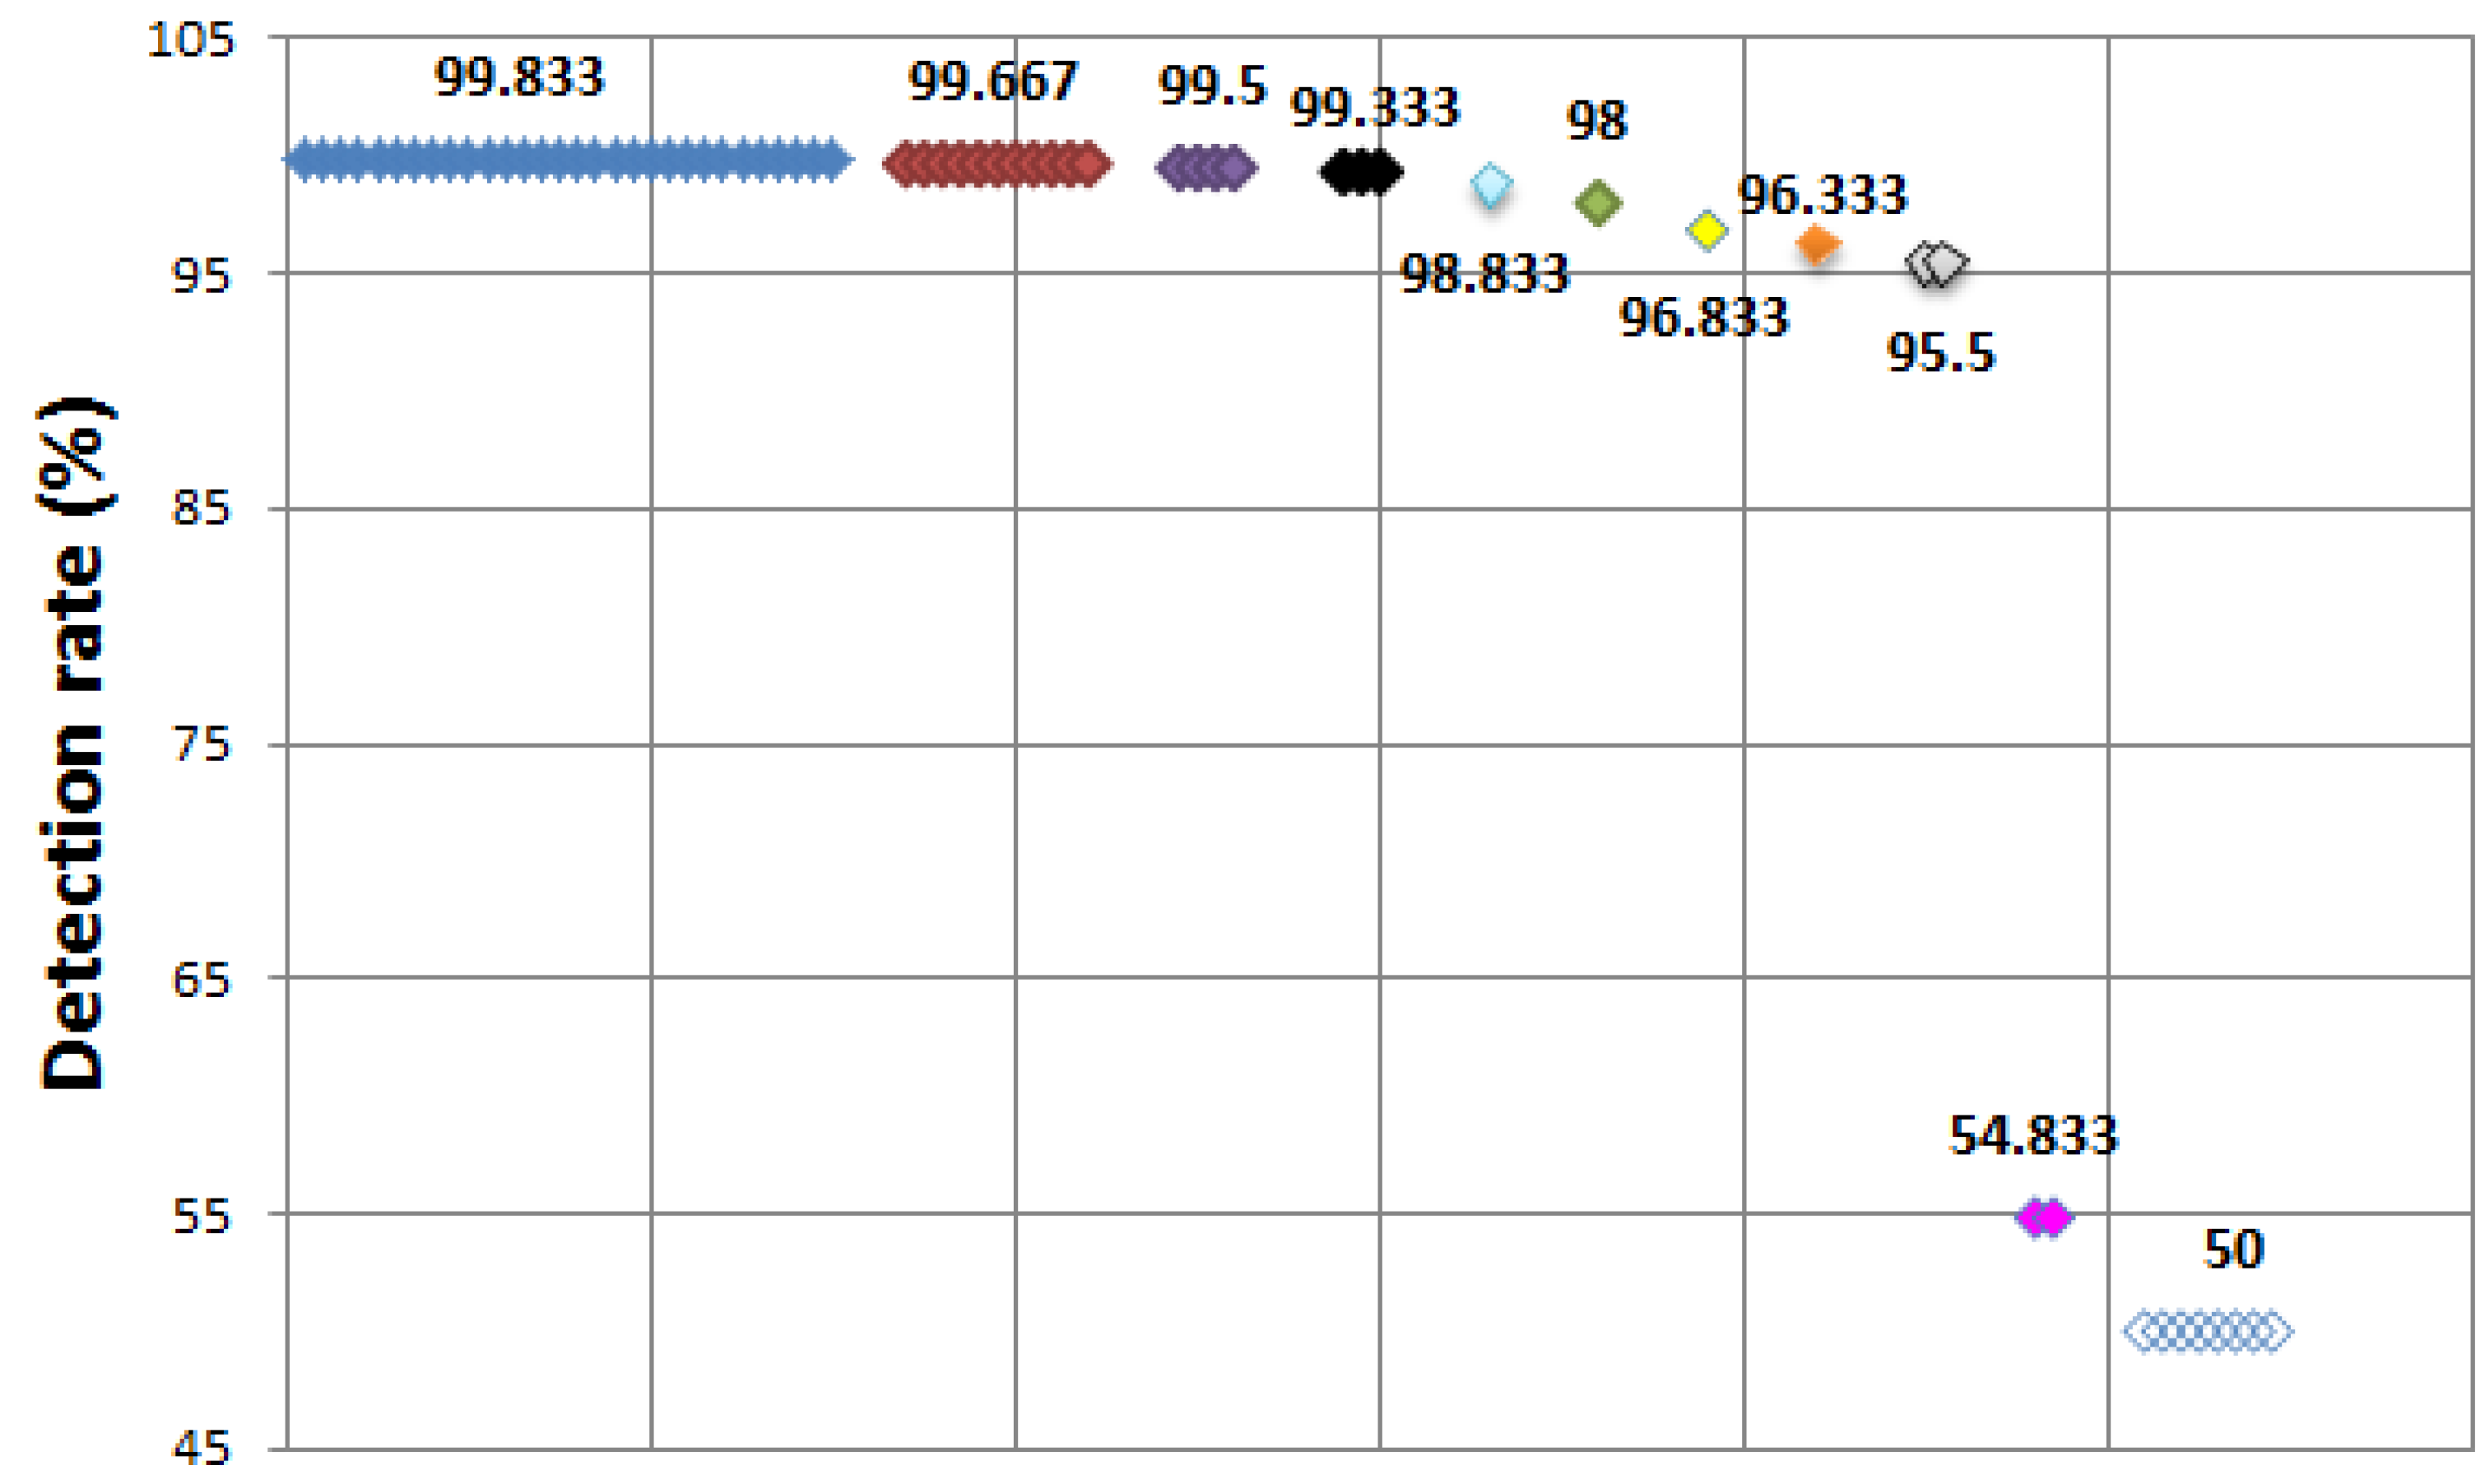
A total of 64 mining algorithms are performed and 30 algorithms including a tree. NBTree shows a 99.833% detection rate, followed by 11 algorithms that show a detection rate of 99.667%, four algorithms show 99.5%, three algorithms show 99.333%, one algorithm shows 98.833%, one algorithm shows 98%, one algorithm shows 96.833%, one algorithm shows 96.333%, two algorithms show 95.5%, thus 54 mining algorithms show a good detection rate. However, tree.SimpleCart and tree.BFTree show 54.833%, and eight algorithms including rules. ZeroR show the lowest detection rate of 50%.
Figure 4 depicts all detection rates of the SYN flood attack.
Figure 4.
SYN flood attack—detection rate (all).
Figure 4.
SYN flood attack—detection rate (all).
WEKA classifies the data mining algorithms as follows.
- -
Bayes: bayes classifier;
- -
Functions: neural network and support vector machines (SVM);
- -
Lazy: instance based classifier;
- -
Meta: combing algorithm;
- -
Misc: miscellaneous classifier including hyperpipes and voting feature intervals (VFI);
- -
Rules: rule-based classifier;
- -
Tree: decision tree classifier;
5.1.4. Mining Algorithm Selection and Key Attribute Selection
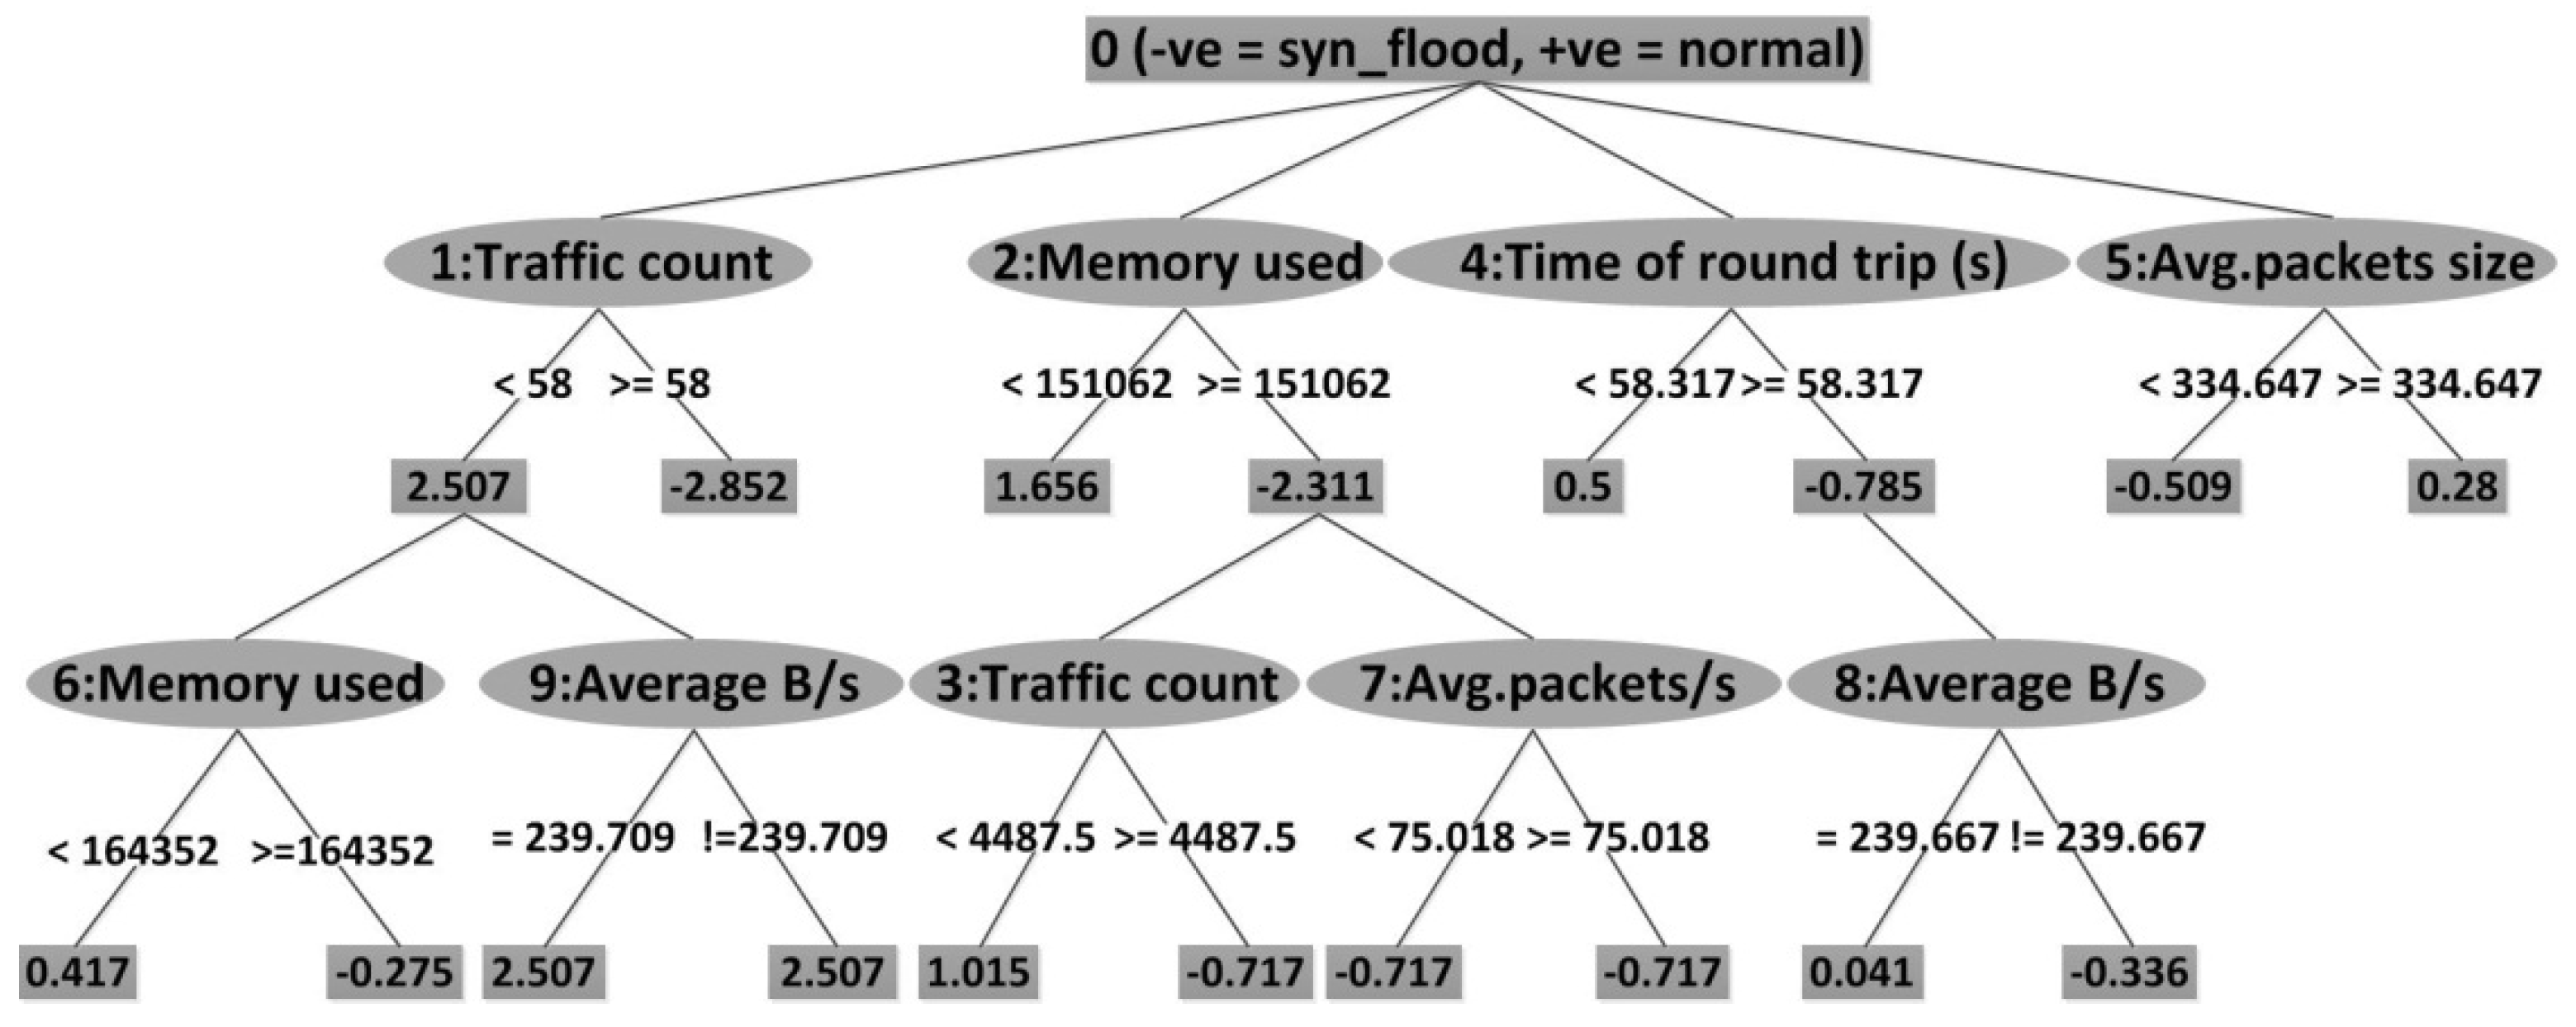
The Decision tree algorithms with the best detection rate in the above procedure are selected, and those algorithms show the decision tree as a result. Tree.ADTree and tree.LADTree are chosen.
An alternating decision tree (ADTree) [
23] is a machine learning method for classification. It is a class for generating an alternating decision tree. The underlying learning algorithm for ADTrees is AdaBoost. LADTree [
24] is a class for generating a multi-class decision tree, using LogitBoost strategy.
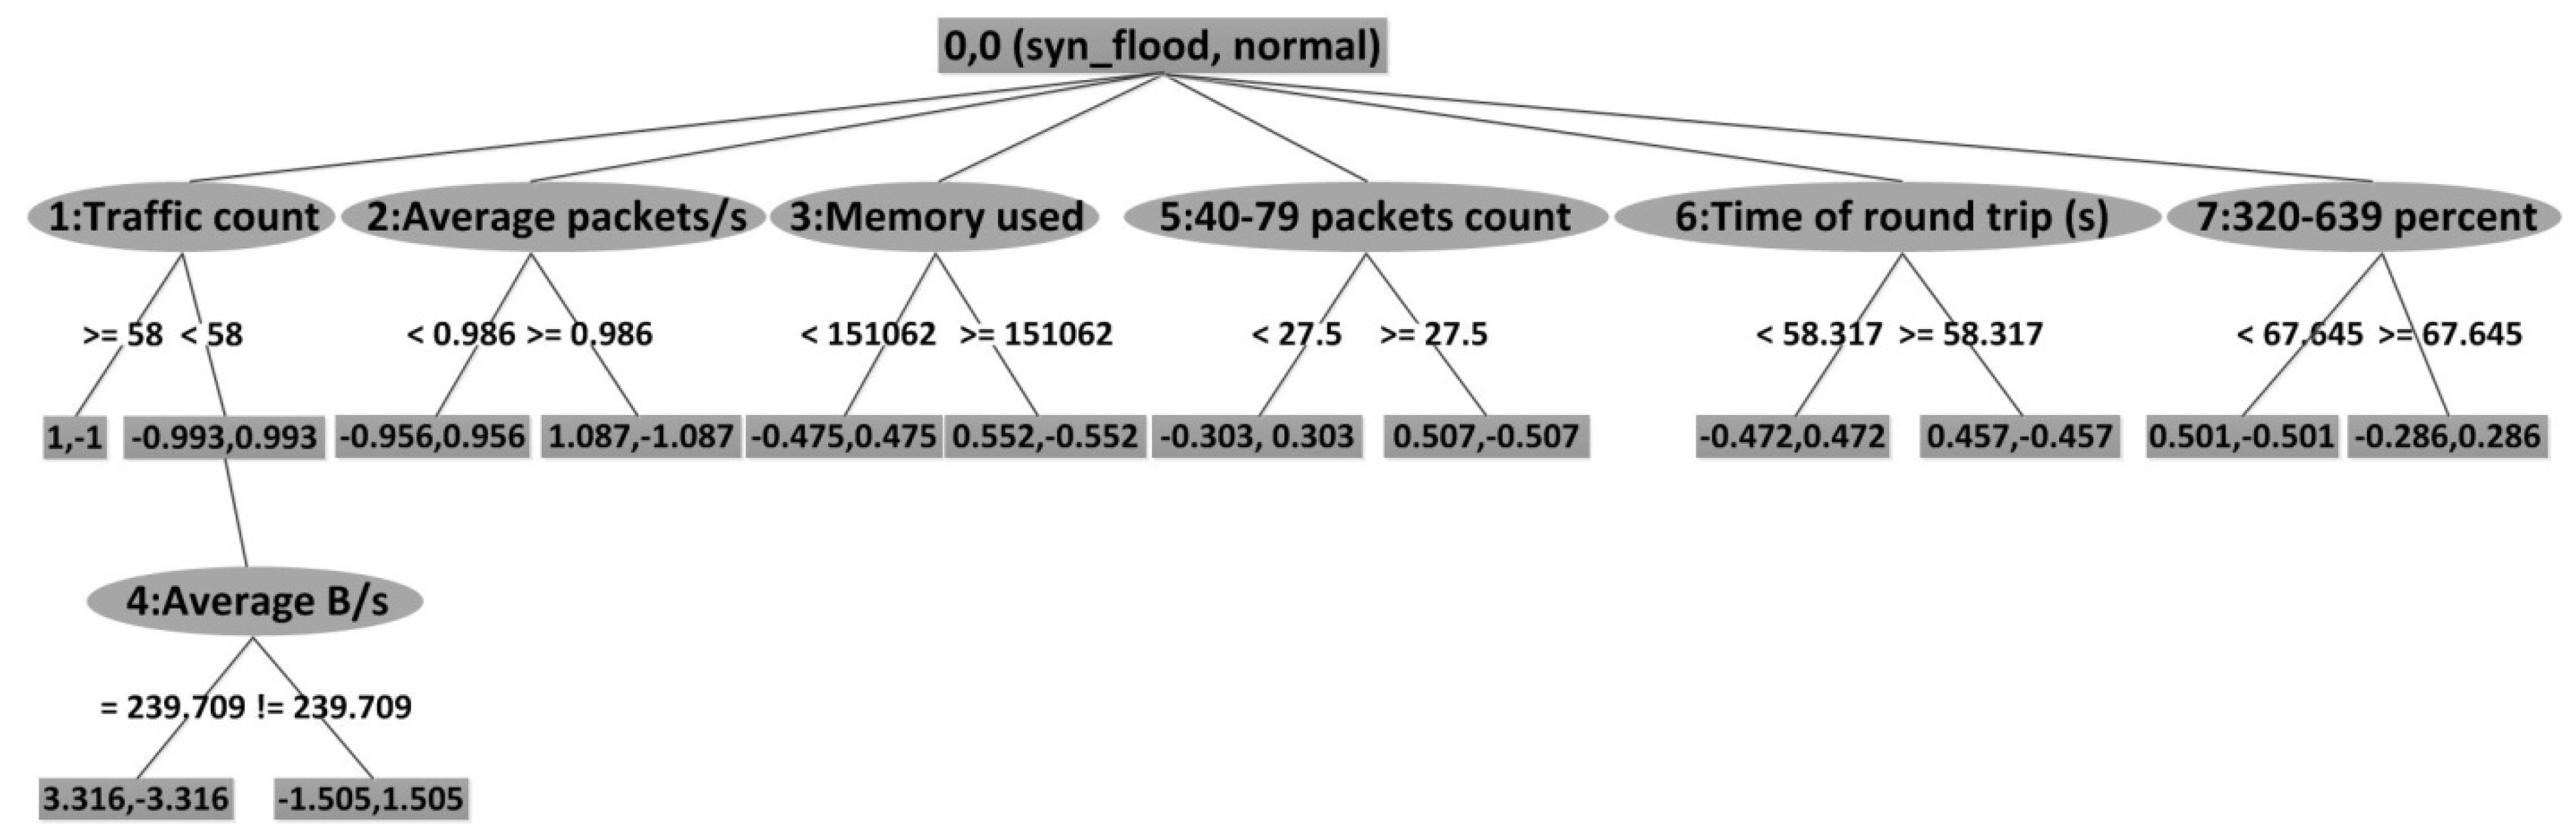
Traffic count, memory used, time of round trip (s), average packets size, average B/s, average packets/s are chosen as key attributes, as shown in
Figure 5. When LADTree is performed, traffic count, average packets/s, memory used, 40–79 packets count, time of round trip (s), 320–639 percent, and average B/s are chosen as key attributes.
Figure 6 depicts the results of LADTree.
Figure 5.
A result of ADTree.
Figure 5.
A result of ADTree.
Figure 6.
A result of LADTree.
Figure 6.
A result of LADTree.
5.1.5. Data Mining
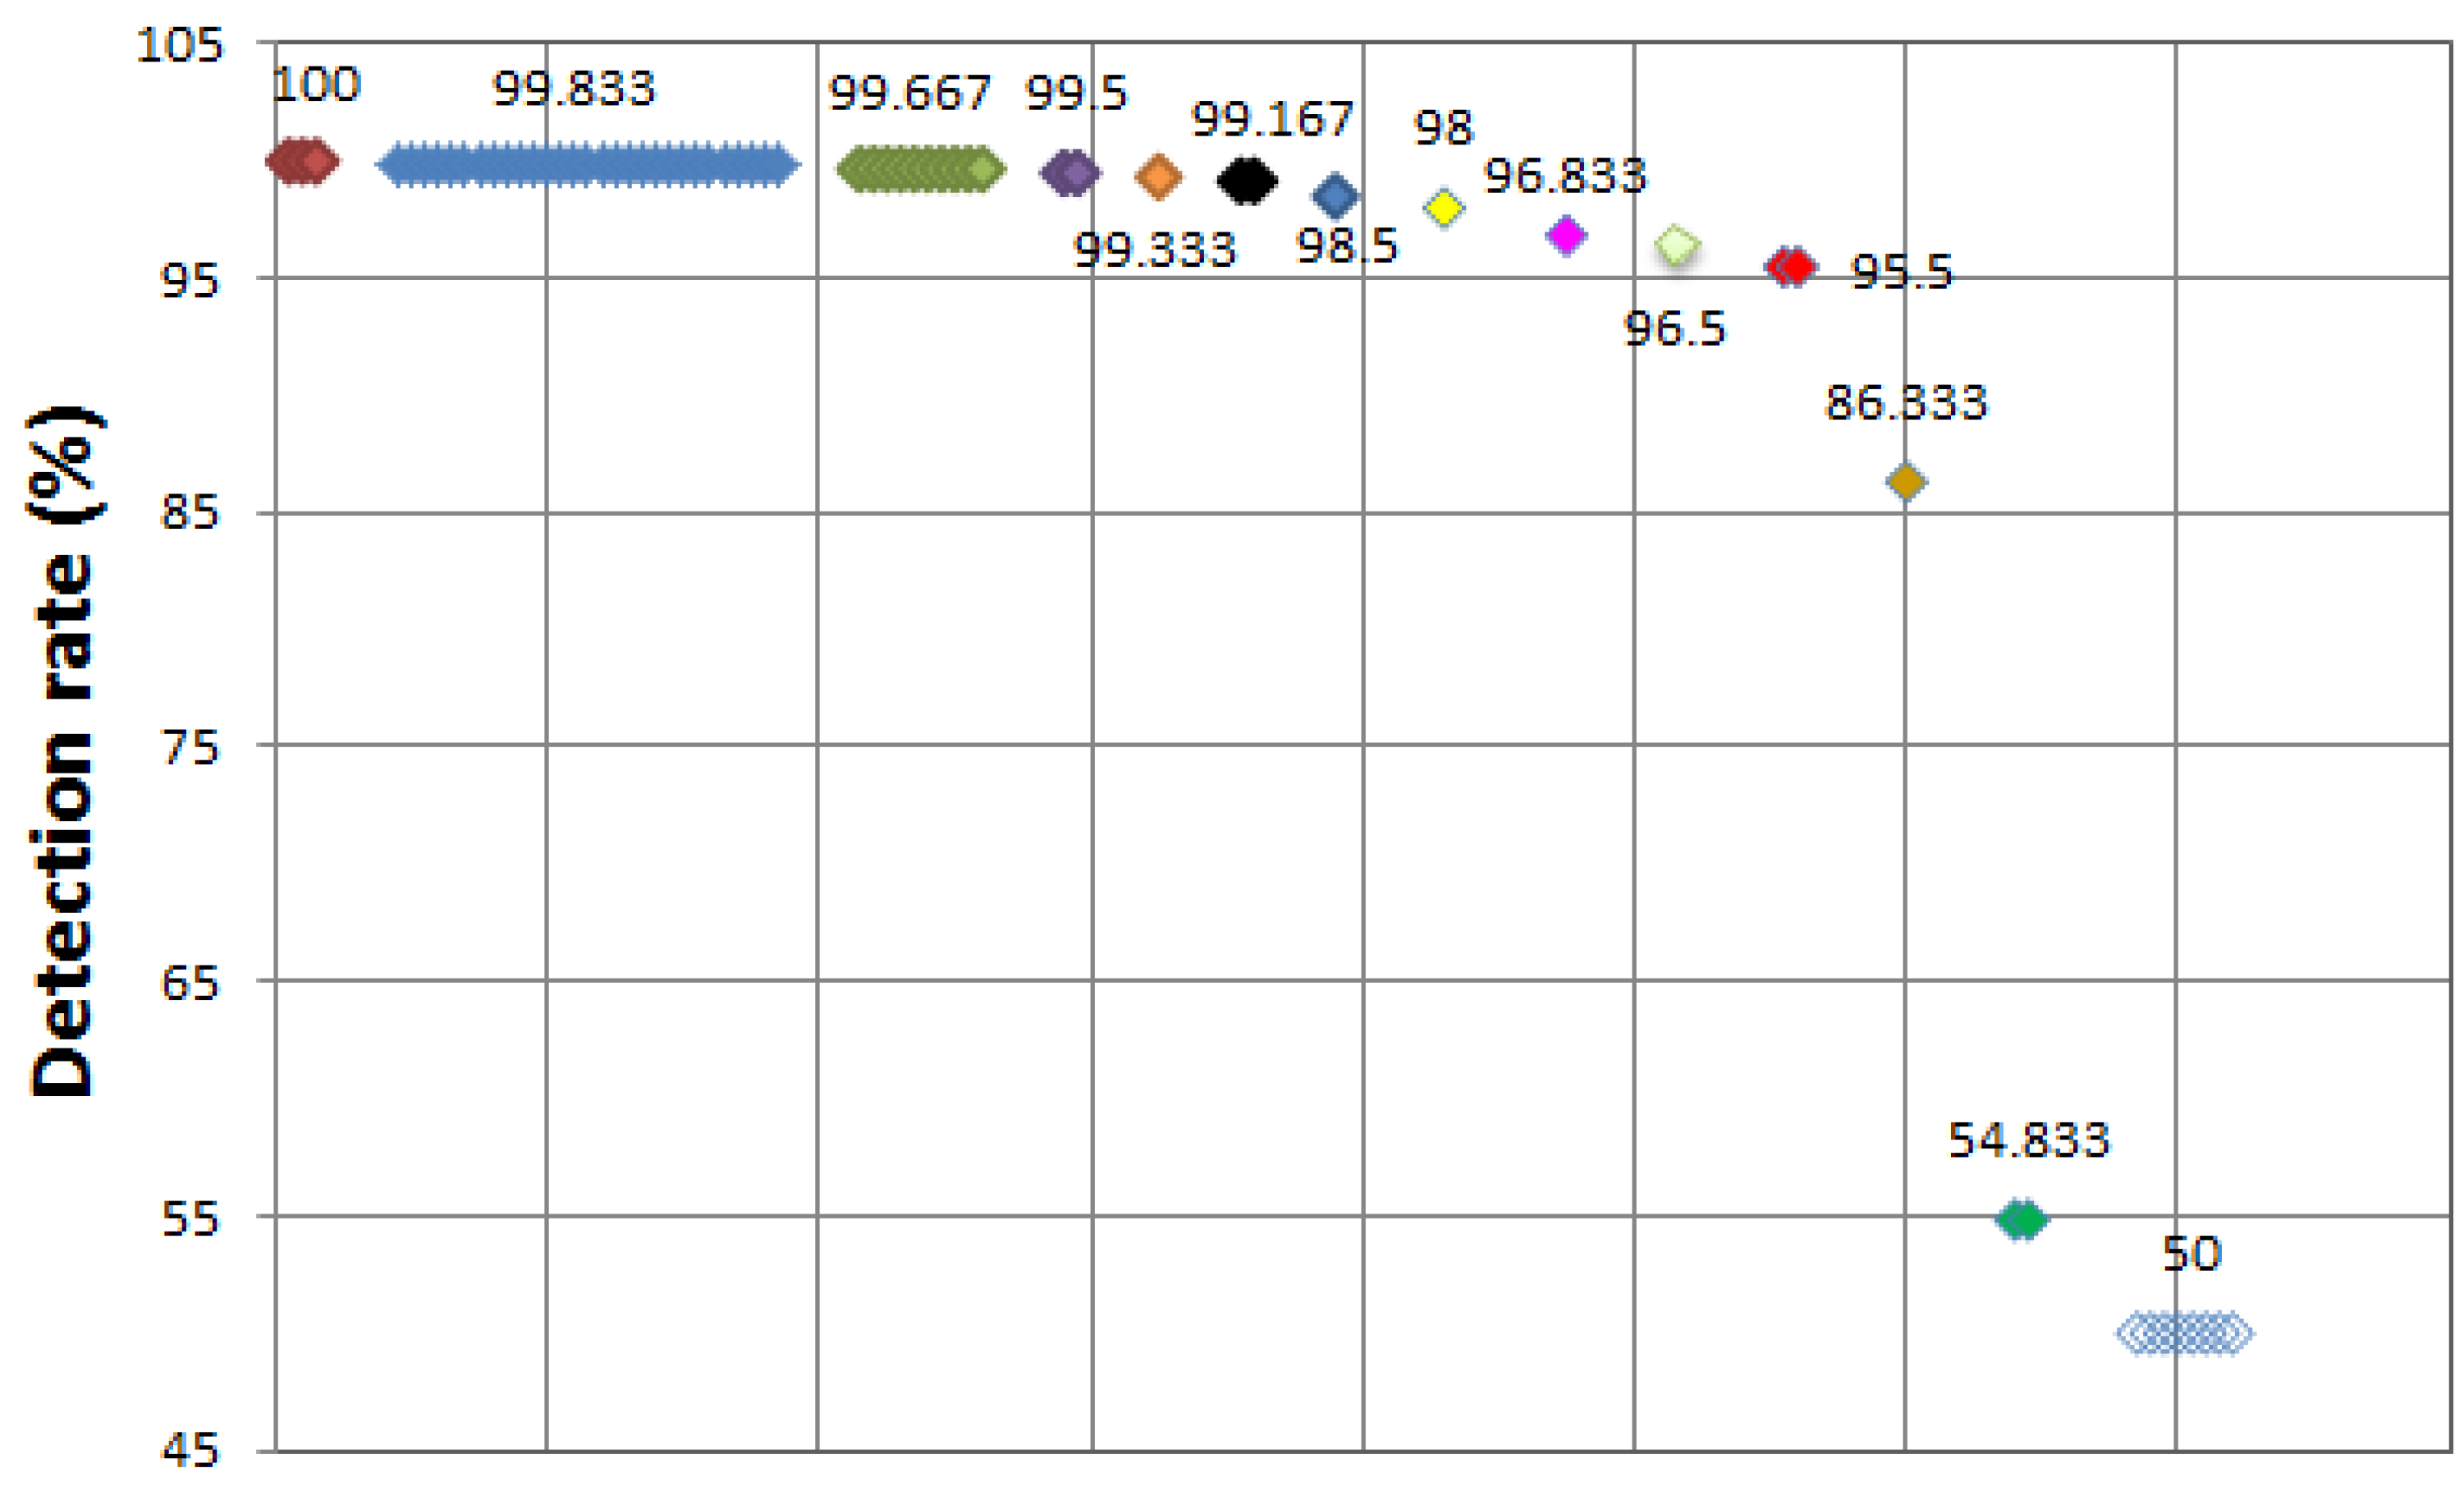
All possible mining algorithms are performed with selected key attributes, using ADTree in the previous procedure. The results are as shown in
Table 3. Three algorithms show a 100% detection rate, 29 algorithms show 99.833%, 10 algorithms show 99.667%, two algorithms show 99.5%, one algorithm shows 99.333%. The overall detection rate is better than before.
Table 3.
SYN flood attack—mining results with ADTree selection attributes.
Table 3.
SYN flood attack—mining results with ADTree selection attributes.
| Detection rate | Mining algorithms |
|---|
| 100% | functions.RBFNetwork, lazy.IBk, lazy.IB1 (3) |
| 99.833% | bayes.BayesNet, bayes.NaiveBayesUpdateable, bayes.NaiveBayes, lazy.LWL, functions.SimpleLogistic, functions.SMO, functions.Spegasos, meta.AdaBoostM1, lazy.KStar, meta.Bagging, meta.AttributeSelectedClassifier, meta.Dagging, meta.ClassificationViaClustering, meta.FilteredClassifier, meta.RotationForest, meta.MultiBoostAB, meta.RandomCommitte, meta.RandomSubSpace, rules.Jrip, rules.DecisionTable, tree,ADTree, tree.DecisionSutmp, tree.RandomForest, tree.LADTree, tree.NBTree, tree.LMT, tree.FT, rules.DTNB (29) |
| 99.667% | meta.OrdinalClassClassifier, meta.nestedDichotomies.ClassBalancedND, meta.END, meta.nestedDichotomies.DataNearBalancedND, meta.nestedDichotomies.ND, meta.Decorate, rules.PART, rules.Ridor, tree.J48graft, tree.J48 (10) |
| 99.5% | misc.VFI, rules.ConjunctiveRule (2) |
| 99.333% | meta.ThresholdSelector (1) |
| 99.167% | functions.Logistic, meta.MultiClassClassifier (2) |
| 98.5% | tree.RandomTree (1) |
| 98% | rules.NNge (1) |
| 96.833% | tree.REPTree (1) |
| 96.5% | misc.HyperPipes (1) |
| 95.5% | meta.ClassificationViaRegression, rules.OneR (2) |
| 86.333% | functions.VotedPerceptron (1) |
| 54.833% | tree.BFTree, tree.SimpleCart (2) |
| 50% | meta.CVParameterSelection, meta.RacedIncrementalLogitBoost, meta.Grading, meta.Stacking, meta.StackingC, meta.Vote, meta.MultiScheme, rules.ZeroR (8) |
Figure 7 depicts the result after key attributes selection using ADTree.
Figure 7.
SYN flood attack—detection rate (after ADTree).
Figure 7.
SYN flood attack—detection rate (after ADTree).
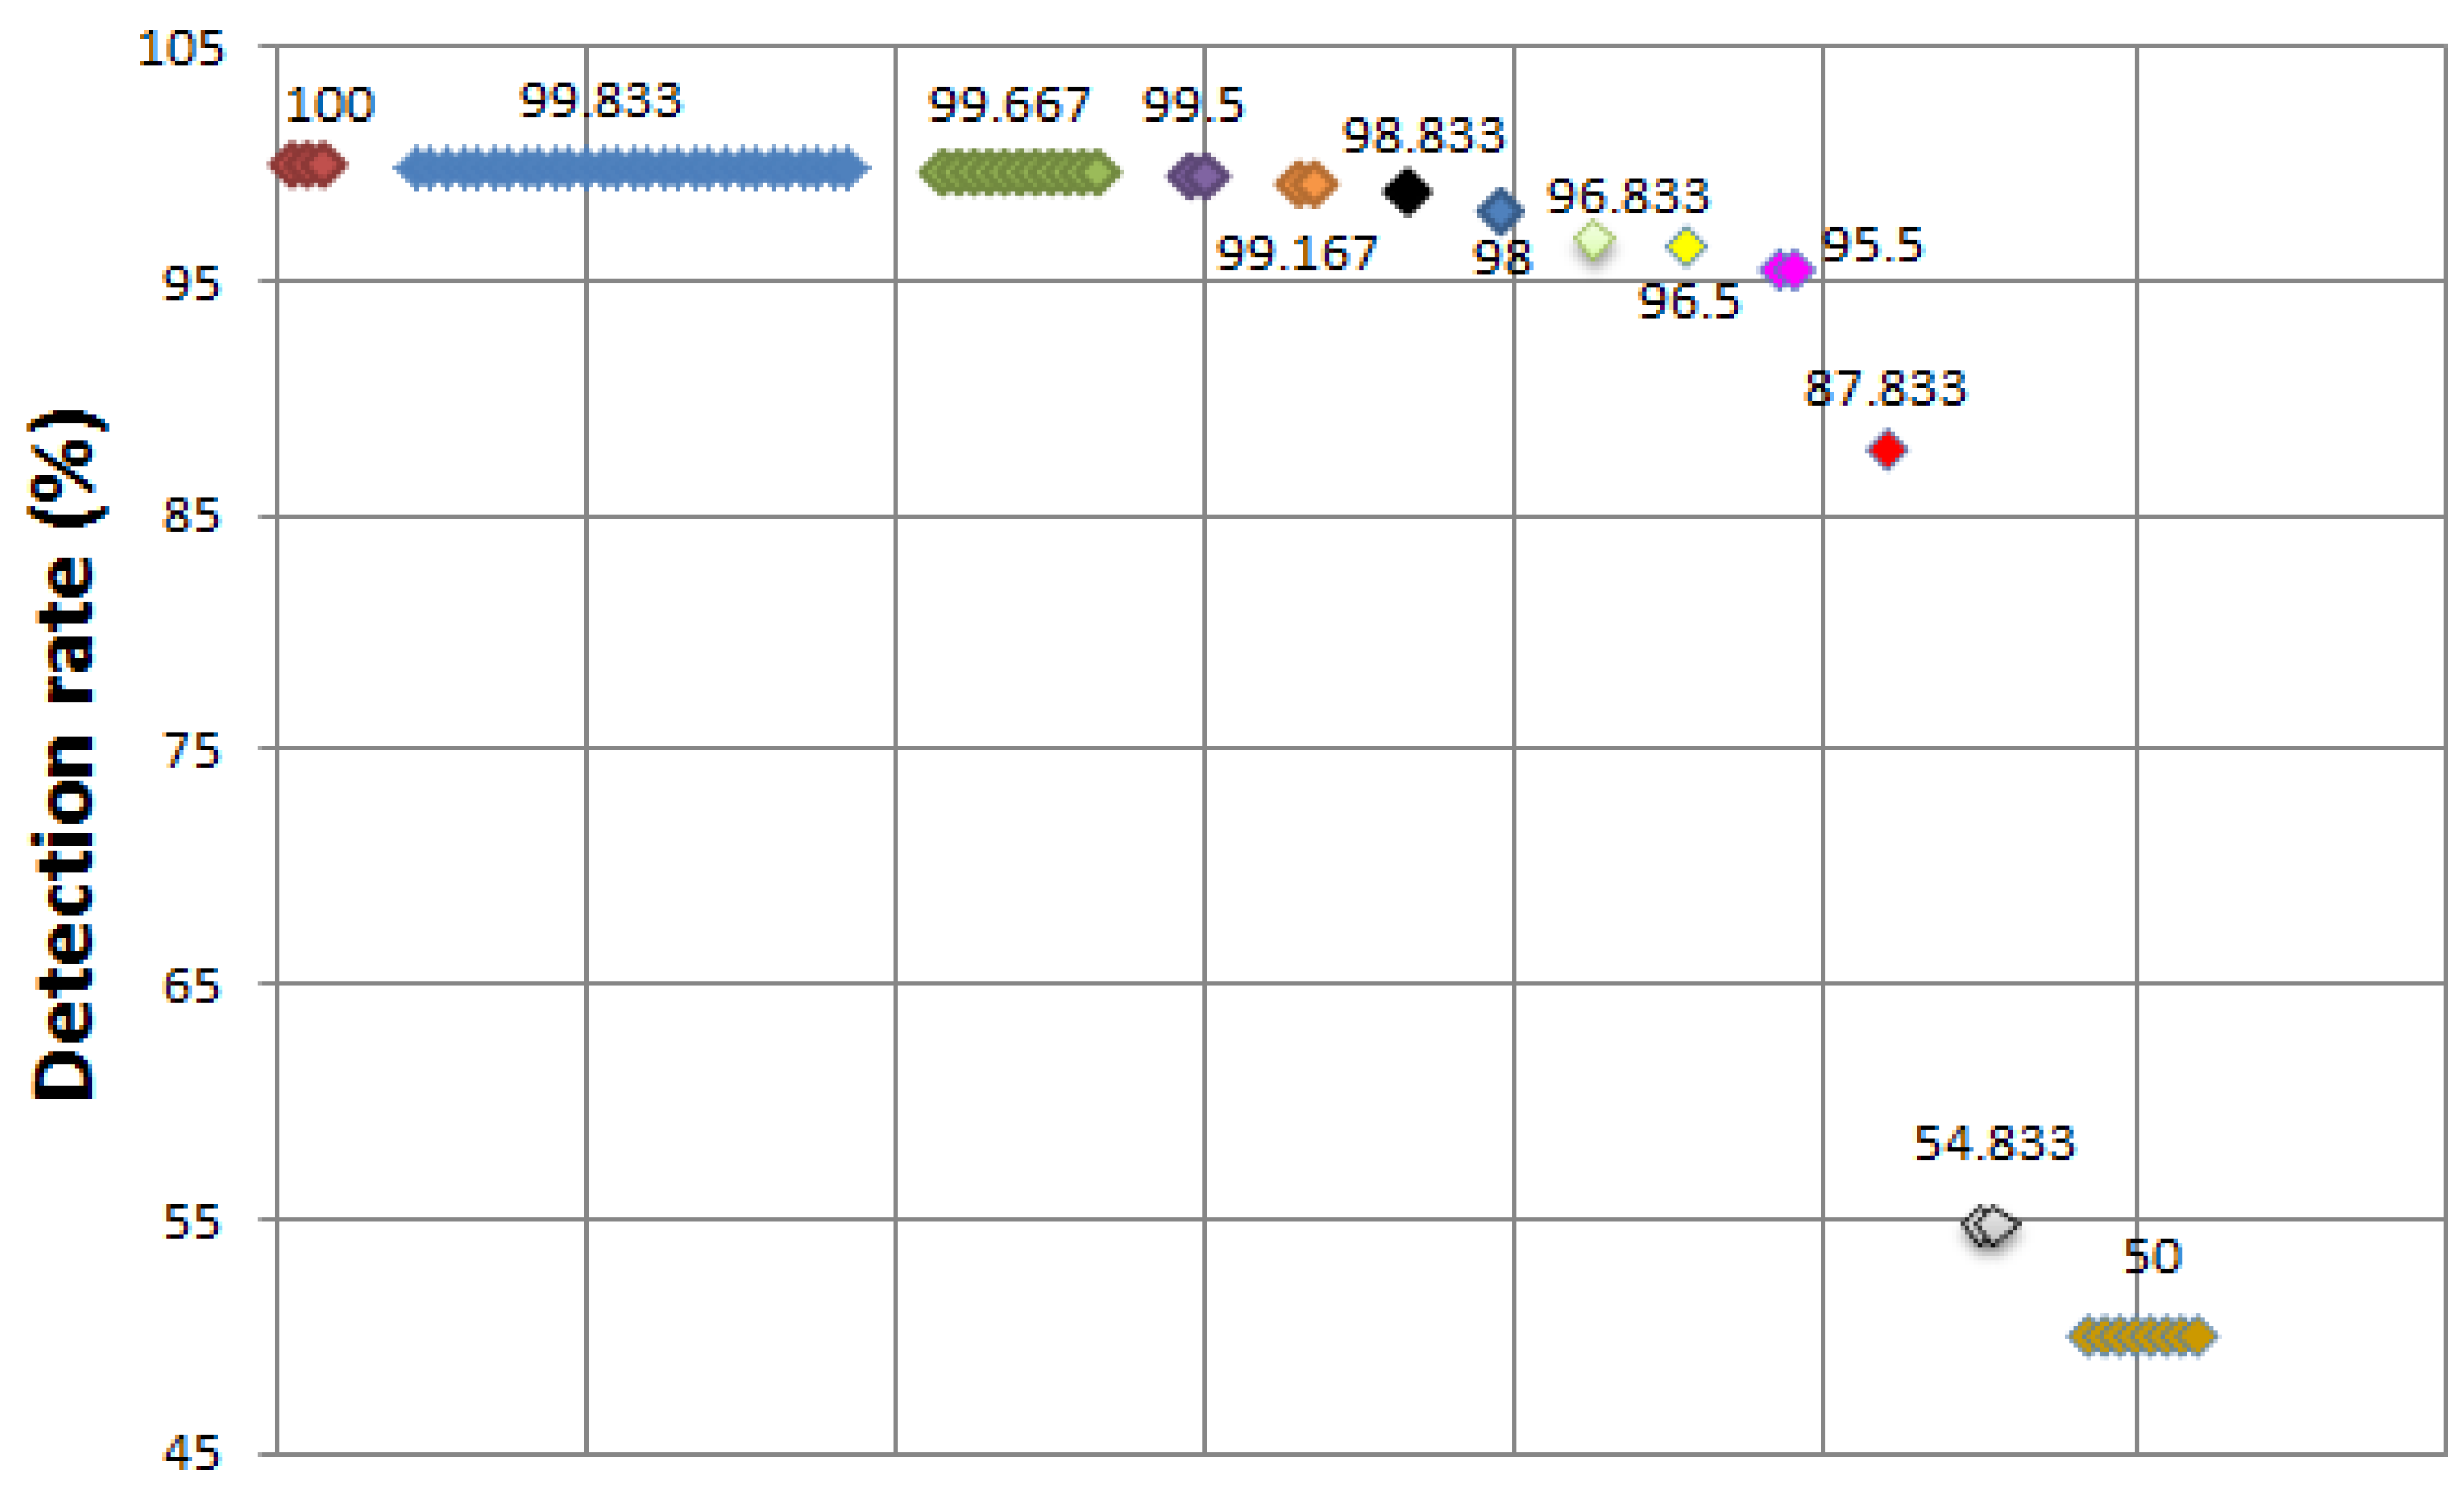
Next, all possible mining algorithms are performed with selected key attributes, using LADTree in the previous procedure; traffic count, average packets/s, memory used, 40–79 packets count, time of round trip (s), 320–639 percent, and average byte/s.
As
Figure 8 shows, the results are similar to the results of ADTree. Three algorithms show a 100% detection rate, 29 algorithms show 99.833%, 11 algorithms show 99.667%, two algorithms show 99.5%, two algorithms show 99.167%, one algorithm shows 98.833%, one algorithm shows 98%, one algorithm shows 96.833%, one algorithm shows 96.5%, one algorithm shows 95.5%, and one algorithm shows 87.333%. The overall detection rate is better than before. The results of two algorithms are 54.833%, and the results of eight algorithms are 50%. The results of 10 algorithms are significantly low.
Figure 8.
SYN flood attack—detection rate (after LADTree).
Figure 8.
SYN flood attack—detection rate (after LADTree).
5.2. Buffer Overflow Attack
A buffer overflow is an attack that could be used by a cracker to overruns the buffers boundary and overwrites adjacent memory while writing data to a buffer. Buffer overflow attacks can be triggered by inputs that are designed to execute code, or alter the way the program operates. This may result in the DoS to undermine the availability, including a modification of data to compromise the integrity and confidentiality. In this experiment, we focus on the denial of service attack causing the buffer overflow. An attacker transmits a malicious code to a target intelligent electronic device (IED) system that randomly writes oversize data due to insufficient bounds checking. We collect the data necessary for the detection of attacks.
5.2.1. Data Attribute Selection
The following details the selected attributes after we analyze the buffer overflow attack.
- -
Traffic count, Time of round trip(s), Average packets/s, Average packets size, Total transmission packets (bytes), Average B/s, Average Mbit/s, 40–79 packets count, 40–79 rate, 40–79 percent, 320–639 packets count, 320–639 rate, 320–639 percent, CPU percent, Memory used (kB), Buffer used (kB), Transmission payload size (bytes).
Two kinds of attributes, buffer used (kB) and transmission payload size (bytes), are added when compared with the SYN flood attack.
5.2.2. Attack Trial and Data Gathering
The attacker tries 100 times to attack the victim IED. The attacker transmits a malicious code to the victim IED that randomly writes oversize data due to insufficient bounds checking, and run the malicious code. When the attack trial starts, the data relevant attributes are captured one time, once every minute, and thus a total of 100 data are collected. Normal data is also captured once every minute, and thus 100 normal data are captured. As a result, 100 normal state data and 100 attack state data are collected.
5.2.3. Data Mining
The 100 normal data and 100 attack data generated in the previous step are input into the WEKA, and then the available data mining algorithms are run to obtain the detection rate. The results are show in
Table 4.
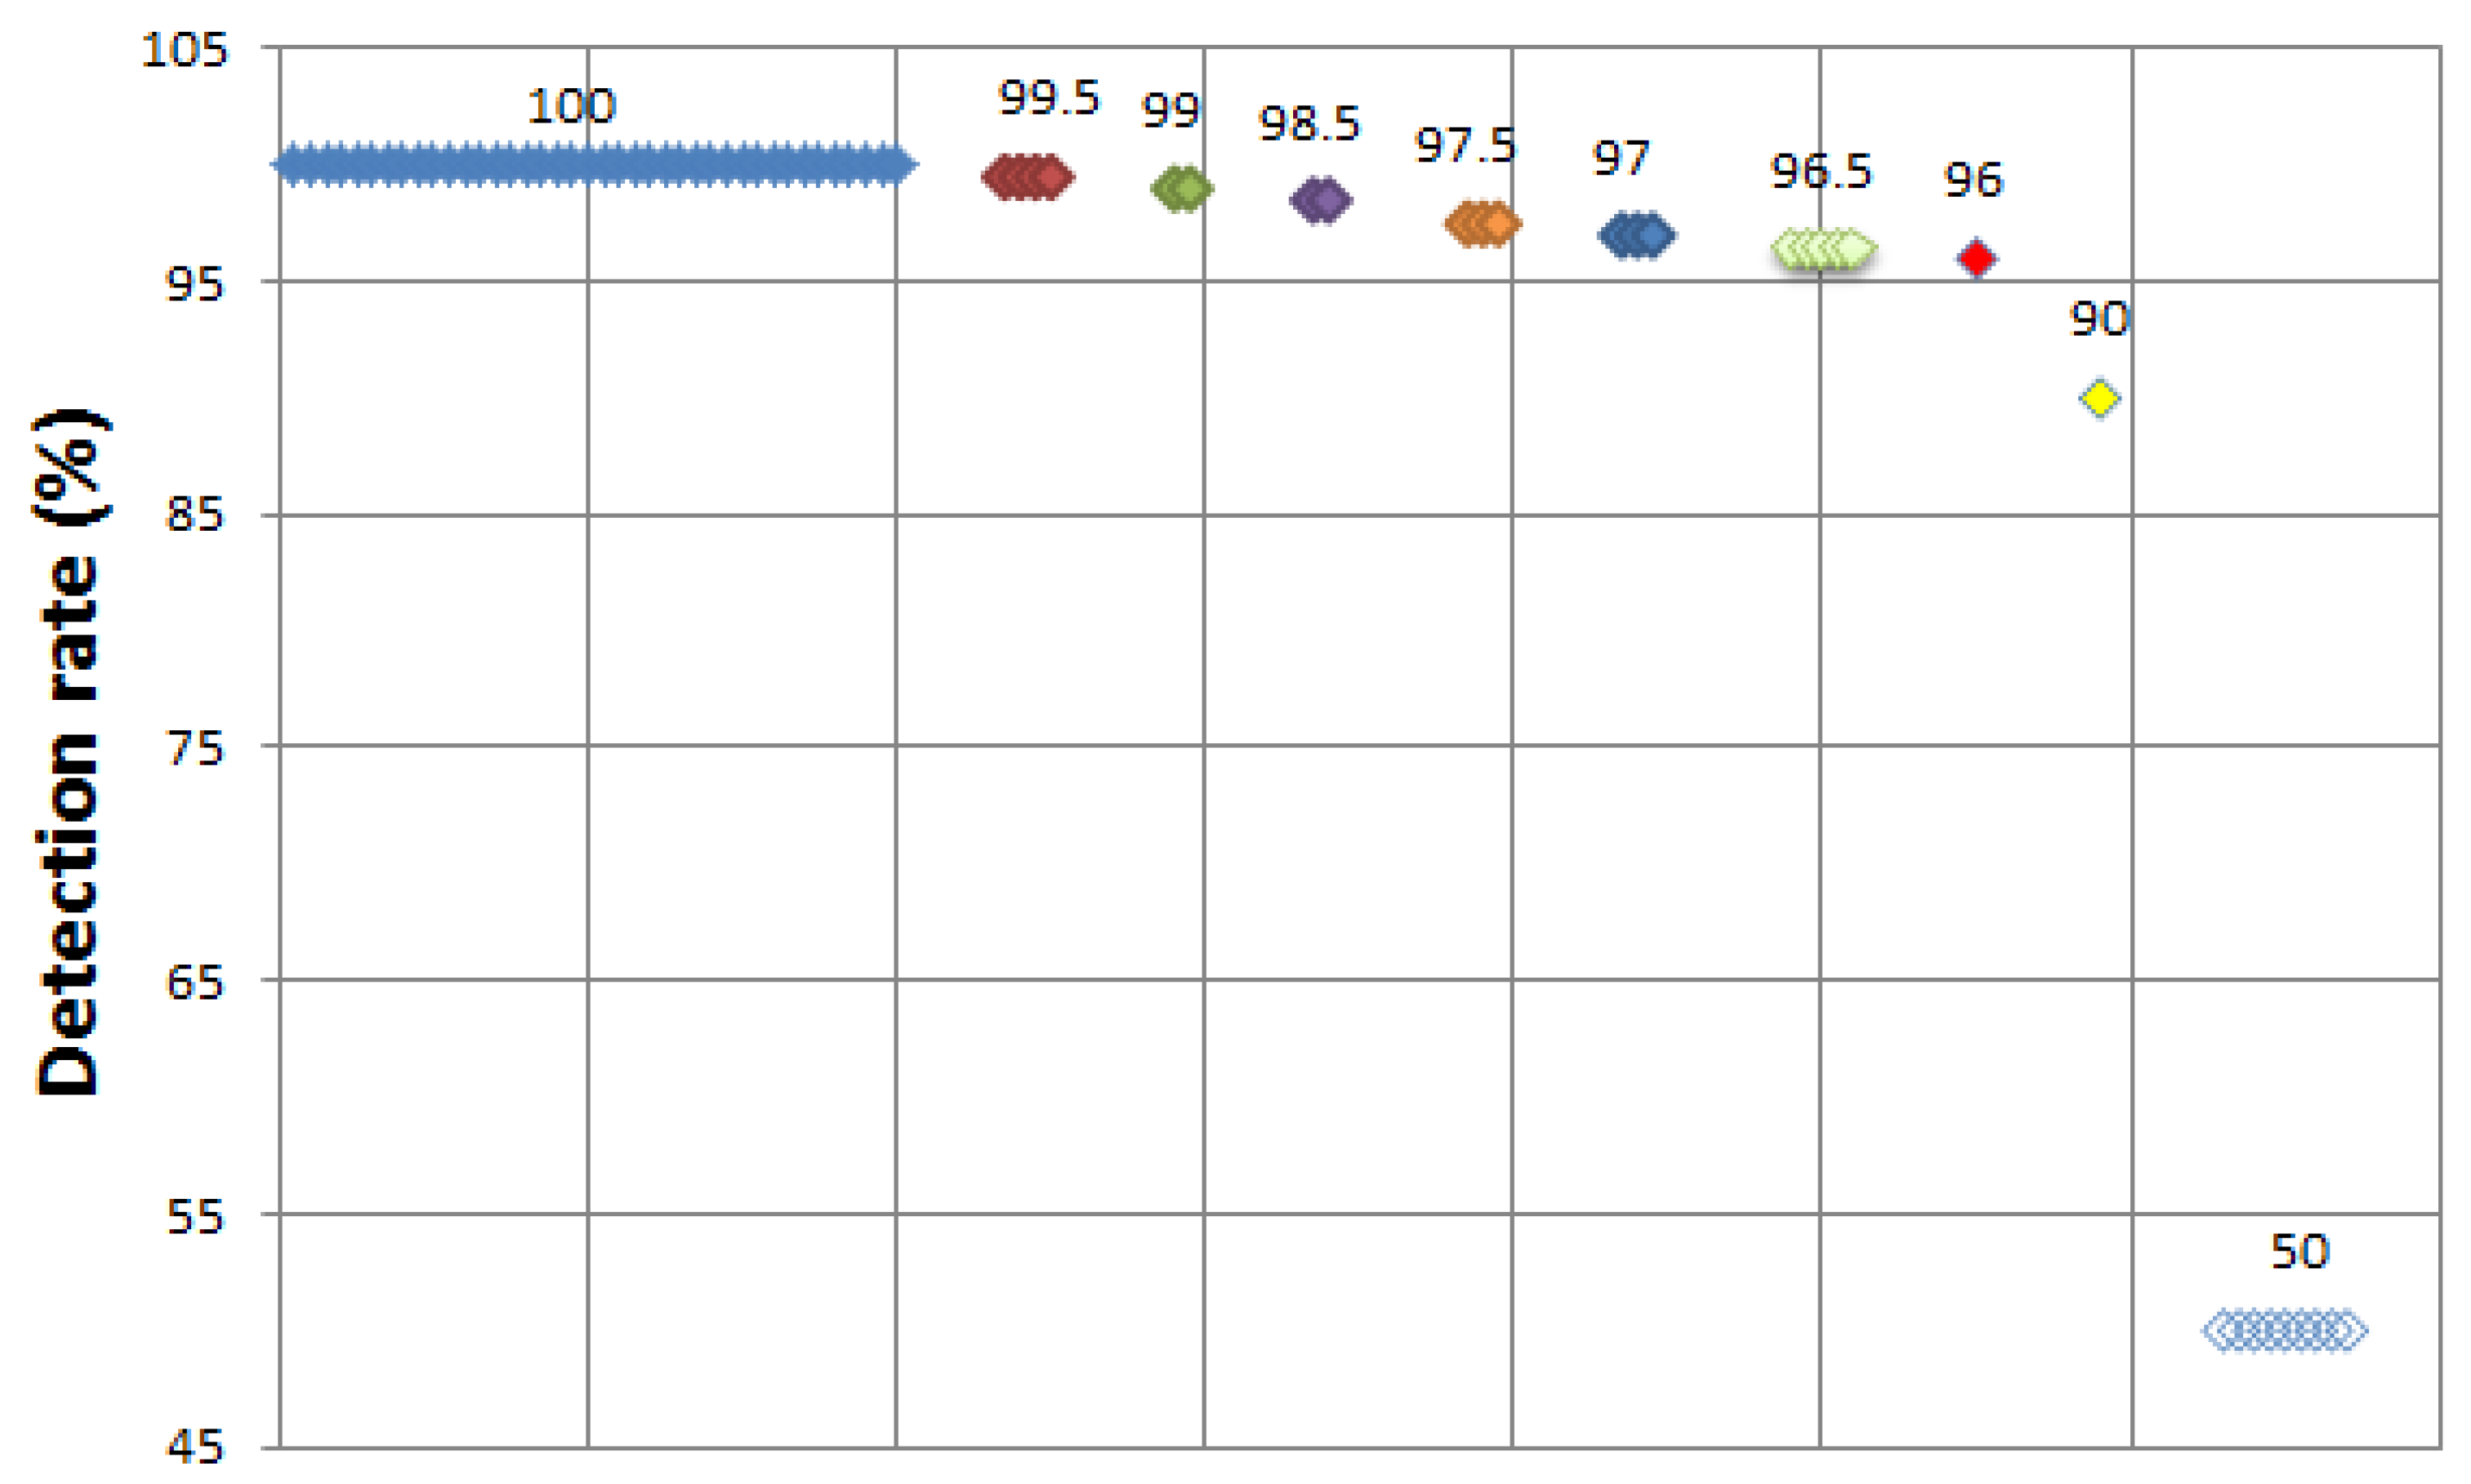
A total of 70 mining algorithms are performed and 40 algorithms including a tree. RandomForest show a 100% detection rate, followed by four algorithms that show a detection rate of 99.5%, two algorithms show 99%, two algorithms show 98.85%, three algorithms show 97.5%, three algorithms show 97%, five algorithms show 96.5%, one algorithm shows 96%, one algorithm shows 90%, thus 61 mining algorithms show a good detection rate. However, nine algorithms including rules.ZeroR show the lowest detection rate of 50%.
Figure 9 depicts all detection rates of the buffer overflow attack.
Table 4.
Buffer overflow attack—data mining results.
Table 4.
Buffer overflow attack—data mining results.
| Detection rate | Mining algorithms |
|---|
| 100% | tree.RandomForest, tree.LADTree, tree.FT, tree.LMT, tree.J48, tree.ADTree, tree.J48graft, tree.DecisionStump, tree.REPTree, tree.BFTree, tree.SimpleCart, rules.DecisionTable, rules.Jrip, rules.DTNB, rules.Ridor, rules.PART, rules.NNge, rules.ConjunctiveRule, rules.OneR, misc.VFI, meta.AttributeSelectedClassifier, meta.Bagging, meta.AdaBoostM1, meta.ClassificationViaRegression, meta.END, meta.nestedDichotomies.ClassBalancedND, meta.RandomCommitte, meta.LogitBoost, meta.OrdinalClassClassifier, metalnestedDichotomies.ND, meta.RandomSubSpace, meta.MultiBoostAB,meta.nestedDichomies.DataNearBalancedND, meta.RotationForest, meta.FilteredClassifier, functions.SMO, functions.Spegasos, functions.SimpleLogistic, functions.MultilayerPerceptron, lazy.LWL (40) |
| 99.5% | meta.MulticlassClassifier, lazy.IB1, lazy.IBk, functions.Logistic (4) |
| 99% | tree.NBTree, tree.RandomTree (2) |
| 98.85% | misc.HyperPipes, functions.RBFNetwork (2) |
| 97.5% | meta.Cecorate, lazy.KStar, bayes.BayerNet (3) |
| 97% | meta.Dagging, bayes.NaiveBayesUpdateable, bayses.NaiveBayes (3) |
| 96.5% | bayes.BayesianLogisticRegression, bayes.NaiveBayesMultinomialUpdateable, bayes.ComplementNaiveBayes, bayes.NaiveBayesmultinomial, meta.ClassificationViaClustering (5) |
| 96% | functions.VotedPerceptron (1) |
| 90% | meta.ThresholdSelector (1) |
| 50% | rules.ZeroR, meta.CVParameterSelection, meta.Grading, meta.MultiScheme, meta.Stacking, meta.RacedIncrementalLogitBoost, meta.Vote, meta.StackingC, bayes.DMNBtext (9) |
Figure 9.
Buffer overflow attack—detection rate (all).
Figure 9.
Buffer overflow attack—detection rate (all).
5.2.4. Mining Algorithm Selection and Key Attribute Selection
The Decision tree algorithms with the best detection rate in the above procedure are selected, and those algorithms show the decision tree as a result. Tree.ADTree, tree.RamdomTree, tree.REPTree, tree.J48, tree.J48graft, and tree.LADTree are chosen.
RandomTree [
25] is a class for constructing a tree that considers K randomly chosen attributes at each node. REPTree [
26] is a fast decision tree learner. It builds a decision/regression tree using information gain/variance and prunes it using reduced-error pruning (with backfitting). J48 [
27] is a class for generating a pruned or unpruned C4.5 decision tree. C4.5 is an extension of Quinlan’s earlier ID3 algorithm. The decision trees generated by C4.5 can be used for classification, and for this reason, C4.5 is often referred to as a statistical classifier. J48graft [
28] is a class for generating a grafted (pruned or unpruned) C4.5 decision tree.
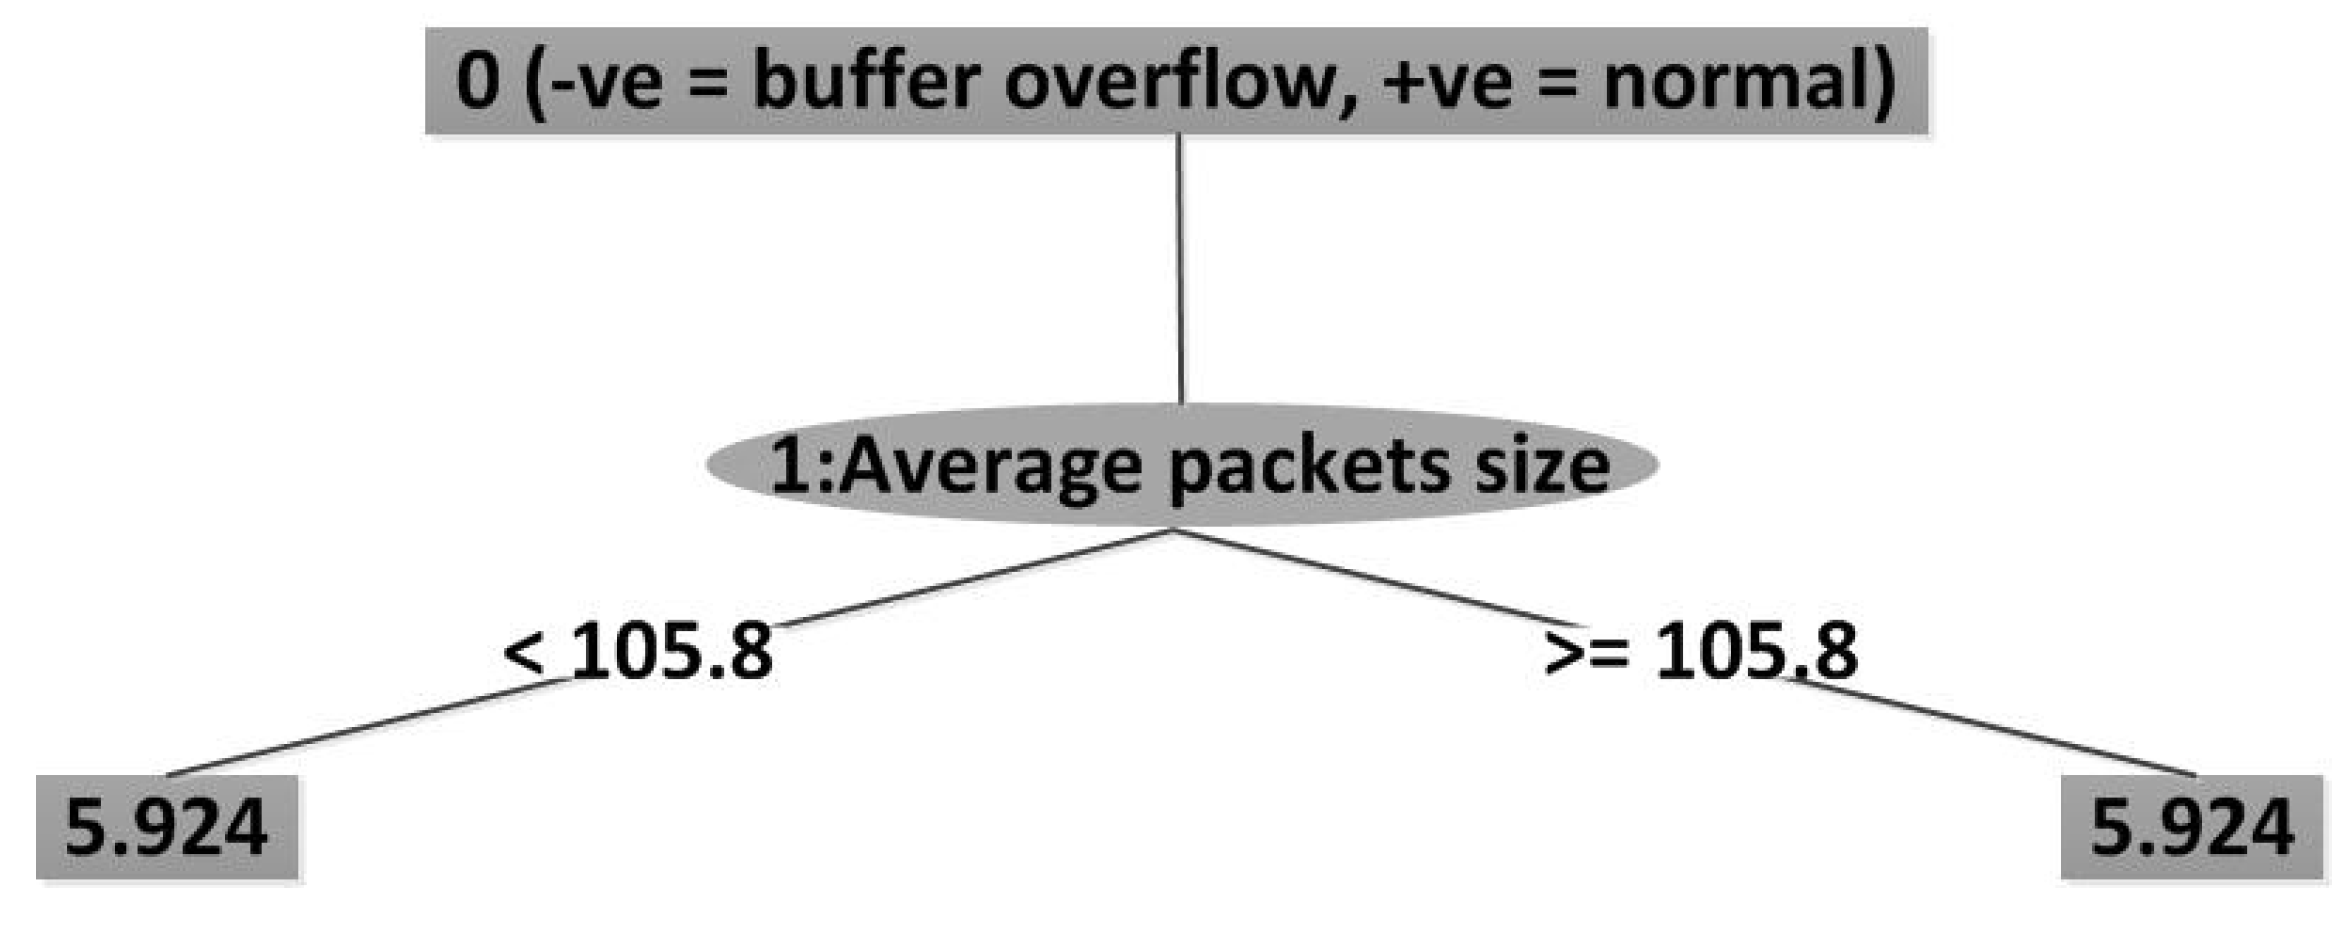
Figure 10 depicts the result after key attributes selection—average packets size—using ADTree, RandomTree, and REPTree.
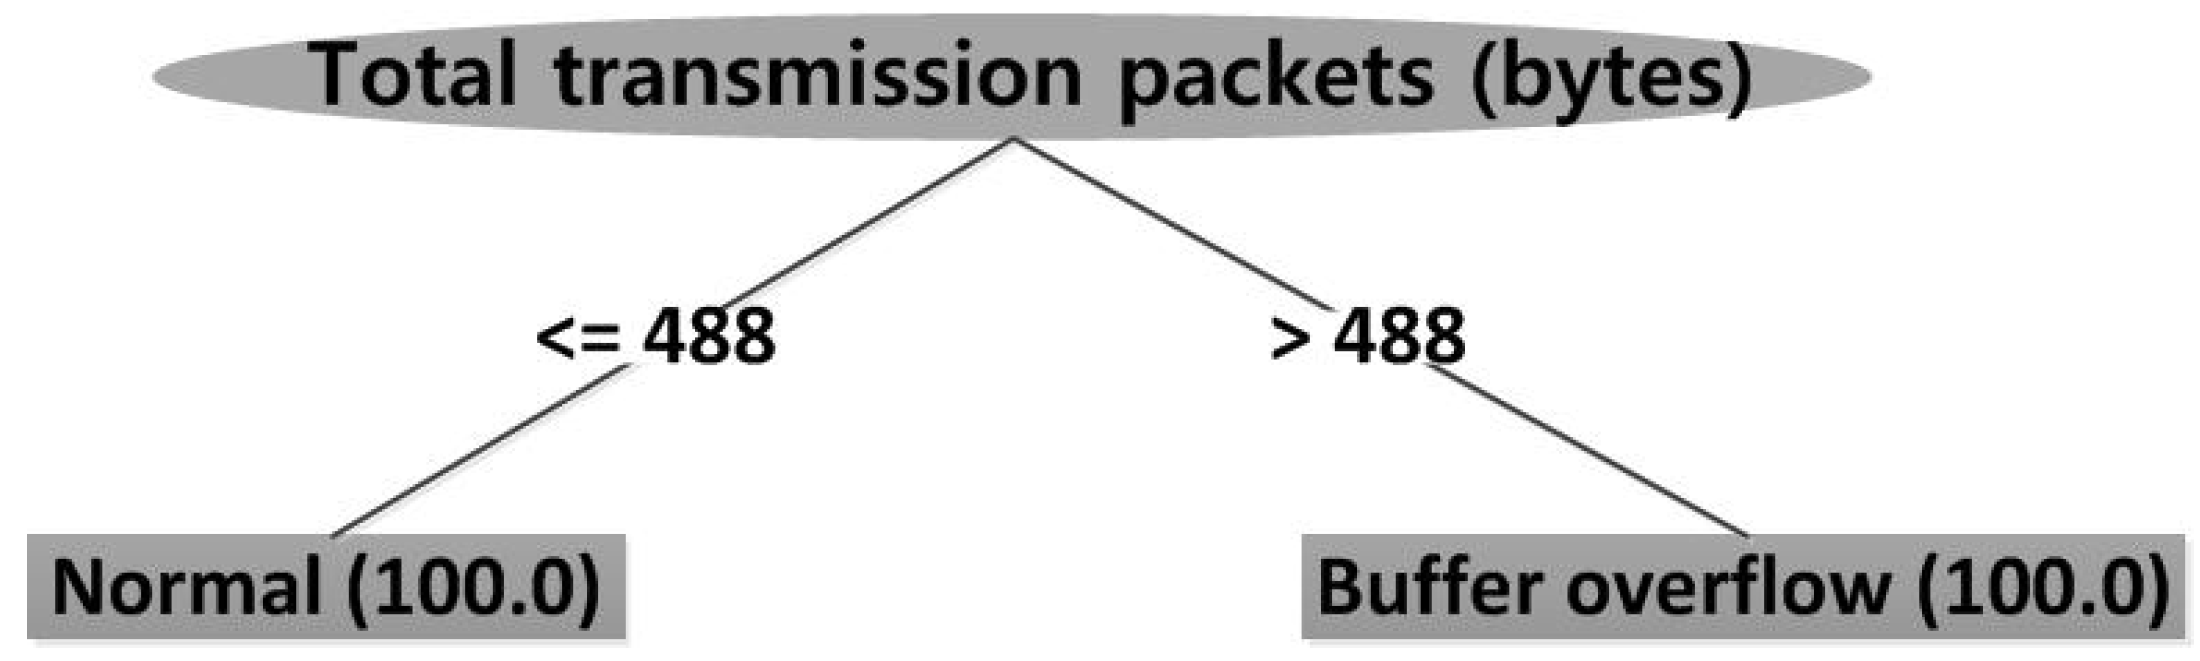
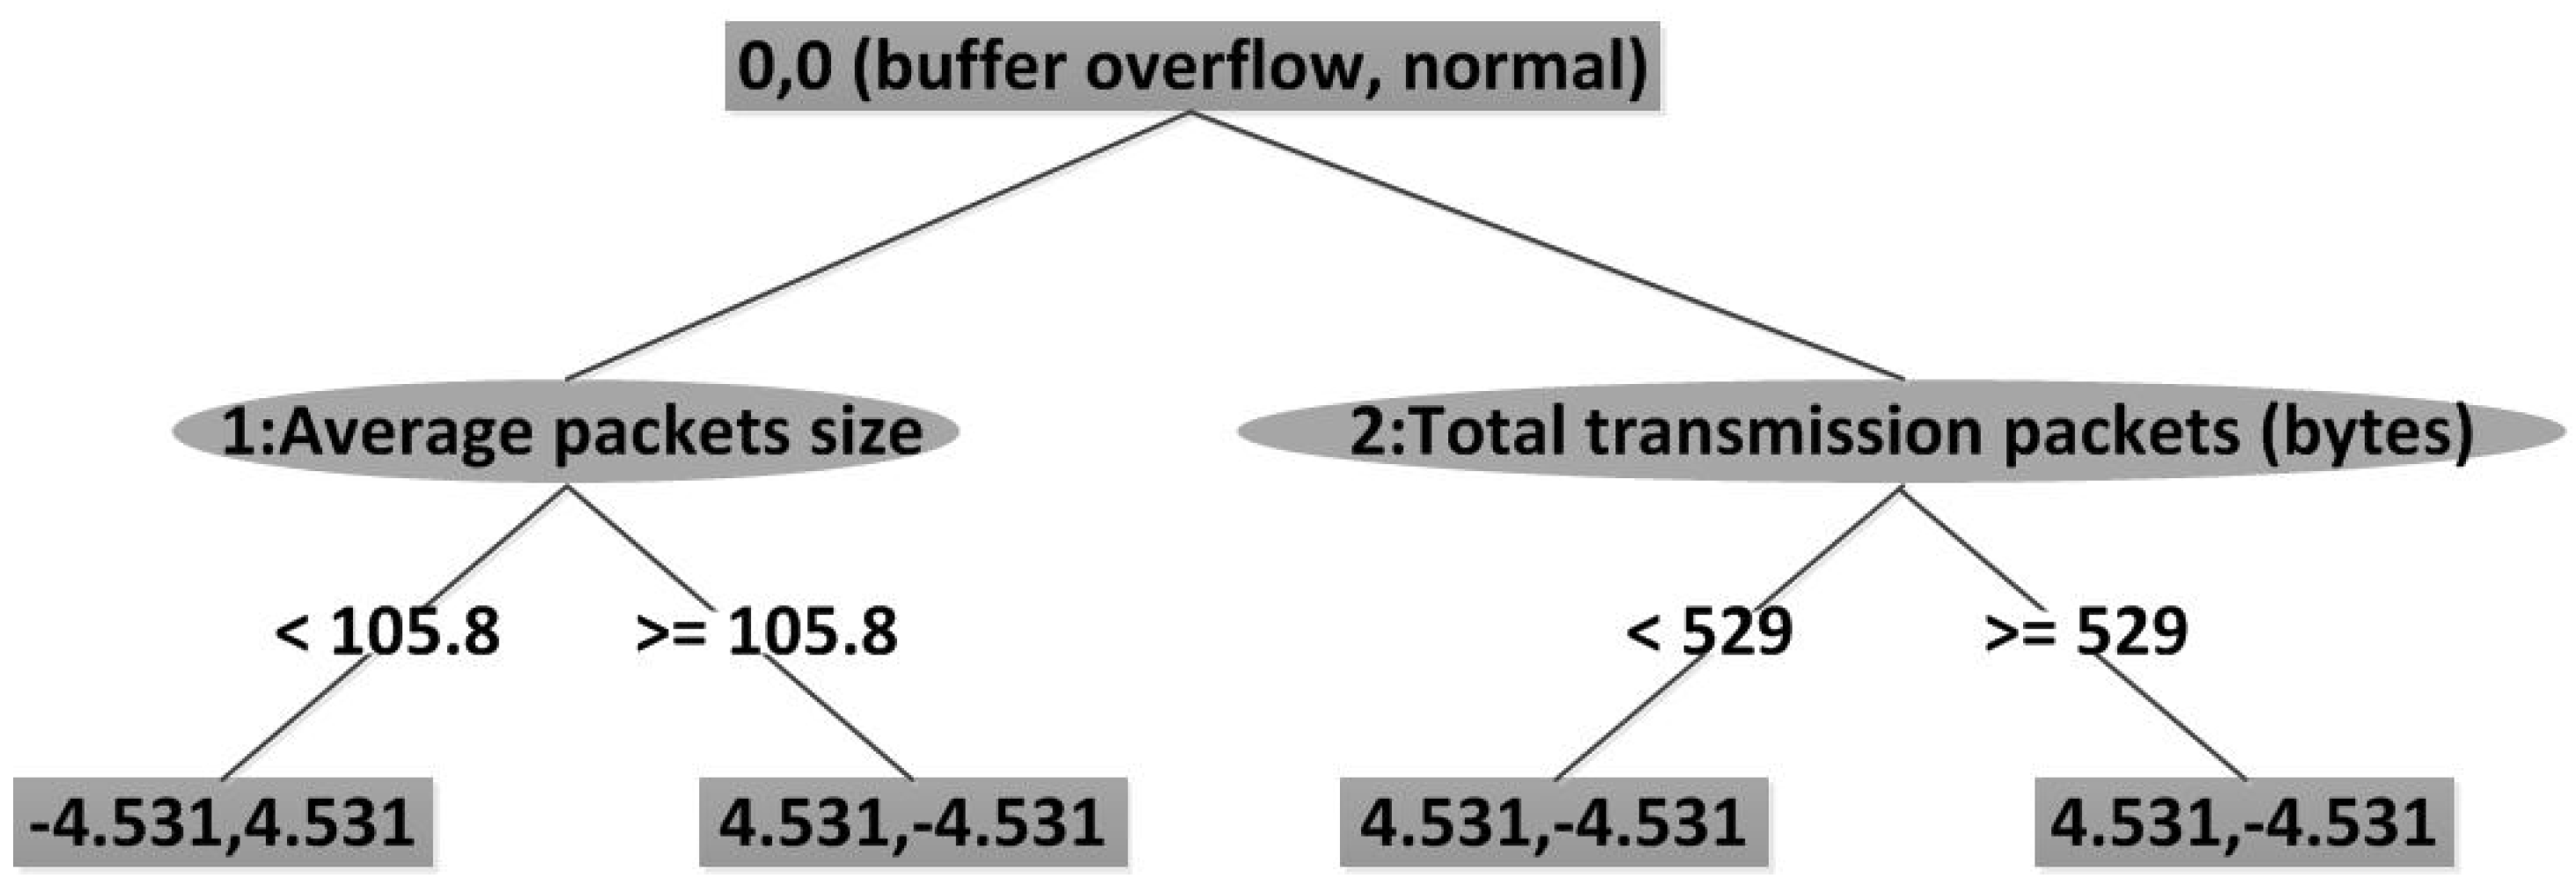
Figure 11 depicts the result after key attributes selection—total transmission packets—using J48 and J48graft. The key attributes of LADTree are selected with average packets size and total transmission packets. The result is as shown in
Figure 12.
Figure 10.
A result of ADTree.
Figure 10.
A result of ADTree.
Figure 11.
A result of J48.
Figure 11.
A result of J48.
Figure 12.
A result of LADTree.
Figure 12.
A result of LADTree.
5.2.5. Data Mining
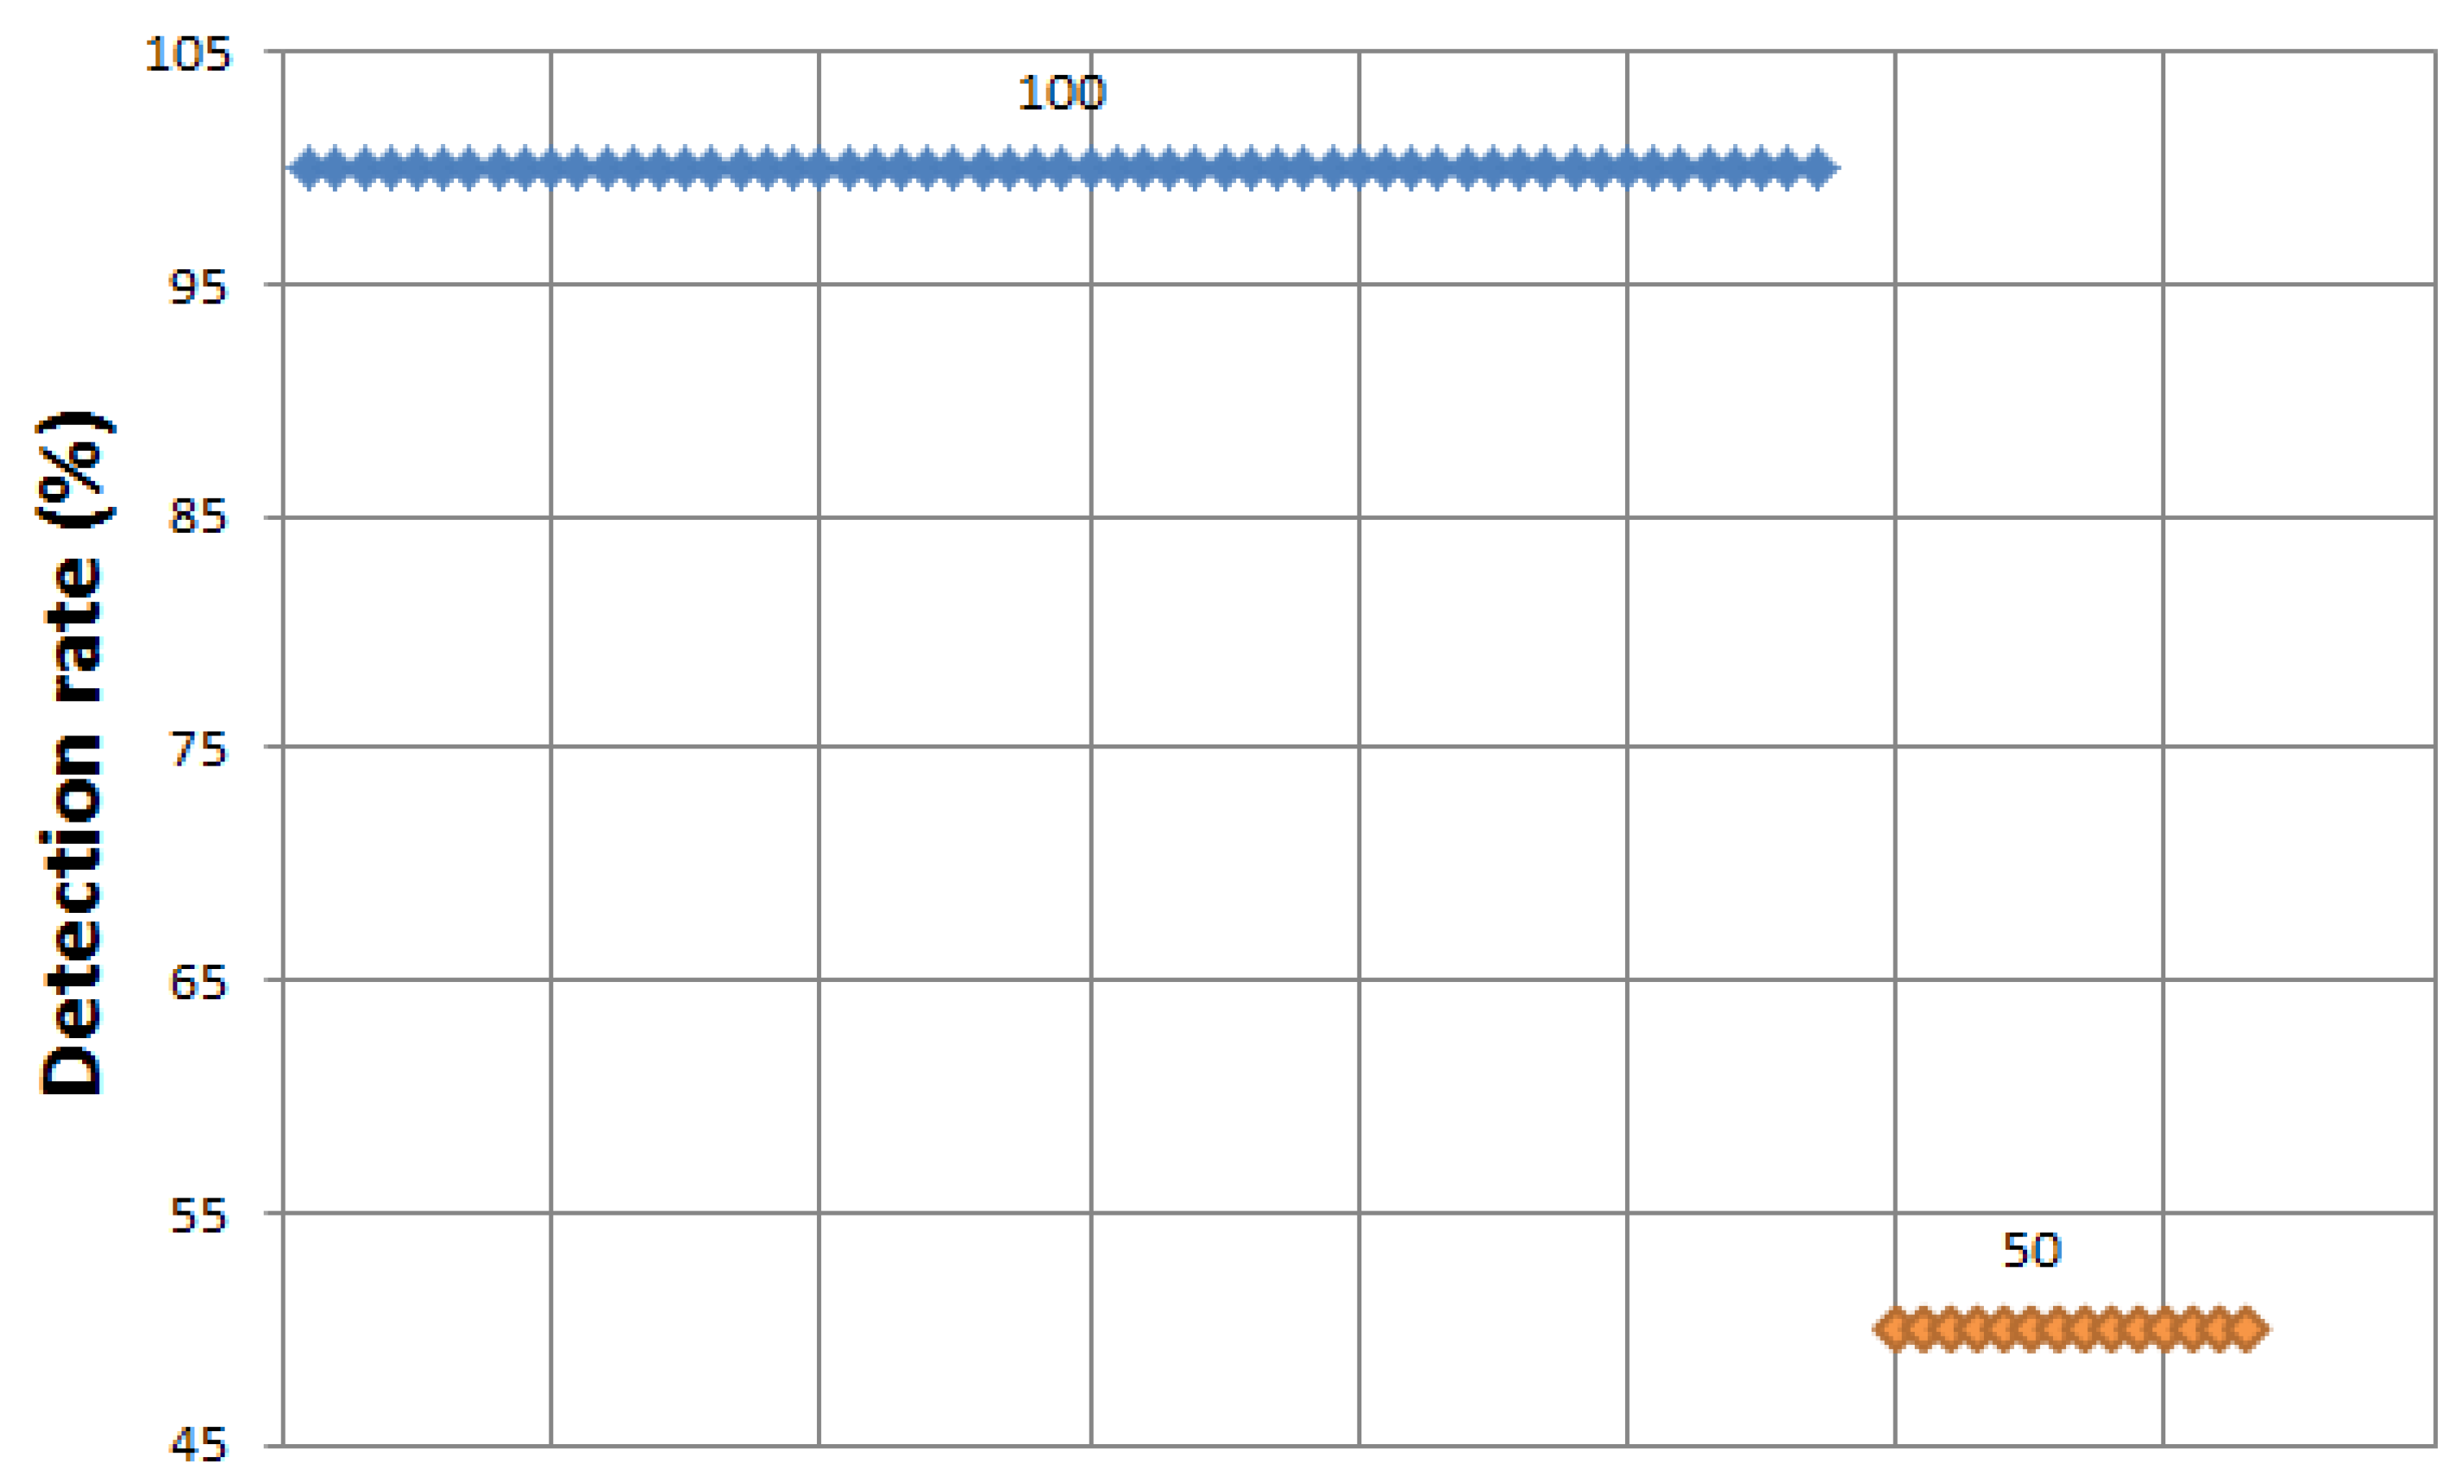
All possible mining algorithms are performed with average packets size, selected key attributes, using ADTree, RandomTree, and REPTree in the previous procedure. The results are as shown in
Table 5. 57 algorithms show a 100% detection rate, 14 algorithms show 50%. The overall detection rate is better than before.
Table 5.
Buffer overflow attack—mining results with ADTree, RandomTree, REPTree selection attributes.
Table 5.
Buffer overflow attack—mining results with ADTree, RandomTree, REPTree selection attributes.
| Detection rate | Mining algorithms |
|---|
| 100% | tree.RandomForest, tree.LADTree, tree.FT, tree.LMT, tree.J48, tree.ADTree, tree.J48graft, tree.REPTree, tree.SimpleCart, tree.BFTree, tree.NBTree, tree.RandomTree, rules.DTNB, tree.DecisionStump, rules.DecisionTable, rules.Ridor, rules.Jrip, misc.VFI, rules.PART, rules.ConjunctiveRule, rules.NNge, rules.OneR, misc.HyperPipes, meta.OrdinalClassClassifier, meta.AdaBoostM1, meta.Decorate, meta.END, meta.AttributeSelectedClassifier, meta.Bagging, functions.SMO, meta.ClassificationViaRegression, meta.FilteredClassifier, meta.MultiBoostAB, meta.ClassficationViaClustering, meta.multiClassClassifier, meta.RandomCommitte, meta.nestedDichotomies.ClassBalancedND, meta.LogitBoost, meta.RandomSubSpace, meta.nestedDichotomies.ND, meta.Dagging, meta.ThresholdSelector, functions.Logistic, meta.nestedDichotomies.DataNearBalancedND, meta.RotationForest, bayes.BayesNet, functions.MultilayerPerceptron, functions.SimpleLogistic, functions.Spegasos, functions.RBFNetwork, bayes.NaiveBayes, lazy.IBk, bayes.NaiveBayesUpdateable, lazy.KStar, lazy.LWL, bayes.NaiveBayesSimple (57) |
| 50% | meta.MultiScheme, meta.CVParameterSelection, meta.Grading, meta.Vote, bayes.BayesianLogisticRegression, functions.VotedPerceptron, meta.StackingC, bayes.ComplementNaiveBayes, meta.RacedIncrementalLogitBoost, meta.Stacking, bayes.NaiveBayesmultinomialUpdateable, bayes.NaiveBayesMultinomial, rules.ZeroR, bayes.DMNBtext (14) |
After selection of key attributes bayes.NaiveBayesSimple is run in addition.
Figure 13 depicts the results of this execution. Next, all possible mining algorithms are performed with total transmission packet, selected key attributes, using J48, J48graft the previous procedure. The results are as shown in
Table 5. Fifty seven algorithms show a 100% detection rate, 14 algorithms show 50%. The overall detection rate is better than before. Finally, all possible mining algorithms are executed with average packet size and total transmission packet size. The results are similar to those in
Table 5.
Figure 13.
Buffer overflow attack—detection rate (after ADTree, RandomTree, REPTree).
Figure 13.
Buffer overflow attack—detection rate (after ADTree, RandomTree, REPTree).
5.3. Discussion for Scalability Issue
This paper’s main contribution is to propose a way to make a detection model using two mining algorithms to improve the efficiency and performance. The first algorithm selects key attributes among candidate attributes. Next, the second algorithm actually makes the detection model with data for selected key attributes outputting from the first algorithm. The final detection model improves detection performance because it is made with data for only a few key attributes, and modeling time reduces through modeling with data for a few key attributes. After that, detection can be performed through detection model in real time.
In our methodology also, the scalability issue is related. The more attacks that are considered to be detected, the more candidate attributes are input in the first algorithm. However, as shown in the experimental results, our methodology can reduce modeling time that can take a lot of time, through selecting a few key attributes among candidate attributes. As experimental results, the average three key attributes of the average 16 candidate attribute was selected. Moreover, this modeling is irrelevant to the detection time because of performing in the offline. If the detection model is made, the detection is performed in real time. As a result, our proposed methodology is not strongly influenced by scalability problem.
6. Conclusions
This work analyzed Network and System Management (NSM) requirements and NSM data objects for intrusion detection in power systems. We analyzed a SYN flood attack and a buffer overflow attack to cause a DoS attack, as described in NSM. We proposed the data attributes for the SYN flood attack and the buffer overflow attack, and the detection process to find efficient data mining methods for those attacks. In our experiments, several data mining methods showed good detection rates. Moreover, after key attributes selection, the overall detection rate is better than before.
In case of SYN flood attack, a total of 64 mining algorithms are executed with the selected key attributes. Thirty algorithms show 99.833% detection rate and 54 algorithms show more than 90% detection rate. Next, the decision tree algorithms with the best detection rate are selected, and those algorithms show the decision tree as a result. Sixty four algorithms are performed with selected key attributes using result of decision tree. Three algorithms show a 100% detection rate, 29 algorithms show 99.833%.
As similar with SYN flood attack, a total of 70 algorithms are executed with selected key attributes, and 40 algorithms show 100% detection rate. Sixty one algorithms show more than 90% detection rates. Again, the decision tree algorithms with the best detection rate are selected, and key attributes also selected as a result. A total of 71 algorithms are performed, and 57 algorithms show 100% detection rate, 14 algorithms show 50%, the overall detection rate is enhanced after selection of key attributes. We prove that our selected attack attributes and the proposed detection process are efficient, and suitable for intrusion detection in smart grid environments.


