2.1. Nematic Phases of Racemic N-Acylamino Acid Surfactants
The uniaxial to biaxial transition temperatures were determined analyzing the temperature dependence of the birefringences (or the symmetric invariants of the order parameter), measured with laser conoscopy and inspecting the characteristic textures in the POM.
The order parameter that has the symmetry of the nematic phase is the optical dielectric tensor,
, a traceless second-rank tensor [
2,
17]. Its symmetric invariants (σ
i,
i = 1, 2, 3) may be written in terms of the optical birefringences. With the birefringences measured in the three nematic phases, the symmetric invariants of the tensor order parameter, σ
2 and σ
3 (σ
1 = 0), can be calculated [
18]:
where
is the mean index of refraction of the mixture. In the framework of the Landau-de Gennes theory (
i.e., mean-field theory), these invariants show a linear dependence with the temperature in the vicinity of the second-order uniaxial to biaxial phase transition.
In our experiments, usually, we started the measurements with the sample in the N
D phase, perfectly oriented with the director parallel to the laser beam. The temperature is then changed step by step to reach the other nematic phases.
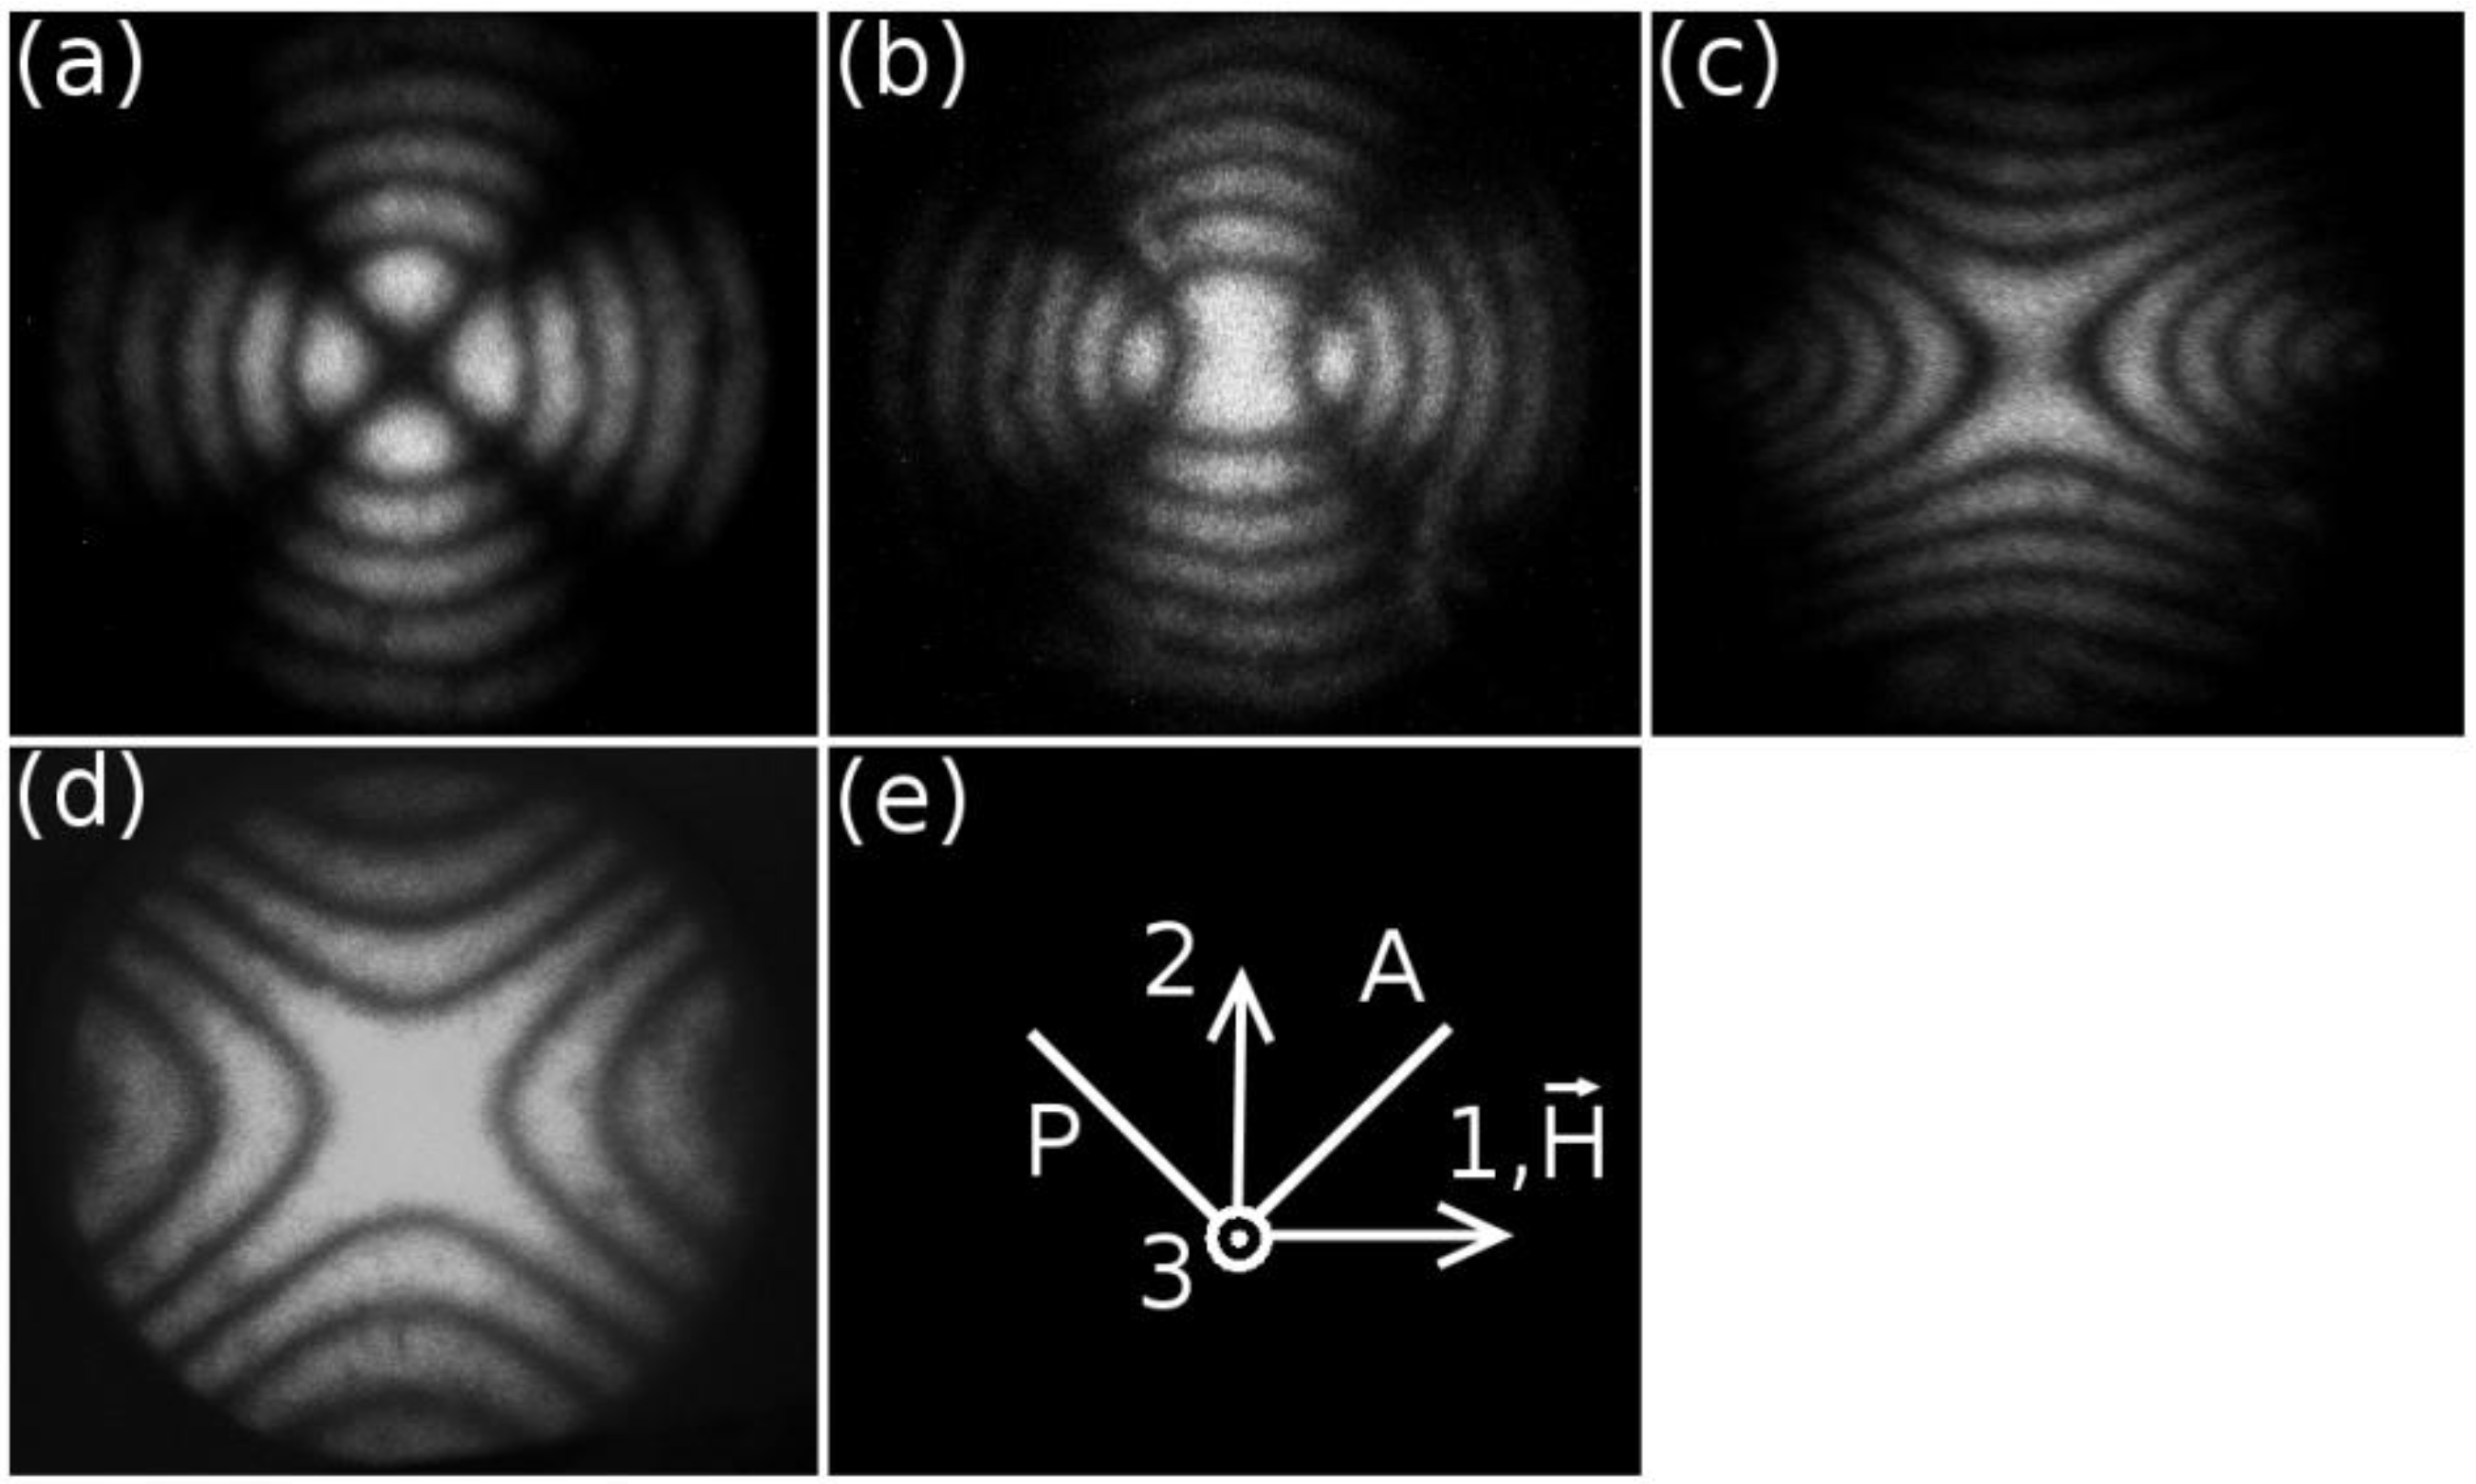
Figure 1 shows typical results of the conoscopic patterns obtained in our experiments.
Figure 1.
Typical conoscopic patterns of the mixture, potassium N-dodecanoyl-dl-serinate (dl-KDDS)/Na2SO4/1-dodecanol (DDeOH)/water. (a) nematic discotic phase (ND) at 45.0 °C; (b) nematic biaxial phase (NB) near the ND to NB transition at 33.7 °C; (c) NB at 31.0 °C; and (d) calamitic nematic phase (NC) at 23.0 °C; (e) geometry of the experiment: P, A and
are the directions of the polarizer, analyzer and the applied magnetic field, respectively.
We have checked that the phase sequence as a function of the temperature does not change (within the precision in the measurement of the temperature) for samples stored in a freezer for at least one year. The aspect of the conoscopic fringes is also the same, without noticeable modifications as a function of time. This result assures us that the patterns represent the steady state of the alignment of the sample, subjected to the magnetic field. At this point, it is interesting to discuss in more detail the features of the conoscopic patterns shown in
Figure 1. The symmetry of the patterns and the contrast between the fringes and the background assures us that they were produced by well-aligned samples. Unaligned samples could not produce such types of patterns (see, e.g., [
19]). Observing only the central part of the pattern (the opening of the Maltese cross), obviously, we cannot differentiate the existence of a biaxial phase from the effect of a uniaxial phase losing its alignment [
20]. However, the complete conoscopic patterns of these two situations are completely different. This assures us the existence and alignment of the biaxial phase in our experiments.
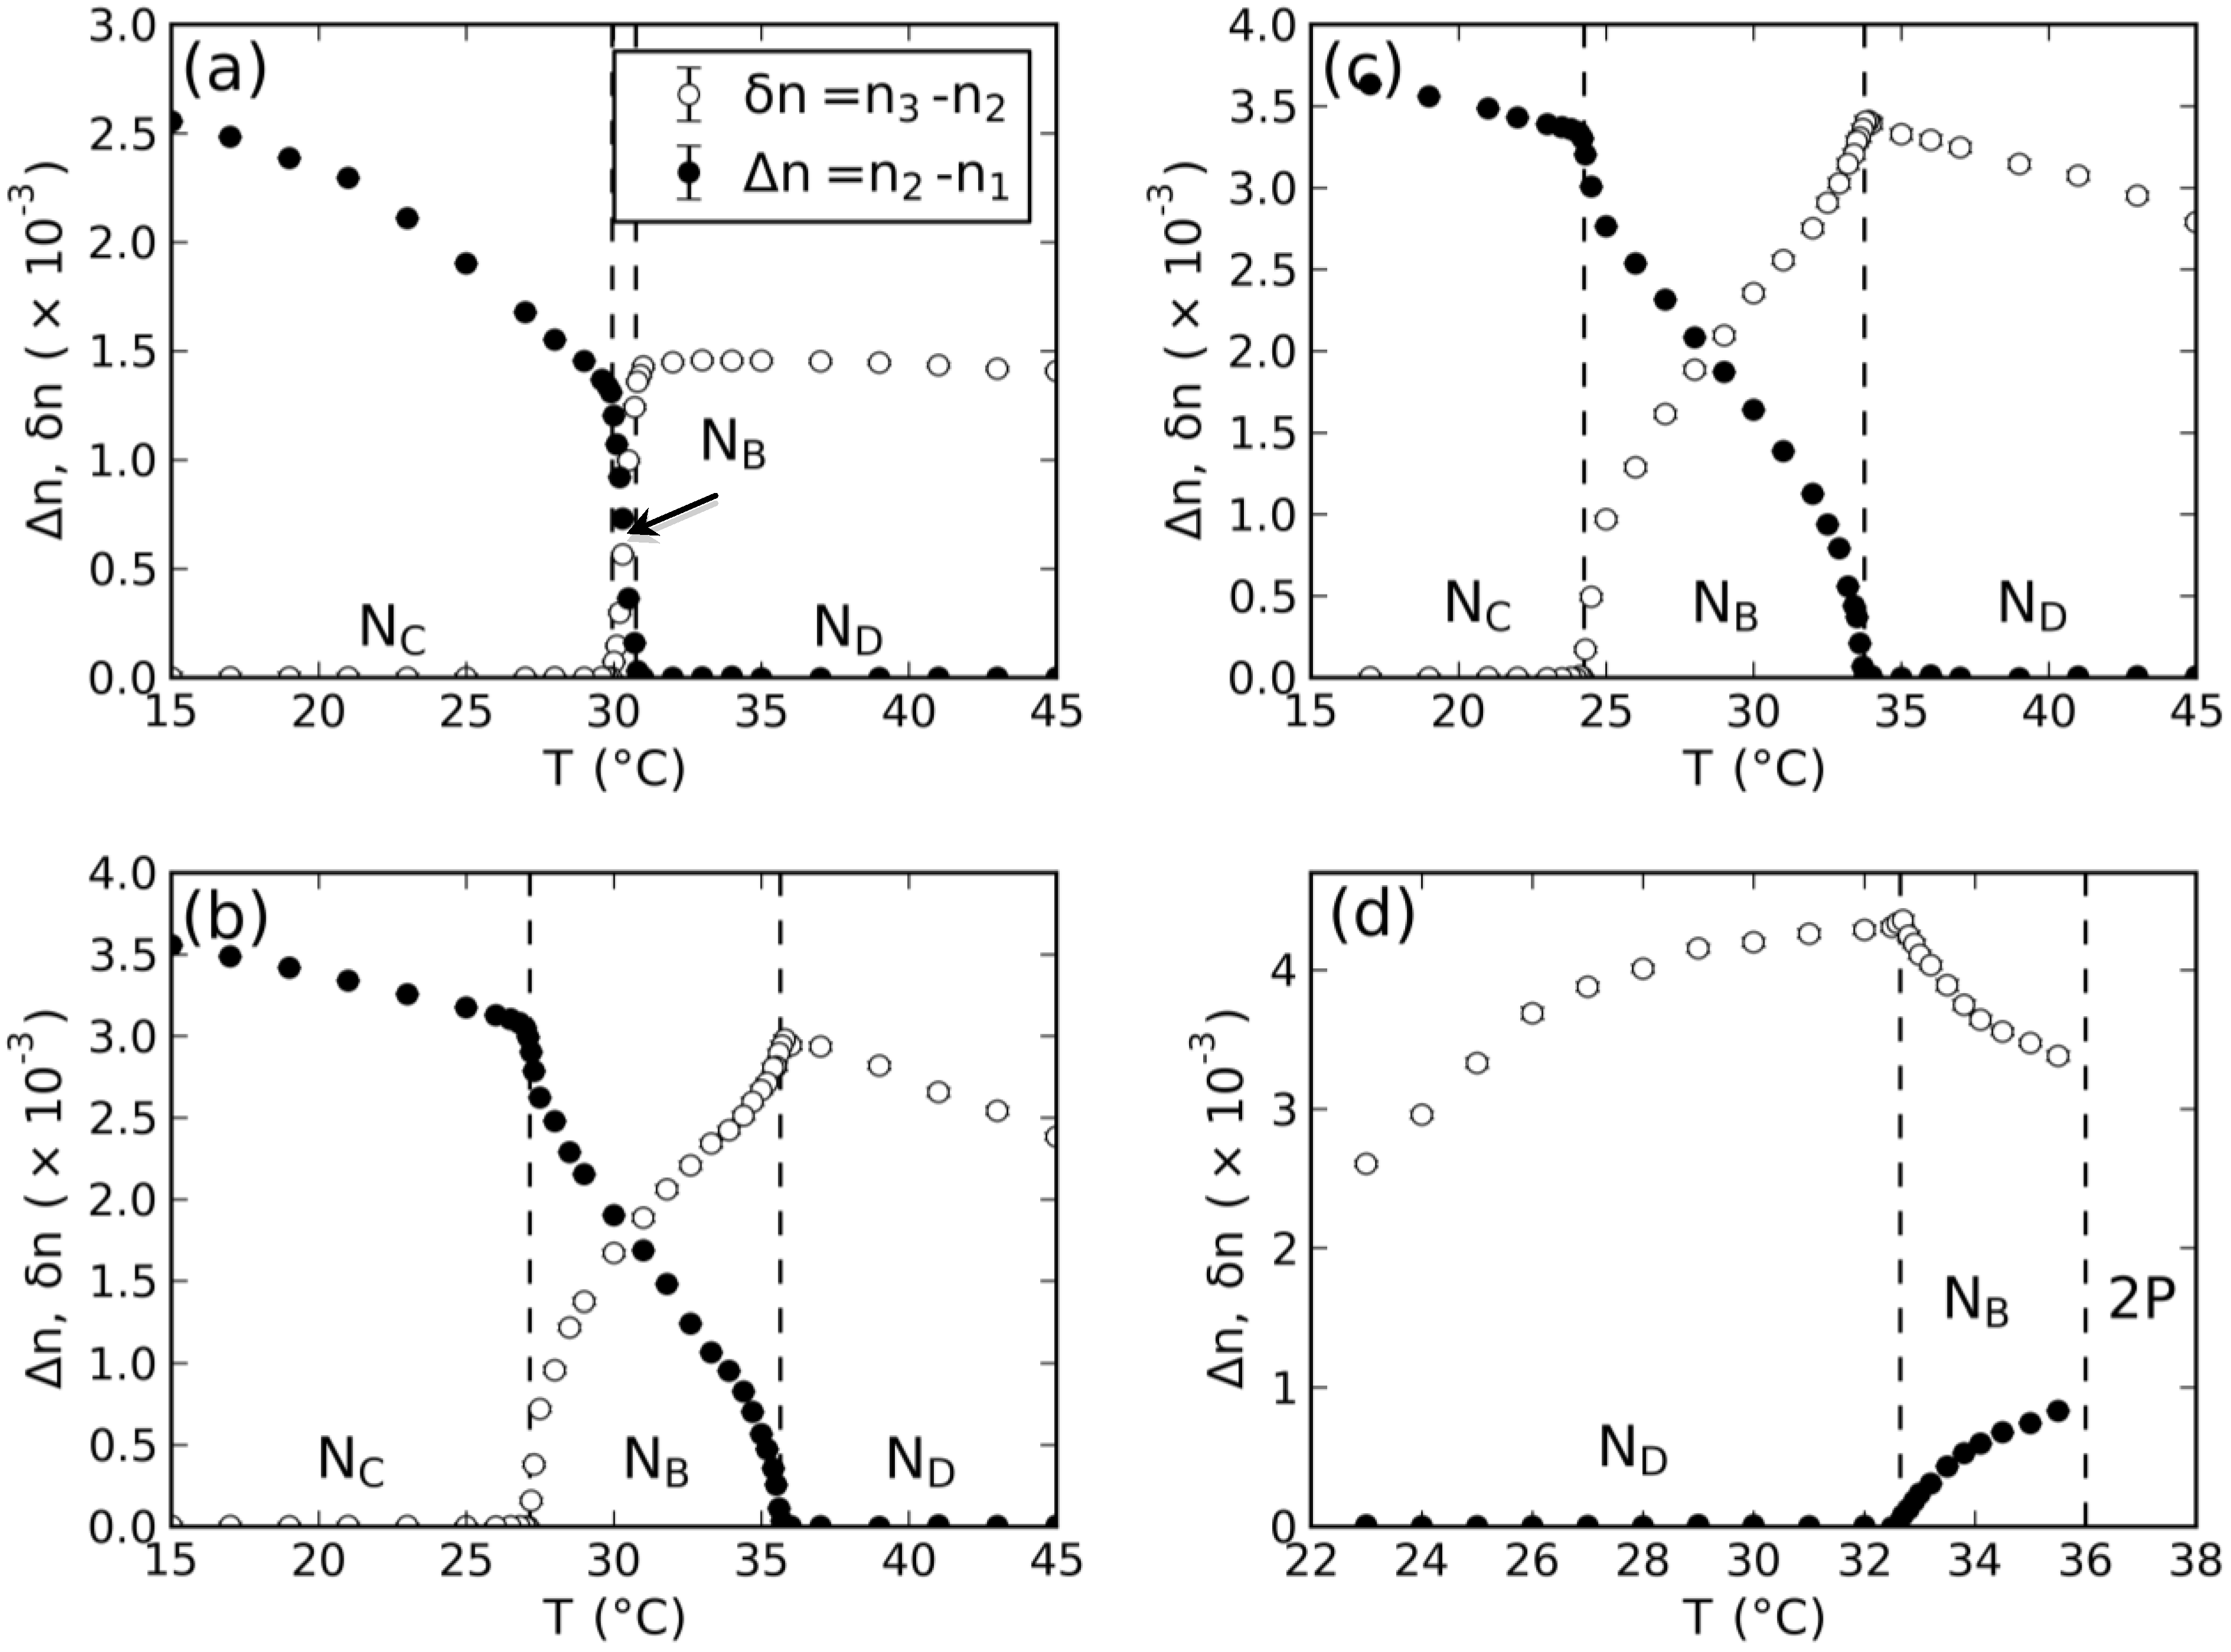
The temperature dependence of the birefringences of
dl-KDDA,
dl-KDDS and
dl-NaDDAs are given in
Figure 2.
Figure 2.
Temperature dependence of the birefringences of the mixtures: (a) potassium N-dodecanoyl-dl-alaninate (dl-KDDA)/Cs2SO4/DDeOH/water; (b) dl-KDDS/Na2SO4/1-undecanol (UndeOH)/water; (c) dl-KDDS/Na2SO4/DDeOH/water; and (d) disodium N-dodecanoyl-dl-aspartate (dl-NaDDAs)/Cs2SO4/UndeOH/water. 2P represents a two-phase coexistence region.
Biaxial nematic domains are present in the phase sequences shown in
Figure 2, in between the two uniaxial nematic phases, except in the case of the
dl-NaDDAs mixture, where the
NB phase domain ends in a two-phase region at higher temperatures. Interestingly, this last mixture shows the
ND phase domain at lower temperatures, contrary to the other mixtures investigated, where the
NC phase domain occurs at lower temperatures.
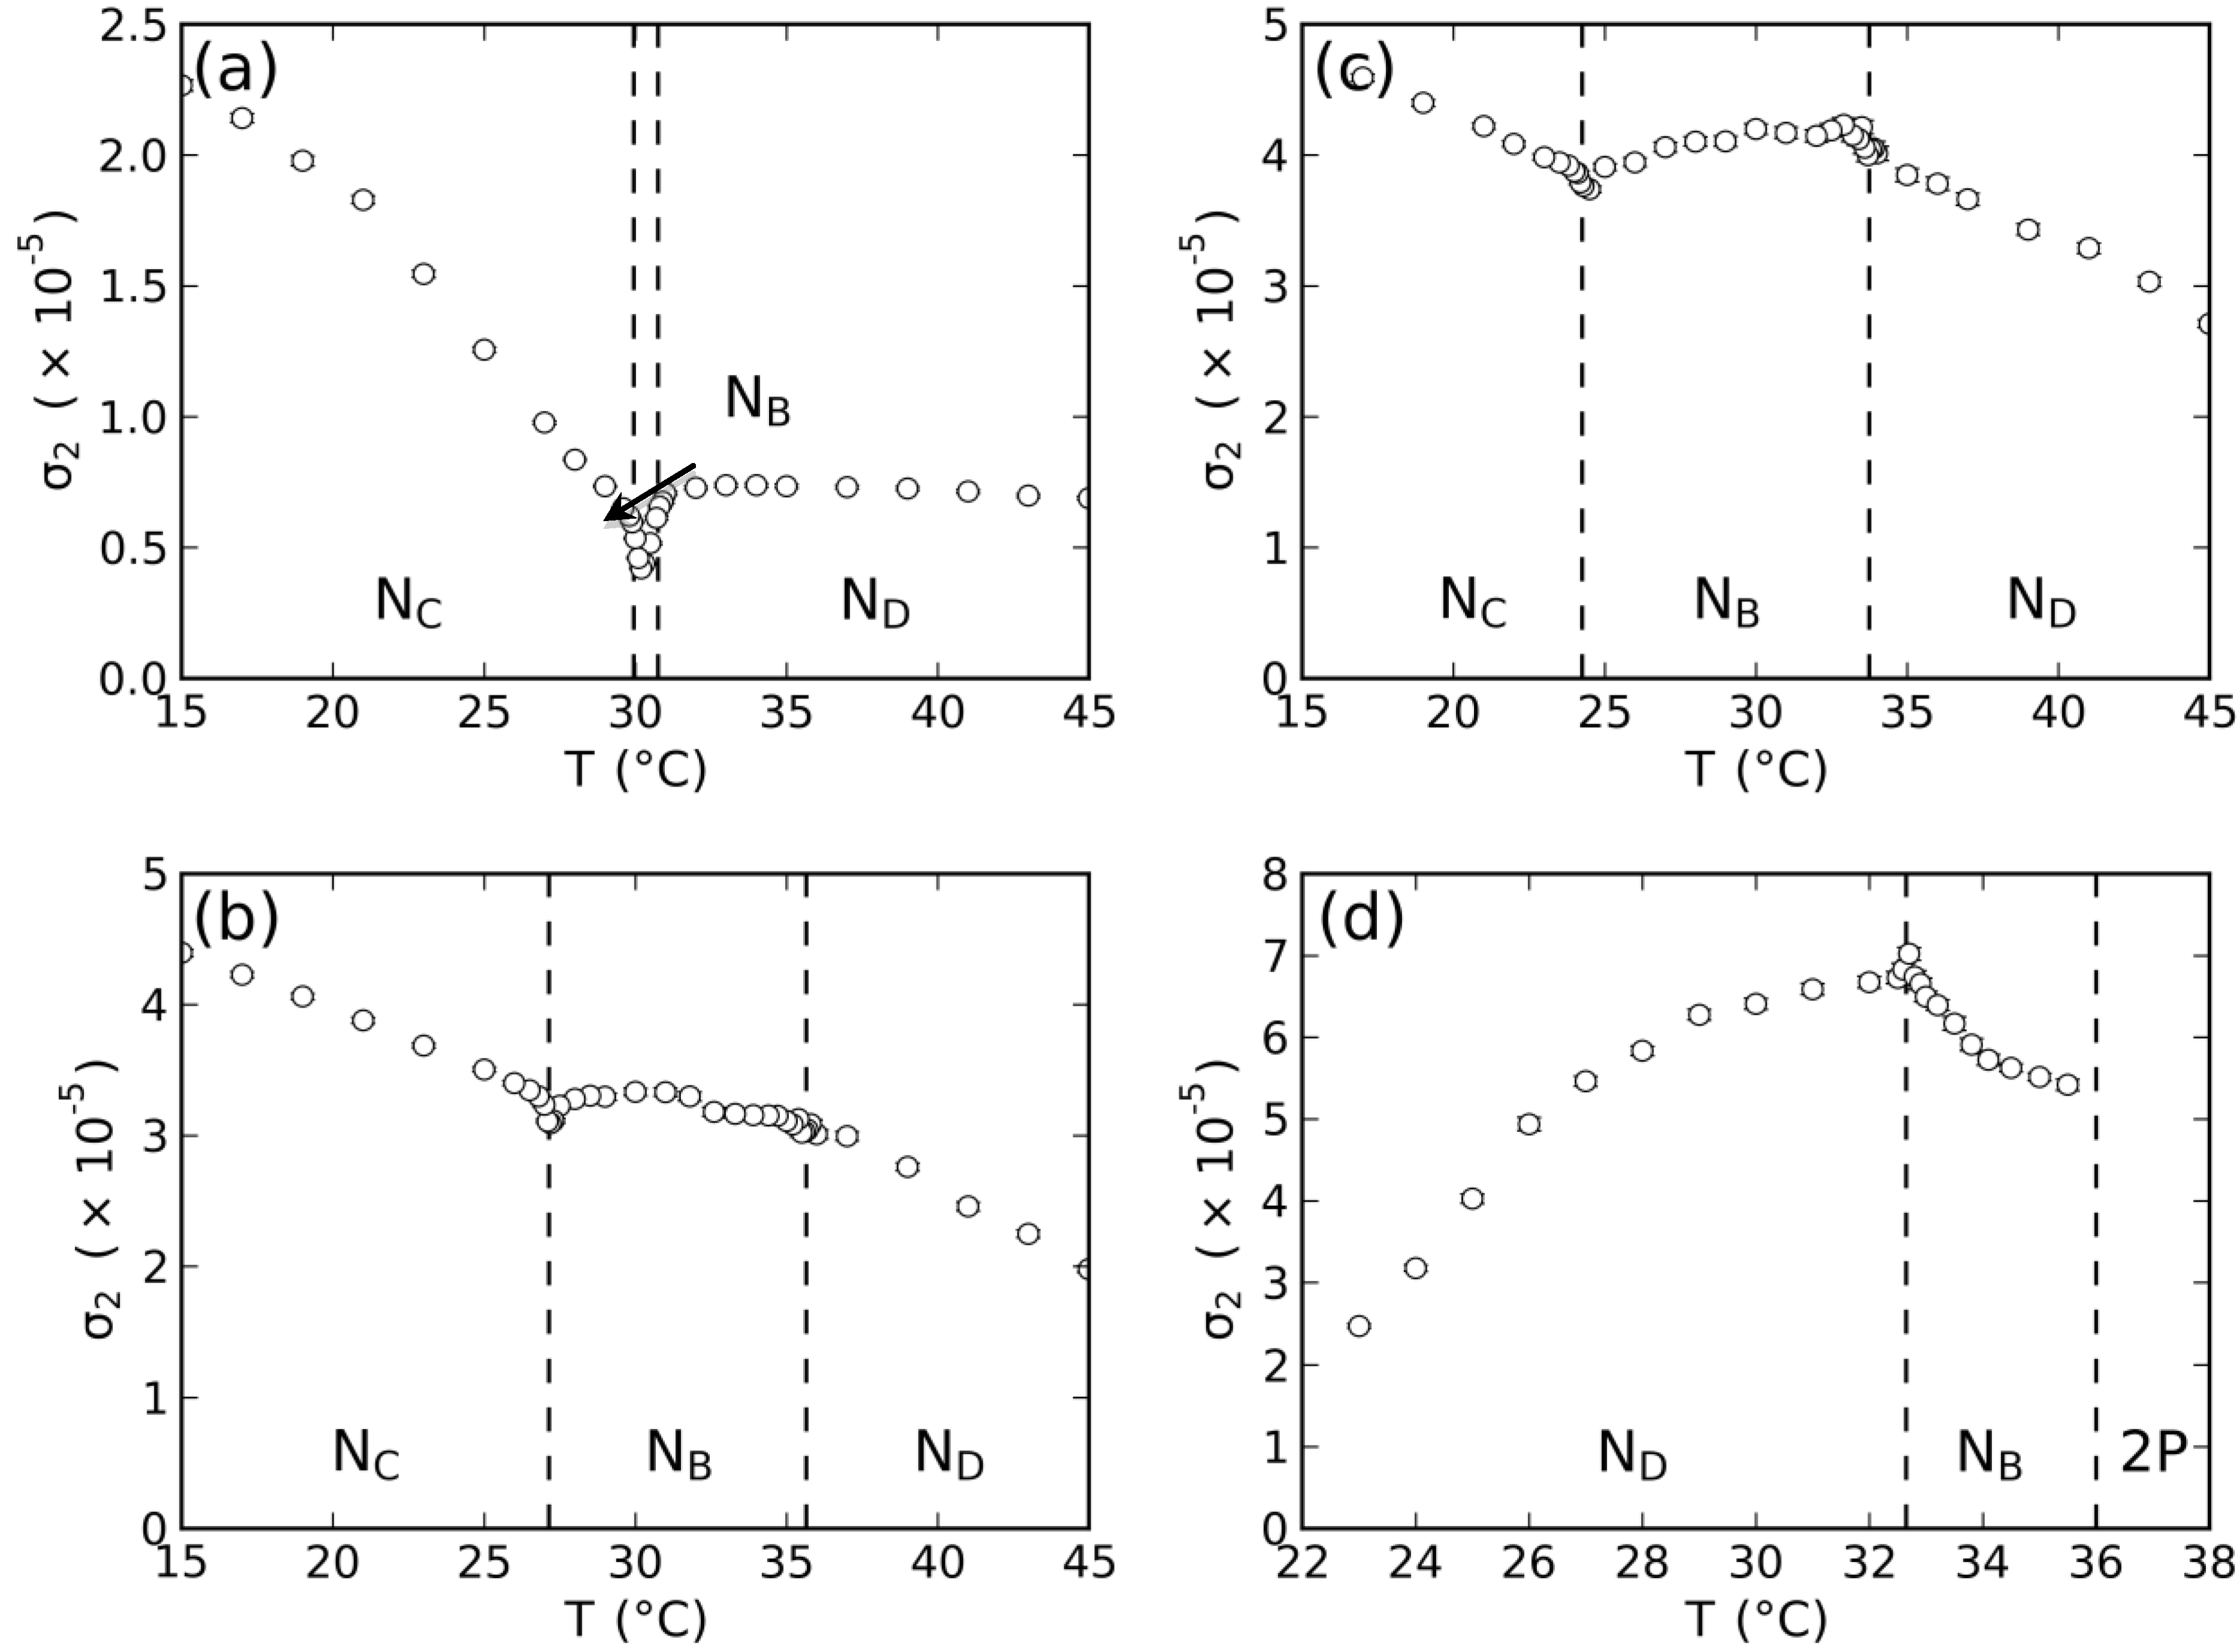
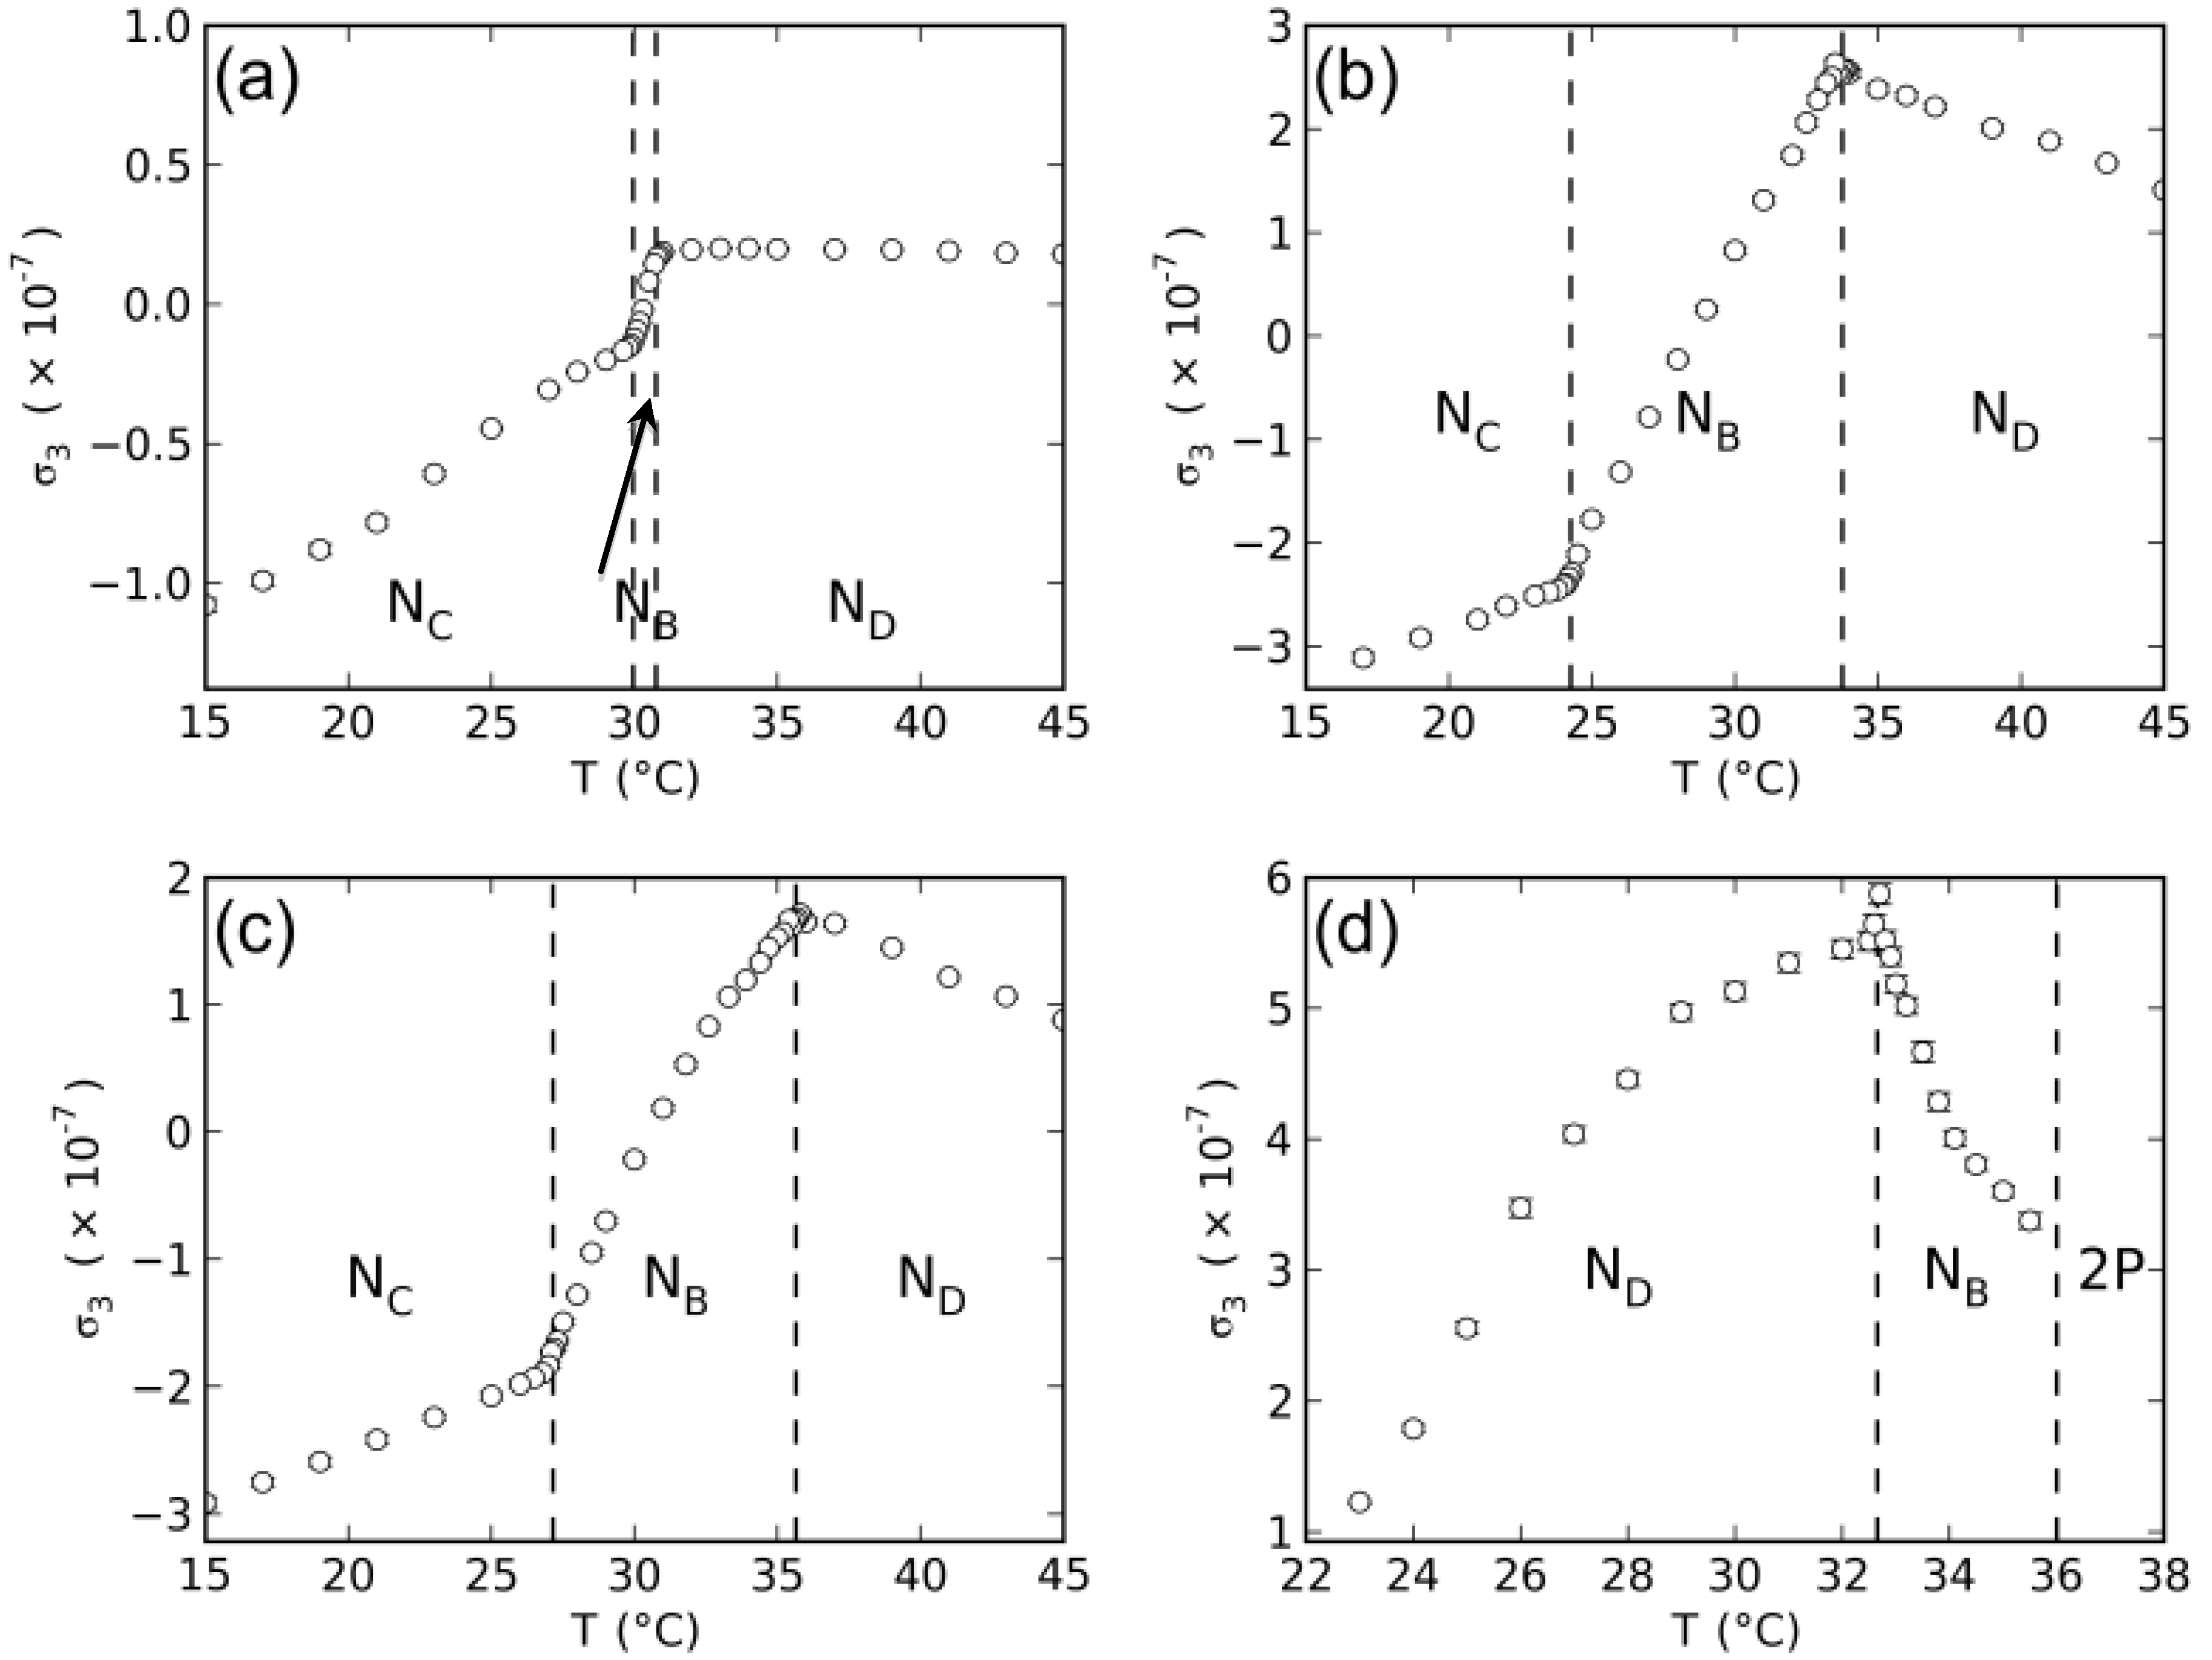
With the measured values of the birefringences in the nematic phases, the tensor order-parameter symmetric-invariants may be calculated.
Figure 3 and
Figure 4 show the temperature dependence of the invariants, σ
2 and σ
3, respectively. The behaviors of σ
2,3 ×
T in the vicinity of the uniaxial to biaxial nematic phase transitions are in accordance with the mean-field prediction,
i.e., σ
2 and σ
3 show a linear dependence with the temperature.
Figure 5 depicts the locations of the nematic phases in the space of the invariants. Solid lines correspond to the uniaxial nematic phases:
, where the + and − signs refer to the
ND and
NC phases, respectively.
Figure 3.
Temperature dependence of the tensor order-parameter symmetric-invariant, σ2, of the mixtures: (a) dl-KDDA/Cs2SO4/DDeOH/water; (b) dl-KDDS/Na2SO4/UndeOH/water; (c) dl-KDDS/Na2SO4/DDeOH/ water; and (d) dl-NaDDAs/Cs2SO4/UndeOH/water.
Figure 3.
Temperature dependence of the tensor order-parameter symmetric-invariant, σ2, of the mixtures: (a) dl-KDDA/Cs2SO4/DDeOH/water; (b) dl-KDDS/Na2SO4/UndeOH/water; (c) dl-KDDS/Na2SO4/DDeOH/ water; and (d) dl-NaDDAs/Cs2SO4/UndeOH/water.
The textures of the nematic phases of these mixtures observed in the POM are the classical ones, already reported in the literature [
9]. An interesting question that may be proposed is how the
d- and
l-enantiomers arrange in the micelles to give rise to a non-chiral nematic phase. However, for their pure
l-enantiomers, there is some experimental evidence about their organization in the chiral micelles. Du and co-workers [
21] investigated the molecular arrangement of
N-hexadecanoyl-
l-alanine (
N-HDA) by atomic force spectroscopy. This molecule belongs to the class of
N-acylamino acids being similar to the amino acid-based surfactant molecules employed by us in this study. This molecule has three additional CH
2 groups in its alkyl chain, with respect to our molecules, and its head group is neutral, e.g., not potassium or sodium salt. They analyzed the formation of the monolayers by chiral
N-HDA molecules on the silicon and mica surfaces and found that the hydrocarbon chains of
N-HDA molecules arrange as almost tilted and parallel to each other in the bilayer. They interpreted this molecular arrangement by means of the homochiral effect between chiral carbons in the head groups. A similar result was also reported for monoalkylethylenediamines [
22]. It is expected that the head groups of
N-HDA molecules,
l-alanine, form hydrogen bonding among them via neighboring carboxylic acid and amide groups (–C=O···N–H) at the surface of the micelles.
Figure 4.
Temperature dependence of the tensor order-parameter symmetric-invariant, σ3, of the mixtures: (a) dl-KDDA/Cs2SO4/DDeOH/water; (b) dl-KDDS/Na2SO4/UndeOH/water; (c) dl-KDDS/Na2SO4/DDeOH/water; and (d) dl-NaDDAs/Cs2SO4/UndeOH/water.
Figure 4.
Temperature dependence of the tensor order-parameter symmetric-invariant, σ3, of the mixtures: (a) dl-KDDA/Cs2SO4/DDeOH/water; (b) dl-KDDS/Na2SO4/UndeOH/water; (c) dl-KDDS/Na2SO4/DDeOH/water; and (d) dl-NaDDAs/Cs2SO4/UndeOH/water.
X-ray diffraction experiments performed with these mixtures gave information about the structure and local ordering of the micelles. A difficulty we faced with mixtures where Cs ions were present was the high absorption coefficient of the mixtures for the X-ray wavelength employed in the experiments. In the particular case of Samples 1 and 4, it was not possible to have reliable diffraction patterns in our experimental setup. The data of the different samples are presented in
Table 2. s
i,
i = 1,3 are the moduli of the scattering vector that correspond to the position of the diffraction bands along the horizontal (1-axis) and vertical (3-axis) of the laboratory frame axes. Thus, the repeating distances along these directions are s
i−1. Typical X-ray patterns are presented in
Figure 6. The X-ray scattering at small angles (visible near the beam stopper in
Figure 6) will not be analyzed in the present work. Three bands exist in these patterns: two along the 3-axis and one along the 1-axis directions. The outer band along the 3-axis is barely visible in the patterns.
Figure 5.
Loci of the nematic phases in the space of the invariants, σ2 and σ3, of the mixtures: (a) dl-KDDA/Cs2SO4/DDeOH/water; (b) dl-KDDS/Na2SO4/UndeOH/water; (c) dl-KDDS/Na2SO4/DDeOH/water; and (d) dl-NaDDAs/Cs2SO4/UndeOH/water.
Figure 5.
Loci of the nematic phases in the space of the invariants, σ2 and σ3, of the mixtures: (a) dl-KDDA/Cs2SO4/DDeOH/water; (b) dl-KDDS/Na2SO4/UndeOH/water; (c) dl-KDDS/Na2SO4/DDeOH/water; and (d) dl-NaDDAs/Cs2SO4/UndeOH/water.
Figure 6.
Typical X-ray diffraction patterns of the mixture dl-KDDS/Na2SO4/1-dodecanol/H2O: (a) ND phase, T = 36.0 °C; (b) NC phase, T = 24.0 °C.
Figure 6.
Typical X-ray diffraction patterns of the mixture dl-KDDS/Na2SO4/1-dodecanol/H2O: (a) ND phase, T = 36.0 °C; (b) NC phase, T = 24.0 °C.
The plot of the diffracted intensity as a function of the modulus of the scattering vector along the 3-axis (
Figure 7) reveals its presence. The two bands along the 3-axis are originated from the pseudo-lamellar ordering of the micelles, corresponding to the first and second-order bands, typical of lyotropic nematics with, at least, two amphiphiles [
23]. To go further in the analysis of the diffraction bands, we have to assume a model for the micelles. The model that is consistent with all the results from the different experimental techniques, adequate to describe the micelles in mixtures that present the three nematic phases, is the intrinsically biaxial micelles (IBM) model (see, e.g., [
9] for a comprehensive discussion about this model). This model assumes that the micelles have an orthorhombic symmetry in the three nematic phases, and orientational fluctuations of the correlation volumes originate the different symmetries of the nematic phases. The micelles may be sketched as a flattened ellipsoid, with three characteristic dimensions: the smallest one corresponds to the main amphiphilic bilayer, and the two others lie in the flat surface of the ellipsoid. Without additional information about the thickness of the main amphiphilic bilayer of the different mixtures investigated, we have to restrict our analysis to the average volume available per micelle,
i.e., the micelle itself and the water that surrounds it. We define a parameter that evaluates the anisotropy of the available volume per micelle as ϒ = s
1−1/s
3−1. It is interesting to compare the values of ϒ obtained in our present experiment with that encountered in the ternary mixture of KL/decanol/water, which is ϒ~2.2. It is expected that the bigger ϒ, the bigger the shape anisotropy of the micelle itself. Thus, the micelles present in Mixtures 2 and 3, in the nematic phases, are expected to be more symmetric (
i.e., less anisometric) than those on the KL mixture. This fact is consistent with the maximum values of the birefringences in these racemic mixtures, which are also smaller than those encountered in the KL mixture. Interestingly, the correlation lengths associated with the diffraction bands along Axis 3 of both racemic mixtures are smaller than those of the KL mixture (e.g., ξ
3~30 nm); however, those along Axis 1 are bigger than that of the KL mixture (e.g., ξ
1~6 nm). The order parameters associated with the first-order band along the 3-axis were calculated according to Deutsch calculation [
24] and show values consistent with the measurements of the coherence lengths,
i.e., the higher ξ, the higher the order parameter.
Figure 7.
Diffracted intensity (in logarithmic scale) as a function of the modulus of the scattering vector along the 3-axis. Mixture dl-KDDS/Na2SO4/1-dodecanol/H2O; ND phase, T = 36.0 °C. The arrow indicates the location of the second-order band.
Figure 7.
Diffracted intensity (in logarithmic scale) as a function of the modulus of the scattering vector along the 3-axis. Mixture dl-KDDS/Na2SO4/1-dodecanol/H2O; ND phase, T = 36.0 °C. The arrow indicates the location of the second-order band.
2.2. Nematic Phases of KDDGly/Na2SO4/TDeOH/Water
This new mixture presents nematic phases, but exhibited a peculiar behavior with respect to the other racemic
N-acylamino acid surfactants mixtures in the conoscopy experiment. The
ND phase aligns perfectly in the magnetic field (applying the alignment procedure previously described) only after about four hours. When the temperature is decreased, the center of the conoscopic pattern (the Maltese cross; see, e.g.,
Figure 1a) splits, indicating the beginning of the
NB phase domain, similar to
Figure 1b. Suddenly, all the fringes disappear just after the
ND to
NB transition, indicating a loss of the sample’s alignment. The usual orientational procedure employed to align the
NB phase that was shown to be effective in the case of the other mixtures reported here was not enough to orient the biaxial nematic phase in this case. Let us describe, now, the behavior of this mixture placed in a 0.2 mm flat microslide under the POM experiment. In the
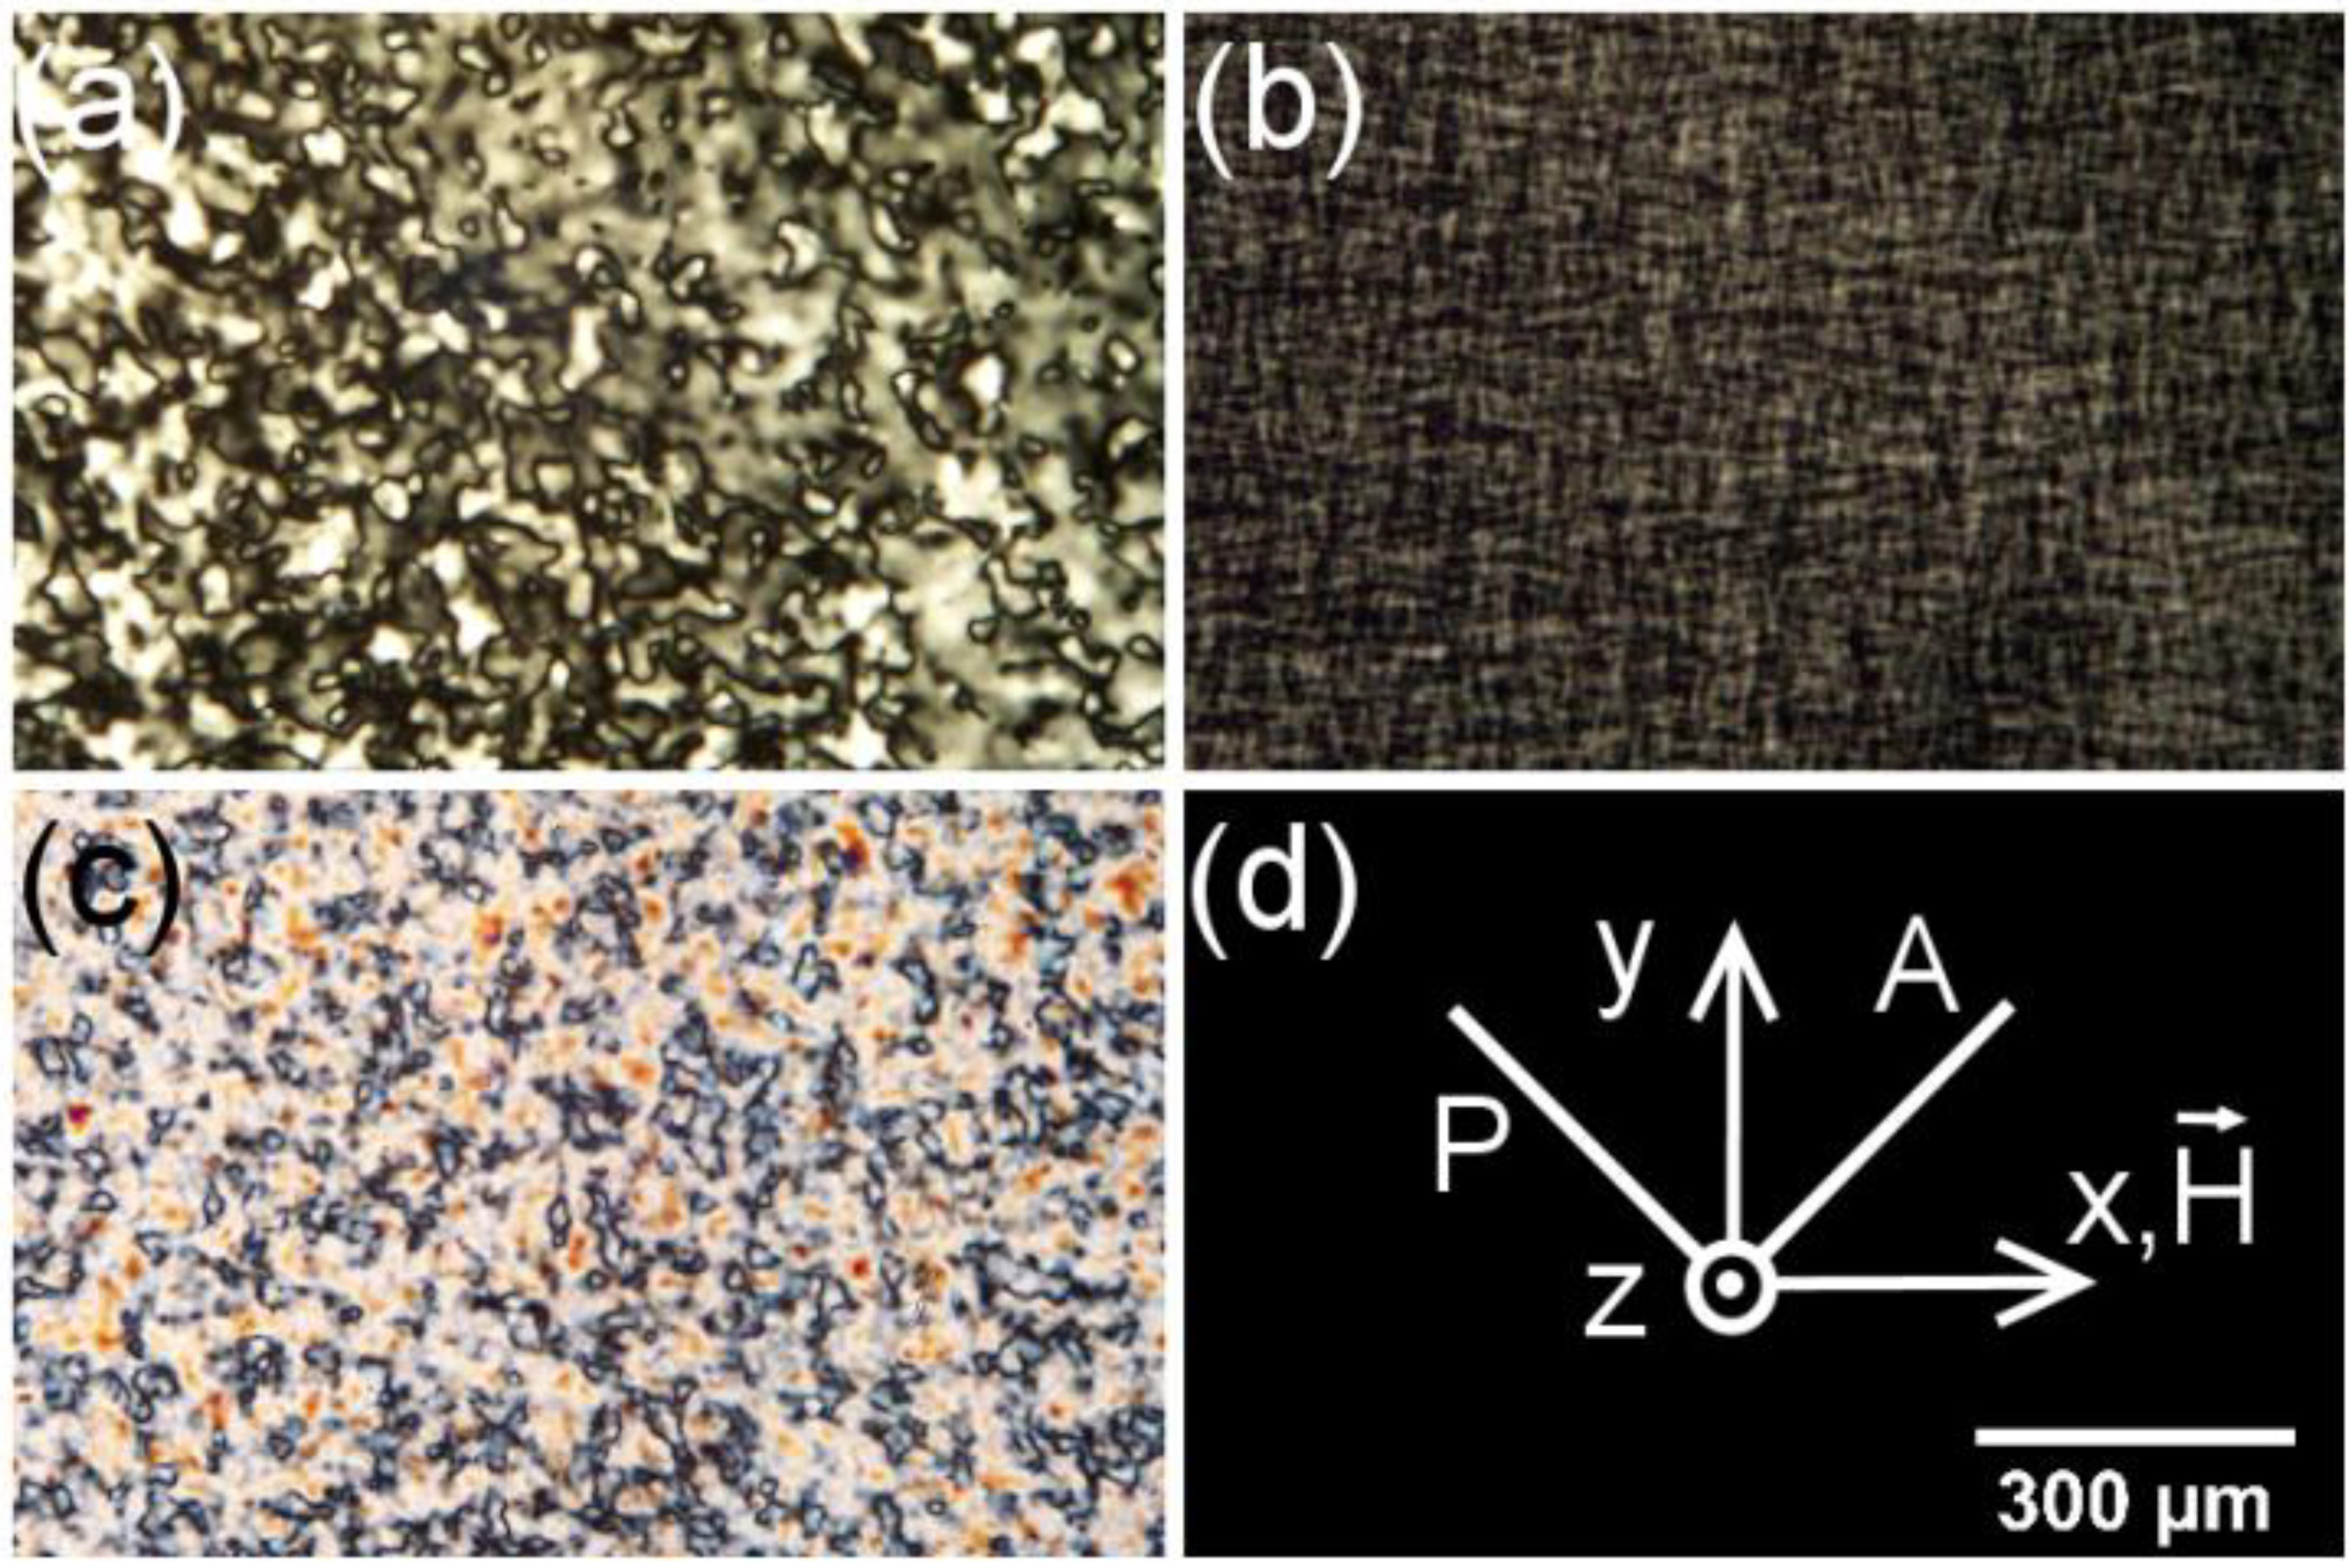
ND phase, 1 h after filling the microslide and in the presence of the magnetic field, a characteristic schlieren texture was observed (
Figure 8a). After about 5 h, the texture is pseudo-isotropic, with the director perpendicular to the glass surfaces of the microslide and to the magnetic field. Decreasing the temperature, the sample transits to the
NB phase, and the texture reveals defects characteristic of a non-oriented sample (
Figure 8b). This result explains to us the disappearance of the conoscopic fringes in the
ND to
NB phase transition, since the sample completely lost its alignment. Decreasing the temperature to about 23 °C, the texture observed is characteristic of the
NC phase (
Figure 8c).
To find the temperature of the
NC to
NB phase transition, we kept the sample in the microslide about 72 h at 23.0 °C, in the presence of the magnetic field. A planar texture was obtained with the director aligned parallel to the magnetic field. With the help of a Berek compensator, we measured the optical birefringence in the
NC phase Δ
n ~ 3 × 10
−3. Slowly increasing the temperature, when the
NC to
NB transition is achieved (
T = 25.8 °C), the sample lost its alignment, and the conoscopic fringes do not allow a precise measurement of the birefringence. This behavior is very similar to what we observed at the
ND to
NB transition. This behavior, however, is different from that observed with the racemic mixtures investigated in this work. With those racemic mixtures, when the uniaxial to biaxial phase transition takes place, the two optical axes of the
NB phase lie in the plane perpendicular to the magnetic field, and those, which are not there, are easily replaced in that plane by the orientational procedure described in the
Experimental Section. The KDDGly mixture, however, presents a weak coupling with the magnetic field, which avoids the quick orientation of the two optical axes of the
NB phase on that plane. This weak magnetic coupling was also observed in the
NC phase subjected to the magnetic field that took about three days to achieve the planar orientation of the director. Thus, when the sample transits from a uniaxial to the biaxial phase, the two optical axes, in different correlation volumes lie in different planes, giving rise to the defects observed in the textures (see, e.g.,
Figure 8b).
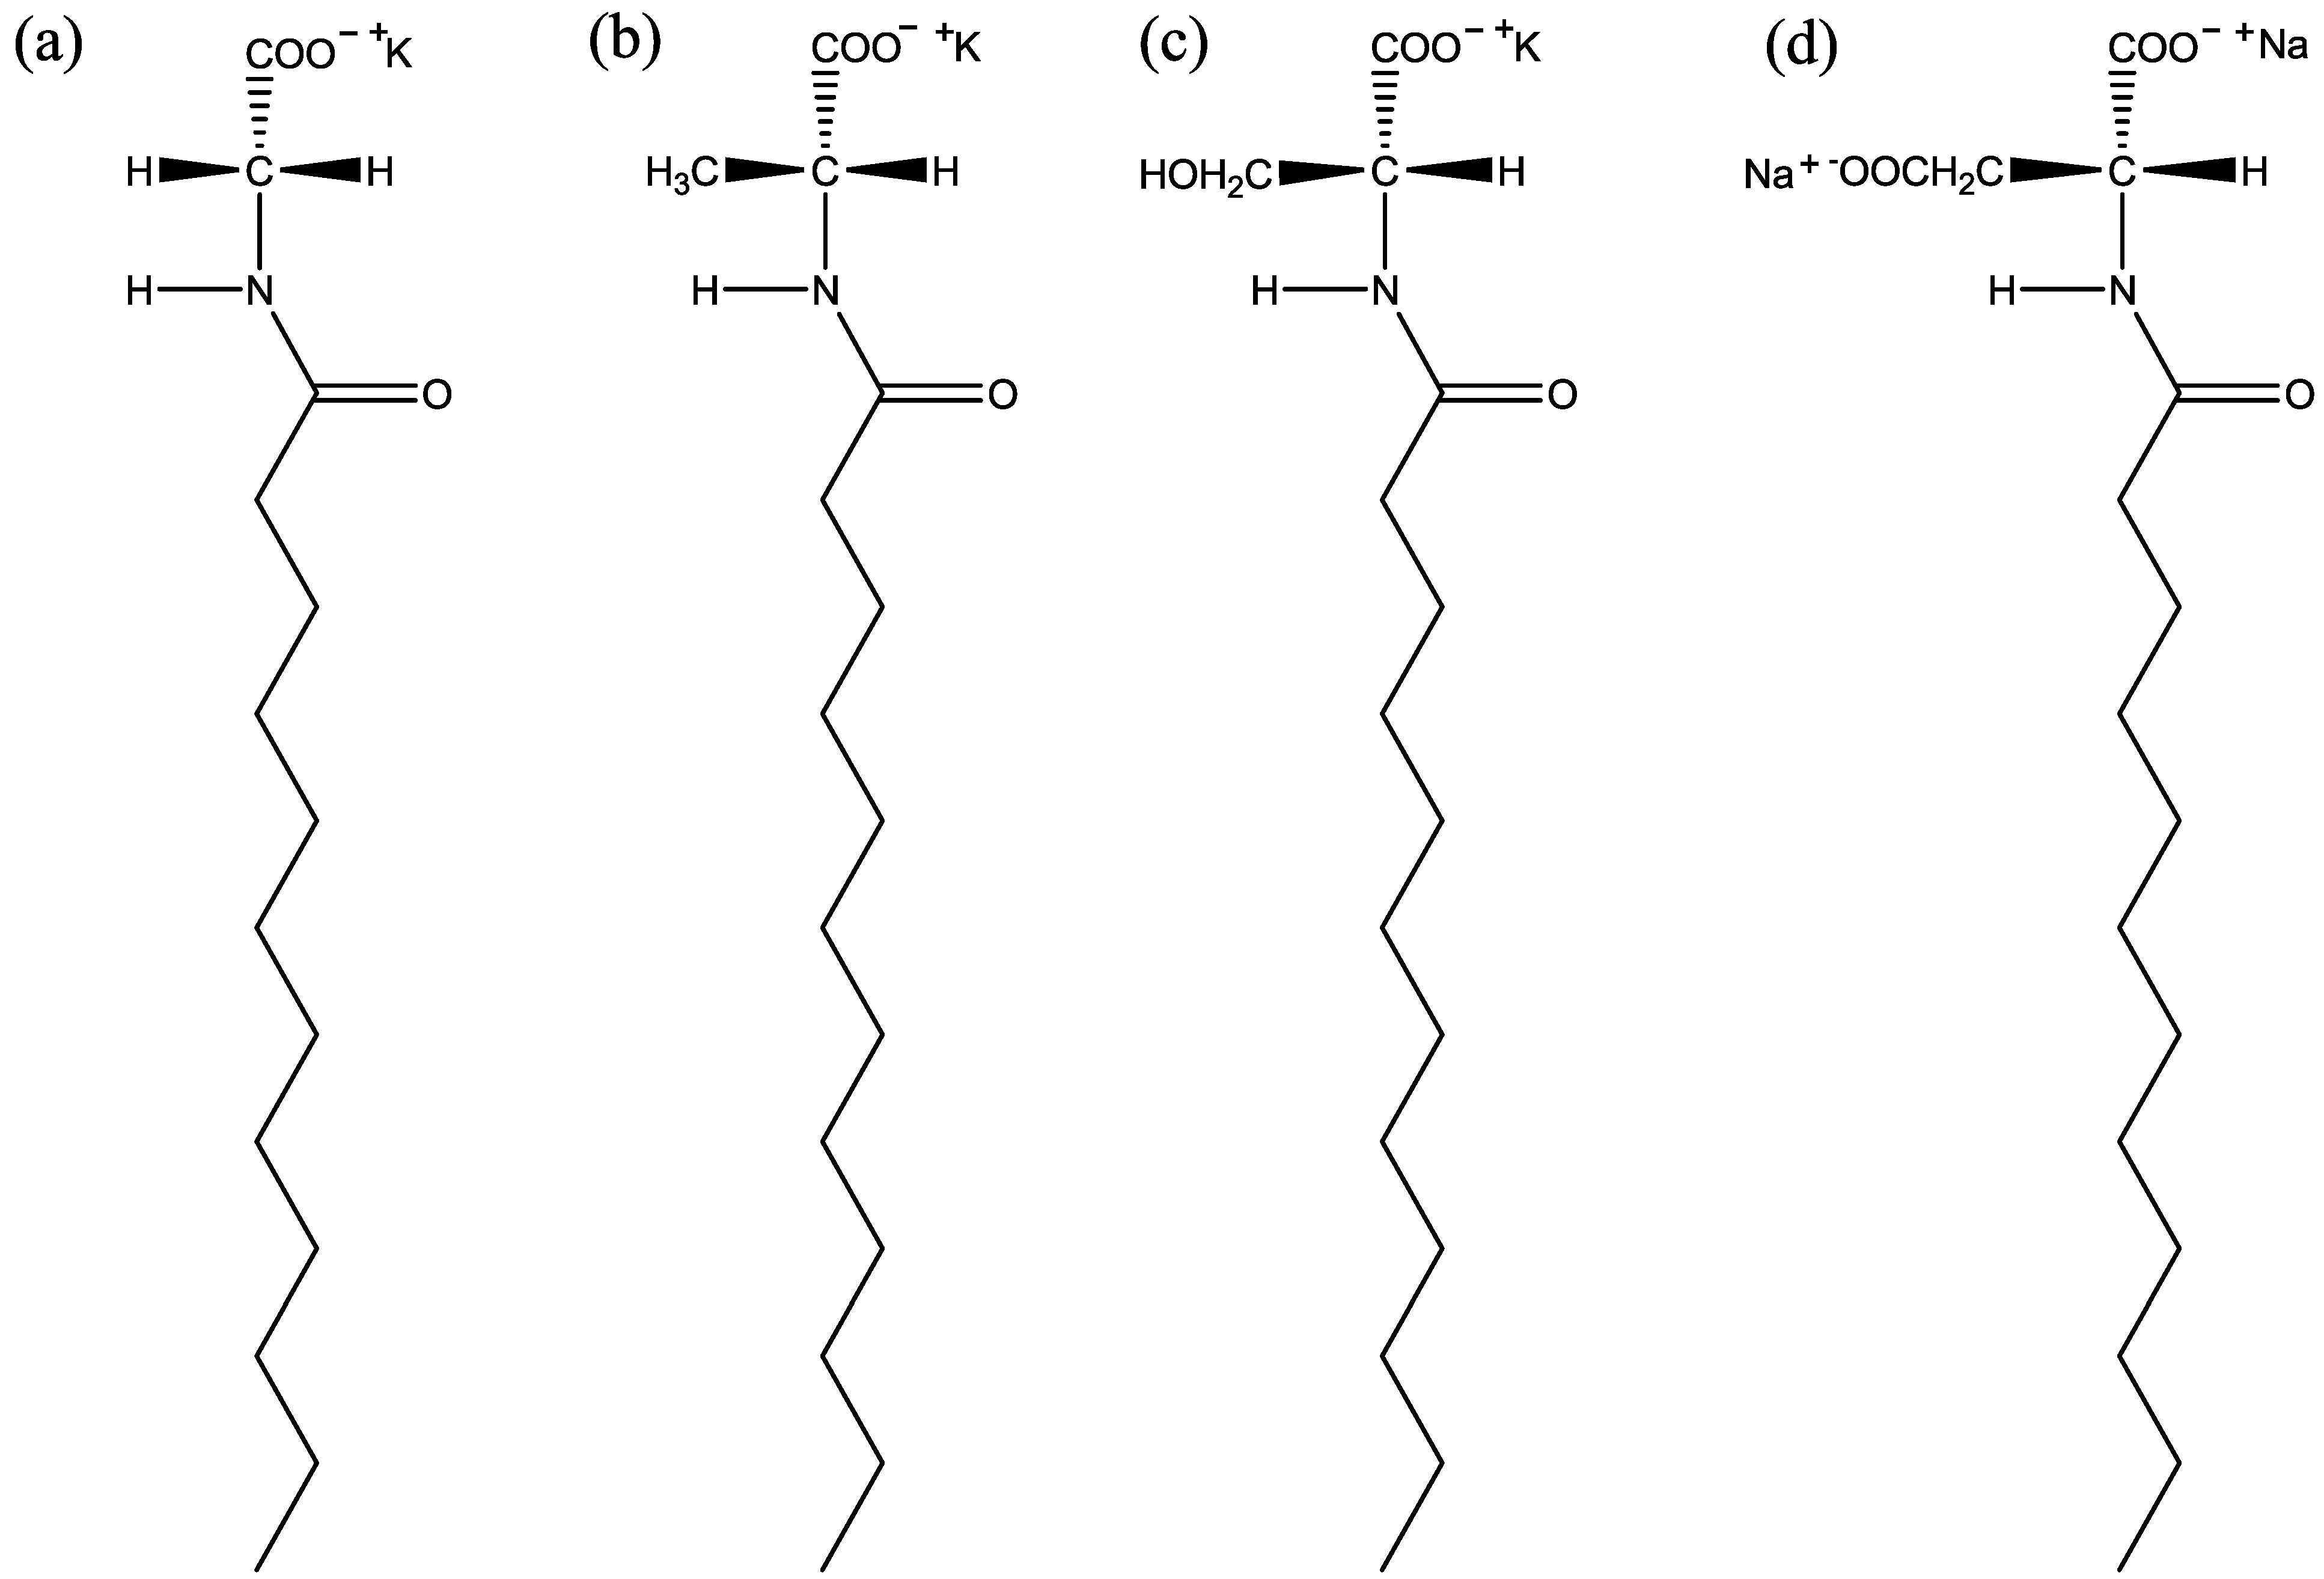
Let us point out some characteristics of the KDDGly molecule that could help us understand why the nematic phases of this mixture present a weak magnetic coupling. Due to the structure of the KDDGly molecule head group, it is expected that hydrogen bonds exist between neighboring molecules in the micelles [
25] (
Figure 9).
Figure 8.
Textures of N-dodecanoyl-glycinate (KDDGly)/Na2SO4/1-tridecanol (TDeOH)/water mixture under a magnetic field of 0.3 kG: (a) ND at 40.0 °C after 1 h; (b) ND to NB phase transition at ~30.1 °C; and (c) NC at 23.00 °C; (d) laboratory reference frame. P, A and
are the directions of the polarizer, analyzer and magnetic field, respectively.
Figure 9.
Molecular arrangement of the KDDGly molecules. The hashed bonds between –C=O and –N–H correspond to the hydrogen bonds.
Figure 9.
Molecular arrangement of the KDDGly molecules. The hashed bonds between –C=O and –N–H correspond to the hydrogen bonds.
Comparing the molecules KDDGly and KL, the main difference between them is that the KDDGly molecules form hydrogen bonds between them and the KL molecules do not. The different nematic phases of the largely investigated lyotropic mixture, KL/decanol/water [
1,
9], show an effective magnetic coupling. The orientational procedure employed by us quickly (~minutes) orients the sample. It is known that in micellar systems, there exist a characteristic time for the exchange of amphiphilic molecules between the micelles and the bulk, being of the order of s [
26]. When a system composed of anisotropic micelles (as in the case of the lyotropic τ ~ 10
−5–10
−3s in nematic phases) is subjected to an external magnetic field, the alignment process is complex, having different contributions: (1) a sterical contribution from the micelle-micelle interaction (collective behavior); (2) the coupling of an individual micelle with the magnetic field; and (3) the coupling from each individual amphiphilic molecule (even from the bulk) with the field. The aliphatic chains of the amphiphilic molecules present the anisotropy of the diamagnetic susceptibility of the order of (−10
−4) cgs [
27]. In the presence of the magnetic field, we expect that the molecular exchange between micelles and the bulk takes the field constraint into account and that the molecules entering in the micelles, as time goes by, be placed in more energetically favored locations in terms of the magnetic coupling between molecules and the field. The existence of hydrogen bonds (typical energy of 10 kcal/mol [
28]) between neighboring KDDGly molecules in the micelles could increase this typical time, τ. Coarsely, we could say that micelles with the KDDGly molecules are basic units “more rigid” with respect to those constituted by molecules that do not form hydrogen bonds. In this framework, the KDDGly system would show a lower response to the magnetic field, explaining our difficulty in orienting this sample.
The X-ray diffraction patterns of this mixture also show the pseudo-lamellar ordering, with the first and second-order bands along the 3-axis and a broad band along the 1-axis (see
Table 1). The coherence lengths encountered were similar to those of the racemic mixtures. However, the order parameter calculated was smaller, which is consistent with the difficulty in obtaining a well-oriented sample under the action of a magnetic field.
Table 1.
X-ray diffraction data. si, i = 1,3 represents the moduli of the scattering vector that correspond to the position of the diffraction bands along the horizontal (1-axis) and vertical (3-axis) directions of the laboratory frame axes. OP represents the order parameter, and ξi, i = 1,3 represents the correlation length corresponding to each diffraction band. ϒ = s1−1/s3−1 represents the average anisotropy of the available volume per micelle.
| Sample | Phase | s1−1 (nm) | s3−1 (nm) | OP | ξ1 (nm) | ξ3(nm) | ϒ |
|---|
| 2 | NC | 7.2 ± 0.3 | 4.9 ± 0.1 | 0.27 | 9 | 19 | 1.5 |
| 3 | ND | 6.5 ± 0.3 | 4.9 ± 0.1 | 0.43 | 12 | 20 | 1.3 |
| 5 | ND | 6.8 ± 0.5 | 5.5 ± 0.1 | 0.29 | 11 | 19 | 1.2 |


