Figure 1.
Biplot analysis based on diameter at breast height (DBH) data of 25 provenances. (a) Polygon view of genotype by environment (G×E) interaction (GGE) biplot—which is best for what, (b) genotypes of ranking provenances. A, Mengla; B, Yuanyang; C, Mojiang; D, Jinghong; E, Xichou; F, Zhenyuan; G, Tengchong; H, Jinggu; I, Ruili; J, Fengqing; K, Pingbian; L, Jiangcheng; M, Shuangjiang; N, Lancang; O, Lingyun; P, Longzhou; Q, Donglan; R, Tianlin; S, Debao; T, Tiane; U, Pingguo; V, Baise; W, Tianyang; X, Jingxi; Y, Napo.
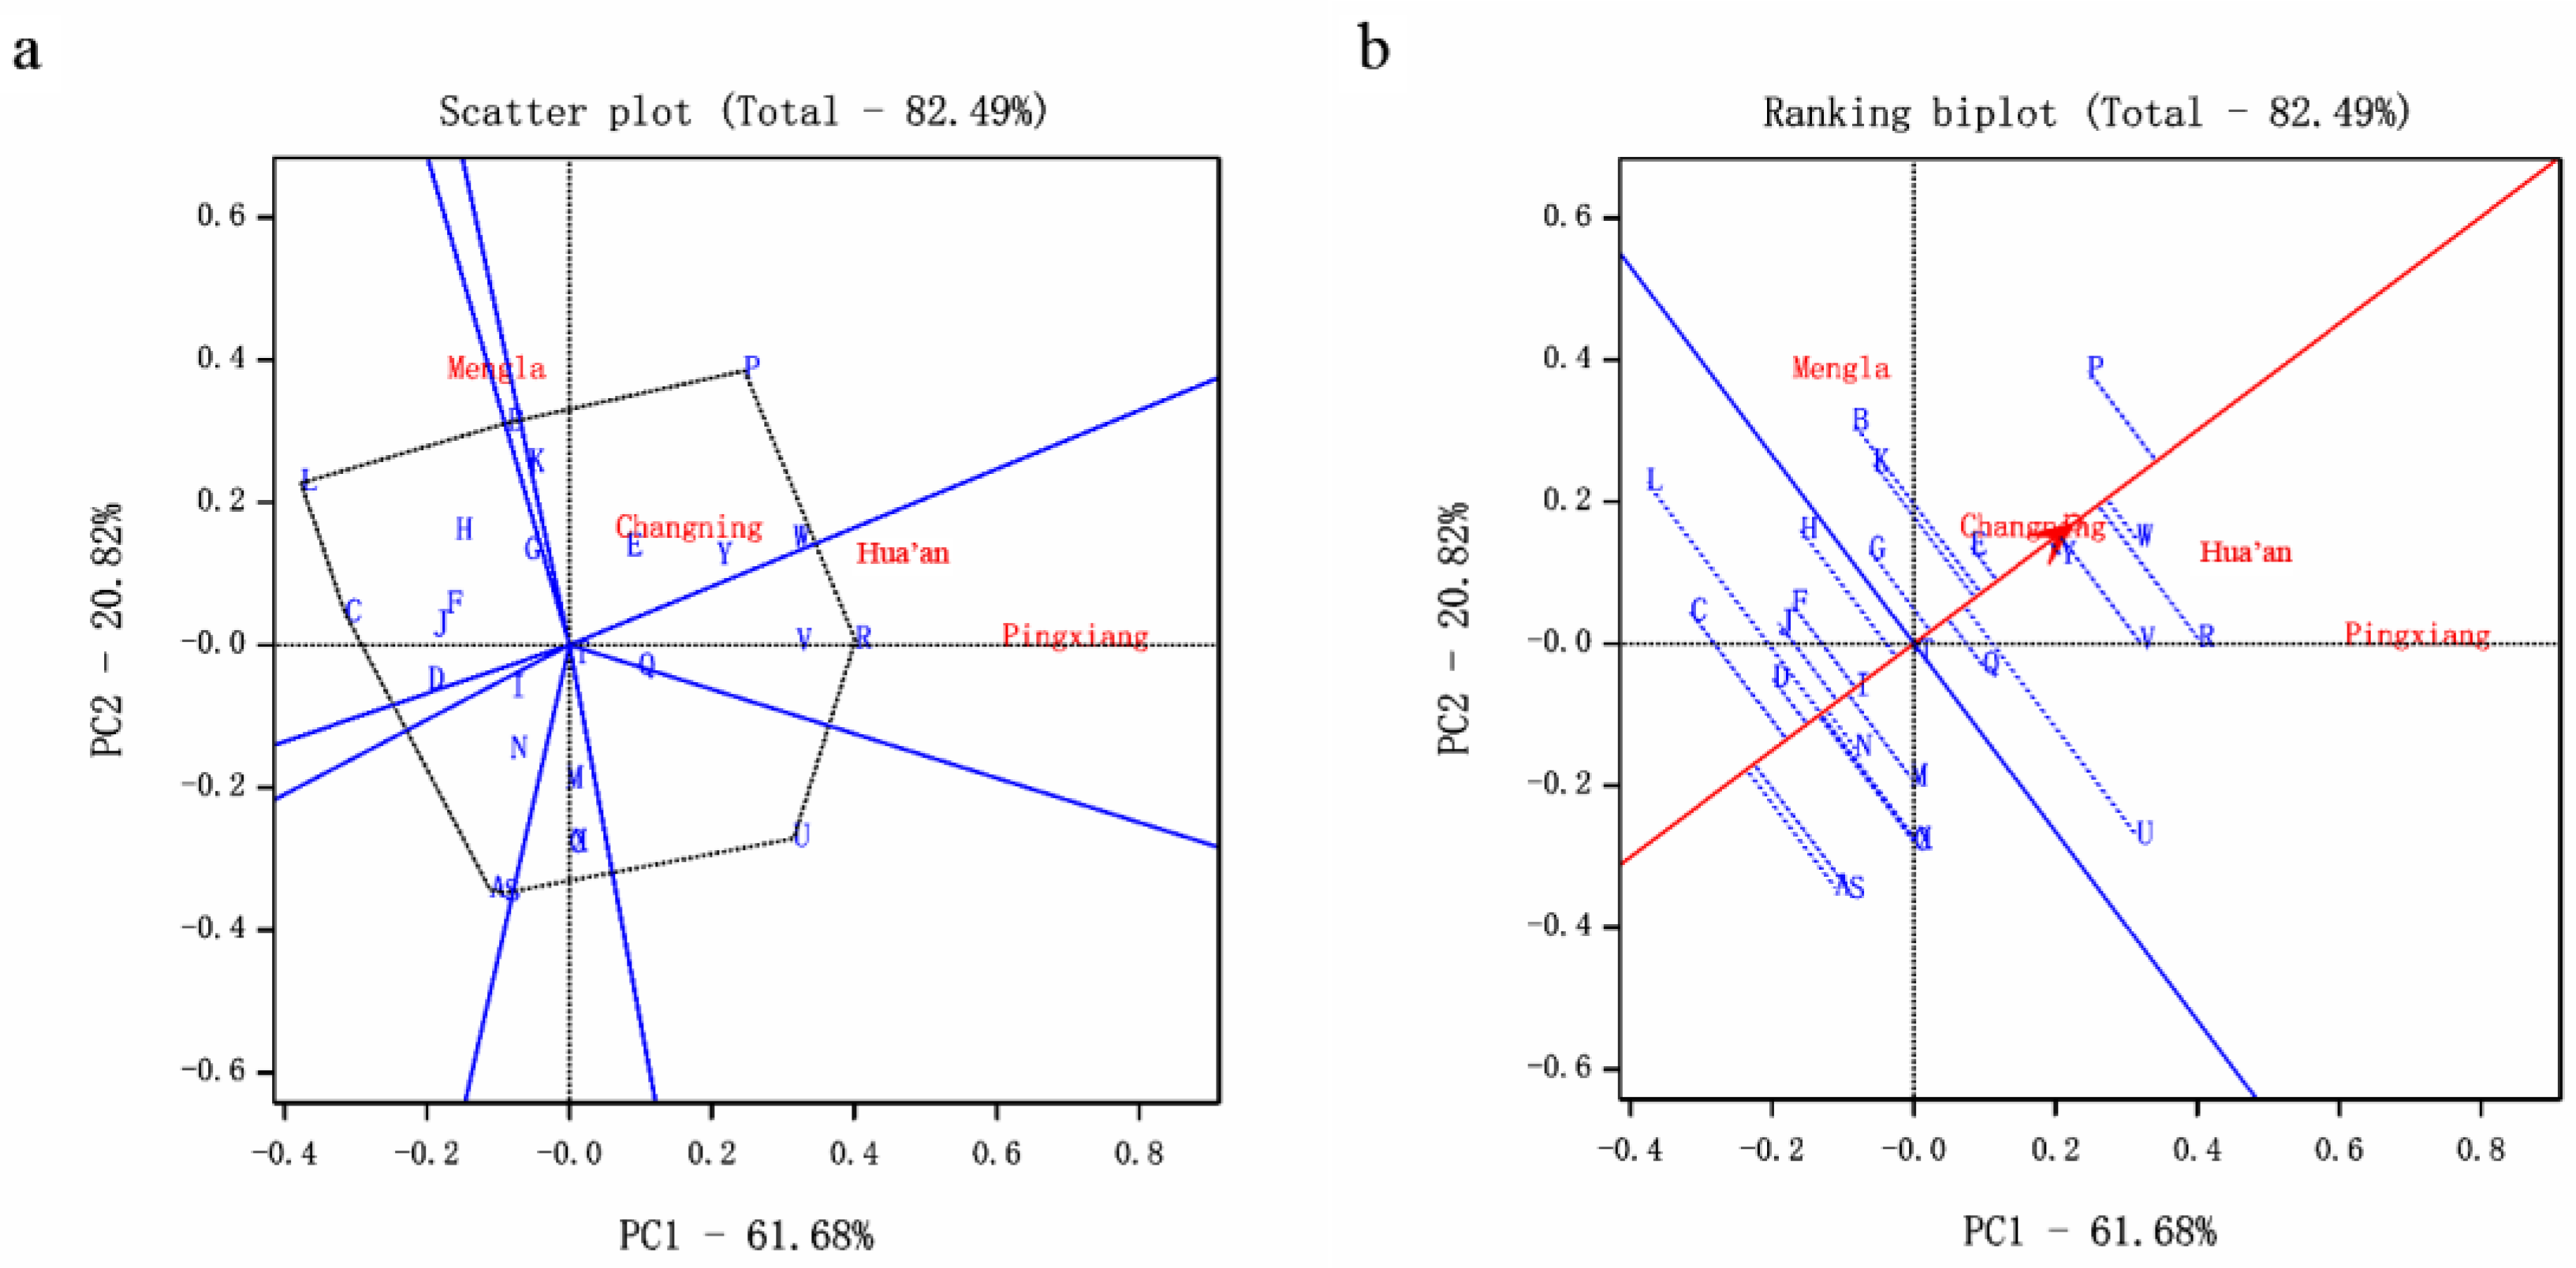
Figure 2.
Biplot analysis based on the height of 25 provenances. (a) Polygon view of GGE biplot—which is best for what, (b) genotypes of ranking provenances. A, Mengla; B, Yuanyang; C, Mojiang; D, Jinghong; E, Xichou; F, Zhenyuan; G, Tengchong; H, Jinggu; I, Ruili; J, Fengqing; K, Pingbian; L, Jiangcheng; M, Shuangjiang; N, Lancang; O, Lingyun; P, Longzhou; Q, Donglan; R, Tianlin; S, Debao; T, Tiane; U, Pingguo; V, Baise; W, Tianyang; X, Jingxi; Y, Napo.
Figure 3.
Biplot analysis based on HCB data of 25 provenances. (a) Polygon view of GGE biplot—which is best for what, (b) genotypes of ranking provenances. A, Mengla; B, Yuanyang; C, Mojiang; D, Jinghong; E, Xichou; F, Zhenyuan; G, Tengchong; H, Jinggu; I, Ruili; J, Fengqing; K, Pingbian; L, Jiangcheng; M, Shuangjiang; N, Lancang; O, Lingyun; P, Longzhou; Q, Donglan; R, Tianlin; S, Debao; T, Tiane; U, Pingguo; V, Baise; W, Tianyang; X, Jingxi; Y, Napo.
Figure 4.
Biplot analysis based on CW data of 199 families. (a) Polygon view of GGE Biplot – which is best for what, (b) genotypes of ranking provenances. A, Mengla; B, Yuanyang; C, Mojiang; D, Jinghong; E, Xichou; F, Zhenyuan; G, Tengchong; H, Jinggu; I, Ruili; J, Fengqing; K, Pingbian; L, Jiangcheng; M, Shuangjiang; N, Lancang; O, Lingyun; P, Longzhou; Q, Donglan; R, Tianlin; S, Debao; T, Tiane; U, Pingguo; V, Baise; W, Tianyang; X, Jingxi; Y, Napo; Letters followed by numbers were the number of families.
Figure 5.
Biplot analysis based on all traits of 25 provenances. (a) Polygon view of GGE biplot—which is best for what, (b) genotypes of ranking provenances. DBH, diameter at breast height; HCB, height to live crown base; CW, crown width; SF, stem form; CS, crown shape; BRA, branchiness; A, Mengla; B, Yuanyang; C, Mojiang; D, Jinghong; E, Xichou; F, Zhenyuan; G, Tengchong; H, Jinggu; I, Ruili; J, Fengqing; K, Pingbian; L, Jiangcheng; M, Shuangjiang; N, Lancang; O, Lingyun; P, Longzhou; Q, Donglan; R, Tianlin; S, Debao; T, Tiane; U, Pingguo; V, Baise; W, Tianyang; X, Jingxi; Y, Napo.
Figure 6.
Biplot analysis based on all traits of 199 families. (a) Polygon view of GGE Biplot—which is best for what, (b) Genotypes of ranking families. DBH, diameter at breast height; HCB, height to live crown base; CW, crown width; SF, stem form; CS, crown shape; BRA, branchiness; A, Mengla; B, Yuanyang; C, Mojiang; D, Jinghong; E, Xichou; F, Zhenyuan; G, Tengchong; H, Jinggu; I, Ruili; J, Fengqing; K, Pingbian; L, Jiangcheng; M, Shuangjiang; N, Lancang; O, Lingyun; P, Longzhou; Q, Donglan; R, Tianlin; S, Debao; T, Tiane; U, Pingguo; V, Baise; W, Tianyang; X, Jingxi; Y, Napo; Letters followed by numbers were the number of families.
Table 1.
Locations, climatic conditions, and tree age of four trials.
Table 1.
Locations, climatic conditions, and tree age of four trials.
| Site | Latitude N | Longitude E | Altitude (m) | Mean Annual Air Temperature (°C) | Rainfall (mm·Year−1) | Tree Age (Year) |
|---|
| Mengla, Yunnan | 21°31′39″ | 101°29′23″ | 1161 | 21.70 | 1350 | 15 |
| Pingxiang, Guangxi | 22°01′59″ | 106°51′01″ | 550 | 20.20 | 1350 | 15 |
| Hua’an, Fujian | 24°56′19″ | 117°30′59″ | 275 | 20.80 | 1643 | 14 |
| Changning, Yunnan | 24°49′23″ | 99°56′54″ | 1250 | 18.50 | 1260 | 10 |
Table 2.
Growth and quality performance of Betula alnoids at four trial sites.
Table 2.
Growth and quality performance of Betula alnoids at four trial sites.
| Sites | Values | MADBH (cm·Year−1) | MAH (m·Year−1) | HCB·Height−1 | CW (m) | MAVOL (m3·Year−1) | SF | CS | BRA |
|---|
| Mengla | Mean (SE) | 1.34 (0.01) b | 1.22 (0.01) a | 0.57 (0.00) b | 4.71 (0.04) a | 0.0196 (0.0003) a | 0.63 (0.02) c | 0.65 (0.01) | 0.77 (0.01) a |
| | Range | 0.3–2.5 | 0.4–1.8 | 0.1–0.9 | 0.6–9.9 | 0.000–0.069 | 0.1–1.0 | 0.1–1.0 | 0.1–1.0 |
| Pingxiang | Mean (SE) | 1.04 (0.01) c | 0.94 (0.01) c | 0.61 (0.01) a | 4.49 (0.06) b | 0.0098 (0.0004) b | 0.69 (0.02) b | 0.64 (0.01) | 0.75 (0.01) ab |
| | Range | 0.3–2.5 | 0.4–1.9 | 0.2–0.9 | 0.7–9.2 | 0.000–0.071 | 0.1–1.0 | 0.1–1.0 | 0.1–1.0 |
| Hua’an | Mean (SE) | 1.50 (0.01) a | 1.18 (0.01) b | 0.56 (0.00) c | 3.09 (0.05) c | 0.0204 (0.0003) a | 0.52 (0.01) d | 0.64 (0.01) | 0.65 (0.01) c |
| | Range | 0.3–2.5 | 0.2–1.9 | 0.2–1.4 | 0.5–7.5 | 0.000–0.078 | 0.1–1.0 | 0.1–1.0 | 0.1–1.0 |
| Changning | Mean (SE) | 0.78 (0.01) d | 0.83 (0.01) d | 0.51 (0.01) d | 2.34 (0.07) d | 0.0020 (0.0005) c | 0.77 (0.03) a | 0.64 (0.02) | 0.73 (0.01) b |
| | Range | 0.3–2.4 | 0.4–1.9 | 0.2–0.9 | 0.6–6.7 | 0.000–0.072 | 0.1–1.0 | 0.1–1.0 | 0.1–1.0 |
Table 3.
Growth and quality performance for 25 provenances of Betula alnoids.
Table 3.
Growth and quality performance for 25 provenances of Betula alnoids.
| Provenances | MADBH (cm·Year−1) | MAH (m·Year−1) | HCW·Height−1 | CW (m) | MAVOL (m3·Year−1) | SF | CS | BRA |
|---|
| A | 1.04 (0.05) j | 1.02 (0.05) f | 0.60 (0.02) ab | 3.16 (0.25) c | 0.0096 (0.0013) f | 0.77 (0.04) a | 0.66 (0.05) bc | 0.83 (0.04) a |
| B | 1.29 (0.05) abcde | 1.08 (0.04) bcdef | 0.57 (0.02) bcdefgh | 3.80 (0.23) ab | 0.0158 (0.0017) abcde | 0.67 (0.04) bcde | 0.66 (0.04) bc | 0.73 (0.04) bcdef |
| C | 1.19 (0.03) bcdefghi | 1.12 (0.02) abcde | 0.61 (0.01) a | 3.68 (0.14) ab | 0.0148 (0.0011) abcde | 0.63 (0.03) cdefg | 0.63 (0.03) bc | 0.77 (0.02) abcdef |
| D | 1.12 (0.04) ij | 1.04 (0.03) ef | 0.59 (0.01) abcde | 3.72 (0.18) ab | 0.0122 (0.0011) def | 0.68 (0.03) bcde | 0.67 (0.03) bc | 0.76 (0.03) bcdef |
| E | 1.27 (0.03) abcdefg | 1.10 (0.02) bcdef | 0.55 (0.01) defgh | 3.86 (0.13) ab | 0.0151 (0.0008) abcde | 0.62 (0.03) defg | 0.71 (0.02) b | 0.67 (0.02) def |
| F | 1.15 (0.06) fghij | 1.05 (0.04) def | 0.58 (0.02) bcdef | 3.28 (0.22) bc | 0.0133 (0.0018) cdef | 0.75 (0.04) abc | 0.63 (0.04) bc | 0.82 (0.03) ab |
| G | 1.18 (0.07) cdefghi | 1.13 (0.05) abcde | 0.60 (0.02) abcd | 3.49 (0.25) abc | 0.0183 (0.0023) a | 0.70 (0.05) abcd | 0.69 (0.05) bc | 0.80 (0.04) ab |
| H | 1.25 (0.04) abcdefgh | 1.11 (0.03) abcde | 0.58 (0.01) bcdefg | 3.97 (0.18) a | 0.0156 (0.0011) abcde | 0.69 (0.03) bcde | 0.66 (0.03) bc | 0.77 (0.03) abcde |
| I | 1.20 (0.05) bcdefghi | 1.14 (0.03) abc | 0.58 (0.01) abcdef | 3.94 (0.18) a | 0.0166 (0.0014) abcd | 0.67 (0.03) bcdef | 0.64 (0.04) bc | 0.74 (0.03) bcdef |
| J | 1.21 (0.03) bcdefghi | 1.11 (0.02) abcde | 0.60 (0.01) ab | 3.84 (0.15) ab | 0.0150 (0.001) abcde | 0.64 (0.03) bcdefg | 0.58 (0.03) c | 0.79 (0.03) abc |
| K | 1.31 (0.03) abcde | 1.15 (0.02) ab | 0.59 (0.01) abcde | 3.99 (0.15) a | 0.0173 (0.0009) ab | 0.66 (0.03) bcdefg | 0.65 (0.03) bc | 0.78 (0.02) abcd |
| L | 1.15 (0.04) fghij | 1.07 (0.03) cdef | 0.57 (0.01) bcdefgh | 3.78 (0.15) ab | 0.0141 (0.0012) abcde | 0.75 (0.02) ab | 0.62 (0.03) bc | 0.79 (0.03) abc |
| M | 1.17 (0.04) efghi | 1.08 (0.03) bcdef | 0.60 (0.01) abc | 3.35 (0.18) abc | 0.0137 (0.0012) bcdef | 0.69 (0.03) bcde | 0.59 (0.04) bc | 0.78 (0.03) abcde |
| N | 1.12 (0.04) hij | 1.03 (0.03) ef | 0.55 (0.01) cdefgh | 3.72 (0.15) ab | 0.0127 (0.0013) cdef | 0.61 (0.03) defg | 0.62 (0.03) bc | 0.71 (0.03) bcdef |
| O | 1.18 (0.03) defghi | 1.06 (0.03) def | 0.57 (0.01) bcdefgh | 3.61 (0.14) ab | 0.0128 (0.0008) cdef | 0.60 (0.030) defgh | 0.61 (0.030) bc | 0.67 (0.03) cdef |
| P | 1.33 (0.04) abc | 1.16 (0.02) a | 0.53 (0.01) h | 3.91 (0.14) a | 0.0186 (0.0013) a | 0.66 (0.026) bcdefg | 0.71 (0.03) b | 0.69 (0.03) cdef |
| Q | 1.25 (0.05) abcdefgh | 1.07 (0.03) bcdef | 0.53 (0.02) h | 3.90 (0.20) ab | 0.0140 (0.0013) bcdef | 0.59 (0.04) efgh | 0.86 (0.03) a | 0.66 (0.05) ef |
| R | 1.33 (0.03) ab | 1.11 (0.02) abcde | 0.53 (0.01) gh | 3.85 (0.12) ab | 0.0175 (0.0009) ab | 0.58 (0.02) efgh | 0.67 (0.02) bc | 0.66 (0.02) f |
| S | 1.15 (0.04) ghij | 1.01 (0.04) f | 0.57 (0.02) bcdefg | 3.21 (0.21) bc | 0.0116 (0.0011) ef | 0.49 (0.05) h | 0.64 (0.04) bc | 0.70 (0.05) bcdef |
| T | 1.26 (0.03) abcdefg | 1.08 (0.02) bcdef | 0.55 (0.01) efgh | 3.61 (0.14) abc | 0.0145 (0.0009) abcde | 0.55 (0.03) fgh | 0.64 (0.03) bc | 0.67 (0.03) cdef |
| U | 1.23 (0.03) bcdefgh | 1.07 (0.02) bcdef | 0.55 (0.01) efgh | 3.76 (0.11) ab | 0.0150 (0.0008) abcde | 0.59 (0.02) defgh | 0.65 (0.02) bc | 0.66 (0.02) ef |
| V | 1.28 (0.04) abcdef | 1.07 (0.03) bcdef | 0.54 (0.01) fgh | 3.74 (0.18) ab | 0.0149 (0.0011) abcde | 0.63 (0.03) bcdefg | 0.71 (0.03) bc | 0.73 (0.03) bcdef |
| W | 1.38 (0.02) a | 1.12 (0.01) abcde | 0.56 (0.01) cdefgh | 3.92 (0.09) a | 0.0180 (0.0007) ab | 0.54 (0.02) gh | 0.66 (0.02) bc | 0.66 (0.02) ef |
| X | 1.20 (0.03) bcdefghi | 1.04 (0.02) def | 0.54 (0.01) gh | 3.72 (0.12) ab | 0.0140 (0.0008) bcdef | 0.62 (0.02) cdefg | 0.62 (0.02) bc | 0.67 (0.02) ef |
| Y | 1.31 (0.02) abcd | 1.13 (0.02) abcd | 0.56 (0.01) bcdefgh | 3.99 (0.10) a | 0.0166 (0.0007) abc | 0.60 (0.02) defg | 0.71 (0.02) b | 0.74 (0.02) bcdef |
| Means | 1.25 (0.01) | 1.09 (0.01) | 0.56 (0.00) | 3.78 (0.03) | 0.0154 (0.0002) | 0.62 (0.01) | 0.66 (0.01) | 0.72 (0.01) |
Table 4.
Estimates of variances (, , ,,, ) for provenance, provenance-block within site, family, family-block within site, residual error and phenotypic variance, provenance repeatability ( ), family heritability ( ), co-efficient of variation at genetic and phenotypic level (genetic coefficient of variation (GCV), phenotypic coefficient of variation (PCV)) for tested traits at each site.
| Sites | Traits | F Value of | F Value of | | | | | | | | | | GCV% | PCV% |
|---|
| Mengla | DBH | 2.50 *** | 1.30 * | 0.647 | 0.287 | 23.530 | 0.230 (0.096) | 1.297 | NE | 22.250 | 0.226 (0.079) | 24.464 | 4.00 | 24.58 |
| | Height | 2.74 *** | 1.34 ** | 0.392 | 0.283 | 12.560 | 0.252 (0.100) | 0.592 | NE | 11.960 | 0.198 (0.084) | 13.236 | 3.40 | 19.75 |
| | HCB | 4.03 *** | 1.22 * | 0.336 | 0.893 | 6.955 | 0.320 (0.114) | 0.355 | 4.165 | 2.475 | 0.211 (0.084) | 8.184 | 5.54 | 27.37 |
| | CW | 2.27 *** | 1.29 * | 0.042 | 0.102 | 2.191 | 0.169 (0.098) | 0.127 | 0.833 | 1.232 | 0.235 0.079) | 2.335 | 4.35 | 32.29 |
| | Volume | 2.60 *** | 1.36 ** | 0.001 | 0.001 | 0.030 | 0.236 (0.098) | 0.002 | NE | 0.028 | 0.246 (0.079) | 0.031 | 9.83 | 59.43 |
| | SF | 2.54 *** | 1.20 ns | 0.002 | 0.006 | 0.089 | 0.199 (0.108) | 0.003 | NE | 0.086 | 0.160 (0.085) | 0.097 | 7.32 | 49.34 |
| | CS | 2.62 *** | 1.10 ns | 0.003 | 0.008 | 0.095 | 0.211 (0.109) | 0.001 | 0.004 | 0.091 | 0.029 (0.095) | 0.105 | 7.62 | 49.48 |
| | BRA | 2.18 *** | 0.86 ns | 0.002 | 0.005 | 0.091 | 0.184 (0.105) | 0.000 | NE | 0.091 | 0.006 (0.064) | 0.098 | 5.73 | 40.42 |
| Pingxiang | DBH | 8.69 *** | 1.33 * | 3.084 | 2.773 | 13.080 | 0.609 (0.094) | 0.435 | 13.000 | 0.285 | 0.090 (0.109) | 18.937 | 11.17 | 27.67 |
| | Height | 5.50 *** | 1.25 ns | 0.620 | 3.018 | 7.069 | 0.330 (0.147) | 0.124 | 7.318 | 0.045 | 0.048 (0.121) | 10.707 | 5.59 | 23.23 |
| | HCB | 3.11 *** | 1.50 *** | 0.044 | 0.997 | 2.531 | 0.091 (0.154) | 0.012 | 2.489 | 0.095 | 0.014 (0.121) | 3.572 | 2.52 | 22.62 |
| | CW | 4.46 *** | 1.60 *** | 0.230 | 0.479 | 2.616 | 0.373 (0.128) | 0.093 | 2.409 | 0.183 | 0.098 (0.116) | 3.325 | 10.66 | 40.52 |
| | Volume | 5.45 *** | 1.12 ns | 0.001 | 0.002 | 0.009 | 0.480 (0.117) | 0.000 | 0.009 | 0.000 | 0.093 (0.109) | 0.012 | 23.39 | 72.69 |
| | SF | 0.78 ns | 0.98 ns | 0.000 | 0.007 | 0.082 | 0.001 (0.092) | 0.002 | 0.080 | 0.006 | 0.055 (0.101) | 0.088 | 0.46 | 42.92 |
| | CS | 4.67 *** | 1.59 *** | 0.008 | 0.013 | 0.084 | 0.384 (0.127) | 0.002 | 0.081 | 0.005 | 0.072 (0.112) | 0.104 | 13.46 | 50.12 |
| | BRA | 1.44 ns | 1.11 ns | 0.001 | 0.009 | 0.079 | 0.057 (0.114) | 0.000 | 0.080 | 0.004 | 0.003 (0.106) | 0.089 | 3.45 | 39.82 |
| Hua’an | DBH | 3.60 *** | 0.94 ns | 1.120 | 1.080 | 21.080 | 0.336 (0.107) | 0.020 | 2.239 | 18.950 | 0.004 (0.071) | 23.280 | 5.01 | 22.85 |
| | Height | 2.50 *** | 1.14 ns | 0.270 | 0.815 | 10.140 | 0.197 (0.112) | 0.274 | 0.475 | 9.445 | 0.099 (0.075) | 11.224 | 3.15 | 20.30 |
| | HCB | 3.19 *** | 1.18 ns | 0.296 | 0.326 | 5.581 | 0.334 (0.112) | 0.005 | 0.643 | 4.959 | 0.003 (0.078) | 6.203 | 6.07 | 27.79 |
| | CW | 3.52 *** | 0.94 ns | 0.106 | 0.081 | 1.943 | 0.343 (0.107) | 0.002 | 0.187 | 1.768 | 0.003 (0.076) | 2.129 | 10.28 | 46.16 |
| | Volume | 4.01 *** | 1.10 ns | 0.002 | 0.001 | 0.026 | 0.363 (0.105) | 0.000 | 0.002 | 0.024 | 0.028 (0.076) | 0.029 | 13.76 | 59.23 |
| | SF | 2.54 *** | 0.97 ns | 0.005 | 0.000 | 0.121 | 0.275 (0.104) | 0.000 | 0.011 | 0.111 | 0.001 ( 0.070) | 0.126 | 13.48 | 70.44 |
| | CS | 4.83 *** | 1.41 *** | 0.011 | NE | 0.109 | 0.509 (0.097) | 0.004 | 0.025 | 0.082 | 0.119 (0.078) | 0.121 | 15.93 | 51.96 |
| | BRA | 3.25 *** | 1.00 ns | 0.005 | 0.008 | 0.108 | 0.294 (0.109) | 0.000 | 0.015 | 0.094 | 0.014 (0.069) | 0.121 | 10.97 | 54.90 |
| Changning | DBH | 2.86 *** | 1.02 ns | 0.215 | 0.130 | 2.835 | 0.567 (0.126) | 0.042 | 0.710 | 2.097 | 0.057 (0.143) | 3.180 | 6.01 | 23.08 |
| | Height | 1.83 * | 0.97 ns | 0.096 | 0.064 | 2.695 | 0.386 (0.168) | 0.132 | NE | 2.577 | 0.170 (0.123) | 2.855 | 3.74 | 20.36 |
| | HCB | 1.58 * | 1.09 ns | 0.010 | 0.137 | 1.270 | 0.108 (0.256) | 0.065 | 0.201 | 1.003 | 0.178 (0.125) | 1.416 | 2.31 | 28.18 |
| | CW | 1.99 ** | 1.38 * | 0.027 | NE | 0.653 | 0.425 (0.153) | 0.059 | NE | 0.601 | 0.282 (0.104) | 0.680 | 6.94 | 34.98 |
| | Volume | 2.21 * | 0.97 ns | 0.000 | 0.000 | 0.000 | 0.460 (0.154) | 0.000 | 0.000 | 0.000 | 0.081 (0.139) | 0.000 | 13.16 | 61.93 |
| | SF | 2.21 *** | 0.97 ns | 0.000 | 0.003 | 0.068 | 0.060 (0.122) | 0.000 | 0.001 | 0.065 | 0.002 (0.112) | 0.071 | 2.06 | 34.87 |
| | CS | 0.93 ns | 0.85 ns | 0.000 | 0.002 | 0.116 | 0.027 (0.229) | 0.000 | 0.022 | 0.094 | 0.001 (0.105) | 0.118 | 2.09 | 52.92 |
| | BRA | 0.69 ns | 1.15 ns | 0.000 | NE | 0.090 | 0.019 (0.151) | 0.003 | NE | 0.087 | 0.116 (0.121) | 0.090 | 0.43 | 41.11 |
Table 5.
F values and significance levels for variance from different sources of all traits in combined variance analysis of four sites.
Table 5.
F values and significance levels for variance from different sources of all traits in combined variance analysis of four sites.
| Traits | Site (3) | Block within Site (48) | Provenance (24) | Provenance-Site (72) | Provenance-Block within Site (801) | Family (199) | Family-Site (388) |
|---|
| DBH | 1517.82 *** | 6.25 *** | 3.71 *** | 3.27 *** | 1.10 * | 1.35 ** | 0.93 ns |
| Height | 1560.85 *** | 6.98 *** | 2.73 *** | 2.66 *** | 1.30 *** | 1.46 *** | 1.01 ns |
| HCB | 1073.10 *** | 13.06 *** | 5.16 *** | 1.90 *** | 1.40 *** | 1.39 *** | 0.96 ns |
| CW | 549.52 *** | 5.72 *** | 3.01 *** | 3.03 *** | 1.30 *** | 1.41 *** | 1.24 ** |
| Volume | 625.06 *** | 4.93 *** | 3.17 *** | 2.60 *** | 1.02 ns | 1.39 *** | 0.88 ns |
| SF | 111.01 *** | 6.12 *** | 3.23 *** | 1.20 ns | 1.10 ns | 1.16 ns | 0.92 ns |
| CS | 1.01 ns | 6.22 *** | 2.88 *** | 3.06 *** | 1.23 *** | 1.34 ** | 1.24 ** |
| BRA | 45.03 *** | 4.15 *** | 3.45 *** | 1.37 * | 1.20 *** | 1.05 ns | 0.89 ns |
Table 6.
Estimates of variances (, ,,,, ,, , ,, ) for provenance, provenance-site, provenance-block within site, provenance-year-site, provenance-year-block within site, family, family-year, family-year-site, family-year-block within site, residual error and phenotypic variance, provenance repeatability ( ), family heritability ( ), coefficient of variation at genetic and phenotypic level (GCV, PCV) for various traits in combined analysis of four sites.
| Random Effect | DBH | Height | HCB | CW | Volume | SF | CS | BRA |
|---|
| 0.080 | 0.008 | 0.091 | 0.007 | 0.000 | 0.001 | 0.000 | 0.001 |
| NE | NE | 0.099 | NE | 0.001 | 0.001 | 0.005 | NE |
| NE | 0.885 | NE | 0.136 | 0.001 | NE | 0.005 | NE |
| 1.060 | 0.349 | NE | 0.085 | NE | NE | NE | 0.001 |
| 0.900 | NE | 0.574 | NE | NE | 0.004 | NE | 0.006 |
| 17.590 | 9.225 | 4.816 | 1.948 | 0.020 | 0.095 | 0.102 | 0.094 |
| 0.276 (0.581) | 0.066 (0.043) | 0.602 (0.160) | 0.230 (0.396) | 0.026 (0.037) | 0.636 (0.147) | 0.123 (0.114) | 0.634 (0.115) |
| 0.193 | 0.147 | 0.112 | 0.029 | 0.001 | 0.001 | 0.000 | 0.000 |
| 0.146 | 0.090 | NE | NE | NE | NE | NE | NE |
| 0.005 | NE | 0.041 | 0.037 | NE | NE | 0.002 | NE |
| 1.393 | 4.730 | 1.133 | 0.558 | 0.002 | 0.018 | 0.035 | 0.022 |
| 8.015 | 4.730 | 3.849 | 1.439 | 0.019 | 0.080 | 0.065 | 0.074 |
| 0.428 (0.099) | 0.276 (0.152) | 0.495 (0.124) | 0.379 (0.151) | 0.578 (0.083) | 0.173 (0.153) | 0.149 (0.136) | 0.148 (0.161) |
| 19.630 | 10.467 | 5.580 | 2.176 | 0.022 | 0.100 | 0.112 | 0.102 |
| GCV% | 1.61 | 0.58 | 3.52 | 2.21 | 1.43 | 5.99 | 2.62 | 4.95 |
| PCV% | 25.19 | 21.09 | 27.60 | 39.02 | 66.78 | 51.06 | 50.75 | 44.39 |
Table 7.
Genotypic correlation coefficients among tested traits.
Table 7.
Genotypic correlation coefficients among tested traits.
| Traits | Height | HCB | CW | Volume | SF | CS | BRA |
|---|
| DBH | 0.440 * | −0.386 | 0.765 ** | 0.732 ** | −0.493 * | 0.657 * | −0.520 * |
| Height | | 0.580 * | −0.117 | 0.521 * | 0.386 | 0.028 | 0.430 * |
| HCB | | | −0.795 ** | −0.088 | 0.705 ** | −0.595 * | 0.922 ** |
| CW | | | | 0.482 * | −0.701 ** | 0.807 * | −0.776 ** |
| Volume | | | | | 0.006 | 0.547 * | −0.041 |
| SF | | | | | | −0.476 * | 0.855 ** |
| CS | | | | | | | −0.531 * |
Table 8.
Growth, quality traits and realized gains of the excellent provenances and families.
Table 8.
Growth, quality traits and realized gains of the excellent provenances and families.
| Provenances | DBH (cm) | Height (m) | HCB (m) | CW (m) | Volume (m3) | SF | CS | BRA | MADBH (cm·Year−1) | MAH (m·Year−1) | HCB·Height−1 | MAVOL (m3·Year−1) | Superiority Coefficient | Rank |
| P | 18.58 | 16.12 | 8.42 | 3.91 | 0.27 | 0.66 | 0.71 | 0.69 | 1.33 | 1.16 | 0.53 | 0.02 | 0.0148 | 1 |
| Y | 18.60 | 16.00 | 8.86 | 3.99 | 0.24 | 0.60 | 0.71 | 0.74 | 1.31 | 1.13 | 0.56 | 0.02 | 0.0269 | 2 |
| W | 19.64 | 15.89 | 8.81 | 3.92 | 0.26 | 0.54 | 0.66 | 0.66 | 1.38 | 1.12 | 0.56 | 0.02 | 0.0378 | 3 |
| K | 18.97 | 16.72 | 9.65 | 3.99 | 0.26 | 0.66 | 0.65 | 0.78 | 1.31 | 1.15 | 0.59 | 0.02 | 0.0457 | 4 |
| R | 18.59 | 15.47 | 8.15 | 3.85 | 0.25 | 0.58 | 0.67 | 0.66 | 1.33 | 1.11 | 0.53 | 0.02 | 0.0578 | 5 |
| Selected mean | 18.88 | 16.04 | 8.78 | 3.93 | 0.25 | 0.61 | 0.68 | 0.71 | 1.33 | 1.14 | 0.55 | 0.02 | | |
| Total means | 17.59 | 15.34 | 8.56 | 3.78 | 0.22 | 0.62 | 0.66 | 0.72 | 1.25 | 1.09 | 0.56 | 0.02 | | |
| Genetic gains (%) | 2.01 | 0.30 | 1.55 | 0.90 | 0.39 | 1.59 | 0.42 | 0.80 | 1.88 | 0.25 | -1.01 | 0.38 | | |
| Realized gains (%) | 7.31 | 4.57 | 2.57 | 3.91 | 14.84 | 2.43 | 3.56 | 1.37 | 6.81 | 3.78 | -1.68 | 14.55 | | |
| Families | DBH (cm) | Height (m) | HCB (m) | CW (m) | Volume (m3) | SF | CS | BRA | MADBH (cm·Year−1) | MAH (m·Year−1) | HCB·Height−1 | MAVOL (m3·Year−1) | Superiority Coefficient | Rank |
| P12 | 23.29 | 19.49 | 10.45 | 4.82 | 0.43 | 0.63 | 0.81 | 0.75 | 1.60 | 1.34 | 0.55 | 0.03 | 0.0092 | 1 |
| Y09 | 19.49 | 17.33 | 9.72 | 4.63 | 0.31 | 0.64 | 0.84 | 0.85 | 1.39 | 1.24 | 0.57 | 0.02 | 0.0123 | 2 |
| W03 | 21.88 | 18.37 | 9.88 | 4.90 | 0.35 | 0.67 | 0.82 | 0.81 | 1.50 | 1.25 | 0.55 | 0.02 | 0.0205 | 3 |
| D01 | 18.48 | 15.48 | 9.68 | 4.20 | 0.22 | 0.77 | 0.80 | 0.92 | 1.32 | 1.13 | 0.58 | 0.01 | 0.0210 | 4 |
| U06 | 20.46 | 18.89 | 10.86 | 5.00 | 0.33 | 0.66 | 0.76 | 0.72 | 1.39 | 1.28 | 0.58 | 0.02 | 0.0217 | 5 |
| W06 | 19.33 | 16.59 | 9.74 | 3.85 | 0.29 | 0.56 | 0.59 | 0.70 | 1.37 | 1.19 | 0.58 | 0.02 | 0.0271 | 6 |
| C21 | 22.69 | 19.37 | 11.69 | 4.78 | 0.41 | 0.84 | 0.86 | 0.89 | 1.53 | 1.31 | 0.61 | 0.03 | 0.0313 | 7 |
| U16 | 19.11 | 16.14 | 8.87 | 4.33 | 0.26 | 0.60 | 0.74 | 0.73 | 1.36 | 1.16 | 0.55 | 0.02 | 0.0320 | 8 |
| I11 | 22.24 | 19.78 | 10.06 | 5.00 | 0.37 | 0.88 | 0.82 | 0.82 | 1.50 | 1.34 | 0.51 | 0.03 | 0.0383 | 9 |
| K08 | 20.68 | 18.81 | 10.53 | 4.78 | 0.32 | 0.80 | 0.75 | 0.68 | 1.41 | 1.28 | 0.57 | 0.02 | 0.0405 | 10 |
| K15 | 21.81 | 18.00 | 11.54 | 4.09 | 0.33 | 0.49 | 0.70 | 0.77 | 1.48 | 1.22 | 0.64 | 0.02 | 0.0409 | 11 |
| G11 | 20.22 | 19.08 | 11.49 | 4.33 | 0.31 | 0.68 | 0.79 | 0.84 | 1.39 | 1.32 | 0.61 | 0.02 | 0.0413 | 12 |
| R14 | 19.28 | 16.52 | 9.02 | 4.00 | 0.26 | 0.49 | 0.65 | 0.76 | 1.37 | 1.18 | 0.56 | 0.02 | 0.0441 | 13 |
| P04 | 22.03 | 18.95 | 8.92 | 4.59 | 0.41 | 0.77 | 0.75 | 0.65 | 1.52 | 1.31 | 0.50 | 0.03 | 0.0476 | 14 |
| E08 | 20.81 | 17.56 | 9.20 | 4.22 | 0.29 | 0.63 | 0.78 | 0.66 | 1.44 | 1.21 | 0.55 | 0.02 | 0.0488 | 15 |
| R10 | 22.37 | 17.72 | 8.85 | 4.63 | 0.35 | 0.72 | 0.69 | 0.69 | 1.55 | 1.22 | 0.50 | 0.02 | 0.0498 | 16 |
| W04 | 23.50 | 18.21 | 8.82 | 4.69 | 0.38 | 0.57 | 0.72 | 0.65 | 1.64 | 1.27 | 0.48 | 0.03 | 0.0511 | 17 |
| Y15 | 19.46 | 15.84 | 8.73 | 4.09 | 0.27 | 0.67 | 0.79 | 0.67 | 1.37 | 1.13 | 0.57 | 0.02 | 0.0516 | 18 |
| V05 | 19.08 | 15.38 | 8.84 | 4.12 | 0.25 | 0.62 | 0.65 | 0.75 | 1.34 | 1.09 | 0.55 | 0.02 | 0.0527 | 19 |
| I18 | 20.96 | 18.46 | 11.50 | 3.53 | 0.34 | 0.64 | 0.52 | 0.79 | 1.45 | 1.27 | 0.64 | 0.02 | 0.0533 | 20 |
| Selected mean | 20.86 | 17.80 | 9.92 | 4.43 | 0.32 | 0.66 | 0.74 | 0.75 | 1.45 | 1.24 | 0.56 | 0.02 | | |
| Total means | 18.34 | 15.88 | 8.89 | 3.89 | 0.24 | 0.61 | 0.66 | 0.71 | 1.28 | 1.11 | 0.57 | 0.02 | | |
| Genetic gains (%) | 5.87 | 5.17 | 5.73 | 5.21 | 21.22 | 1.46 | 1.92 | 0.85 | 5.43 | 4.67 | -0.37 | 20.92 | | |
| Realized gains (%) | 13.72 | 12.09 | 11.57 | 13.73 | 36.71 | 8.47 | 12.86 | 5.76 | 12.69 | 10.92 | -0.76 | 36.20 | | |


