Research on Geospatial Association of the Urban Agglomeration around the South China Sea Based on Marine Traffic Flow


Abstract
:1. Introduction
2. Literature Review
3. Study Area and Data Source
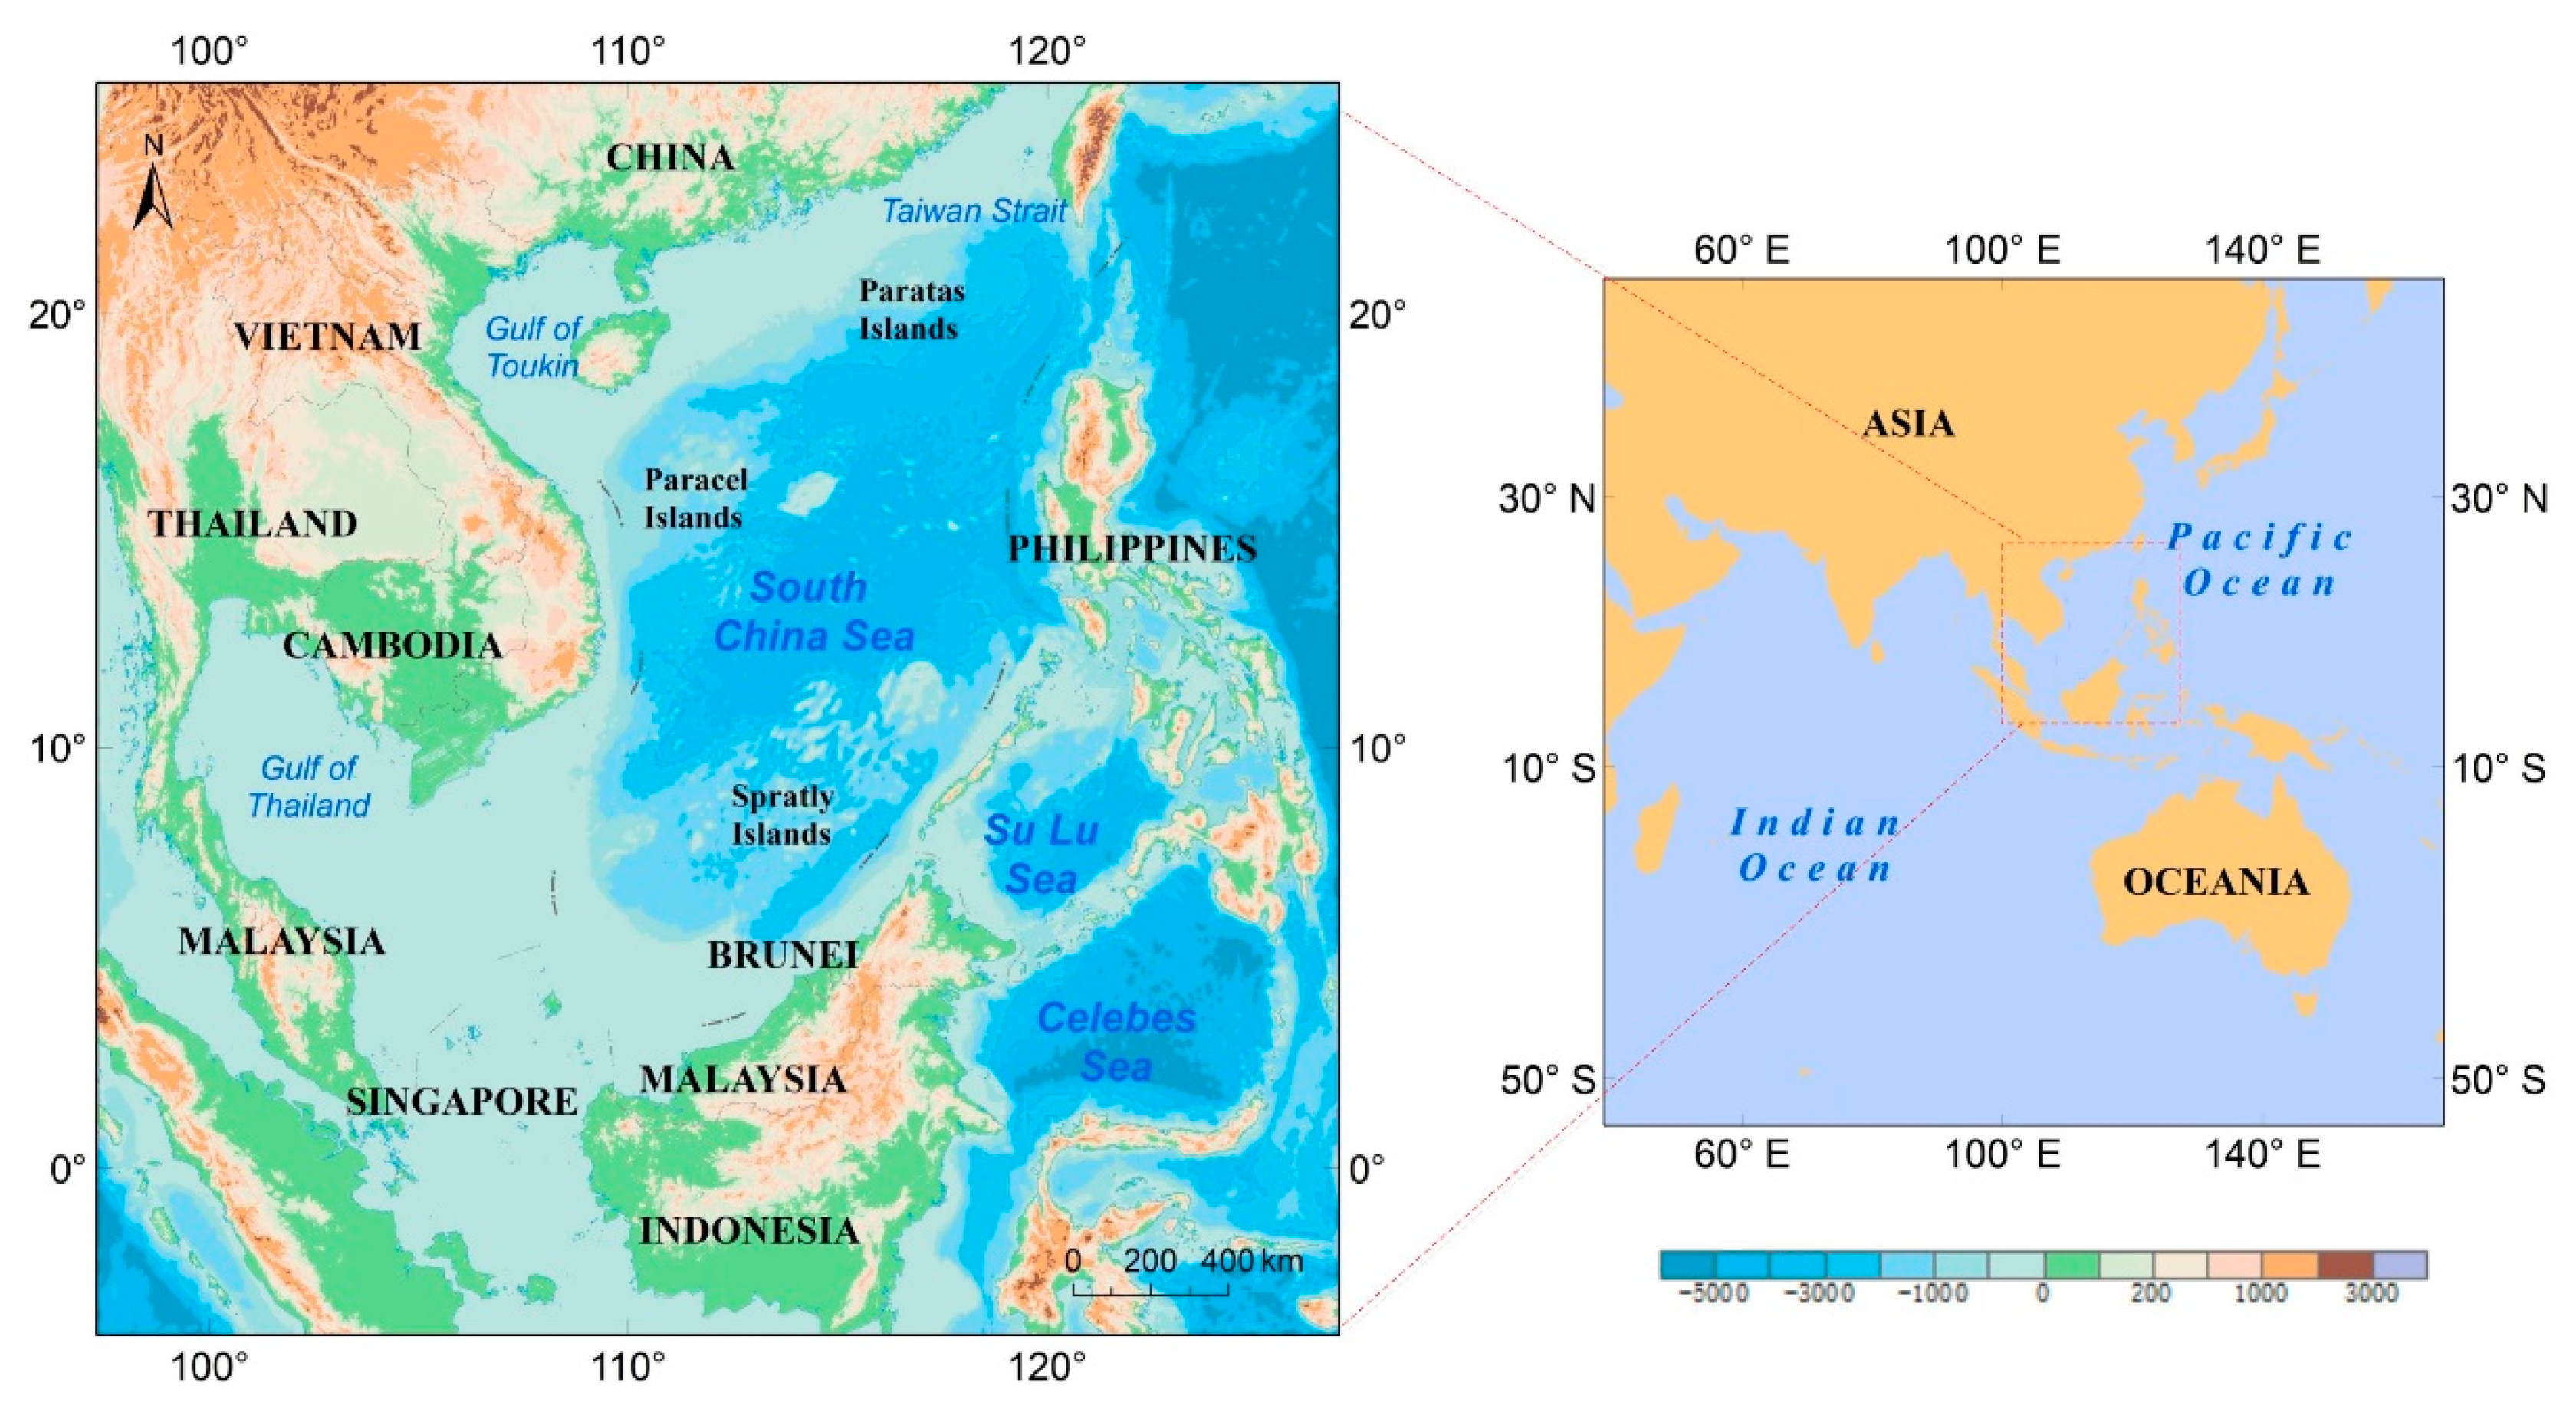
3.1. Study Area
3.2. Data and Data Processing
- By extracting the static, dynamic and voyage information of each cargo ship, the corresponding geographic object was constructed and stored in the spatial database.
- Absolute data and outlier data in data noise were eliminated using a density-based outlier detection method.
- The stay point was extracted for each ship and the stay time and distance of the stay point must satisfy the given time threshold, , and the distance threshold, .
4. Method
4.1. Construction of Urban Agglomeration Association Network
4.2. Analysis of Urban Agglomeration Association Network
4.2.1. Centrality
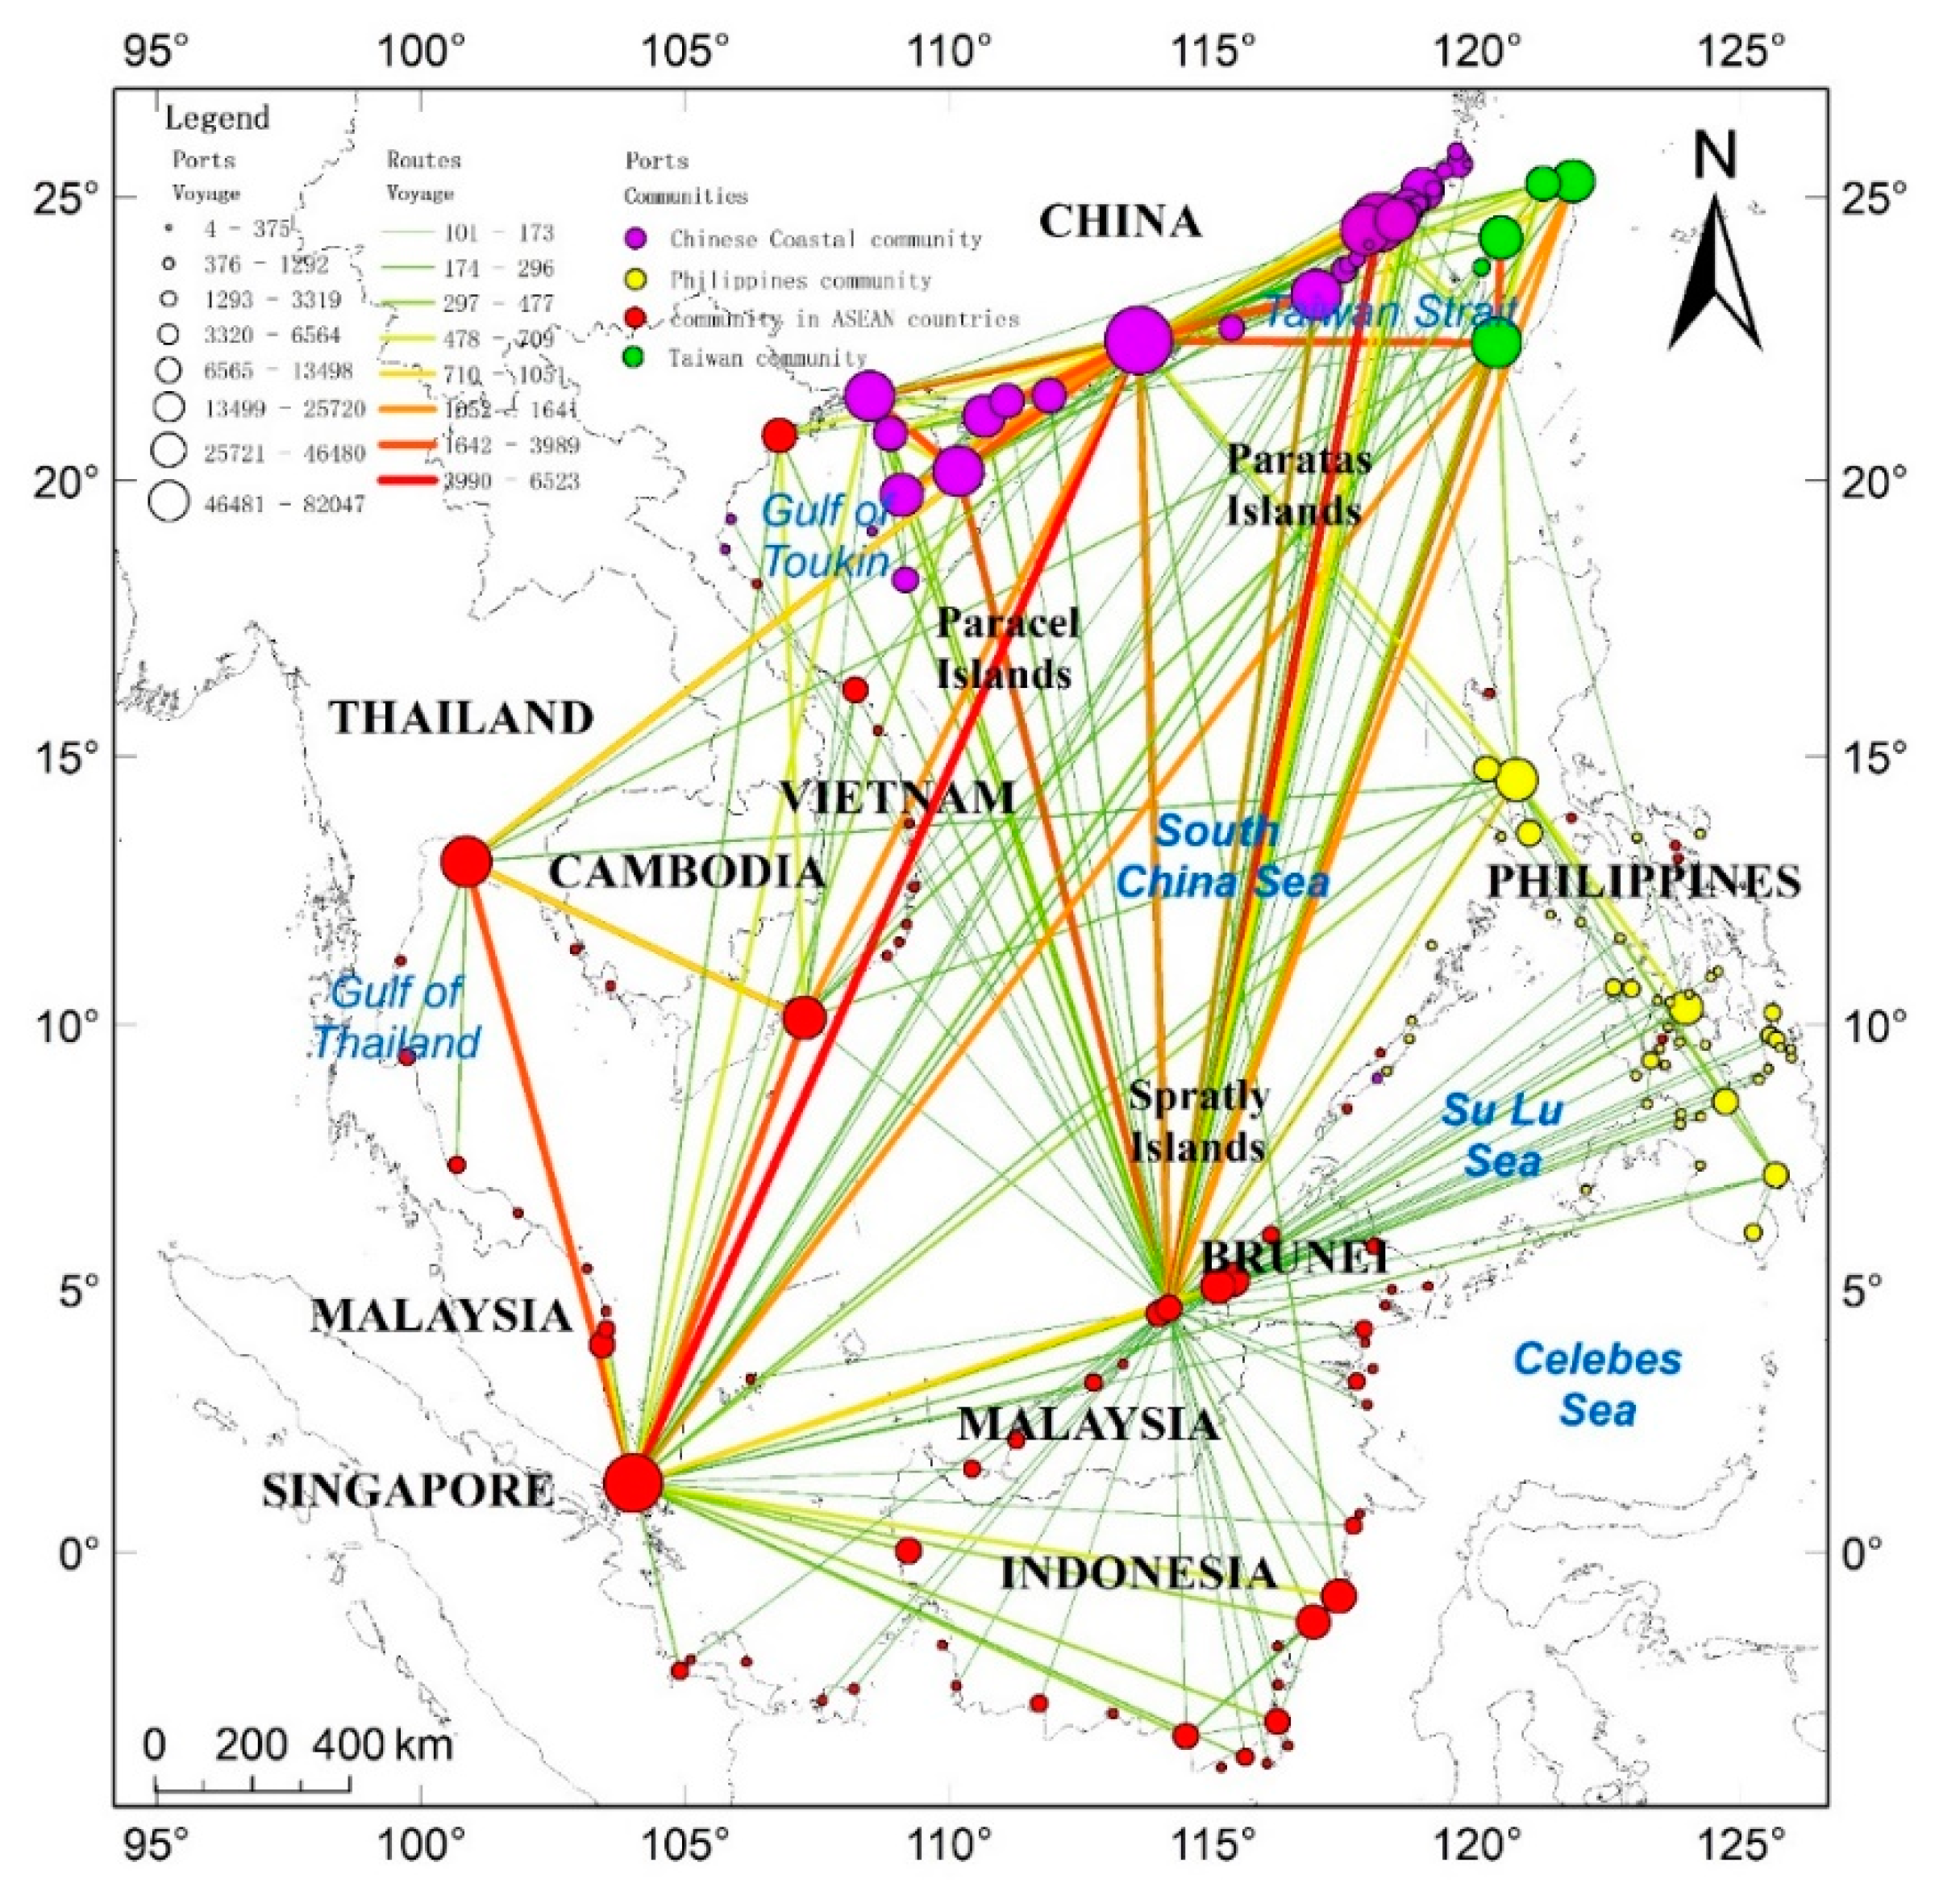
4.2.2. Community Detection
5. Results
5.1. Construction of Urban Agglomeration Spatial Association Network around the South China Sea
5.2. Spatial Association Analysis of Urban Agglomeration around the South China Sea
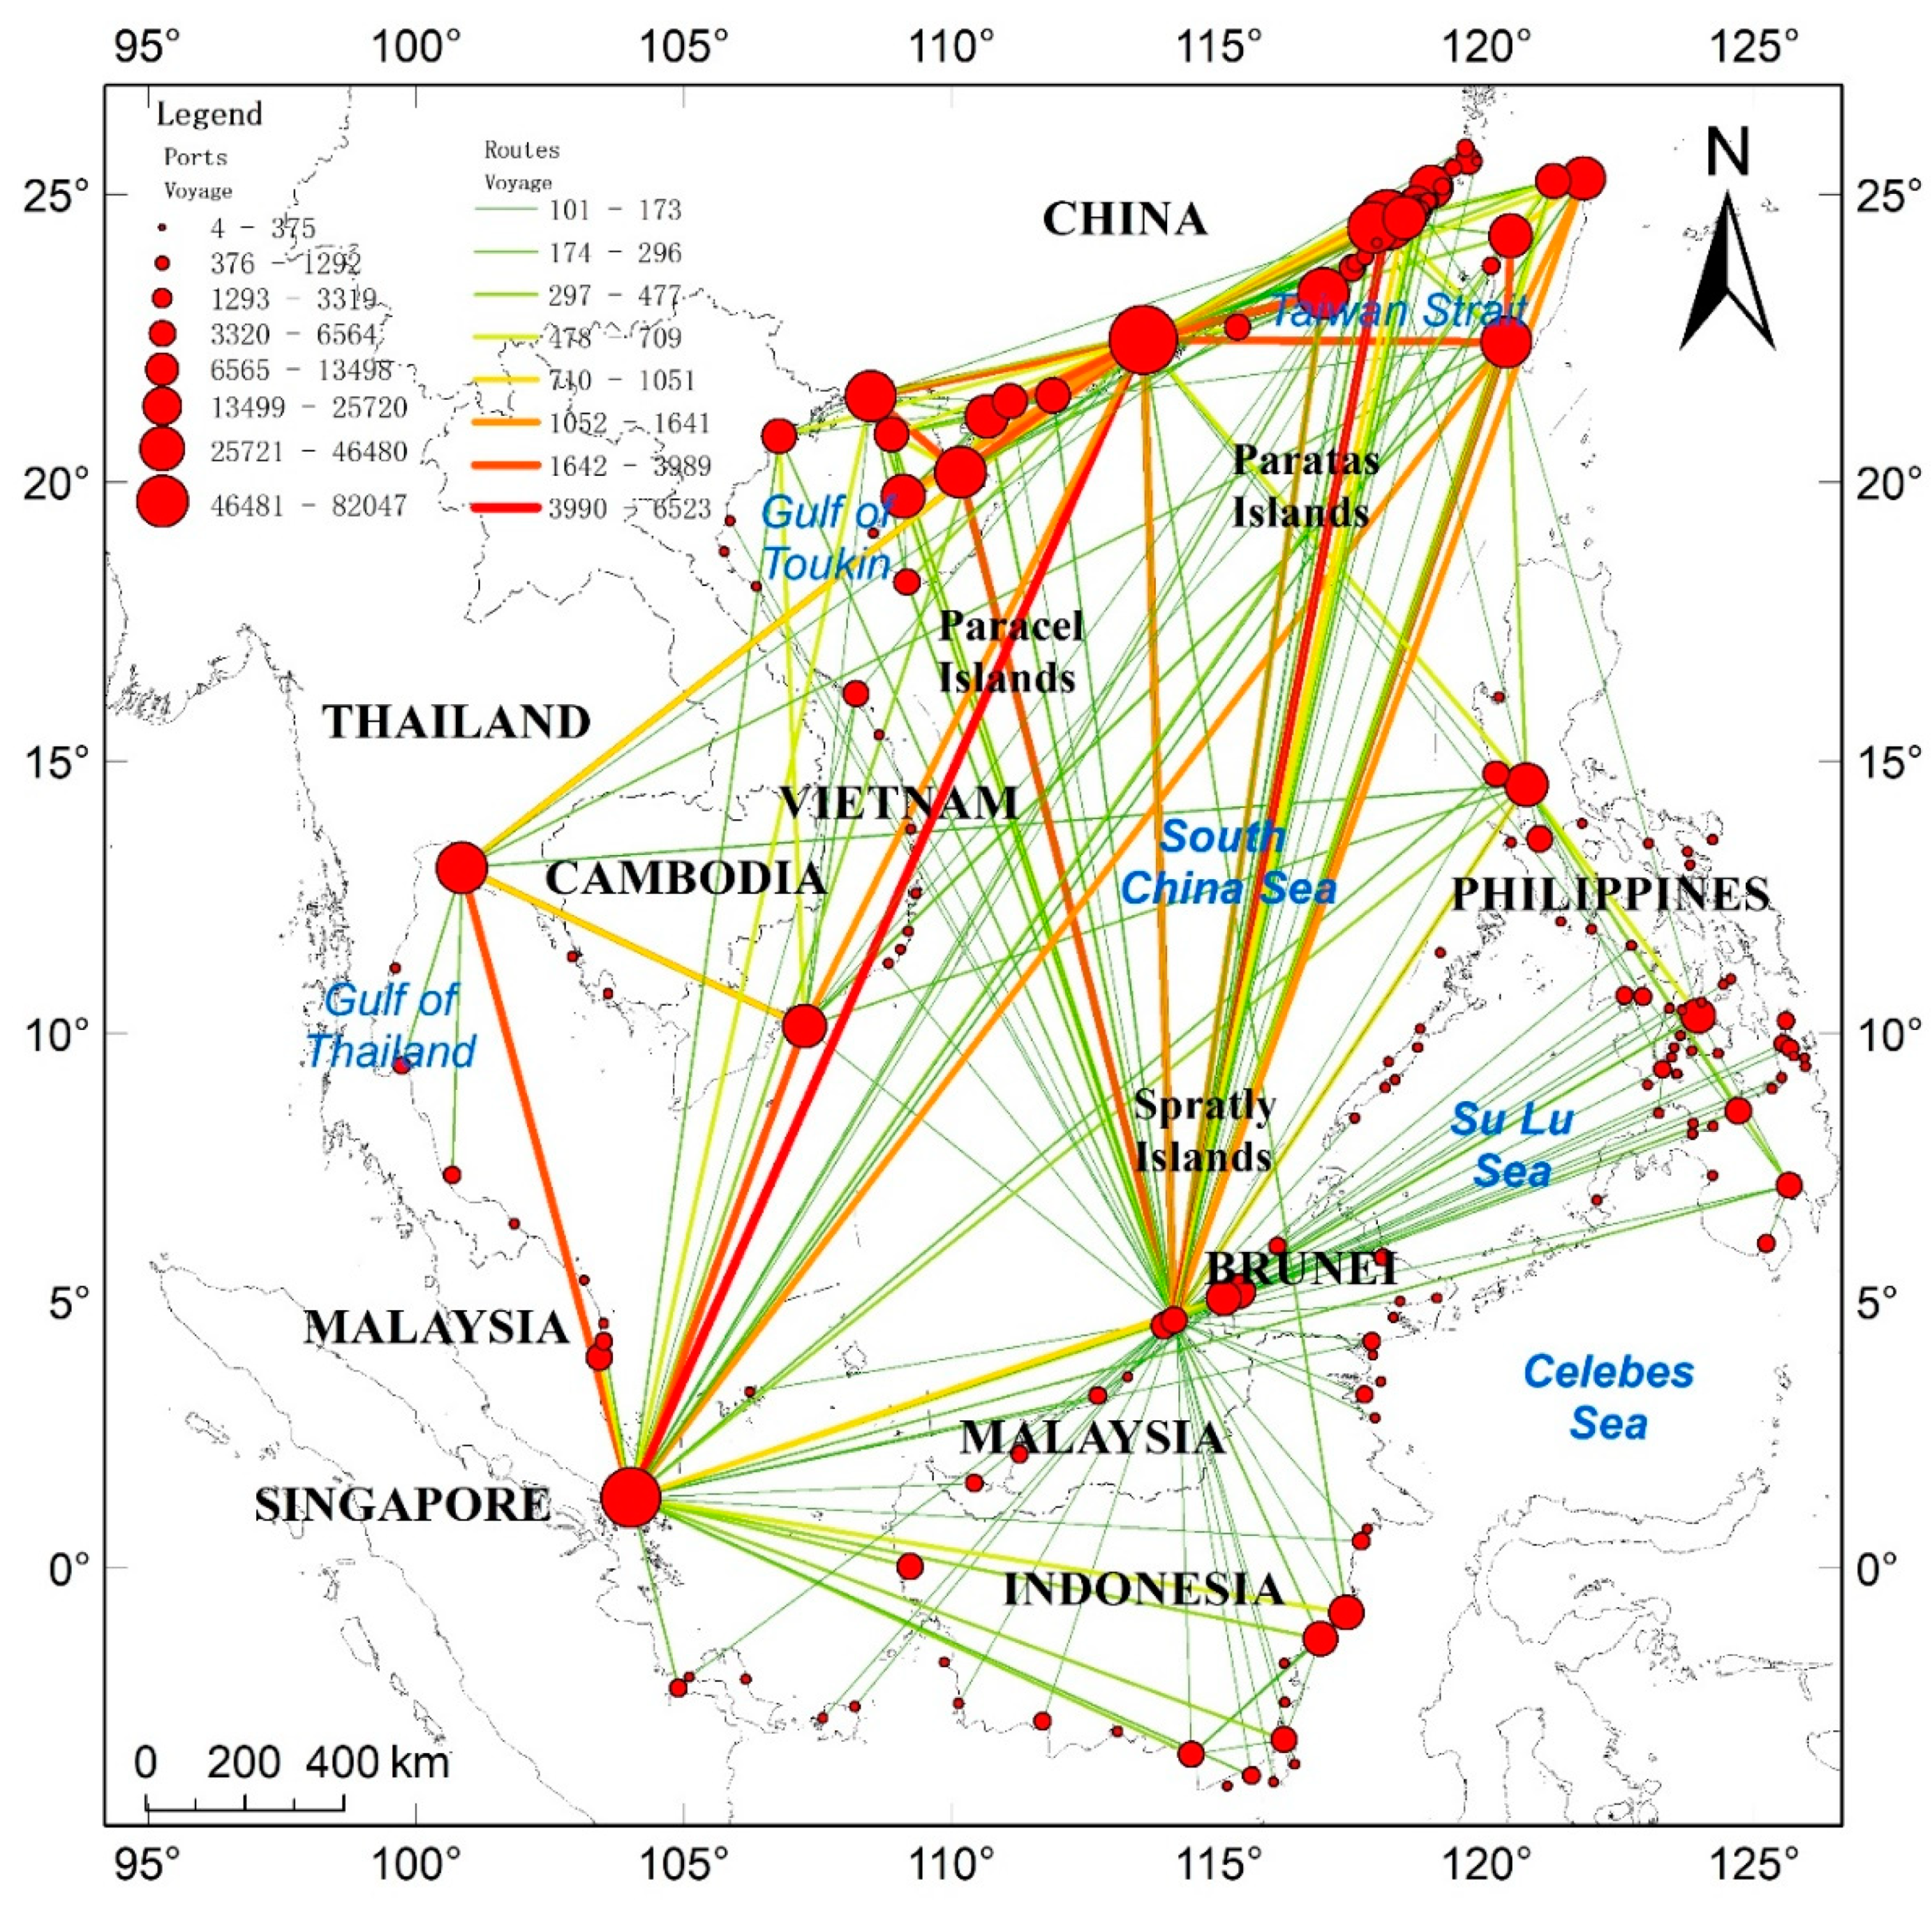
5.2.1. Spatial Distribution Characteristics of Marine Traffic Flow
- The distribution of marine traffic flow in the urban agglomeration around the South China Sea is significantly different in different regions. The OD peak of traffic between port cities within the network appears among a limited number of ports, such as Hong Kong-Singapore (9427), Zhangzhou-Xiamen (6296), and Singapore-Bangkok (5612). The traffic flow of the entire association network was characterized by long-tailed distributions: The traffic volume of most cities was lower than the mean and in these cities was concentrated in a small low-value interval; the number of cities with high traffic volume was small and the proportion of the traffic volume in high–traffic cities was much higher than other intervals, reaching more than half of the total network traffic.
- The overall layout of the urban agglomeration was distributed along the southwest-northeast axis with excellent traffic conditions. The distribution of urban agglomeration around the South China Sea was relatively wide and the infrastructure levels of different cities in the region were quite different. As the two core cities in the region, Hong Kong and Singapore had close cooperative links with Ho Chi Minh, Manila, and other cities. It can be seen that Hong Kong and Singapore have always played a dual-core role within the urban agglomeration, in terms of economic power, geographic location, city size, and attractiveness, and the roles of cities in the region.
- The OD distribution within the urban agglomeration shows significant geographic proximity in geospatial. The OD concentration of traffic between ports adjacent to or belonging to the same area was relatively high. For example, the traffic volume of China’s coastal port cities such as Xiamen, Zhangzhou, and Haikou and the same regional port cities accounted for 72.35% of their total traffic volume. On the contrary, the traffic volume between ports that were not spatially adjacent and belong to different regions was relatively small.
5.2.2. Analysis of Urban Agglomeration Association Network
5.2.2.1 Analysis of Association Network Structure
5.2.2.2 Analysis of Association Network Hierarchy
5.2.3. Analysis of Internal Differences within the Urban Agglomeration
6. Conclusions
Author Contributions
Funding
Conflicts of Interest
References
- Molle, W. The Regional Economic Structure of the European Union: An Analysis of Long-Term Developments; Physica-Verlag HD: Heidelberg, Germany, 1997; pp. 66–86. [Google Scholar]
- Zhao, M.; Zhifeng, L.I.; Zhong, Y.; Ben, D.; School, A. Polycentric network topology of urban agglomerations in China. Prog. Geogr. 2016, 35, 376–388. [Google Scholar]
- Konishi, H. Formation of Hub Cities: Transportation Cost Advantage and Population Agglomeration. J. Urban Econ. 1999, 48, 1–28. [Google Scholar] [CrossRef]
- Behrens, K.; Mion, G.; Murata, Y.; Suedekum, J. Spatial frictions. J. Urban Econ. 2016, 97, 40–70. [Google Scholar] [CrossRef]
- Van Egeraat, C. Review: Proximity, Distance and Diversity: Issues onEconomic and Local Development. Edited by Arnoud Lagendijk and Päivi Oinas. Aldershot, U.K.: Ashgate, 2005. Econ. Geogr. 2007, 83, 203–204. [Google Scholar]
- Huang, R.R. Distance and trade: Disentangling unfamiliarity effects and transport cost effects. Eur. Am. Econ. Rev. 2005, 51, 161–181. [Google Scholar] [CrossRef]
- Bergstrand, J.H.; Larch, M.; Yotov, Y.V. Economic integration agreements, border effects, and distance elasticities in the gravity equation. Eur. Econ. Rev. 2015, 78, 307–327. [Google Scholar] [CrossRef]
- Mccann, P.; Shefer, D. Location, agglomeration and infrastructure. Pap. Reg. Sci. 2010, 83, 177–196. [Google Scholar] [CrossRef]
- Sánchez, R.J.; Hoffmann, J.; Micco, A.; Pizzolitto, G.V.; Sgut, M.; Wilmsmeier, G. Port Efficiency and International Trade: Port Efficiency as a Determinant of Maritime Transport Costs. Marit. Econ. Logist. 2003, 5, 199–218. [Google Scholar] [CrossRef]
- Pan, H.; Deal, B.; Chen, Y.; Hewings, G. A Reassessment of urban structure and land-use patterns: Distance to CBD or network-based?—Evidence from Chicago. Reg. Sci. Urban Econ. 2018, 70, 215–228. [Google Scholar] [CrossRef]
- Nam, S.Y. WTO Discussions on Technical Barriers to Trade and Implications for Asia-Pacific Regional Economic Integration; KIEP Research Paper No. APEC Study Series-15-01; Korea Institute for International Economic Policy: Sejong-si, Korea, 2016. [Google Scholar]
- Lee, S.I. Developing a bivariate spatial association measure: An integration of Pearson’s r and Moran’s I. J. Geogr. Syst. 2001, 3, 369–385. [Google Scholar] [CrossRef]
- Anselin, L. The Moran Scatterplot as an ESDA Tool to Assess Local Instability in Spatial Association; Regional Research Institute, West Virginia University: Morgantown, WV, USA, 1996. [Google Scholar]
- Friedmann, J.; Miller, J. The Urban Field. J. Am. Plan. Assoc. 1965, 31, 312–320. [Google Scholar] [CrossRef]
- Webster, F. Re-inventing place: Birmingham as an information city? City 2001, 5, 27–46. [Google Scholar] [CrossRef]
- Dong, Q.; Li, Y.; Liu, H. Research on the spatial distribution and division of Urban Agglomerations in China. Urban Stud. 2008, 6, 70–75. [Google Scholar]
- Zhang, R.; Matsushima, K.; Kobayashi, K. Computable urban economic model incorporated with economies of scale for urban agglomeration simulation. Ann. Reg. Sci. 2017, 59, 1–24. [Google Scholar] [CrossRef]
- Almog, A.; Bird, R.; Garlaschelli, D. Enhanced Gravity Model of trade: Reconciling macroeconomic and network models. arXiv, 2015; arXiv:1506.00348. [Google Scholar]
- Chong, Z.; Qin, C.; Ye, X. Environmental Regulation, Economic Network and Sustainable Growth of Urban Agglomerations in China. Sustainability 2016, 8, 467. [Google Scholar] [CrossRef]
- Anderson, J.E. The Gravity Model. Annu. Rev. Econ. 2011, 3, 133–160. [Google Scholar] [CrossRef]
- Qian, S.; Tang, F.; Yong, T. An economic tie network-structure analysis of urban agglomeration in the middle reaches of Changjiang River based on SNA. J. Geogr. Sci. 2015, 25, 739–755. [Google Scholar]
- Liu, H.B.; Liu, Z.L. Spatial economic interaction of urban agglomeration: Gravity and intercity flow modeling & empirical study. In Proceedings of the International Conference on Management Science and Engineering, Long Beach, CA, USA, 10–12 September 2008; pp. 1811–1816. [Google Scholar]
- Qiang, Y.E.; Zhang, L.; Peng, P.; Huang, J.; Architecture, S.O.; University, H. The Network Characteristics of Urban Agglomerations in the Middle Reaches of the Yangtze River Based on Baidu Migration Data. Econ. Geogr. 2017, 37, 53–59. [Google Scholar]
- Muto, M. The Impacts of Mobile Phones and Personal Networks on Rural-to-Urban Migration: Evidence from Uganda. J. Afr. Econ. 2012, 21, 787–807. [Google Scholar] [CrossRef]
- Zhang, H.; Zhou, D. Financial resource flows in Yangtze River Delta from the perspective of financial gradation city in urban agglomerations: A case study of city commercial banks’ expansion. Geogr. Res. 2016, 35, 1740–1752. [Google Scholar]
- Kidder, J.L. Urban Flow: Bike Messengers and the City; Cornell University Press: Ithaca, NY, USA, 2011. [Google Scholar]
- Yang, H.; Dijst, M.; Witte, P.; Van Ginkel, H.; Yang, W. The Spatial Structure of High Speed Railways and Urban Networks in China: A Flow Approach. Tijdschr. Econ. Soc. Geogr. 2017, 109, 109–128. [Google Scholar] [CrossRef]
- Ren, L. The Relationship on Multinational Firms, International Trade and International Shipping. World Ship. 2002, 8, 97–98. [Google Scholar]
- Owen, W. Transportation and world development. Int. J. Transp. Econ. 1984, 11, 123–133. [Google Scholar]
- Zhang, X.Q. Macro-Evolution Path of Typical RIAs and Implications for CAFTA. Asia-Pac. Econ. Rev. 2015, 6, 91–94. [Google Scholar]
- China-ASEAN Strengthens Cooperation to Promote Regional Prosperity. Available online: http://fta.mofcom.gov.cn/article/chinadongmeng/dongmengfguandian/201805/37919_1.html (accessed on 16 August 2018).
- Barragán, J.M.; Andrés, M.D. Analysis and trends of the world’s coastal cities and agglomerations. Ocean Coast. Manag. 2015, 114, 11–20. [Google Scholar] [CrossRef]
- Dong, X.Y. The Impact of Coastal Urban Logistics Economic Development on International Trade Development. In Proceedings of the International Conference on Education, Management and Computing Technology, Hangzhou, China, 15–16 April 2017. [Google Scholar]
- Ni, J.; Qian, T.; Xi, C.; Rui, Y.; Wang, J. Spatial Distribution Characteristics of Healthcare Facilities in Nanjing: Network Point Pattern Analysis and Correlation Analysis. Int. J. Environ. Res. Public Health 2016, 13, 833. [Google Scholar] [CrossRef] [PubMed]
- Xu, Z.; Gao, X. A novel method for identifying the boundary of urban built-up areas with POI data. Acta Geogr. Sin. 2016, 71, 928–939. [Google Scholar]
- Yu, H.; Liu, Z.; Li, Y.J. Key nodes in complex networks identified by multi-attribute decision-making method. Acta Geogr. Sin. 2013, 62, 46–54. [Google Scholar]
- Girvan, M.; Newman, M.E. Community Structure in Social and Biological Networks. Proc. Natl. Acad. Sci. USA 2002, 99, 7821–7826. [Google Scholar] [CrossRef] [PubMed]
- Berry, B.J.L. Central Places in Southern Germany. Econ. Geogr. 1966, 43, 275–276. [Google Scholar] [CrossRef]
- Wei, L. Balance of Relations: ASEAN Centrality and the Evolving Regional Order. World Econ. Polit. 2017, 38, 155–156. [Google Scholar]
- Xu, M.; Li, Z.; Shi, Y.; Zhang, X.; Jiang, S. Evolution of regional inequality in the global shipping network. J. Transp. Geogr. 2015, 44, 1–12. [Google Scholar] [CrossRef]
- Gao, C.; Wei, D.; Hu, Y.; Mahadevan, S.; Deng, Y. A modified evidential methodology of identifying influential nodes in weighted networks. Physica A 2013, 392, 5490–5500. [Google Scholar] [CrossRef]
- Malliaros, F.D.; Vazirgiannis, M. Clustering and community detection in directed networks: A survey. Phys. Rep. 2013, 533, 95–142. [Google Scholar] [CrossRef] [Green Version]
- Blondel, V.D.; Guillaume, J.; Lambiotte, R.; Lefebvre, E. Fast Unfolding of Communities in Large Networks. J. Stat. Mech. Theory Exp. 2008, 2008, 10008. [Google Scholar] [CrossRef]
- Krzywinski, M.; Schein, J.; Birol, I.; Connors, J.; Gascoyne, R.; Horsman, D.; Jones, S.J.; Marra, M.A. Circos: An information aesthetic for comparative genomics. Genome Res. 2009, 19, 1639–1645. [Google Scholar] [CrossRef] [PubMed] [Green Version]
- Robert-Nicoud, F.; Baldwin, R.; Forslid, R.; Martin, P.; Ottaviano, G.I.P. The core-periphery model: Key features and effects. Public Polit. Econ. Geogr. 2004, 99, 483–499. [Google Scholar]
- Srivastava, R.K.; Green, R.T. Determinants of Bilateral Trade Flows. J. Bus. 1986, 59, 623–640. [Google Scholar] [CrossRef]


| Dynamic Information | Statistical Information | Voyage Information |
|---|---|---|
| 1. Ship location 2. Course over ground (COG) 3. Speed over ground (SOG) 4. Heading 5. Navigation status | 1. Maritime Mobile Service Identity (MMSI) 2. IMO number 3. Ship name 4. Ship size 5. Ship type, shipbuilder | 1. Draught 2. Destination 3. Estimated arrival time |
| Rank | Route | Voyage | Rank | Route | Voyage |
|---|---|---|---|---|---|
| 1 | Hong Kong-Singapore | 5376 | 16 | Fangchenggang-Hong Kong | 1852 |
| 2 | Singapore-Hong Kong | 4051 | 17 | Xiamen-Hong Kong | 1817 |
| 3 | Zhangzhou-Xiamen | 3343 | 18 | Tainan-Taichung | 1756 |
| 4 | Tainan-Hong Kong | 3173 | 19 | Hong Kong-Xiamen | 1712 |
| 5 | Xiamen-Zhangzhou | 2953 | 20 | Zhanjiang-Hong Kong | 1704 |
| 6 | Hong Kong-Shantou | 2843 | 21 | Hong Kong-Zhanjiang | 1674 |
| 7 | Bangkok-Singapore | 2838 | 22 | Neibaiyu-Xiamen | 1496 |
| 8 | Singapore-Bangkok | 2774 | 23 | Hong Kong-Fangchenggang | 1463 |
| 9 | Haikou-Fangchenggang | 2528 | 24 | Haikou-Hong Kong | 1452 |
| 10 | Shantou-Hong Kong | 2426 | 25 | Xiamen-Neibaiyu | 1428 |
| 11 | Hong Kong-Tainan | 2348 | … | … | … |
| 12 | Hong Kong-Haikou | 2085 | … | … | … |
| 13 | Fangchenggang-Haikou | 1968 | 365 | Samarinda-Meizhou | 50 |
| 14 | Zhangzhou-Hong Kong | 1948 | 366 | Manila-Batangas | 50 |
| 15 | Taichung-Tainan | 1871 | 367 | Sanya-Haikou | 50 |
| Rank | Port Name | Degree Centrality | Betweenness Centrality | Closeness Centrality |
|---|---|---|---|---|
| 1 | Singapore | 1 | 1 | 1 |
| 2 | Hong Kong | 0.9117 | 0.5731 | 0.9664 |
| 3 | Tainan | 0.5147 | 0.1142 | 0.8275 |
| 4 | Bangkok | 0.4926 | 0.1188 | 0.8000 |
| 5 | Shantou | 0.4779 | 0.1011 | 0.7826 |
| 6 | Xiamen | 0.4632 | 0.0665 | 0.7783 |
| 7 | Ho Chi Minh | 0.4632 | 0.1181 | 0.7912 |
| 8 | Zhangzhou | 0.4338 | 0.0470 | 0.7346 |
| 9 | Fangchenggang | 0.4117 | 0.0336 | 0.7422 |
| 10 | Manila | 0.3676 | 0.2214 | 0.7741 |
| … | … | … | … | … |
| 103 | Bataraza | 0.0073 | 0 | 0.5783 |
| 104 | SanyuIslet | 0.0073 | 0 | 0.4528 |
| 105 | Iligan | 0.0073 | 0 | 0.5783 |
| 106 | Ozamiz | 0.0073 | 0 | 0.3720 |
| Indicator | Degree Centrality | Betweenness Centrality | Closeness Centrality |
|---|---|---|---|
| Mean | 0.1714 | 0.0291 | 0.1352 |
| Standard Deviation | 0.1710 | 0.1144 | 0.1017 |
| Variance | 0.0293 | 0.0131 | 0.0103 |
| Max Value | 1 | 1 | 1 |
| Min Value | 0.0073 | 0 | 0.3564 |
| Core Layer (2) | Intermediate Layer (9) | Edge Layer (95) |
|---|---|---|
| Singapore | Bangkok | Shantou |
| Hong Kong | Shantou | Zhangzhou |
| Xiamen | Fangchenggang | |
| Ho Chi Minh | Meizhou | |
| Manila | Neibaiyu | |
| Samarinda | Haikou | |
| Taichung | Zhanjiang | |
| Lungsod ng Cebu | Beihai | |
| Tainan | Haiphong | |
| …… | ||
| SanyuIslet | ||
| Iligan | ||
| Ozamiz |
| Subgroup | Name | Type | City |
|---|---|---|---|
| A | Chinese coastal community (33) | Core (1) | Hong Kong |
| Intermediate (4) | Shantou | ||
| Xiamen | |||
| Zhangzhou | |||
| Fangchenggang | |||
| Edge (28) | Haikou | ||
| Zhanjiang | |||
| Beihai | |||
| … | |||
| B | ASEA community (41) | Core (1) | Singapore |
| Intermediate (4) | Bangkok | ||
| Ho Chi Minh | |||
| Samarinda | |||
| Haiphong | |||
| Edge (36) | Banjarmasin | ||
| Satui | |||
| Sipitang | |||
| … | |||
| C | Philippine community (27) | Intermediate (2) | Manila |
| Lungsod ng Cebu | |||
| Edge (25) | Dabaw | ||
| Subic | |||
| … | |||
| D | Taiwan community (5) | Intermediate (2) | Tainan |
| Taichung | |||
| Edge (3) | Xinbei | ||
| Keelung | |||
| Mailiao |
© 2018 by the authors. Licensee MDPI, Basel, Switzerland. This article is an open access article distributed under the terms and conditions of the Creative Commons Attribution (CC BY) license (http://creativecommons.org/licenses/by/4.0/).
Share and Cite
Zhang, X.; Chen, Y.; Li, M. Research on Geospatial Association of the Urban Agglomeration around the South China Sea Based on Marine Traffic Flow. Sustainability 2018, 10, 3346. https://doi.org/10.3390/su10093346
Zhang X, Chen Y, Li M. Research on Geospatial Association of the Urban Agglomeration around the South China Sea Based on Marine Traffic Flow. Sustainability. 2018; 10(9):3346. https://doi.org/10.3390/su10093346
Chicago/Turabian StyleZhang, Xianzhe, Yanming Chen, and Manchun Li. 2018. "Research on Geospatial Association of the Urban Agglomeration around the South China Sea Based on Marine Traffic Flow" Sustainability 10, no. 9: 3346. https://doi.org/10.3390/su10093346
APA StyleZhang, X., Chen, Y., & Li, M. (2018). Research on Geospatial Association of the Urban Agglomeration around the South China Sea Based on Marine Traffic Flow. Sustainability, 10(9), 3346. https://doi.org/10.3390/su10093346