
Dynamic Electricity Intensity Trends in 91 Countries

Abstract
:1. Introduction
2. Previous Research on EI
2.1. Research on the Comparison and Convergence of EI
2.2. Research on the Determinants of EI
3. Brief Review of EC
4. Data and Method
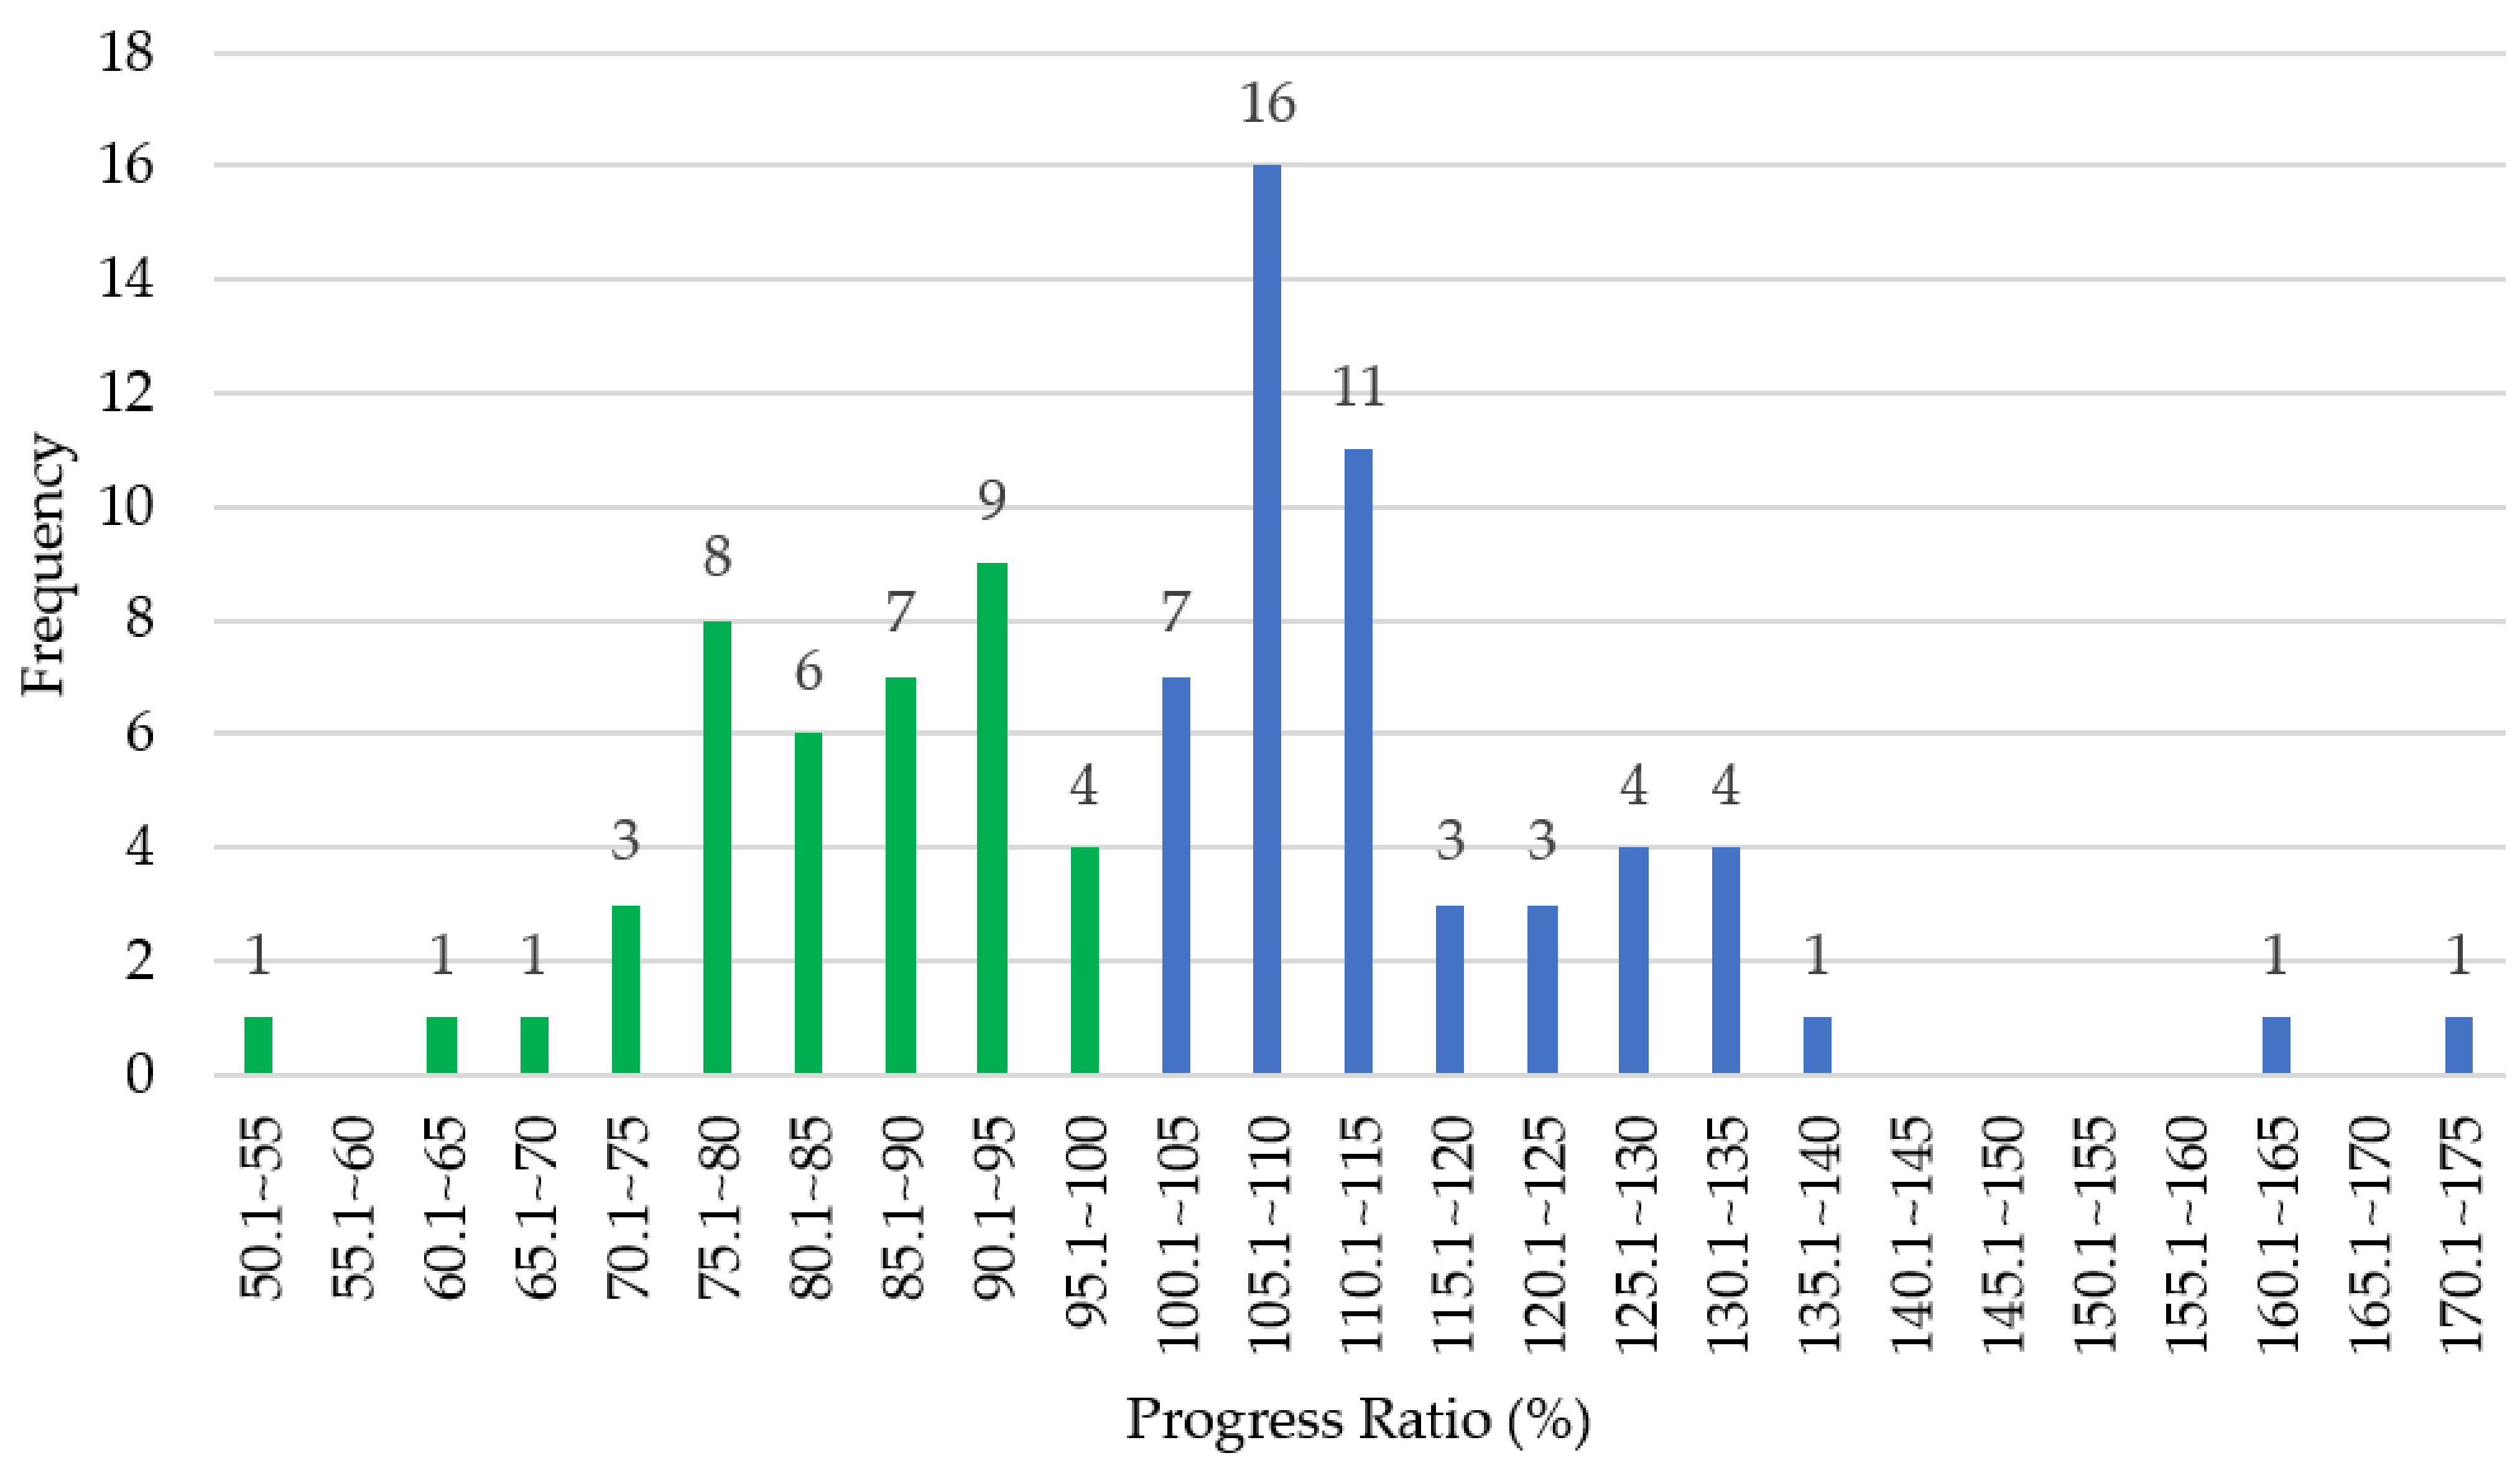
5. Results and Discussion
5.1. Income Group Analysis
5.2. Regional Analysis
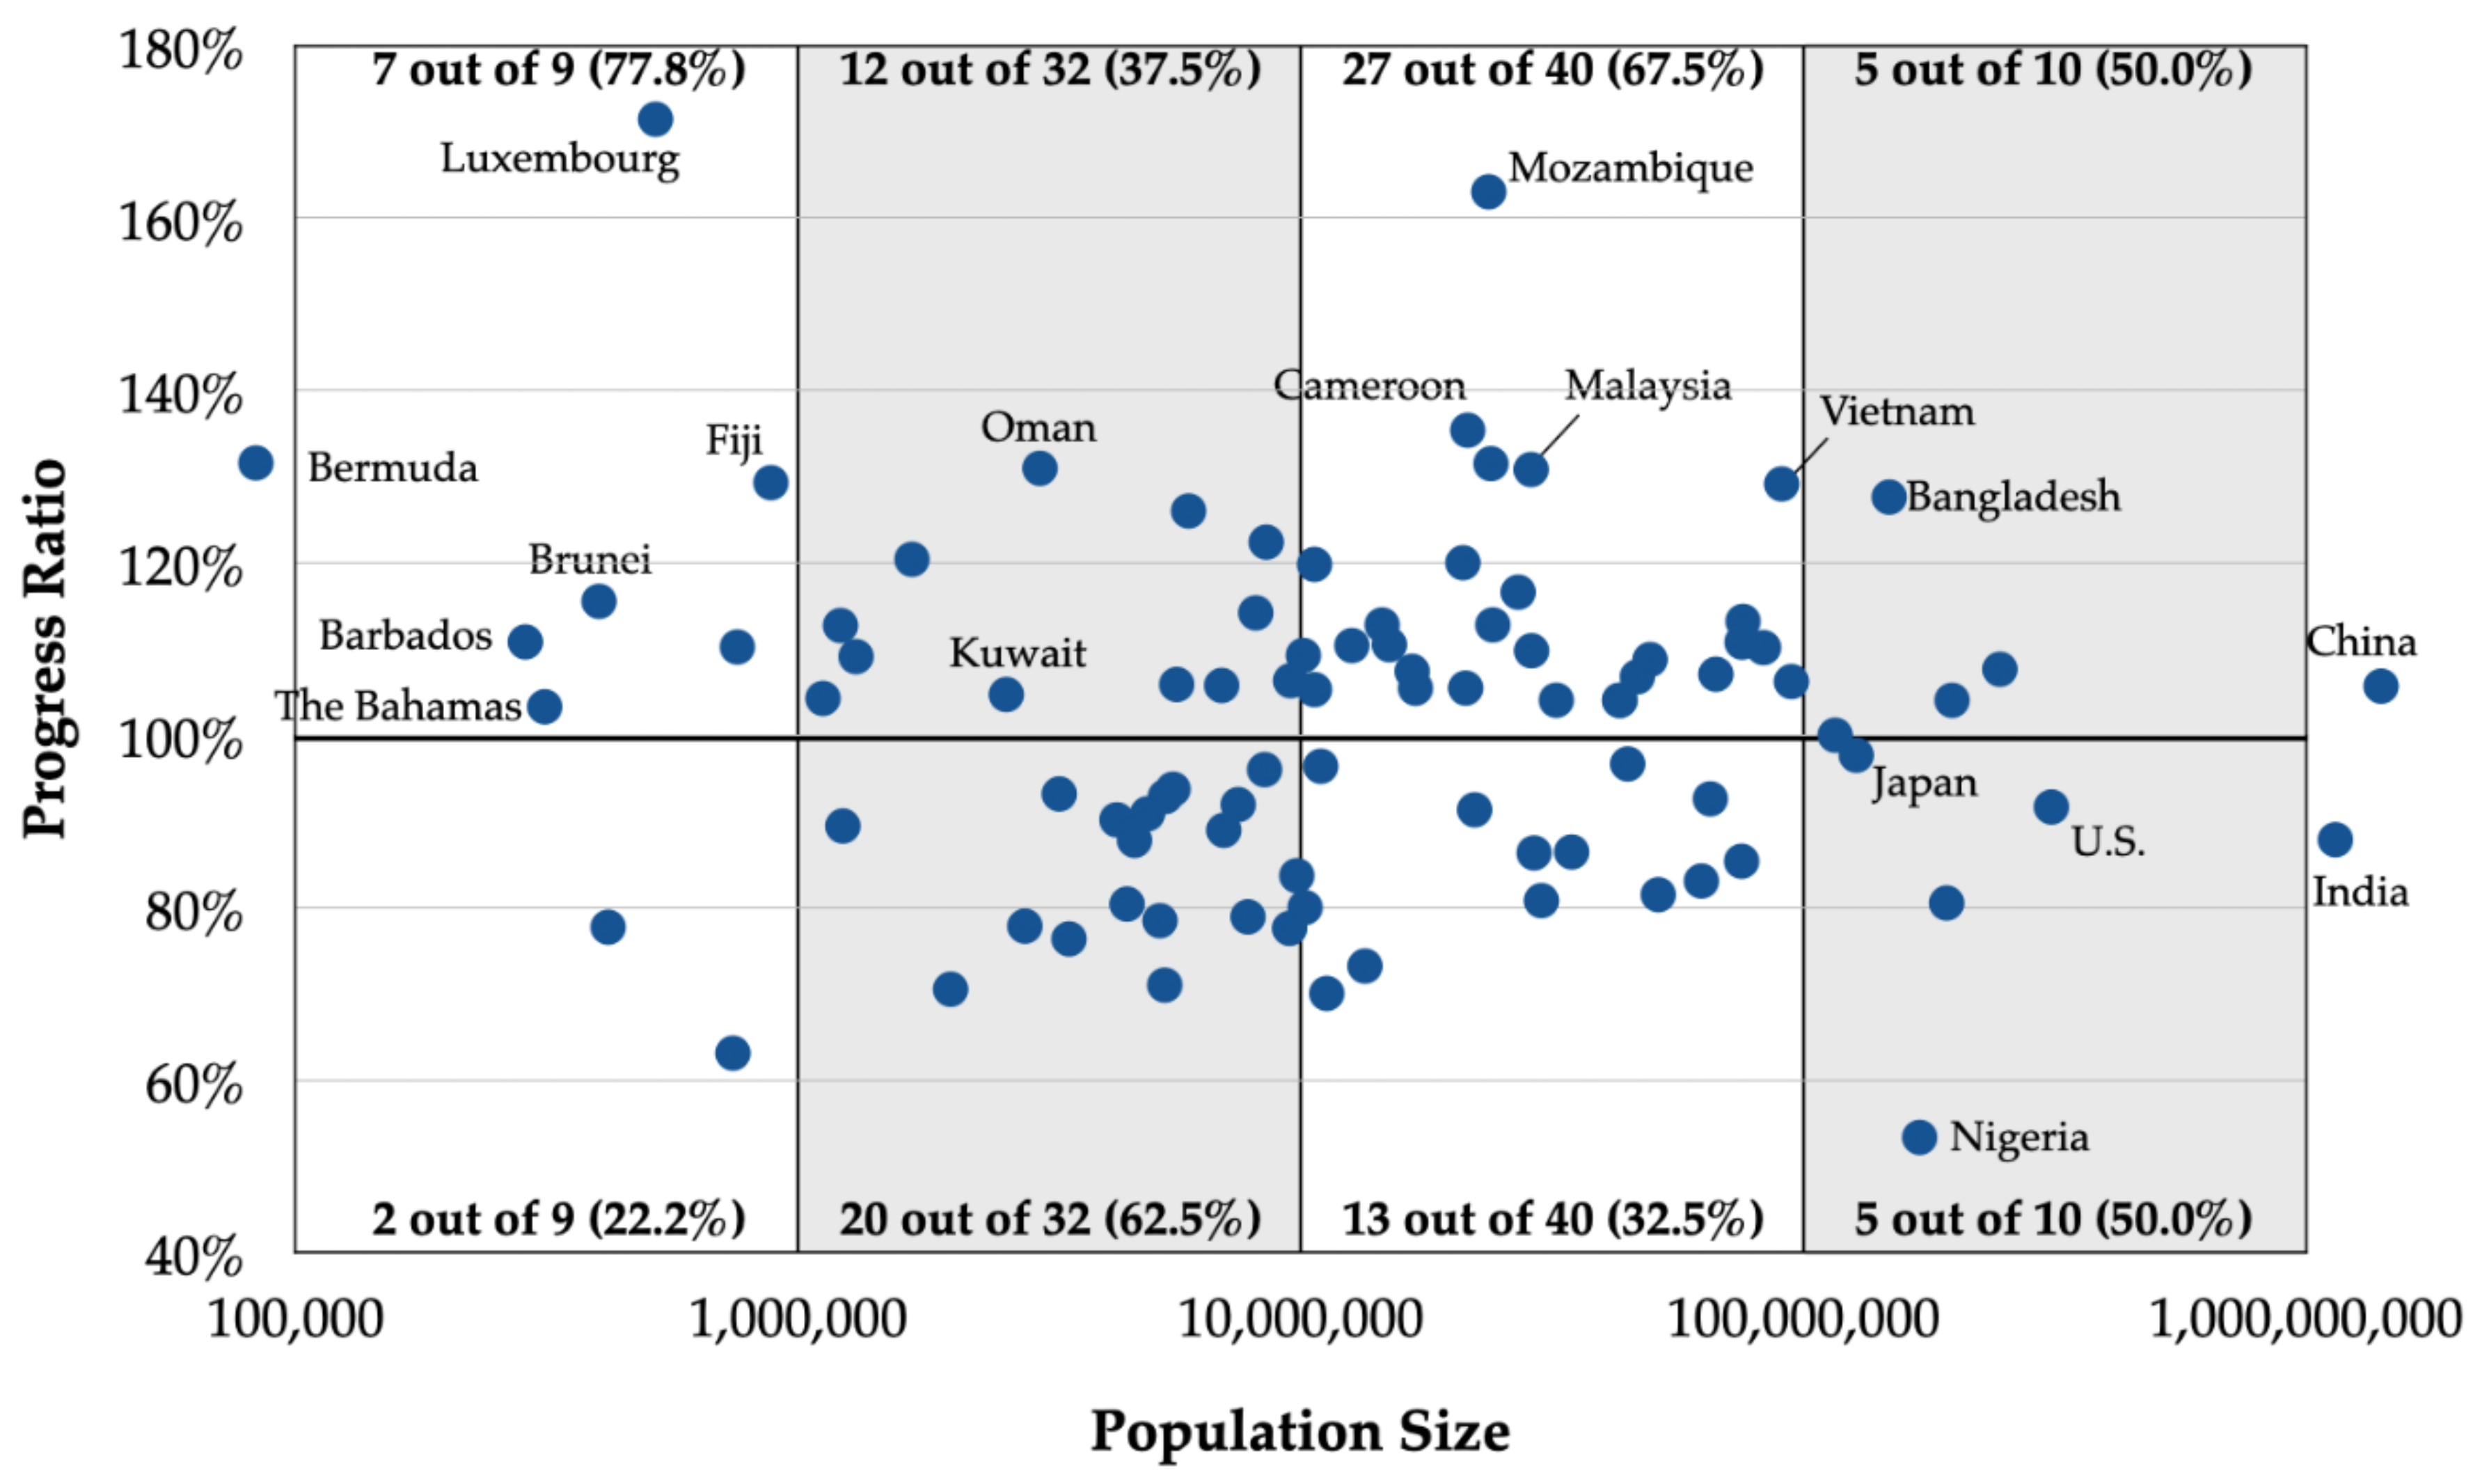
5.3. Population Analysis
5.3.1. Population Size
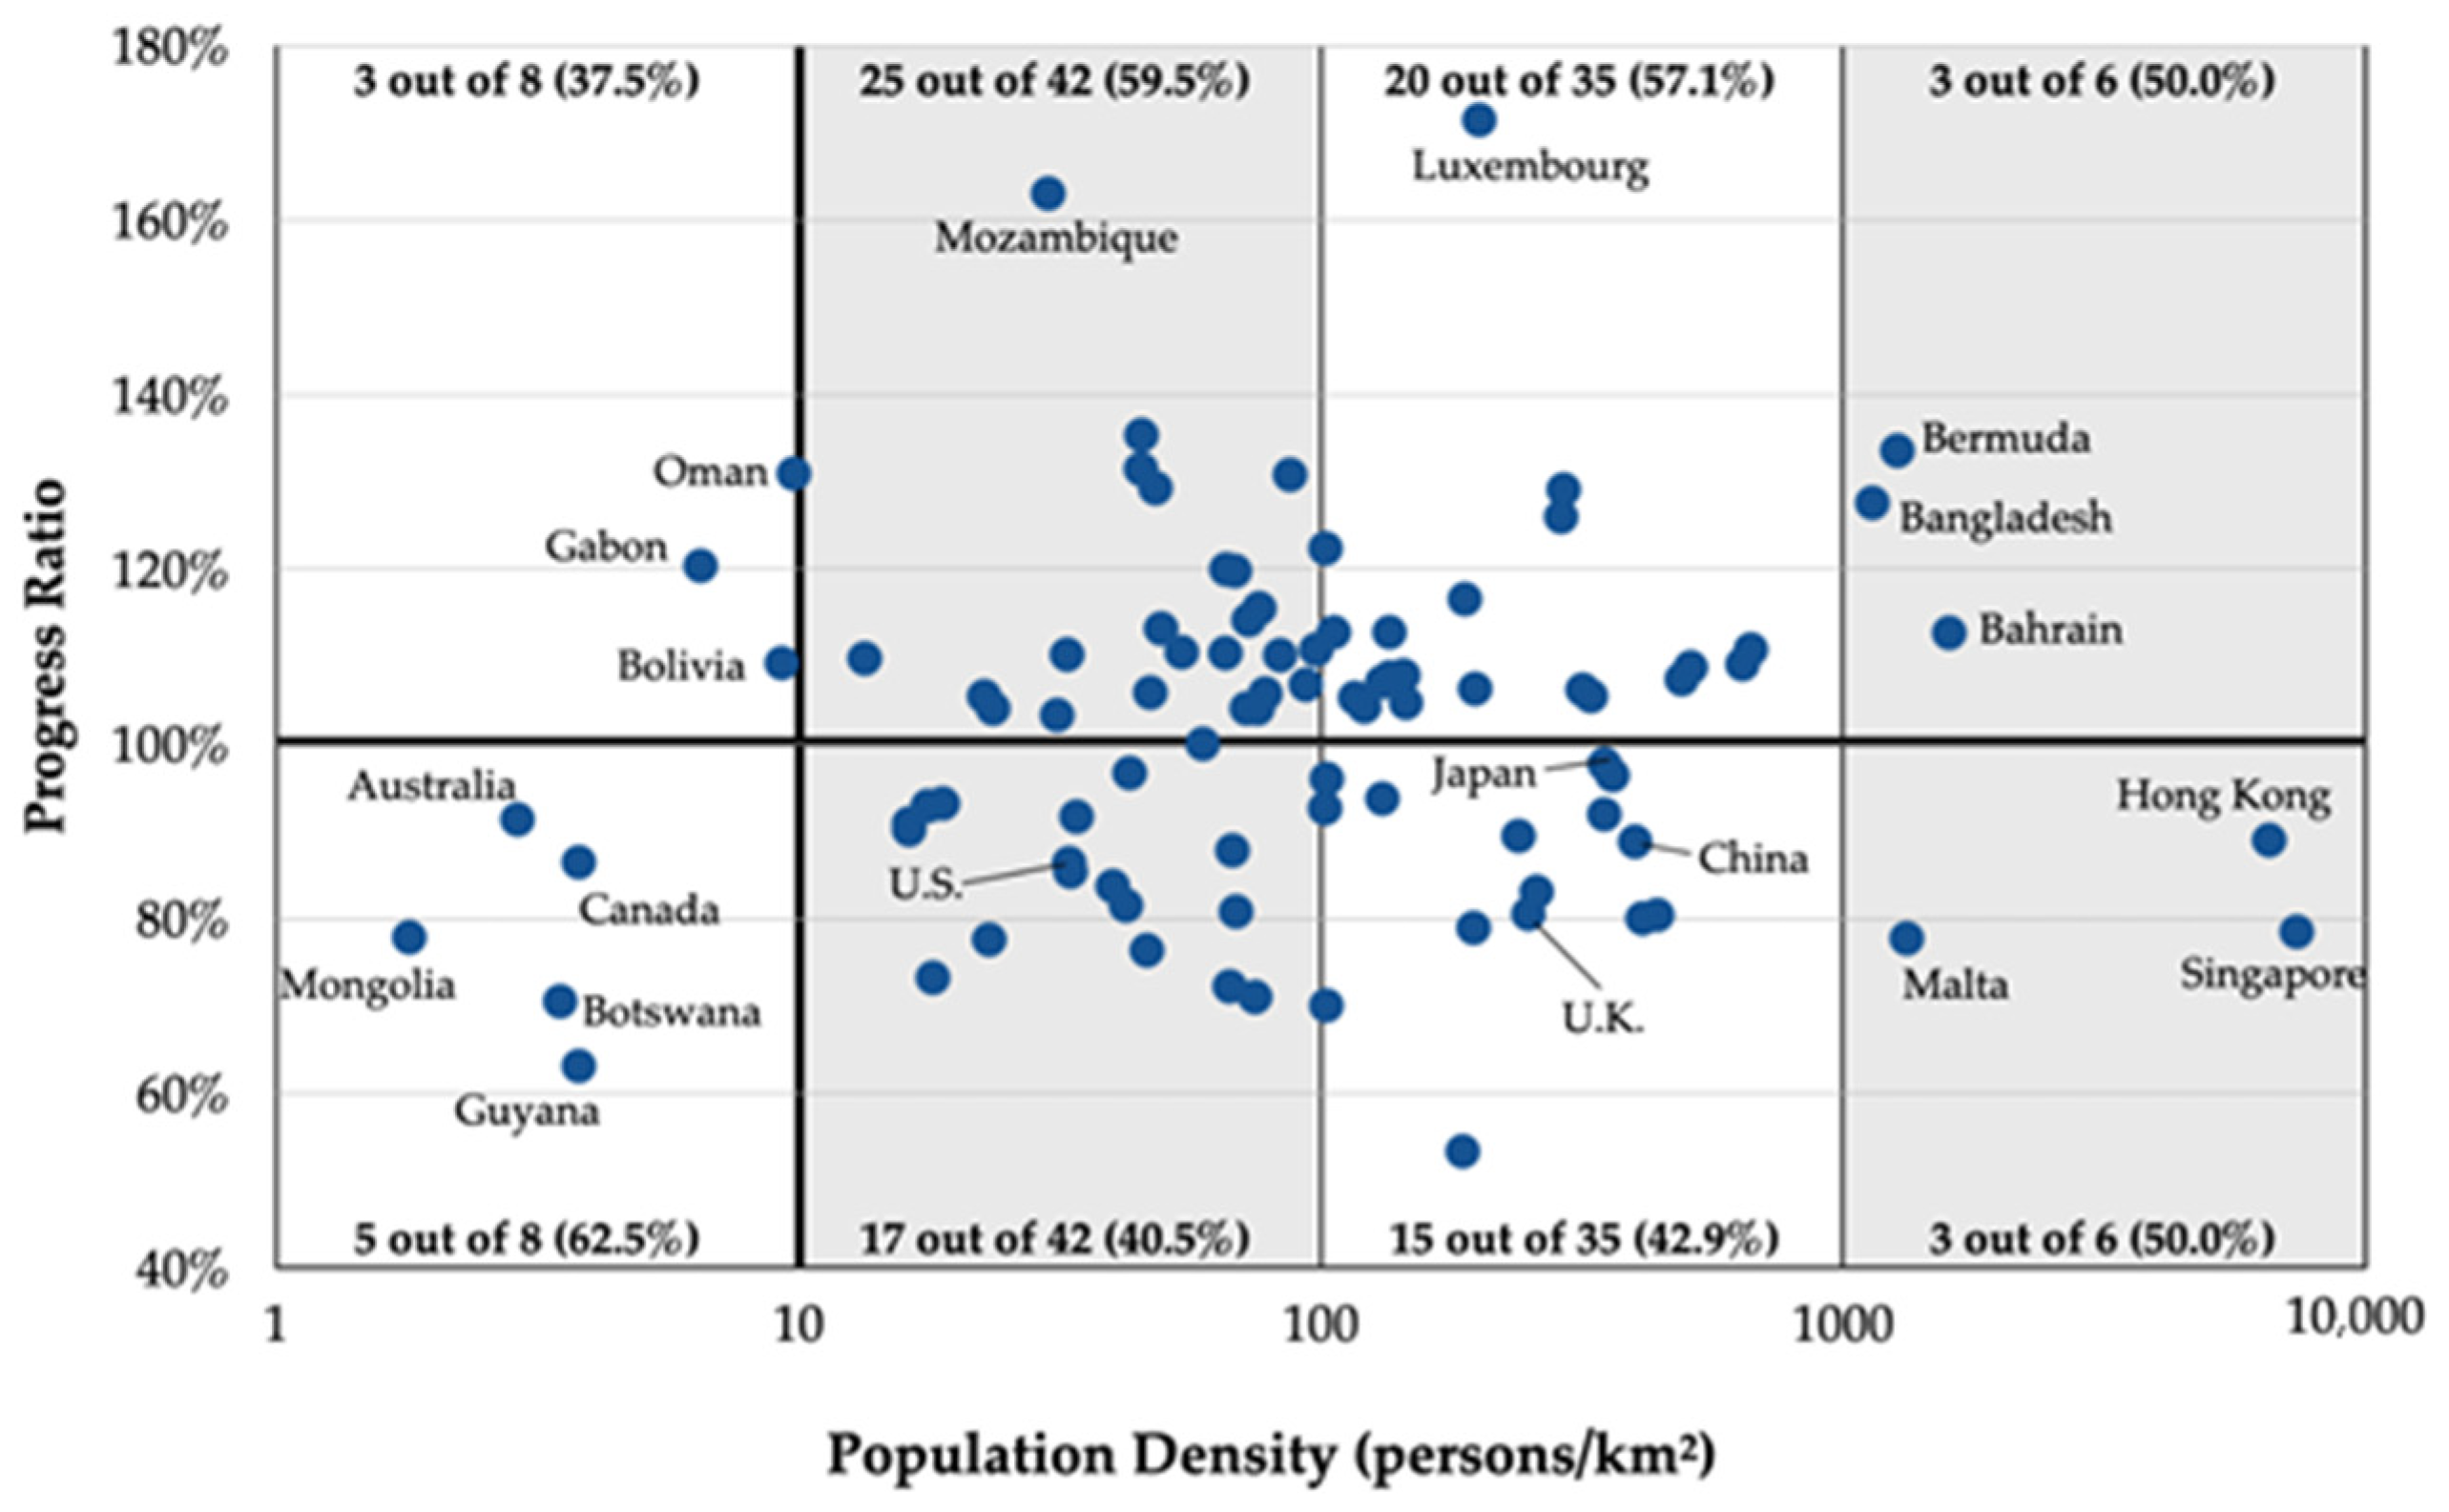
5.3.2. Population Density
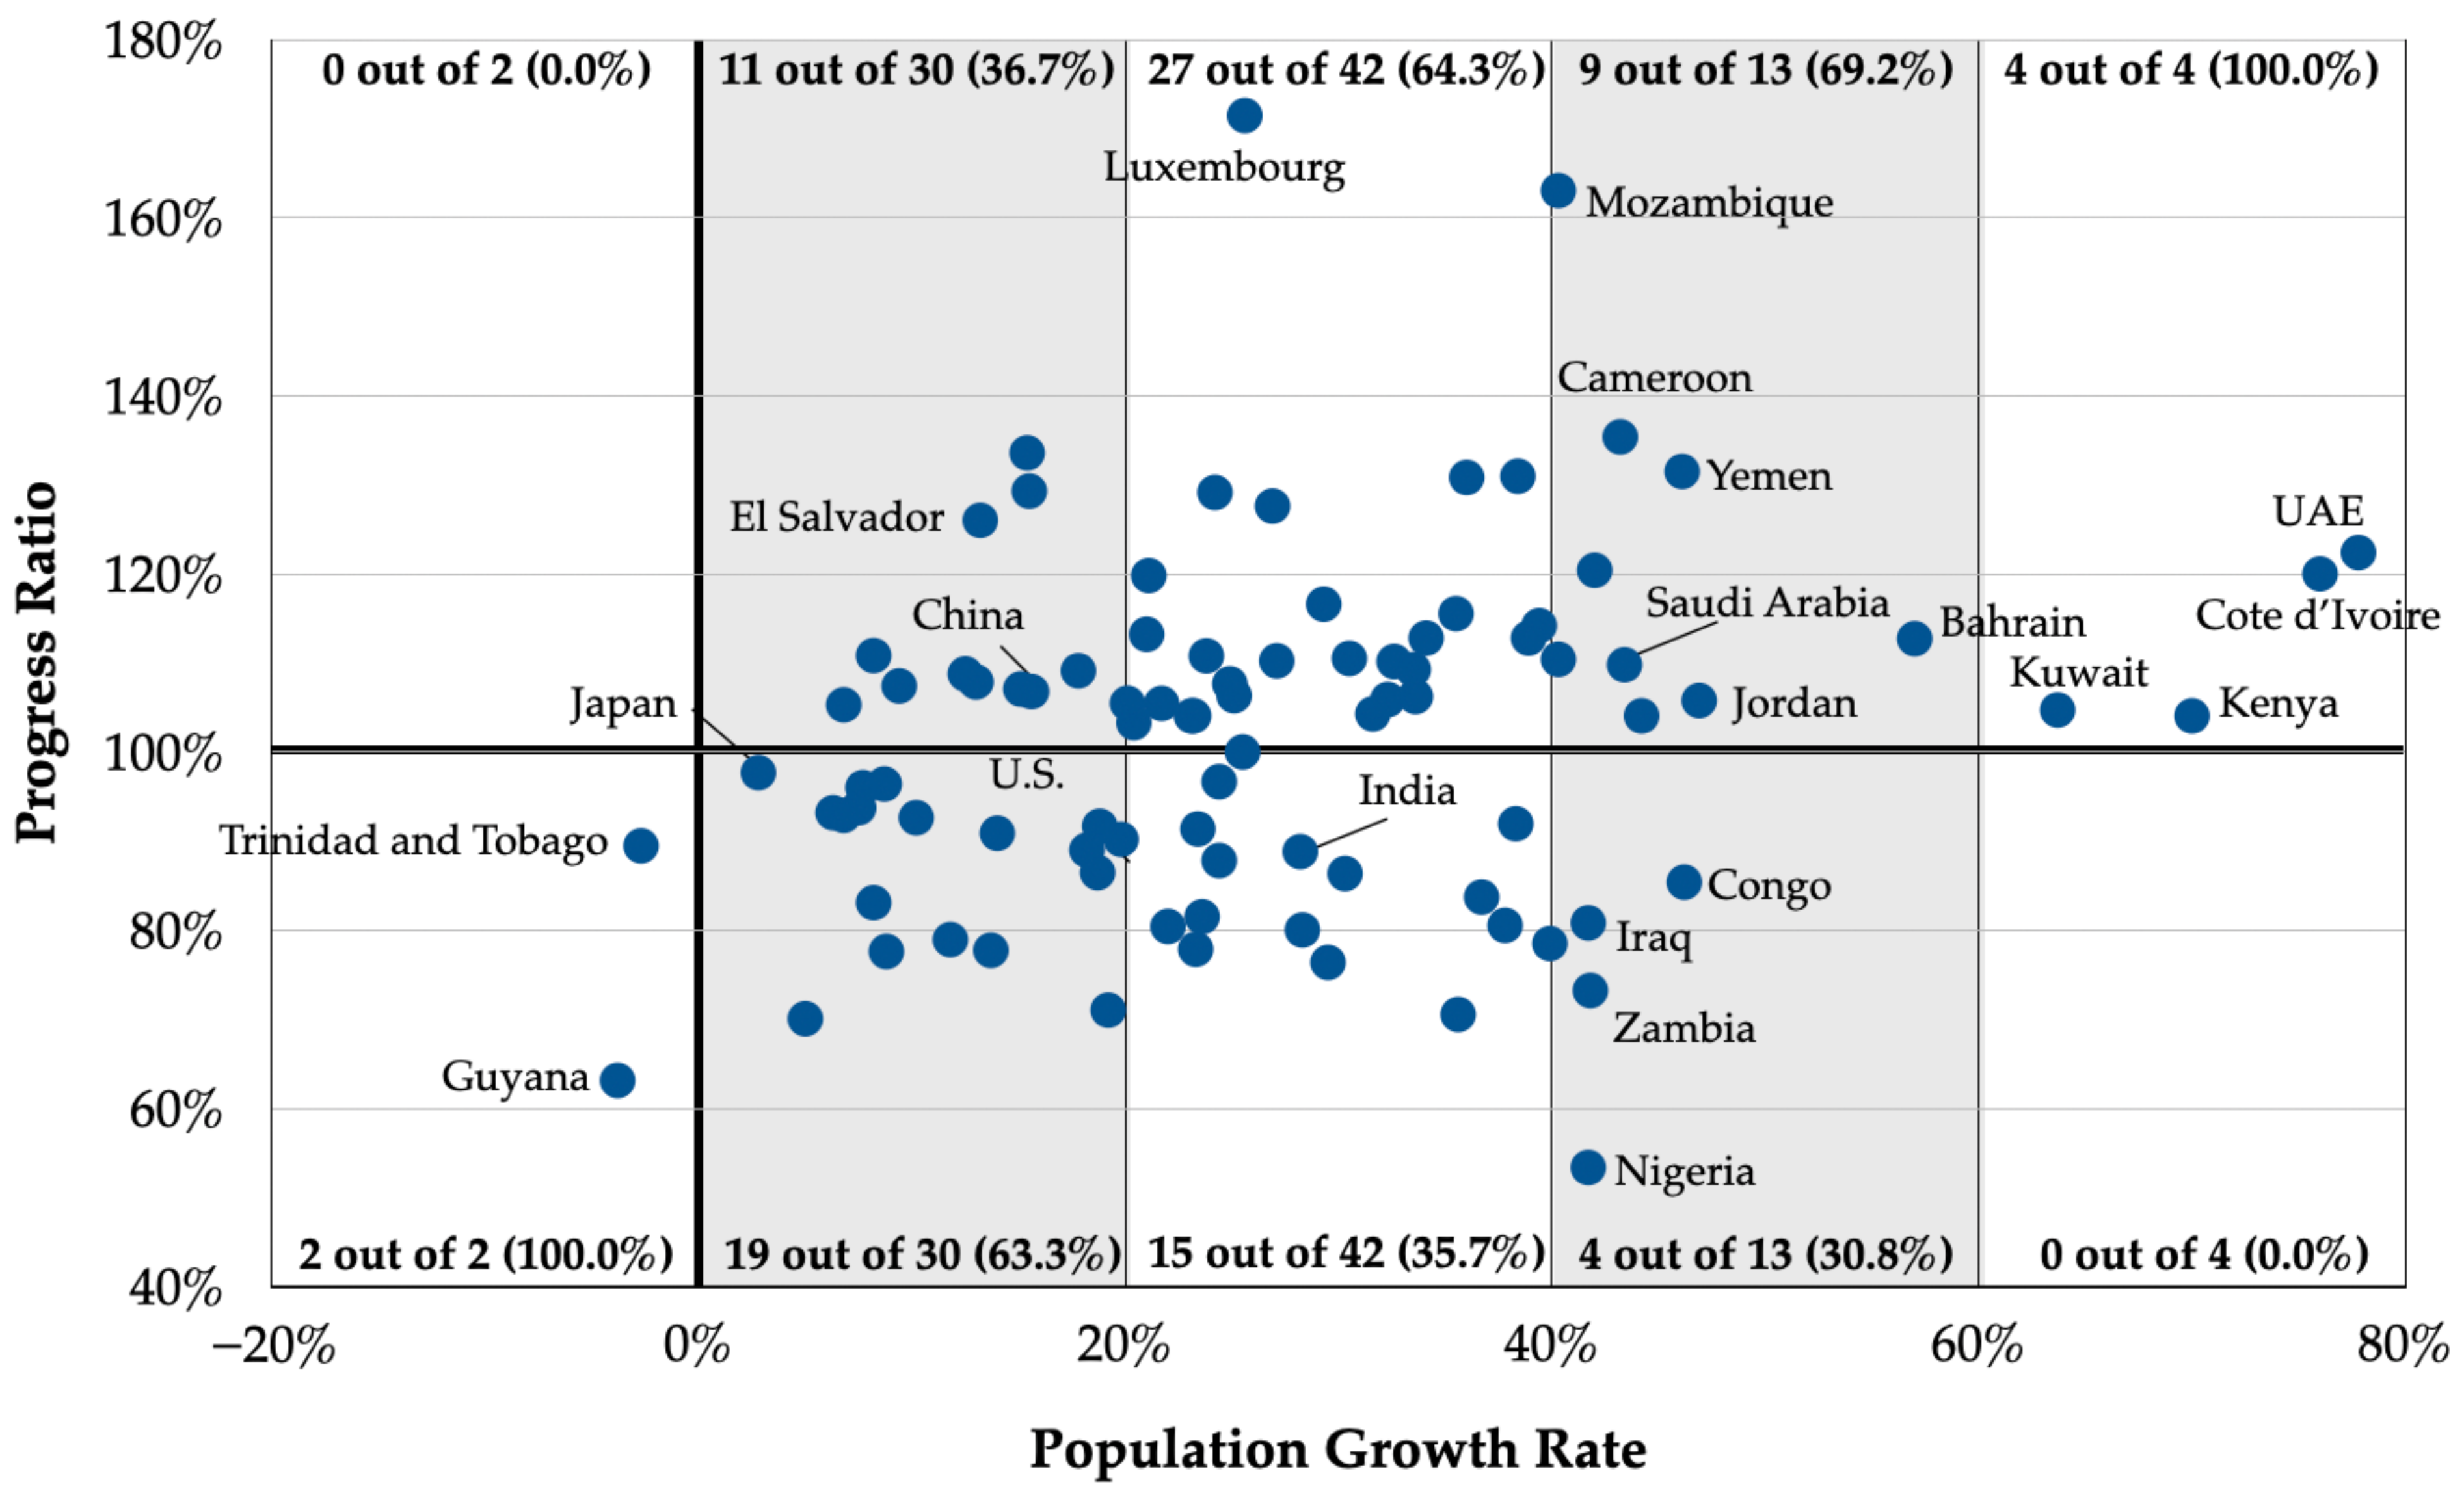
5.3.3. Population Growth Rate
5.4. Classical vs. Kinked
5.5. Robustness Test
6. Conclusions
Author Contributions
Funding
Institutional Review Board Statement
Informed Consent Statement
Data Availability Statement
Acknowledgments
Conflicts of Interest
Appendix A

| Country | Classical Experience Equation | Kinked Year | Kinked Experience Equation | Model Selection | |||||||||
|---|---|---|---|---|---|---|---|---|---|---|---|---|---|
| ln a | b | R2 | PR | ln a1 | b1 | ln a2 | b2 | b2-b1 | R2 | PR2 | |||
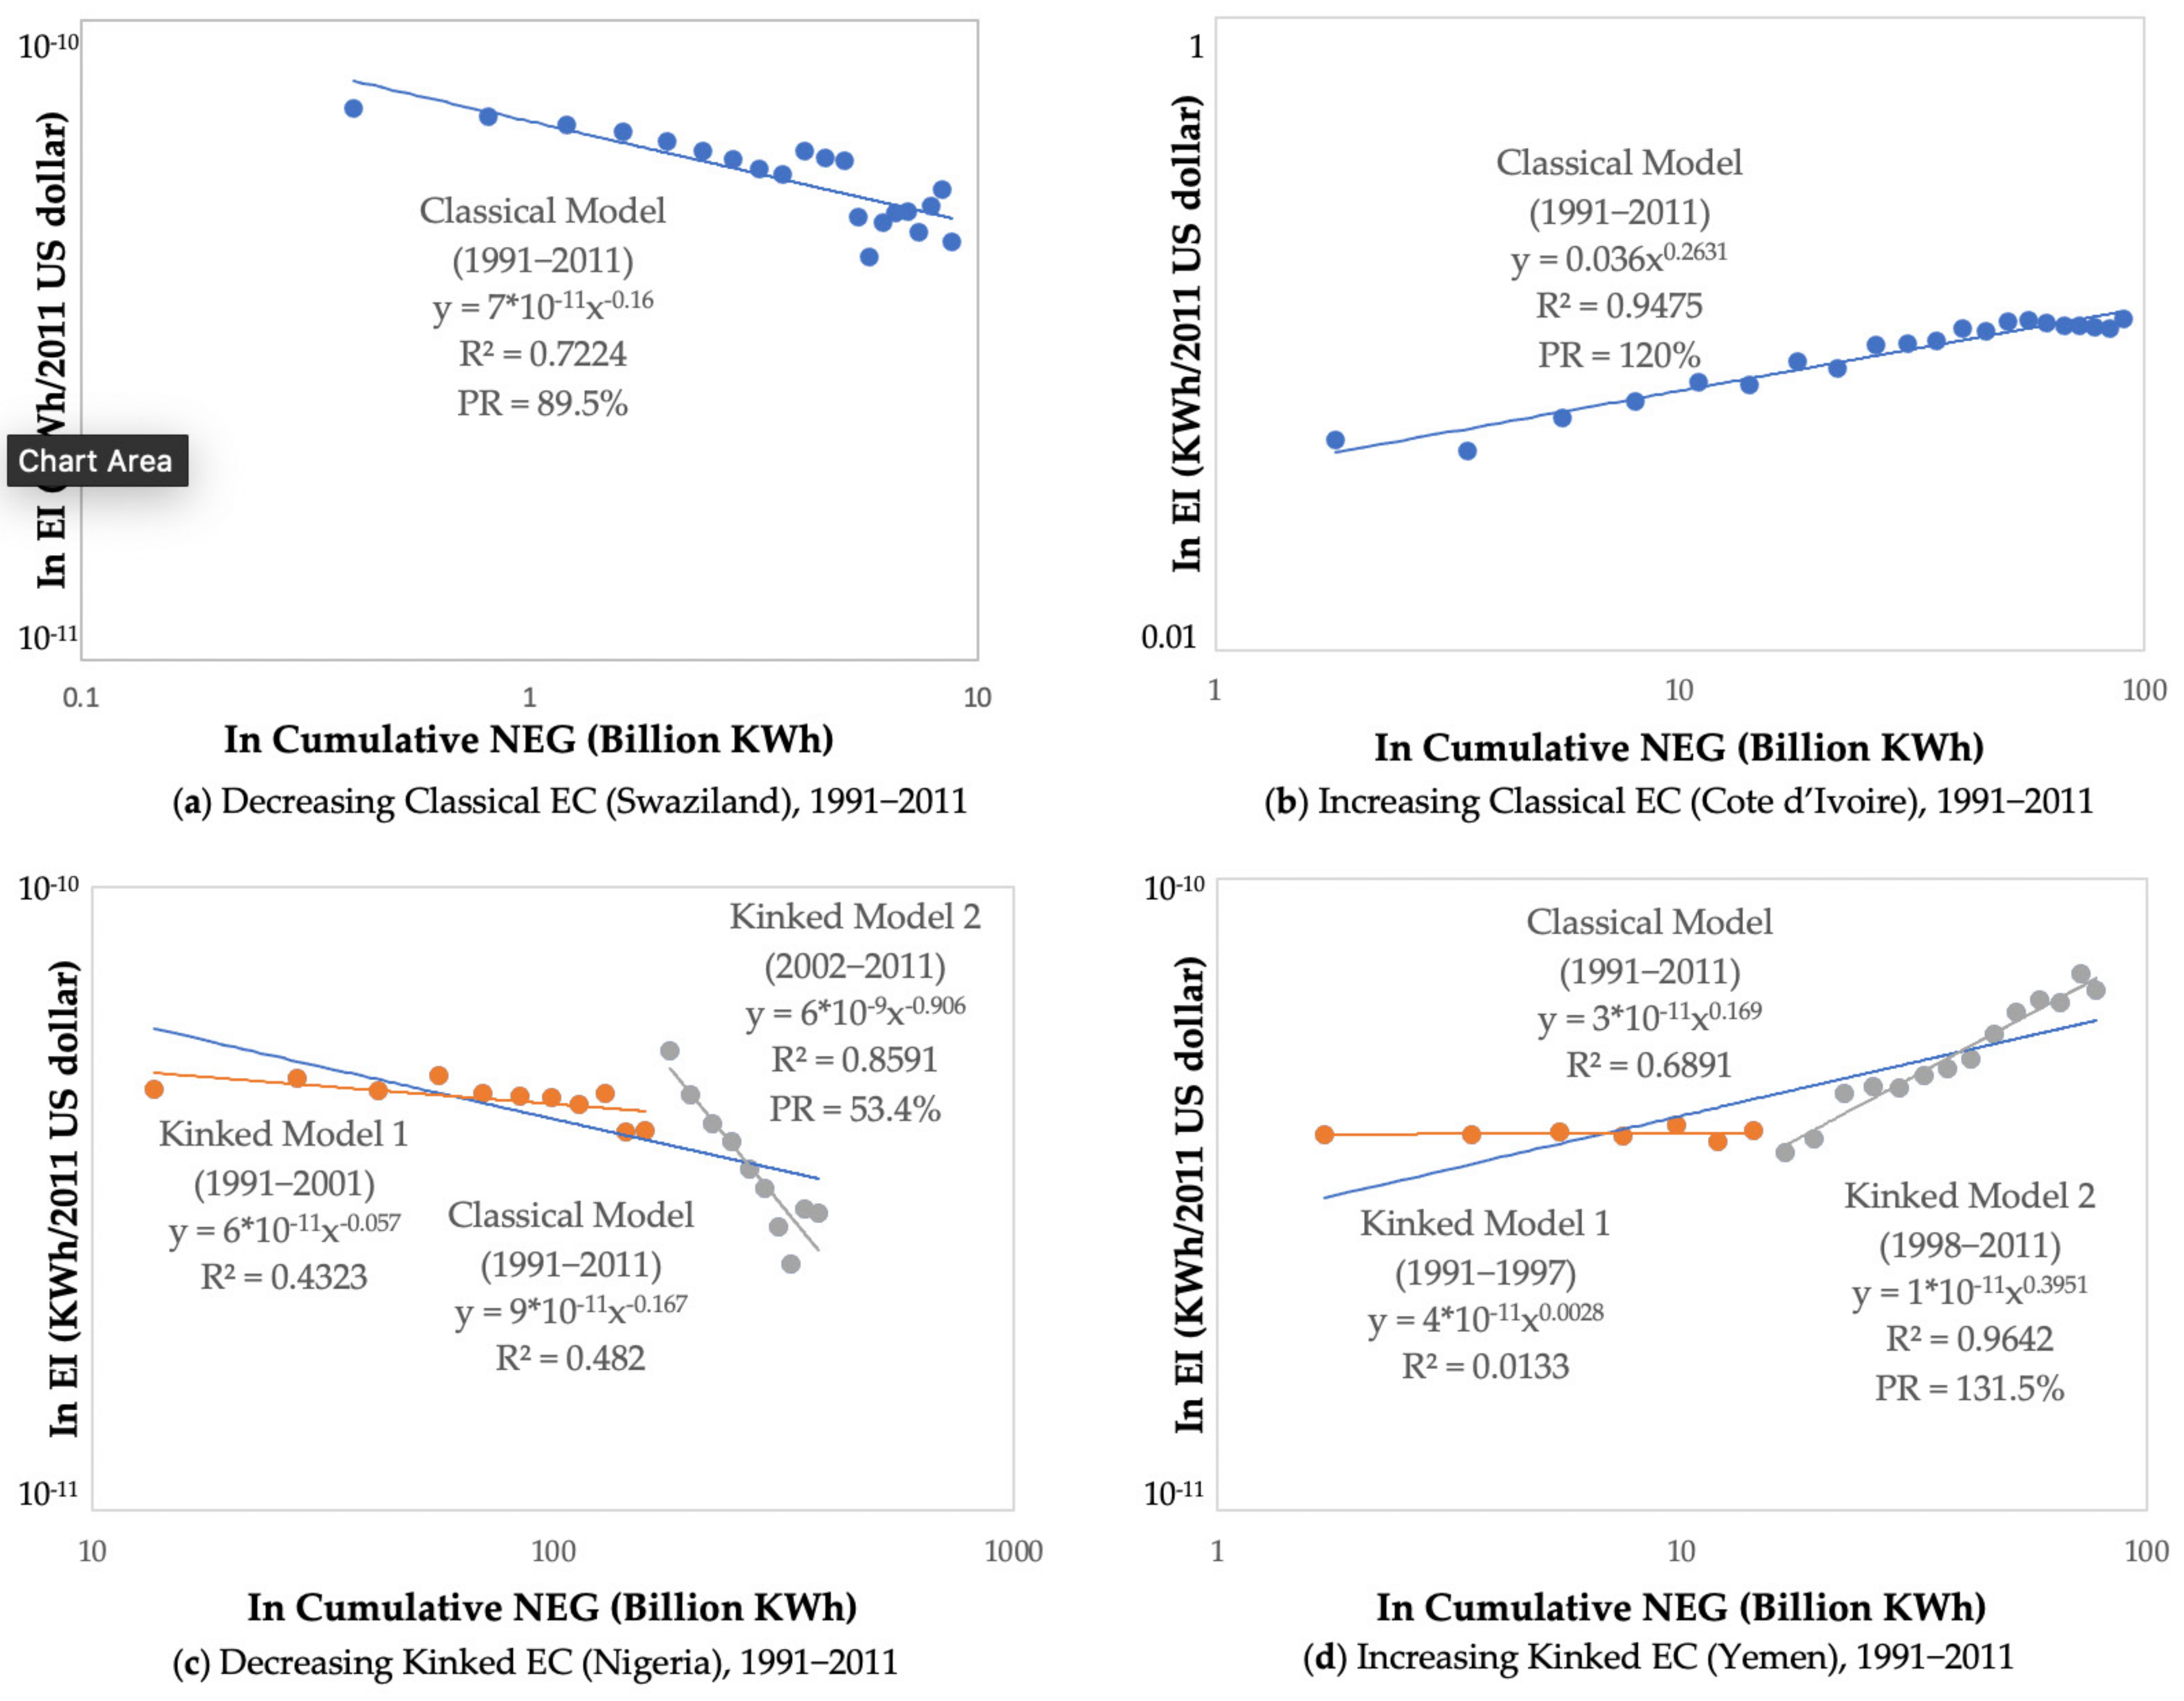
| 1. Nigeria | −23.115 ** (0.296) | −0.167 * (0.060) | 0.4820 | 0.8909 | 2002 | −23.563 ** (0.190) | −0.057 (0.043) | −18.993 ** (0.987) | −0.906 ** (0.181) | −0.849 ** (0.186) | 0.8591 | 0.5336 | Kinked |
| 2. Guyana | −1.981 ** (0.097) | 0.171 ** (0.050) | 0.4010 | 1.1256 | 2001 | −1.984 ** (0.109) | 0.374 ** (0.101) | −0.161 (0.199) | −0.664 ** (0.089) | −1.037 ** (0.135) | 0.8633 | 0.6313 | Kinked |
| 3. Cuba | −1.825 ** (0.342) | −0.098 (0.069) | 0.2950 | 0.9345 | 2000 | −2.539 ** (0.150) | 0.093 ** (0.036) | 0.358 (0.290) | −0.513 ** (0.053) | −0.607 ** (0.064) | 0.9480 | 0.7006 | Kinked |
| 4. Botswana | −2.067 ** (0.472) | −0.504 * (0.206) | 0.6270 | 0.7054 | 2001 | −2.436 ** (0.305) | −0.187 (0.170) | 1.831 (0.931) | −0.187 (0.170) | −1.820 ** (0.401) | 0.8948 | 0.8784 | Classical |
| 5. Sierra Leone | −24.412 ** (0.104) | −0.494 * (0.182) | 0.3620 | 0.7103 | 2005 | −24.294 ** (0.090) | −0.295 (0.156) | −27.038 ** (1.235) | 2.789 (1.587) | 3.084 (1.594) | 0.6636 | 6.9120 | Classical |
| 6. Zambia | −21.005 ** (0.246) | −0.197 ** (0.055) | 0.7518 | 0.8724 | 1999 | −21.472 ** (0.126) | −0.053 (0.037) | −19.816 ** (0.134) | −0.449 ** (0.028) | −0.397 ** (0.056) | 0.9569 | 0.7323 | Kinked |
| 7. Panama | −22.656 ** (0.072) | −0.001 (0.021) | 0.0001 | 0.9994 | 2002 | −22.795 ** (0.129) | 0.0520 (0.044) | −21.009 ** (0.187) | −0.389 ** (0.044) | −0.441 ** (0.062) | 0.6315 | 0.7638 | Kinked |
| 8. Sweden | 0.442 (0.351) | −0.177 ** (0.048) | 0.7608 | 1.1307 | 1999 | −0.361 (0.185) | −0.045 (0.029) | 1.866 ** (0.387) | −0.366 ** (0.050) | −0.321 ** (0.057) | 0.9403 | 0.7761 | Kinked |
| 9. Malta | −22.256 ** (0.212) | −0.039 ** (0.011) | 0.3220 | 0.9732 | 2003 | −22.229 ** (0.030) | −0.061 ** (0.014) | −21.142 ** (0.363) | −0.363 ** (0.064) | −0.303 ** (0.066) | 0.8722 | 0.7774 | Kinked |
| 10. Mongolia | −21.684 ** (0.075) | −0.154 ** (0.023) | 0.8365 | 0.8989 | 2000 | −21.757 ** (0.103) | −0.127 ** (0.038) | −20.900 ** (0.138) | −0.361 ** (0.038) | −0.234 ** (0.054) | 0.9535 | 0.7786 | Kinked |
| 11. Singapore | −22.536 ** (0.065) | −0.033* (0.014) | 0.1616 | 0.9777 | 2001 | −22.643 ** (0.099) | −0.011 (0.022) | −20.614 ** (0.227) | −0.349 ** (0.037) | −0.338 ** (0.043) | 0.8794 | 0.7850 | Kinked |
| 12. Switzerland | −22.003 ** (0.270) | −0.078 (0.042) | 0.3849 | 0.9475 | 1999 | −22.452 ** (0.229) | 0.007 (0.041) | −20.167 ** (0.265) | −0.349 ** (0.039) | −0.356 ** (0.057) | 0.8078 | 0.7851 | Kinked |
| 13. Rwanda | −24.501 ** (0.109) | −0.341* (0.148) | 0.3546 | 0.7894 | 2000 | −24.168 ** (0.123) | 0.022 (0.138) | −25.322 ** (0.241) | 0.523 (0.257) | 0.500 (0.292) | 0.7793 | 1.4364 | Classical |
| 14. Lebanon | −2.469 ** (0.092) | 0.207 ** (0.025) | 0.7757 | 1.1541 | 2002 | −2.679 ** (0.082) | 0.281 ** (0.025) | 0.081 (0.385) | −0.321 ** (0.080) | −0.602 ** (0.084) | 0.9539 | 0.8003 | Kinked |
| 15. Pakistan | −22.960 ** (0.102) | 0.033 (0.017) | 0.2038 | 1.0230 | 2007 | −23.172 ** (0.054) | 0.073 ** (0.009) | −20.553 ** (0.542) | −0.314 * (0.075) | −0.387 ** (0.054) | 0.0310 | 0.8042 | Kinked |
| 16. Iraq | −0.309 (0.211) | −0.312 ** (0.039) | 0.7620 | 0.8054 | 1998 | −0.701* (0.275) | −0.202 ** (0.063) | −2.358 ** (0.537) | 0.025 (0.090) | 0.227 (0.110) | 0.9016 | 1.0174 | Classical |
| 17. South Africa | −21.240 ** (0.179) | −0.042 (0.024) | 0.3366 | 0.9711 | 2005 | −21.528 ** (0.090) | 0.002 (0.013) | −19.118 ** (0.264) | −0.307 ** (0.033) | −0.309 ** (0.035) | 0.8695 | 0.8082 | Kinked |
| 18. U.K. | −0.932 ** (0.162) | −0.101 ** (0.020) | 0.8038 | 0.9323 | 2002 | −1.273 ** (0.061) | −0.053 ** (0.008) | 0.719* (0.285) | −0.295 ** (0.033) | −0.242 ** (0.034) | 0.9786 | 0.8151 | Kinked |
| 19. Guinea | −2.694 ** (0.046) | 0.049* (0.023) | 0.2104 | 1.0345 | 2001 | −2.690 ** (0.049) | 0.007 (0.046) | −1.909 ** (0.116) | −0.267 ** (0.046) | −0.274 ** (0.065) | 0.7217 | 0.8309 | Kinked |
| 20. Congo (Kinshasa) | −2.179 ** (0.147) | 0.149 ** (0.038) | 0.5564 | 1.1085 | 2000 | −2.213 ** (0.278) | 0.150 (0.083) | −0.339 (0.350) | −0.256 ** (0.078) | −0.406 ** (0.114) | 0.8463 | 0.8372 | Kinked |
| 21. Venezuela | −22.737 ** (0.082) | 0.085 ** (0.014) | 0.5895 | 1.0604 | 2002 | −22.713 ** (0.147) | 0.078 ** (0.025) | −20.474 ** (0.642) | −0.228* (0.088) | −0.306 ** (0.091) | 0.8760 | 0.8539 | Kinked |
| 22. Canada | 0.363 (0.298) | −0.124 ** (0.034) | 0.8093 | 0.9175 | 1997 | −0.504 ** (0.117) | −0.004 (0.015) | 1.136 ** (0.152) | −0.212 ** (0.017) | −0.207 ** (0.023) | 0.9854 | 0.8636 | Kinked |
| 23. Ireland | −1.141 ** (0.176) | −0.154 ** (0.033) | 0.8500 | 0.8985 | 1994 | −1.744 ** (0.101) | 0.019 (0.029) | −0.839 ** (-0.210) | −0.210 ** (0.018) | −0.229 ** (0.034) | 0.9390 | 0.8647 | Kinked |
| 24. India | −1.364 ** (0.145) | −0.037 (0.018) | 0.3497 | 0.9750 | 2004 | −1.717 ** (0.028) | 0.013 ** (0.004) | −0.027 (0.527) | −0.187* (0.058) | −0.200 ** (0.058) | 0.9540 | 0.8782 | Kinked |
| 25. Hong Kong | −1.067 ** (0.168) | −0.171 ** (0.028) | 0.7186 | 0.8882 | 1994 | −1.707 ** (0.367) | 0.006 (0.086) | −1.426 ** (0.245) | −0.112* (0.042) | −0.118 (0.096) | 0.8235 | 0.9256 | Classical |
| 26. Trinidad and Tobago | −21.881 ** (0.158) | −0.103* (0.040) | 0.5539 | 0.9311 | 1999 | −22.210 ** (0.082) | 0.034 (0.028) | −21.624 ** (0.300) | −0.168* (0.074) | −0.203 * (0.079) | 0.8287 | 0.8899 | Kinked |
| 27. Swaziland | −23.391 ** (0.042) | −0.161 ** (0.030) | 0.7224 | 0.8947 | 2003 | −23.408 ** (0.012) | −0.091 ** (0.014) | −23.987 ** (0.469) | 0.122 (0.247) | 0.213 (0.247) | 0.8998 | 1.0885 | Classical |
| 28. New Zealand | −0.422 ** (0.090) | −0.111 ** (0.015) | 0.8979 | 0.9261 | 1999 | −0.678 ** (0.041) | −0.055 ** (0.008) | −0.192 (0.156) | −0.149 ** (0.025) | −0.094 ** (0.026) | 0.9735 | 0.9020 | Kinked |
| 29. Norway | 0.182 (0.187) | −0.138 ** (0.026) | 0.6848 | 0.9089 | 2003 | 0.021 (0.243) | −0.110 ** (0.037) | −1.518 (1.310) | 0.083 (0.171) | 0.193 (0.175) | 0.7485 | 1.0593 | Classical |
| 30. Australia | −0.872 ** (0.014) | −0.051 ** (0.106) | 0.5962 | 0.9650 | 2005 | −1.098 ** (0.0400) | −0.016* (0.006) | −0.265 (0.161) | −0.130 ** (0.020) | −0.114 ** (0.051) | 0.9477 | 0.9136 | Kinked |
| 31. U.S.A. | −0.394* (0.149) | −0.081 ** (0.014) | 0.8889 | 0.9452 | 1997 | −0.898 ** (0.064) | −0.026 ** (0.007) | 0.078 (0.069) | −0.125 ** (0.007) | −0.100 ** (0.009) | 0.9877 | 0.9168 | Kinked |
| 32. Israel | −1.449 ** (0.063) | 0.008 (0.011) | 0.0392 | 1.0056 | 2002 | −1.430 ** (0.110) | 0.003 (0.021) | −0.619 ** (0.162) | −0.121 ** (0.025) | −0.124 ** (0.033) | 0.3740 | 0.9195 | Kinked |
| 33. France | −1.065 ** (0.162) | −0.044* (0.019) | 0.5357 | 0.9700 | 1996 | −1.531 ** (0.034) | 0.021 ** (0.005) | −0.483 ** (0.100) | −0.110 ** (0.012) | −0.132 ** (0.013) | 0.8952 | 0.9263 | Kinked |
| 34. Finland | −0.259 (0.196) | −0.106 ** (0.030) | 0.6204 | 0.9290 | 2005 | −0.531 ** (0.134) | −0.056* (0.022) | −0.313 (2.078) | −0.106 (0.292) | −0.050 (0.293) | 0.8012 | 0.9293 | Classical |
| 35. Uruguay | −21.917 ** (0.168) | −0.102* (0.040) | 0.2035 | 0.9319 | 2004 | −22.178 ** (0.205) | −0.038 (0.057) | −24.568 ** (1.618) | 0.414 (0.324) | 0.453 (0.329) | 0.3740 | 1.3326 | Classical |
| 36. Denmark | −1.226 ** (0.218) | −0.093* (0.036) | 0.2931 | 0.9375 | 1996 | −1.669* (0.727) | −0.004 (0.153) | 0.200 (0.584) | −0.323 ** (0.092) | −0.318 (0.179) | 0.6285 | 0.7997 | Classical |
| 37. Austria | −1.330 ** (0.090) | −0.059 ** (0.015) | 0.6633 | 0.9601 | 2002 | −1.503 ** (0.034) | −0.025 ** (0.006) | −1.170 (0.519) | −0.084 (0.077) | −0.060 (0.077) | 0.8099 | 0.9432 | Classical |
| 38. Belgium | −1.260 ** (0.083) | −0.053 ** (0.013) | 0.5839 | 0.9641 | 2001 | −1.497 ** (0.051) | −0.008 (0.009) | −1.249 ** (0.333) | −0.056 (0.048) | −0.048 (0.049) | 0.8041 | 0.9617 | Classical |
| 39. Colombia | −1.788 ** (0.129) | −0.049* (0.021) | 0.4082 | 0.9668 | 1993 | −1.124 ** (0.322) | −0.239 (0.084) | −1.527 ** (0.145) | −0.090 ** (0.023) | 0.149 (0.088) | 0.7763 | 0.9393 | Classical |
| 40. Japan | −1.585 ** (0.077) | 0.017* (0.008) | 0.2050 | 1.0116 | 2000 | −1.884 ** (0.156) | 0.054* (0.018) | −1.120 ** (0.170) | −0.034* (0.017) | −0.087 ** (0.026) | 0.7696 | 0.9769 | Classical |
| 41. Mexico | −2.180 ** (0.019) | 0.000 ** (0.000) | 0.8537 | 1.0001 | 1995 | −2.230 ** (0.026) | 0.000 (0.000) | −2.124 ** (0.009) | 0.000 ** (0.000) | −0.000 (0.000) | 0.9674 | 1.0001 | Classical |
| 42. Bahamas | −1.703 ** (0.027) | 0.047 ** (0.014) | 0.3678 | 1.0330 | 2007 | −1.737 ** (0.023) | 0.068 ** (0.010) | 1.186 (1.331) | −0.825 (0.392) | −0.893* (0.392) | 0.7425 | 0.5646 | Classical |
| 43. Brazil | −2.254 ** (0.061) | 0.057 ** (0.008) | 0.8176 | 1.0406 | 1997 | −2.011 ** (0.095) | 0.019 (0.015) | −2.211 ** (0.133) | 0.053 ** (0.016) | 0.034 (0.021) | 0.8814 | 1.0372 | Classical |
| 44. Kenya | −2.896 ** (0.021) | 0.057 ** (0.006) | 0.6515 | 1.0406 | 1999 | −2.929 ** (0.069) | 0.075 ** (0.024) | −3.153 ** (0.178) | 0.117* (0.042) | 0.043 (0.048) | 0.7518 | 1.0846 | Classical |
| 45. Morocco | −23.282 ** (0.085) | 0.058 ** (0.017) | 0.4572 | 1.0407 | 1995 | −23.373 ** (0.157) | 0.073 (0.049) | −22.917 ** (0.139) | -0.013 (0.027) | −0.087 (0.056) | 0.7084 | 0.9908 | Classical |
| 46. Cyprus | −2.042 ** (0.051) | 0.061 ** (0.014) | 0.5516 | 1.0428 | 1995 | −2.011 ** (0.033) | 0.075 ** (0.026) | −2.324 ** (0.049) | 0.137 ** (0.012) | 0.062 (0.030) | 0.9152 | 1.0998 | Classical |
| 47. Kuwait | −1.968 ** (0.130) | 0.067* (0.024) | 0.4558 | 1.0472 | 2005 | −2.065 ** (0.261) | 0.090 (0.051) | −3.733 ** (0.869) | 0.343 (0.139) | 0.253 (0.148) | 0.6283 | 1.2683 | Classical |
| 48. Portugal | −2.305 ** (0.081) | 0.075 ** (0.015) | 0.7145 | 1.0530 | 2007 | −2.277 ** (0.078) | 0.069 ** (0.014) | −6.448* (1.964) | 0.704 (0.297) | 0.635* (0.298) | 0.8478 | 1.6286 | Classical |
| 49. Chile | −2.204 ** (0.131) | 0.077 ** (0.022) | 0.7462 | 1.0546 | 1999 | −1.913 ** (0.221) | 0.020 (0.046) | −1.938 ** (0.036) | 0.036 (0.027) | 0.017 (0.053) | 0.8923 | 1.0255 | Classical |
| 50. Sri Lanka | −2.975 ** (0.064) | 0.077 ** (0.017) | 0.6439 | 1.0548 | 2005 | −3.046 ** (0.104) | 0.102 ** (0.028) | −1.431 (0.690) | −0.255 (0.143) | −0.357* (0.146) | 0.8216 | 0.8379 | Classical |
| 51. Jordan | −2.020 ** (0.042) | 0.081 ** (0.010) | 0.8435 | 1.0578 | 2007 | −1.986 ** (0.039) | 0.069 ** (0.011) | −0.999* (0.239) | −0.120 (0.049) | −0.189 ** (0.050) | 0.9037 | 0.9203 | Classical |
| 52. Nicaragua | −22.973 ** (0.033) | 0.083 ** (0.012) | 0.6595 | 1.0589 | 2002 | −22.895 ** (0.057) | 0.035 (0.024) | −22.899 ** (0.300) | 0.068 (0.085) | 0.033 (0.088) | 0.7868 | 1.0483 | Classical |
| 53. Philippines | −23.331 ** (0.108) | 0.087 ** (0.019) | 0.6051 | 1.0623 | 2005 | −23.587 ** (0.157) | 0.142 ** (0.028) | −21.936 ** (0.515) | −0.132 (0.077) | −0.275 ** (0.082) | 0.9001 | 0.9123 | Classical |
| 54. Dominican Republic | −2.450 ** (0.087) | 0.089 ** (0.026) | 0.3591 | 1.0633 | 2002 | −2.555 ** (0.109) | 0.119 ** (0.032) | 0.482 ** (0.509) | −0.510 (0.102) | −0.628 ** (0.107) | 0.8744 | 0.7024 | Classical |
| 55. Spain | −2.300 ** (0.101) | 0.073 ** (0.013) | 0.8723 | 1.0515 | 1996 | −1.933 ** (0.063) | 0.011 (0.010) | −2.473 ** (0.080) | 0.095 ** (0.010) | 0.084 ** (0.014) | 0.9492 | 1.0679 | Kinked |
| 56. Thailand | −23.265 ** (0.045) | 0.099 ** (0.007) | 0.9014 | 1.0708 | 1998 | −23.272 ** (0.118) | 0.097 ** (0.021) | −22.726 ** (0.124) | 0.023 (0.018) | −0.074* (0.028) | 0.9700 | 1.0163 | Classical |
| 57. Netherlands | −1.840 ** (0.063) | −0.024* (0.011) | 0.1769 | 0.9837 | 1999 | −1.8880 ** (0.091) | -0.012 (0.016) | −2.750 ** (0.212) | 0.103 ** (0.031) | 0.116 ** (0.035) | 0.6489 | 1.0742 | Kinked |
| 58. Indonesia | −3.757 ** (0.222) | 0.164 ** (0.032) | 0.7854 | 1.1207 | 1998 | −2.966 ** (0.130) | -0.001 (0.028) | −3.324 ** (0.239) | 0.107 ** (0.033) | 0.107* (0.044) | 0.9678 | 1.0766 | Kinked |
| 59. China | −1.106 ** (0.159) | −0.008 (0.017) | 0.0179 | 0.9944 | 1998 | −0.594 ** (0.181) | -0.071 ** (0.023) | −2.260 ** (0.136) | 0.109 ** (0.014) | 0.180 ** (0.027) | 0.8337 | 1.0787 | Kinked |
| 60. Korea, South | −2.214 ** (0.059) | 0.121 ** (0.007) | 0.9393 | 1.0878 | 1994 | −1.951 ** (0.115) | 0.066 ** (0.021) | −2.026 ** (0.052) | 0.098 ** (0.006) | 0.032 (0.022) | 0.9693 | 1.0701 | Classical |
| 61. Mauritius | −23.169 ** (0.067) | 0.126 ** (0.023) | 0.6691 | 1.0913 | 2000 | −23.066 ** (0.032) | 0.010 (0.034) | −22.799 ** (0.100) | 0.017 (0.032) | 0.006 (0.046) | 0.9128 | 1.0115 | Classical |
| 62. Saudi Arabia | −23.500 ** (0.079) | 0.135 ** (0.012) | 0.9140 | 1.0980 | 2004 | −23.683 ** (0.131) | 0.167 ** (0.020) | −22.967 ** (0.392) | 0.062 (0.052) | −0.105 (0.056) | 0.9618 | 1.0440 | Classical |
| 63. Bolivia | −2.629 ** (0.067) | 0.017 ** (0.019) | 0.9100 | 1.0121 | 1994 | −2.424 ** (0.000) | −0.028 ** (0.000) | −2.704 ** (0.030) | 0.128 ** (0.009) | 0.156 ** (0.009) | 0.9695 | 1.0927 | Kinked |
| 64. Egypt | −2.634 ** (0.150) | 0.114 ** (0.023) | 0.7946 | 1.0825 | 2000 | −2.168 ** (0.060) | 0.021 (0.012) | −2.789 ** (0.171) | 0.140 ** (0.025) | 0.119 ** (0.028) | 0.8302 | 1.1017 | Kinked |
| 65. Djibouti | −2.174 ** (0.018) | 0.141 ** (0.023) | 0.8027 | 1.1024 | 2005 | −2.199 ** (0.009) | 0.085 ** (0.012) | −2.067 ** (0.149) | 0.099 (0.119) | 0.014 ** (0.120) | 0.9518 | 1.0709 | Classical |
| 66. Senegal | −23.560 ** (0.061) | 0.141 ** (0.022) | 0.8616 | 1.1027 | 2001 | −23.461 ** (0.015) | 0.057 ** (0.009) | −23.539 ** (0.058) | 0.143 ** (0.017) | 0.086 ** (0.020) | 0.9852 | 1.1041 | Kinked |
| 67. Ecuador | −2.845 ** (0.109) | 0.144 ** (0.024) | 0.8394 | 1.1051 | 2007 | −2.720 ** (0.080) | 0.108 ** (0.019) | −2.098 (0.863) | 0.018 (0.160) | 0.018 (0.160) | 0.9433 | 1.0123 | Classical |
| 68. Turkey | −2.952 ** (0.066) | 0.148 ** (0.009) | 0.9726 | 1.1080 | 1999 | −2.828 ** (0.105) | 0.123 ** (0.018) | −2.761 ** (0.083) | 0.123 ** (0.011) | −0.001 (0.021) | 0.9844 | 1.0888 | Classical |
| 69. Barbados | 1.860 ** (0.031) | 0.148 ** (0.015) | 0.9341 | 1.1083 | 2001 | −1.836 ** (0.009) | 0.099 ** (0.009) | -1.783 ** (0.068) | 0.124 ** (0.029) | 0.024 (0.030) | 0.9845 | 1.0896 | Classical |
| 70. Bahrain | 0.114 ** (0.020) | −2.021 ** (0.080) | 0.8735 | 0.2463 | 1998 | −1.829 ** (0.020) | 0.039 ** (0.008) | -2.264 ** (0.084) | 0.173 ** (0.020) | 0.134 ** (0.021) | 0.9696 | 1.1273 | Kinked |
| 71. Ghana | −1.064 ** (0.161) | −0.209 ** (0.038) | 0.6796 | 0.8652 | 2003 | −1.240 ** (0.174) | -0.149* (0.051) | -2.911 ** (0.329) | 0.174* (0.068) | 0.323 ** (0.085) | 0.7933 | 1.1280 | Kinked |
| 72. Guatemala | −3.319 ** (0.164) | 0.211 ** (0.041) | 0.8051 | 1.1572 | 1999 | −2.936 ** (0.117) | 0.029 (0.051) | -3.129 ** (0.175) | 0.174 ** (0.041) | 0.145* (0.065) | 0.9459 | 1.1280 | Kinked |
| 73. Iran | −3.159 ** (0.089) | 0.179 ** (0.013) | 0.9565 | 1.1322 | 1999 | −2.927 ** (0.109) | 0.134 ** (0.019) | -2.856 ** (0.177) | 0.139 ** (0.024) | 0.006 (0.031) | 0.9809 | 1.1014 | Classical |
| 74. Honduras | −2.286 ** (0.149) | 0.150 ** (0.040) | 0.7584 | 1.1096 | 1996 | −1.847 ** (0.139) | -0.107 (0.068) | -2.432 ** (0.076) | 0.192 ** (0.020) | 0.299 ** (0.071) | 0.9609 | 1.1420 | Kinked |
| 75. Brunei | −2.931 ** (0.063) | 0.208 ** (0.020) | 0.9463 | 1.1554 | 1995 | −2.831 ** (0.113) | 0.096 (0.079) | -2.906 ** (0.671) | 0.202 ** (0.020) | 0.016 (0.082) | 0.9650 | 1.1503 | Classical |
| 76. Nepal | −24.215 ** (0.126) | 0.186 ** (0.044) | 0.7673 | 1.1374 | 1999 | −24.024 ** (0.084) | 0.003 (0.055) | −24.298 ** (0.129) | 0.222 ** (0.040) | 0.219 ** (0.068) | 0.9294 | 1.1660 | Kinked |
| 77. Tunisia | −23.032 ** (0.044) | 0.072 ** (0.011) | 0.7163 | 1.0515 | 2007 | −23.145 ** (0.085) | 0.098 ** (0.020) | −24.100 ** (0.339) | 0.261* (0.064) | 0.163* (0.067) | 0.9092 | 1.1982 | Kinked |
| 78. Cote d’Ivoire | −3.323 ** (0.088) | 0.263 ** (0.024) | 0.9475 | 1.2001 | 2002 | −3.372 ** (0.163) | 0.284 ** (0.056) | −2.379 ** (0.185) | 0.034 (0.045) | −0.250 ** (0.072) | 0.9682 | 1.0241 | Classical |
| 79. Gabon | −3.080 ** (0.079) | 0.129 ** (0.023) | 0.7244 | 1.0932 | 1999 | −2.936 ** (0.047) | 0.008 (0.027) | −3.472 ** (0.080) | 0.268 ** (0.029) | 0.260 ** (0.040) | 0.9597 | 1.2041 | Kinked |
| 80. United Arab Emirates | −24.183 ** (0.213) | 0.242 ** (0.037) | 0.9060 | 1.1828 | 1995 | −23.241 ** (0.057) | -0.016 (0.015) | −24.475 ** (0.152) | 0.292 ** (0.026) | 0.308 ** (0.030) | 0.9634 | 1.2240 | Kinked |
| 81. El Salvador | −2.721 ** (0.061) | 0.147 ** (0.018) | 0.8566 | 1.1070 | 2000 | −2.682 ** (0.089) | 0.135 ** (0.033) | −3.473 ** (0.136) | 0.334 ** (0.035) | 0.199 ** (0.048) | 0.9460 | 1.2602 | Kinked |
| 82. Bangladesh | −3.452 ** (0.213) | 0.188 ** (0.052) | 0.7766 | 1.1389 | 1997 | −2.845 ** (0.012) | 0.012 ** (0.004) | −4.316 ** (0.063) | 0.352 ** (0.013) | 0.340 ** (0.013) | 0.9805 | 1.2762 | Kinked |
| 83. Vietnam | −24.070 ** (0.221) | 0.271 ** (0.040) | 0.9212 | 1.2066 | 1995 | −23.350 ** (0.335) | 0.060 (0.096) | −24.631 ** (0.079) | 0.369 ** (0.013) | 0.309 ** (0.097) | 0.9929 | 1.2915 | Kinked |
| 84. Fiji | −2.295 ** (0.052) | 0.053 (0.030) | 0.3199 | 1.0375 | 2005 | −2.252 ** (0.020) | -0.010 (0.014) | −2.995 ** (0.190) | 0.371 ** (0.079) | 0.381 ** (0.080) | 0.9274 | 1.2930 | Kinked |
| 85. Malaysia | −23.227 ** (0.101) | 0.116 ** (0.017) | 0.8225 | 1.0834 | 2005 | −23.283 ** (0.164) | 0.128 ** (0.028) | −25.153 ** (0.060) | 0.388 ** (0.074) | 0.260 ** (0.079) | 0.8847 | 1.3083 | Kinked |
| 86. Oman | −23.999 ** (0.179) | 0.222 ** (0.041) | 0.8558 | 1.1660 | 1998 | −23.571 ** (0.031) | 0.068 ** (0.009) | −24.778 ** (0.128) | 0.389 ** (0.027) | 0.321 ** (0.029) | 0.9873 | 1.3097 | Kinked |
| 87. Yemen | −24.280 ** (0.153) | 0.169 ** (0.046) | 0.6891 | 1.1243 | 1998 | −23.961 ** (0.011) | 0.003 (0.010) | −25.112 ** (0.098) | 0.395 ** (0.027) | 0.392 ** (0.028) | 0.9642 | 1.3150 | Kinked |
| 88. Bermuda | −1.588 ** (0.015) | −0.054 ** (0.010) | 0.6805 | 0.9636 | 2007 | −1.582 ** (0.020) | −0.060 ** (0.013) | −2.707 ** (0.223) | 0.418* (0.091) | 0.478 ** (0.092) | 0.8290 | 1.3359 | Kinked |
| 89. Cameroon | −2.702 ** (0.048) | 0.060 ** (0.018) | 0.2972 | 1.0421 | 2002 | −2.596 ** (0.056) | 0.020 (0.020) | −4.216 ** (0.316) | 0.437 ** (0.080) | 0.418 ** (0.082) | 0.8230 | 1.3538 | Kinked |
| 90. Mozambique | −22.725 ** (0.041) | 0.705 ** (0.025) | 0.9719 | 1.6304 | 1999 | −22.814 ** (0.048) | 0.607 ** (0.062) | −20.559 ** (0.680) | −0.134 (0.257) | −0.741* (0.265) | 0.9116 | 0.9913 | Classical |
| 91. Luxembourg | −4.936 ** (0.408) | 0.778 ** (0.168) | 0.5233 | 1.7146 | 2001 | −5.046 ** (0.514) | −0.712 (1.160) | −3.658* (1.320) | 0.283 (0.462) | 0.995 (1.249) | 0.8456 | 1.2169 | Classical |
References
- International Energy Agency. Key World Energy Statistics 2020. Available online: https://www.iea.org/reports/key-world-energy-statistics-2020/final-consumption (accessed on 10 February 2021).
- International Energy Agency. Sankey Diagram. Available online: https://www.iea.org/sankey/ #?c=World&s=Balance (accessed on 10 February 2021).
- The World Bank. Electric Power Consumption. Available online: https://data.worldbank.org/indicator/EG.USE.ELEC.KH.PC (accessed on 10 February 2021).
- IEA. World Energy Outlook 2019; IEA: Paris, France, 2019; Available online: https://www.iea.org/reports/world-energy-outlook-2019 (accessed on 10 February 2021).
- International Energy Outlook. Report DOE/EIA-0484; US Energy Information Administration: Washington, DC, USA, 2016. [Google Scholar]
- Gallo, L. Electricity Intensity in the Developed Countries: Global Divergence, Club Convergence and the Role of the Structure of the Economy. 2019. Available online: https://fsr.eui.eu/wp-content/uploads/2020/03/Gallo-FSR-CLIMATE-2019-Electricity-intensity-convergence.pdf (accessed on 15 December 2020).
- Sustainable Development Goals-SDGs-the United Nations. Available online: https://sdgs.un.org/goals (accessed on 13 April 2021).
- Herrerias, M.J.; Liu, G. Electricity intensity across Chinese provinces: New evidence on convergence and threshold effects. Energy Econ. 2013, 36, 268–276. [Google Scholar] [CrossRef]
- Herrerias, M.J. Seasonal anomalies in electricity intensity across Chinese regions. Appl. Energy 2013, 112, 1548–1557. [Google Scholar] [CrossRef]
- Kwon, S.; Cho, S.-H.; Roberts, R.K.; Kim, H.J.; Park, K.; Yu, T.E. Short-run and the long-run effects of electricity price on electricity intensity across regions. Appl. Energy 2016, 172, 372–382. [Google Scholar] [CrossRef]
- Gutiérrez-Pedrero, M.J.; Tarancón, M.A.; del Río, P.; Alcántara, V. Analysing the drivers of the electricity consumption of non-residential sectors in Europe. Appl. Energy 2018, 211, 743–754. [Google Scholar] [CrossRef]
- Kim, Y.S. Electricity consumption and economic development: Are countries converging to a common trend? Energy Econ. 2015, 49, 192–202. [Google Scholar] [CrossRef]
- Inglesi-Lotz, R.; Blignaut, J.N. Electricity intensities of the OECD and South Africa: A comparison. Renew. Sustain. Energy Rev. 2012, 16, 4491–4499. [Google Scholar] [CrossRef] [Green Version]
- Hien, P.D. Excessive electricity intensity of Vietnam: Evidence from a comparative study of Asia-Pacific countries. Energy Policy 2019, 130, 409–417. [Google Scholar] [CrossRef]
- Liddle, B. Electricity intensity convergence in IEA/OECD countries: Aggregate and sectoral analysis. Energy Policy 2009, 37, 1470–1478. [Google Scholar] [CrossRef]
- Fernández González, P.; Pérez Suárez, R. Decomposing the variation of aggregate electricity intensity in Spanish industry. Energy 2003, 28, 171–184. [Google Scholar] [CrossRef]
- Vaona, A. The sclerosis of regional electricity intensities in Italy: An aggregate and sectoral analysis. Appl. Energy 2013, 104, 880–889. [Google Scholar] [CrossRef] [Green Version]
- Wenzel, L.; Wolf, A. Changing patterns of electricity usage in European manufacturing: A decomposition analysis. Int. J. Energy Econ. Policy 2014, 4, 516–530. [Google Scholar]
- Verbruggen, A. Electricity intensity backstop level to meet sustainable backstop supply technologies. Energy Policy 2006, 34, 1310–1317. [Google Scholar] [CrossRef]
- Horowitz, M.J. Electricity intensity in the commercial sector: Market and public program effects. Energy J. 2004, 25, 115–137. [Google Scholar] [CrossRef]
- Ullah, A.; Neelum, Z.; Jebeen, S. Factors behind electricity intensity and efficiency: An econometric analysis for Pakistan. Energy Strategy Rev. 2019, 26, 1–9. [Google Scholar] [CrossRef]
- Wright, T.P. Factors affecting the cost of airplanes. J. Aeronaut. Sci. 1936, 3, 122–128. [Google Scholar] [CrossRef]
- Boston Consulting Group (BCG). Perspectives on Experience; Boston Consulting Group: Boston, MA, USA, 1968. [Google Scholar]
- McDonald, A.; Schrattenholzer, L. Learning rates for energy technologies. Energy Policy 2001, 29, 255–261. [Google Scholar] [CrossRef] [Green Version]
- Junginger, M.; Lako, P.; Lensink, S.; van Sark, W.; Weiss, M. Technological Learning in the Energy Sector. Climate Change Scientific Assessment and Policy Analysis, Report; Environmental Assessment Agency: Bilthoven, The Netherlands, 2008. [Google Scholar]
- Kahouli-Brahmi, S. Technological learning in energy-environment-economy modeling: A survey. Energy Policy 2008, 36, 138–162. [Google Scholar] [CrossRef]
- Weiss, M.; Junginger, M.; Patel, M.K.; Blok, K. A review of experience curve analyses for energy demand technologies. Technol. Forecast. Soc. Chang. 2010, 77, 411–428. [Google Scholar] [CrossRef]
- Rosenberg, N. Inside the Black Box: Technology and Economics; Cambridge University Press: Cambridge, UK, 1986. [Google Scholar]
- Sagar, A.; Van der Zwaan, B.C.C. Technological innovation in the energy sector: R&D, deployment and learning-by-doing. Energy Policy 2006, 34, 2601–2608. [Google Scholar]
- Rotmans, J.; Kemp, R. Managing societal transitions: Dilemmas and uncertainties, the Dutch energy case study. In Proceedings of the OECD Workshop on the Benefits of Climate Policy, Improving Information for Policy Makers, Paris, France, 12 September 2003. [Google Scholar]
- Rout, U.K.; Blesl, M.; Fahl, U.; Remme, U.; VoB, A. Uncertainty in the learning rates of energy technologies: An experiment in a global multi-regional energy system model. Energy Policy 2009, 37, 4927–4942. [Google Scholar] [CrossRef]
- Nakicenovic, N. Climate Change: Integrating Science, Economics and Policy; International Institute for Applied Systems Analysis: Laxenburg, Austria, 1996. [Google Scholar]
- International Energy Agency (IEA). Experience Curves for Energy Technology Policy. 2000. Available online: https://www.researchgate.net/publication/239982502_Experience_Curves_for_Energy_Technology_Policy (accessed on 12 December 2020).
- Grubler, A. The costs of the French nuclear scale-up: A case of negative learning by doing. Energy Policy 2010, 38, 5174–5188. [Google Scholar] [CrossRef]
- Kouvaritakis, N.; Soria, A.; Isoard, S. Modeling energy technology dynamics: Methodology for adaptive expectations models with learning by doing and learning by searching. Int. J. Glob. Energy 2000, 14, 104–115. [Google Scholar] [CrossRef]
- Trappey, A.J.C.; Trappey, C.V.; Liu, P.H.Y.; Lin, L.-C.; Ou, J.J.R. A hierarchical cost learning model for developing wind energy infrastructures. Int. J. Prod. Econ. 2013, 146, 386–391. [Google Scholar] [CrossRef]
- McDowall, W. Endogenous Technology Learning for Hydrogen and Fuel Cell Technology; University College London: London, UK, 2012. [Google Scholar]
- Neij, L.; Borup, M.; Blesl, M.; Mayer-Spohn, O. Cost Development—An Analysis Based on Experience Curves; Lund University: Lund, Sweden, 2006. [Google Scholar]
- Van Sark, W. Introducing errors in progress ratios determined from experience curves. Technol. Forecast. Soc. Chang. 2008, 75, 405–415. [Google Scholar] [CrossRef] [Green Version]
- Chang, Y.; Lee, J.; Yoon, H. Alternative projection of the world energy consumption-In comparison with the 2010 international energy outlook. Energy Policy 2012, 50, 154–160. [Google Scholar] [CrossRef]
- Wei, M.; Smith, S.J.; Sohn, M.D. Experience curve development and cost reduction disaggregation for fuel cell markets in Japan and the US. Appl. Energy 2017, 191, 346–357. [Google Scholar] [CrossRef] [Green Version]
- Wei, M.; Smith, S.J.; Sohn, M.D. Non-constant learning rates in retrospective experience curve analyses and their correlation to deployment programs. Energy Policy 2017, 107, 356–369. [Google Scholar] [CrossRef] [Green Version]
- Chang, Y.S.; Lee, J. Kinked Experience Curve. SSRN Electron. J. 2013, 1358–1413. [Google Scholar] [CrossRef] [Green Version]
- International Energy Statistics. In Total Electricity Net Generation; 2011. Available online: http://www.eia.gov/beta/international/analysis.cfm (accessed on 21 March 2013).
- World Bank. GDP, PPP, International Comparison Program Database. Available online: http://data.worldbank.org/indicator/NY.GDP.MKTP.PP.KD?start=1991&year_low_desc=false (accessed on 22 September 2013).
- Alberth, S. Forecasting technology costs via the experience curve-Myth or magic? Technol. Forecast. Soc. Chang. 2008, 75, 952–983. [Google Scholar] [CrossRef]
- Kim, D.W.; Chang, H.J. Experience curve analysis on South Korean nuclear technology and comparative analysis with South Korean renewable technologies. Energy Policy 2012, 40, 361–373. [Google Scholar] [CrossRef]
- Nagy, B.; Farmer, J.D.; Bui, Q.M.; Trancik, J.E. Statistical basis for predicting technologies progress. PLoS ONE 2013, 8, e52669. [Google Scholar] [CrossRef] [Green Version]
- Lafond, F.; Bailey, A.G.; Bakker, J.D.; Rebois, D.; Zadourian, R.; McSharry, P.; Farmer, J.D. How well do experience curves predict technological progress? A method for making distributional forecasts. Technol. Forecast. Soc. Chang. 2018, 128, 104–117. [Google Scholar] [CrossRef] [Green Version]
- Farmer, J.D.; Lafond, F. How predictable technological progress? Res. Policy 2016, 45, 647–665. [Google Scholar] [CrossRef] [Green Version]
- Neij, L. Cost development of future technologies for power generation—A study based on experience curves and complementary bottom-up assessments. Energy Policy 2008, 36, 2200–2211. [Google Scholar] [CrossRef]
- Chang, Y.S.; You, B.-J.; Kim, H.E. Dynamic Trends of Fine Particulate Matter Exposure across 190 Countries: Analysis and Key Insights. Sustainability 2020, 12, 2910. [Google Scholar] [CrossRef] [Green Version]
- US Census Bureau. Available online: https://www.census.gov/data-tools/demo/idb/#/table?YR_ANIM=2021&FIPS_SINGLE=**&dashPages=DASH (accessed on 2 March 2020).
- World Bank. GDP, PPP, International Comparison Program Database. Available online: https://data.worldbank.org/indicator/NY.GDP.MKTP.PP.KD?start=1991&year_low_desc=false (accessed on 15 December 2020).
- Nuclear Engineering International. Only One Power Reactor Remains in Operation in Japan. 10 November 2020. Available online: https://www.neimagazine.com/news/newsonly-one-power-reactor-remains-in-operation-in-japan-8354484 (accessed on 5 January 2021).
- Shearer, C.; Ghio, N.; Myllyvirta, L.; Nace, T. Boom and bust: Trackgin the global coal plant pipeline. 2015. Available online: https://endcoal.org/wp-content/uploads/2015/05/BoomBustMarch16embargoV8.pdf (accessed on 10 January 2021).
- Wiesentahal, T.; Dowling, P.; Morbee, J.; Thiel, C.; Schade, B.; Russ, P.; Simoes, S.; Peteves, S.; Schoots, K.; Londo, M. Technology Learning Curves for Energy Policy Support; JRC Scientific and Policy Reports; Joint Research Center, European Commission: Brussels, Belgium, 2012. [Google Scholar]
- Witajewski-Baltvilks, J.; Verdolini, E.; Tavoni, M. Bending the learning curve. Energy Econ. 2015, 52, S86–S99. [Google Scholar] [CrossRef] [Green Version]
- Dinda, S. Environmental Kuznets cruve hypothesis: A survey. Ecol. Econ. 2004, 49, 431–455. [Google Scholar] [CrossRef] [Green Version]
- Stern, D.I. The rise and fall of the environmental Kuznets curve. World Dev. 2004, 32, 1419–1439. [Google Scholar] [CrossRef]
- Ang, J.B. CO2 emissions, energy consumption and output in France. Energy Policy 2007, 35, 4772–4778. [Google Scholar] [CrossRef]
- Apergis, N.; Payne, J. CO2 emissions, energy usage and output in Central America. Energy Policy 2009, 37, 3282–3286. [Google Scholar] [CrossRef]
- Apergis, N.; Payne, J. The emissions, energy consumption and growth nexus: Evidence from the Commonwealth of Independent States. Energy Policy 2010, 38, 650–655. [Google Scholar] [CrossRef]
- Lean, H.H.; Smyth, R. CO2 emissions, electricity consumption and output in ASEAN. Appl. Energy 2010, 87, 1858–1864. [Google Scholar] [CrossRef]


| Geographical Scope | Time Period | Method | Main Findings | |
|---|---|---|---|---|
| Hien [14] | Vietnam and 22 Asia-Pacific Economies | 1995–2014 | Comparative analysis | An inverted U-curve relationship between EI and per capita GDP |
| Ullah et al. [21] | Pakistan | 1972–2012 | Econometric analysis (ARDL model) | Electricity price (no effect), per capita income (−), education (+) |
| Gutiérrez-Pedrero et al. [11] | 18 European Union countries | 1995–2011 | Econometric analysis (Panel data model) | Positive relationship: technological progress, retail price Negative relationship: accumulated stock of physical capital, lagged gross fixed capital formation |
| Kwon et al. [10] | South Korea (16 regions) | 2004–2014 (monthly) | Econometric analysis (Panel data model) | Positive relationship: electricity price in the long run, not in the short run |
| Kim [12] | 109 countries | 1971–2009 | Convergence analysis | Convergence found (OECD countries and Asia, in particular) |
| Wenzel and Wolf [18] | 20 European countries | 2000–2011 | Decomposition analysis | EI increases more by intensity effects than by structural effects |
| Herrerias [9] | China | 2003–2009 (monthly) | Convergence analysis | Seasonality effect |
| Herrerias and Liu [8] | China | 2003–2009 | Convergence analysis | Overall regional convergence and convergence within clubs |
| Vaona [17] | Italy | 1997–2007 | Econometric analysis (Panel data model) | EI increased; geographical difference evidenced |
| Inglesi-Lots and Blignaut [13] | South Africa and OECD countries | 1990–2007 | Comparative analysis | South Africa’s EI was more than doubled and was much higher than the OECD members’ EI |
| Liddle [15] | 22 OECD countries | 1960–2006 | Convergence analysis | Convergence among sample countries detected with commercial, industry, and residential EIs showing different patterns |
| Verbruggen [19] | 14 high income OECD countries | 1997 | Econometric analysis (Hyperbolic function) | Negative relationship: price |
| Horowitz [20] | U.S. (42 states) | 1989–2001 | Econometric analysis (Panel data model) | Positive relationship: energy efficiency public programs |
| Fernández and Pérez [16] | Spain | 1979–1992 | Decomposition analysis | EI increases more by intensity effects than by structural effects |
| All | Increasing Trend | Decreasing Trend | ||||||||||
|---|---|---|---|---|---|---|---|---|---|---|---|---|
| Countries | Mean | SD | CV | Countries | Mean | SD | CV | Countries | Mean | SD | CV | |
| High Income | 39 | 100.05 | 18.03 | 0.18 | 17 | 115.44 | 17.01 | 0.15 | 22 | 88.15 | 6.78 | 0.08 |
| Upper Middle Income | 22 | 99.72 | 18.95 | 0.19 | 14 | 111.90 | 9.06 | 0.08 | 8 | 78.40 | 10.42 | 0.13 |
| Lower Middle Income | 24 | 105.40 | 19.60 | 0.19 | 18 | 114.86 | 9.52 | 0.08 | 6 | 77.03 | 13.10 | 0.17 |
| Low Income | 6 | 101.89 | 36.82 | 0.36 | 2 | 147.27 | 22.30 | 0.15 | 4 | 79.20 | 5.84 | 0.07 |
| Total | 91 | 101.50 | 20.11 | 0.20 | 51 | 115.51 | 14.10 | 0.12 | 40 | 83.64 | 9.74 | 0.12 |
| All | Increasing Trend | Decreasing Trend | ||||||||||
|---|---|---|---|---|---|---|---|---|---|---|---|---|
| Countries | Mean | SD | CV | Countries | Mean | SD | CV | Countries | Mean | SD | CV | |
| EAP | 15 | 104.46 | 17.2 | 0.17 | 9 | 115.83 | 10.8 | 0.09 | 6 | 87.41 | 7.77 | 0.09 |
| ECANA | 19 | 100.23 | 21.73 | 0.22 | 7 | 119.95 | 24.88 | 0.2 | 12 | 88.73 | 6.57 | 0.07 |
| LAC | 19 | 99.08 | 16.12 | 0.16 | 12 | 109.06 | 6.77 | 0.06 | 7 | 81.97 | 12.46 | 0.15 |
| MENA | 16 | 106.61 | 16.73 | 0.16 | 12 | 114.62 | 9.51 | 0.08 | 4 | 82.57 | 6.37 | 0.08 |
| SA | 5 | 103.59 | 19.59 | 0.19 | 3 | 116.57 | 11.07 | 0.1 | 2 | 84.12 | 5.23 | 0.01 |
| SSA | 17 | 97.61 | 27.83 | 0.29 | 8 | 121.91 | 19.18 | 0.16 | 9 | 76.02 | 10.59 | 0.14 |
| Total | 91 | 101.5 | 20.11 | 0.20 | 51 | 115.51 | 14.1 | 0.12 | 40 | 83.64 | 9.74 | 0.12 |
| Kinked Subgroup | Classical Subgroup | Total Group | ||
|---|---|---|---|---|
| Decreasing | Average PR | 81.72% | 87.63% | 83.64% |
| # of countries | 27 | 13 | 40 | |
| Increasing | Average PR | 119.40% | 112.05% | 115.51% |
| # of countries | 24 | 27 | 51 | |
| # of countries | 51 | 40 | 91 | |
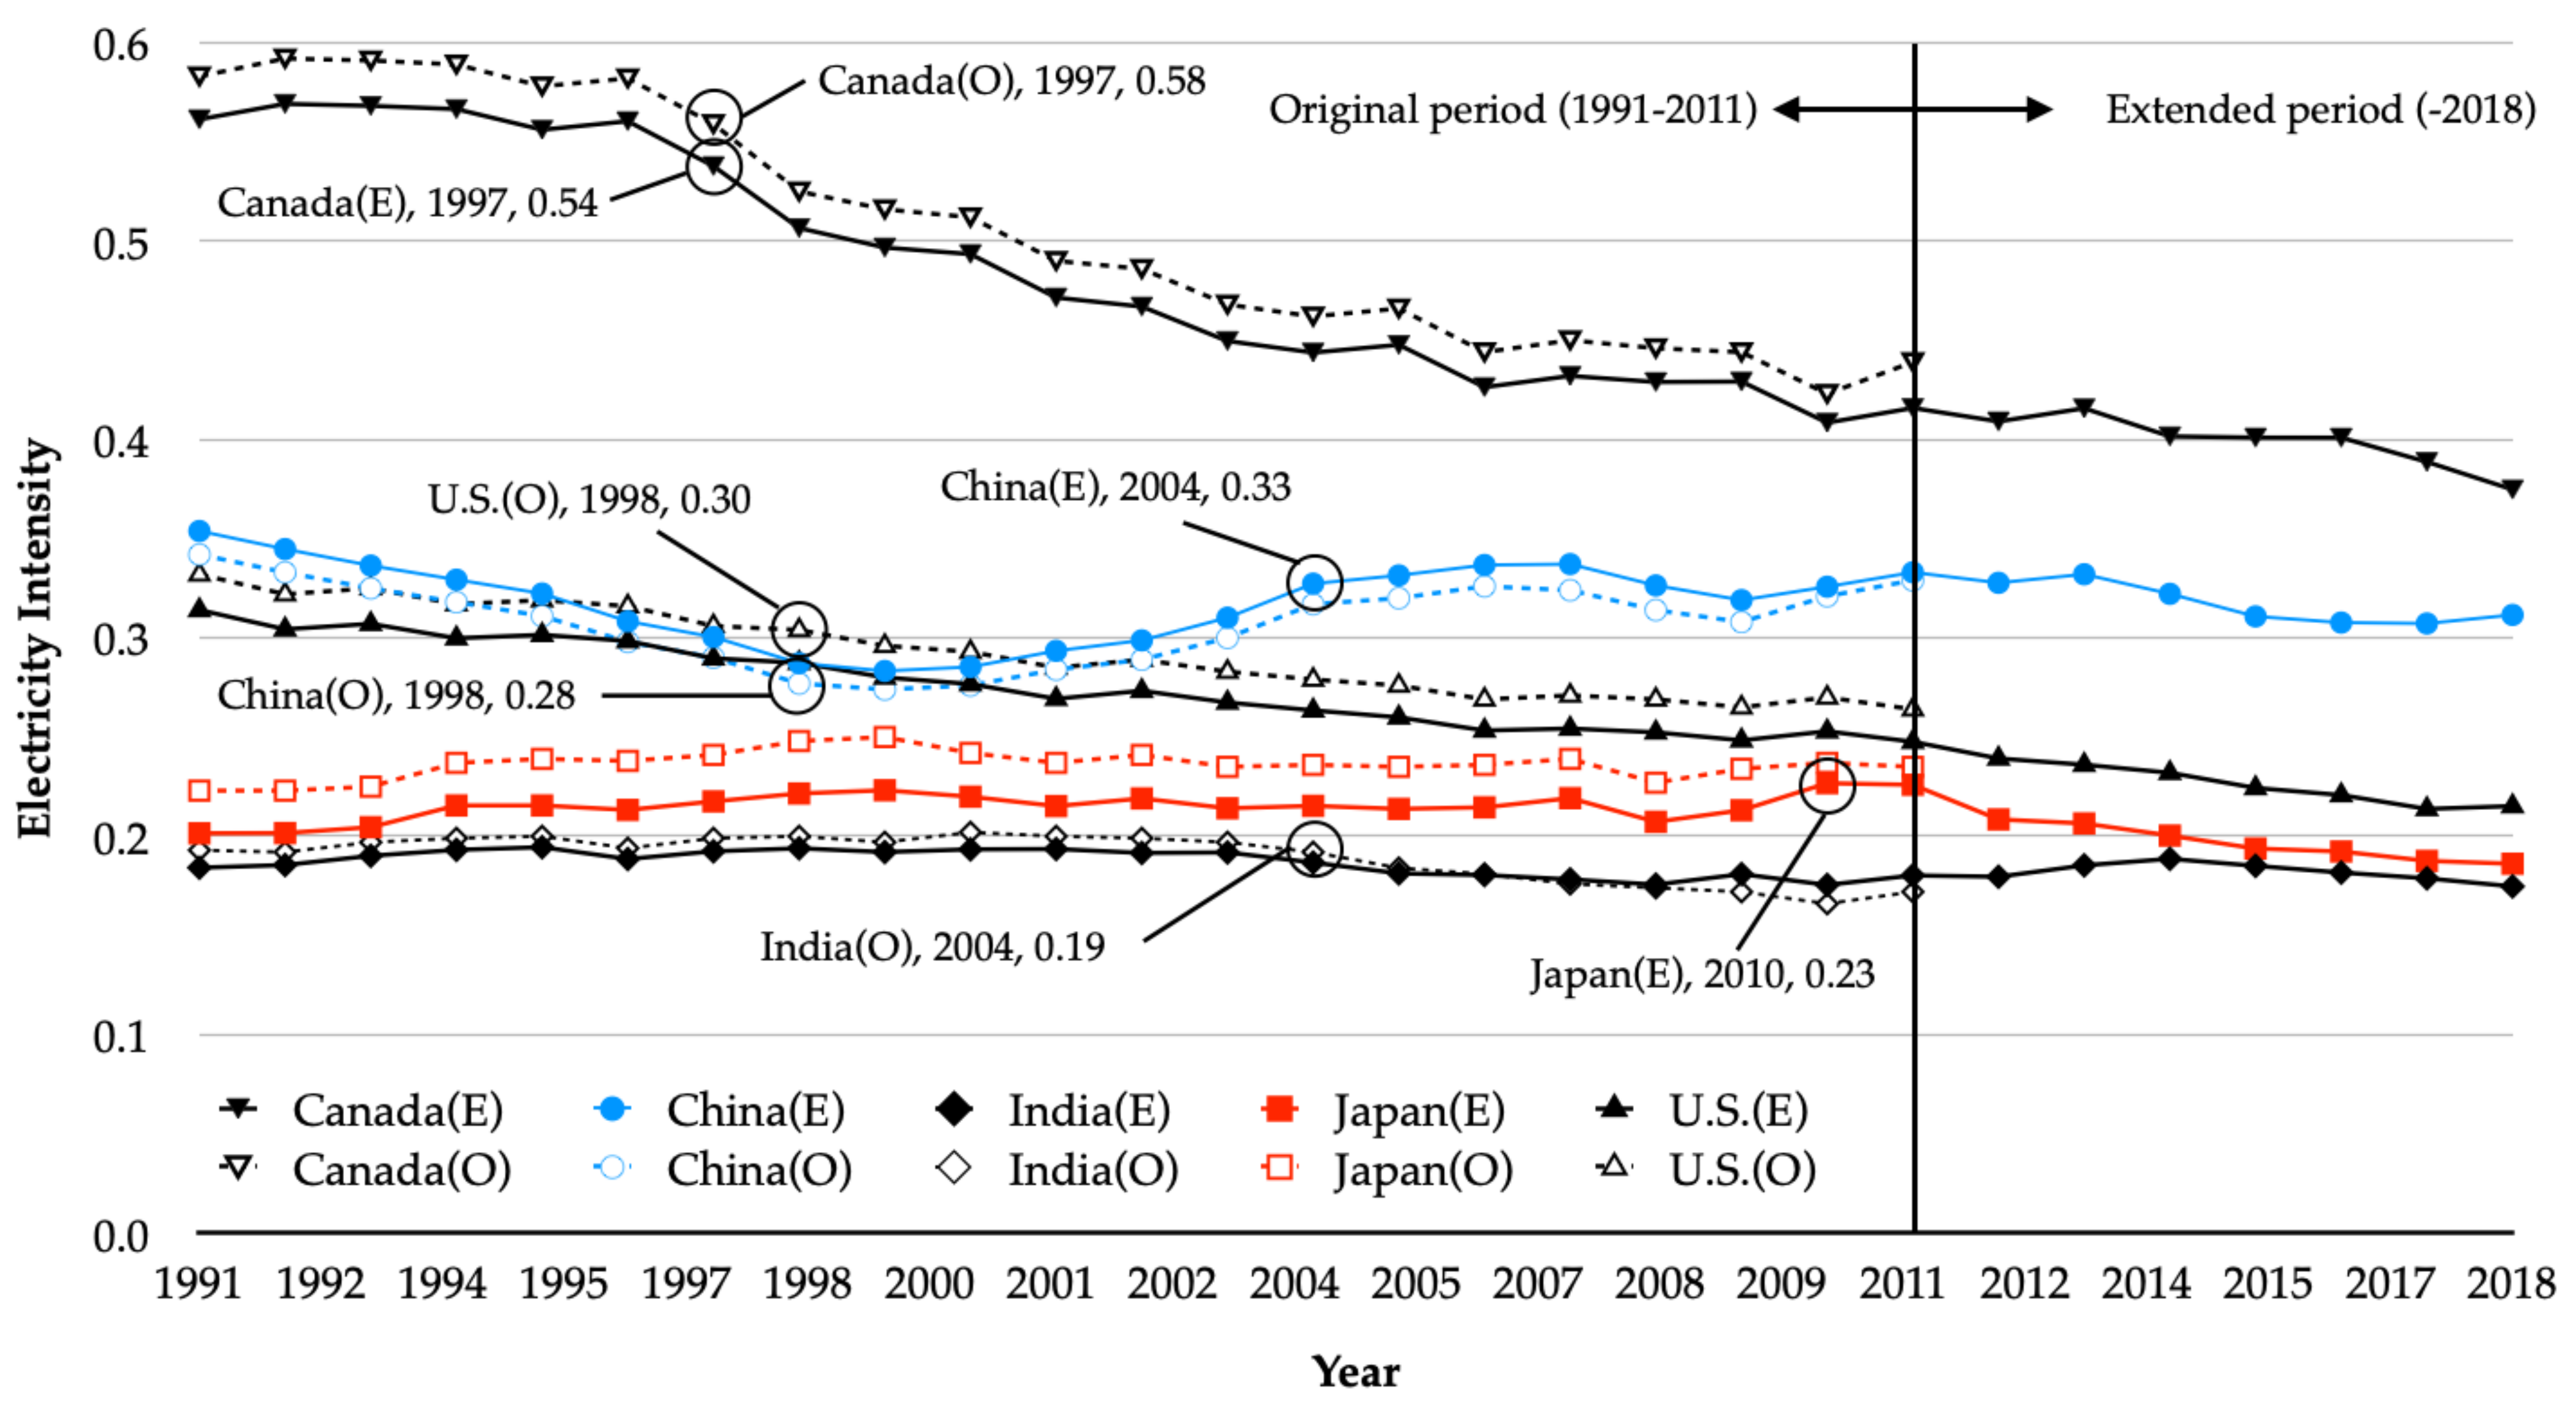
| 1991–2011 (2011 Constant Dollars) | 1991–2018 (2015 Constant Dollars) | |||||||
|---|---|---|---|---|---|---|---|---|
| Coefficient | Standard Error | PR | Model Selection | Coefficient | Standard Error | PR | Model Selection | |
| Canada | −0.212 ** | 0.017 | 0.864 | Kinked (1997) | −0.207 *** | 0.010 | 0.866 | Kinked (1997) |
| China | 0.019 ** | 0.014 | 1.079 | Kinked (1998) | −0.047 *** | 0.013 | 0.995 | Kinked (2004) |
| India | −0.187 * | 0.058 | 0.878 | Kinked (2004) | −0.017 * | 0.008 | 0.998 | Classical |
| Japan | 0.017 * | 0.008 | 1.012 | Classical | −0.613 *** | 0.060 | 0.654 | Kinked (2010) |
| The U.S. | −0.125 ** | 0.007 | 0.917 | Kinked (1998) | −0.112 *** | 0.020 | 0.925 | Classical |
Publisher’s Note: MDPI stays neutral with regard to jurisdictional claims in published maps and institutional affiliations. |
© 2021 by the authors. Licensee MDPI, Basel, Switzerland. This article is an open access article distributed under the terms and conditions of the Creative Commons Attribution (CC BY) license (https://creativecommons.org/licenses/by/4.0/).
Share and Cite
Kim, H.-E.; Chang, Y.-S.; Kim, H.-J. Dynamic Electricity Intensity Trends in 91 Countries. Sustainability 2021, 13, 4588. https://doi.org/10.3390/su13084588
Kim H-E, Chang Y-S, Kim H-J. Dynamic Electricity Intensity Trends in 91 Countries. Sustainability. 2021; 13(8):4588. https://doi.org/10.3390/su13084588
Chicago/Turabian StyleKim, Hann-Earl, Yu-Sang Chang, and Hee-Jin Kim. 2021. "Dynamic Electricity Intensity Trends in 91 Countries" Sustainability 13, no. 8: 4588. https://doi.org/10.3390/su13084588
APA StyleKim, H.-E., Chang, Y.-S., & Kim, H.-J. (2021). Dynamic Electricity Intensity Trends in 91 Countries. Sustainability, 13(8), 4588. https://doi.org/10.3390/su13084588