1. Introduction
According to the literature, sustainable development is “socially responsible economic development” that protects “the resource base and the environment for the benefit of future generations”. However, in order to achieve sustainable development, massive changes in the industrial sector are needed. More specifically, to foster a significantly more sustainable industry, it is imperative to strive to achieve a clean, pollution-reducing industry.
In 2011, Greenpeace made accusations against several global brands in the fashion industry [
1,
2], such as Nike, Adidas, Puma, Lacoste, GAP and H & M, who use providers whose activities seriously pollute the environment in China. The report titled “Dirty Laundry”, published by Greenpeace, shows that a long list of companies active in the field of fashion has commercial links with suppliers in China. The activity of these suppliers led to the discharge of chemical substances in the Yangtze and Pearl rivers, impacting the immune system function and the functioning of hormones in humans. Indeed, as shown in [
3] the textile industry both uses large volumes of water (it takes approximately 200 liters of water to produce l kg of textiles) and also generates significant volumes of wastewater. Dyeing constitutes a particularly important problem in this respect, as dye houses in India and China are notorious for not only exhausting local water supplies, but for dumping untreated wastewater into local streams and rivers.
A second report issued in 2011 by the same organization [
4] (
i.e., Dirty Laundry 2: Hung Out to Dry) attests that nonylphenol ethoxylates (NPEs) (“NPEs are a group of chemicals used in the manufacturing of textiles, in particular as surfactants and detergents. NPEs can break down to form NPs, a toxic, persistent, bioaccumulative and hormone-disrupting substance. NP is very toxic to aquatic organisms and may cause long-term adverse effects in the aquatic environment.”) are present in the clothing and footwear of 15 leading brands. Ultimately, Greenpeace tried with the release of these reports to force these large companies to eliminate all releases of hazardous chemicals from their supply chains and products by the year 2020.
In 2013 the Chinese authorities have finally acknowledged the existence of so-called “cancer villages” within the country, after several years, from the emergence of information regarding the above average number of cancer occurrences in residents of some particularly polluted regions in the country. The government has also recognized that “toxic and harmful chemicals” generally prohibited in developed countries are allowed in China and “may endanger human health and the environment in the long run.” (Mediafax.com).
Among the hazardous substances, nonylphenol (NP), a synthetic organic compound banned in the European textile industry, is being used extensively by the Chinese textile industry and also in the production of detergents. It is worth mentioning that although NP and NPE are currently restricted under the REACH Regulation (the Regulation on Registration, Evaluation, Authorization and restriction of Chemicals—was enforced on 1 June 2007 and was meant to improve the former legislative framework on chemicals of the European Union) for use in textile processing within the EU, this regulation does not apply in cases where there is no release to wastewater at the site. In addition, there are no restrictions concerning the NP/NPE content of finished textiles within the European Union. Furthermore, NP/NPE is not subject to international controls, so imported textiles in particular are believed to be a source of NPE in the environment, a danger to which all world countries are subject (Environment Agency, 2013).
Given the controversy created by the textile industry’s contribution to pollution at a global level, but also given its proven close relationship with the overall macroeconomic growth in a developing country (see [
5]), this paper comparatively investigates the contribution of the textile industry to the water pollution across Central and Eastern European countries, developed countries and China and attempts to forecast the trend of the textile industry’s contribution to pollution and, hence, the road towards a more sustainable industrial sector over the next decade for the two top polluting Eastern European countries included in the analysis,
i.e., Poland and Romania. Previously, Domańska and Wojtylak [
6] employed fuzzy time series models to forecast pollution concentrations by using real meteorological data from different areas in Poland. Furthermore, with applications on the Polish data, [
7] attempted to forecast daily air pollution by using support vector machine (SVM) and wavelet decomposition. Other studies propose different time series forecasting methods to study pollution indicators. Among these, [
8] proposed a parallel genetic algorithm (GA) to forecast hourly concentrations of urban air pollution in Helsinki. Ziomas
et al. [
9] proposed some analytical models relating pollutant concentrations in the Greater Athens Area with meteorological and other variables, while [
10] used a Bayesian kriged Kalman filtering model. Kurt
et al. [
11] developed an online air pollution forecasting system for the Greater Istanbul Area by using neural networks, and Ibarra-Berastegi
et al. [
12] also employed neural networks to forecast five air pollution indicators in six locations in the area of Bilbao (Spain). McCollister and Wilson [
13] developed two linear stochastic models to forecast the concentrations of various air pollutants in the Los Angeles area, and more recently [
14] developed a model for rational sustainable development in Vilnius. Among studies focused on water pollution forecasting, we encounter [
15,
16,
17]
The remainder of the paper is organized as follows.
Section 2 explains and presents the data, comparatively discusses the evolution of some standard water pollution indicators across G20 and Eastern Europe countries over the last decade and also presents the methodology employed in the econometric investigation. Further,
Section 3 discusses the empirical results and model diagnosis, while
Section 4 concludes the research.
3. Results and Discussion
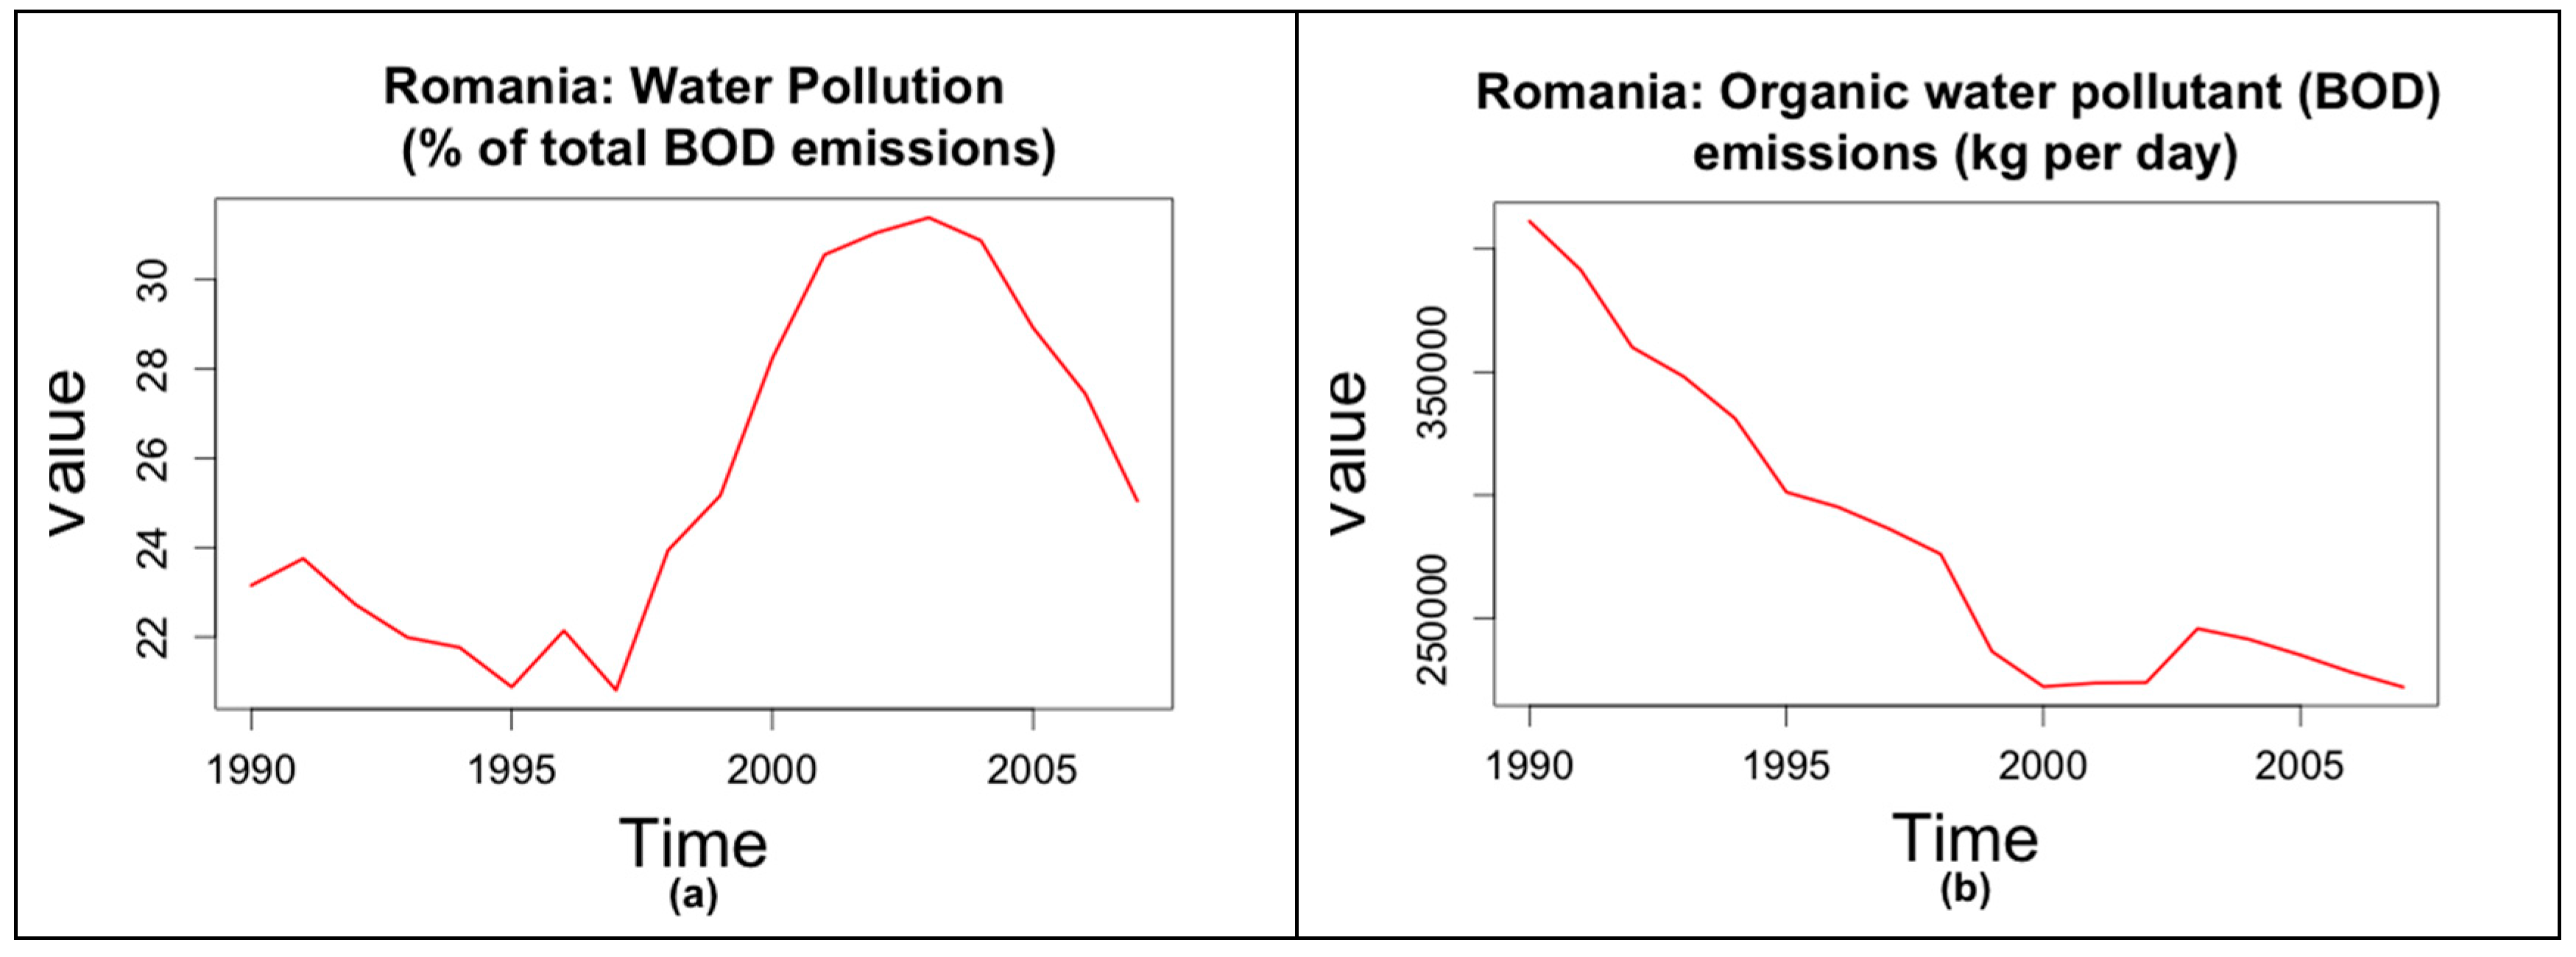
Figure 4a,b shows that although total emissions of organic water pollutants decreased consistently during the 1990–2007 period in Romania (
Figure 4b), the contribution of the textile industry to pollution has increased (
Figure 4a). Indeed, water pollution caused by the textile industry in Romania had a constant decreasing trend until 1995, and from 1998, it started to increase sharply, with this upward trend continuing until the year 2004, after which, a reversal occurred, but the last data level is above the initial value.
Figure 4.
(a) Romania: water pollution caused by the textile industry; (b) Romania: total emissions of organic water pollutants.
Figure 4.
(a) Romania: water pollution caused by the textile industry; (b) Romania: total emissions of organic water pollutants.
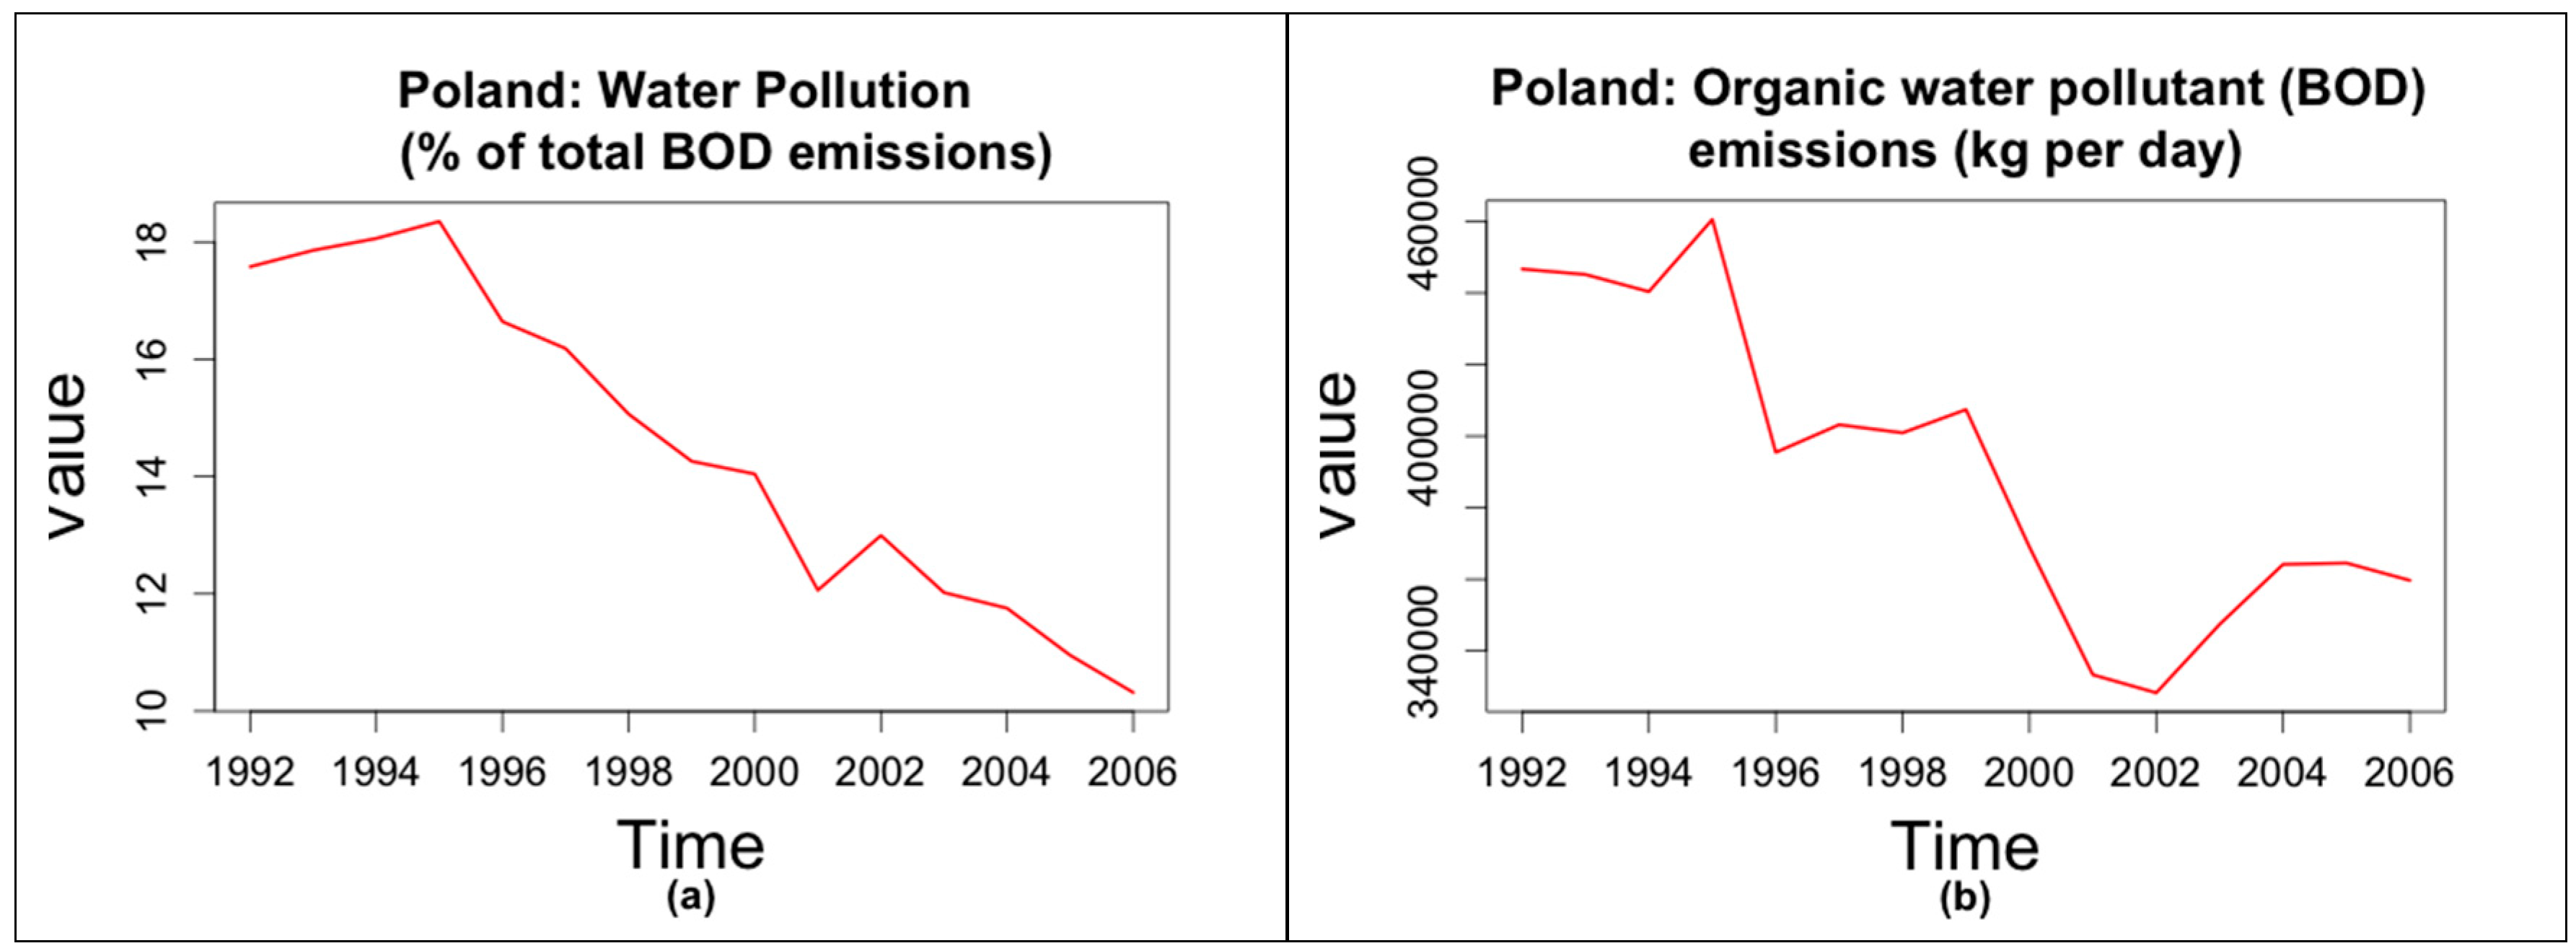
A similar story is true in the case of Poland, with the main difference being that Poland managed to decrease both its total organic water pollutant emissions and the contribution of the textile industry to pollution during the analysis period (
Figure 5a,b). Nevertheless, as seen in
Section 2, it remains the most polluting country in the Eastern European area. Total emissions of organic water pollutants decreased sharply in Poland until 2002, after which, a reversal occurred (
Figure 5b), while the contribution of the country’s textile industry to water pollution continued the decreasing trend during the whole analysis period (
Figure 5a).
Figure 5.
(a) Poland: water pollution caused by the textile industry; (b) Poland: total emissions of organic water pollutants.
Figure 5.
(a) Poland: water pollution caused by the textile industry; (b) Poland: total emissions of organic water pollutants.
The graphical representation of data in
Figure 4 and
Figure 5 indicates that this time series appears to be non-seasonal and can be described using an additive model. Thus, for a clearer view of the trend, we will use a smoothing method, by calculating the simple moving average of the time series of order three.
The data smoothed with a simple moving average of order three confirms that organic water pollutant emissions decreased in both countries during the selected period, while the contribution of the textile industry to pollution followed a decreasing trend only in Poland, while Romania registered an increase over the 1998–2004 period.
To make forecasts for both total emissions of organic water pollutants (measured in kilograms per day) and water pollution caused by the textile industry (measured in percentages of total BOD emissions) in Romania and Poland for the following decade, we fit a predictive model using the HoltWinters() function in R, where we set the parameter gamma = FALSE, as our time series appears to be non-seasonal.
Table 2 presents the estimation results for both indictors and both countries.
Table 2.
Estimated coefficients of Holt–Winters model.
Table 2.
Estimated coefficients of Holt–Winters model.
| Coefficients | Total Emissions of Organic Water Pollutants (Kilograms per Day) | Water Pollution Caused by the Textile Industry (% of Total BOD Emissions) |
|---|
| | POLAND | ROMANIA | POLAND | ROMANIA |
| a | 359,893.8730 | 222,102.500 | 10.4199881 | 25.197353 |
| b | −588.7619 | −4,951.716 | −0.6754701 | −2.287893 |
| Forecasts SSE | 848,633.7659 | 799,484.4617 | 9.882093 | 27.83826 |
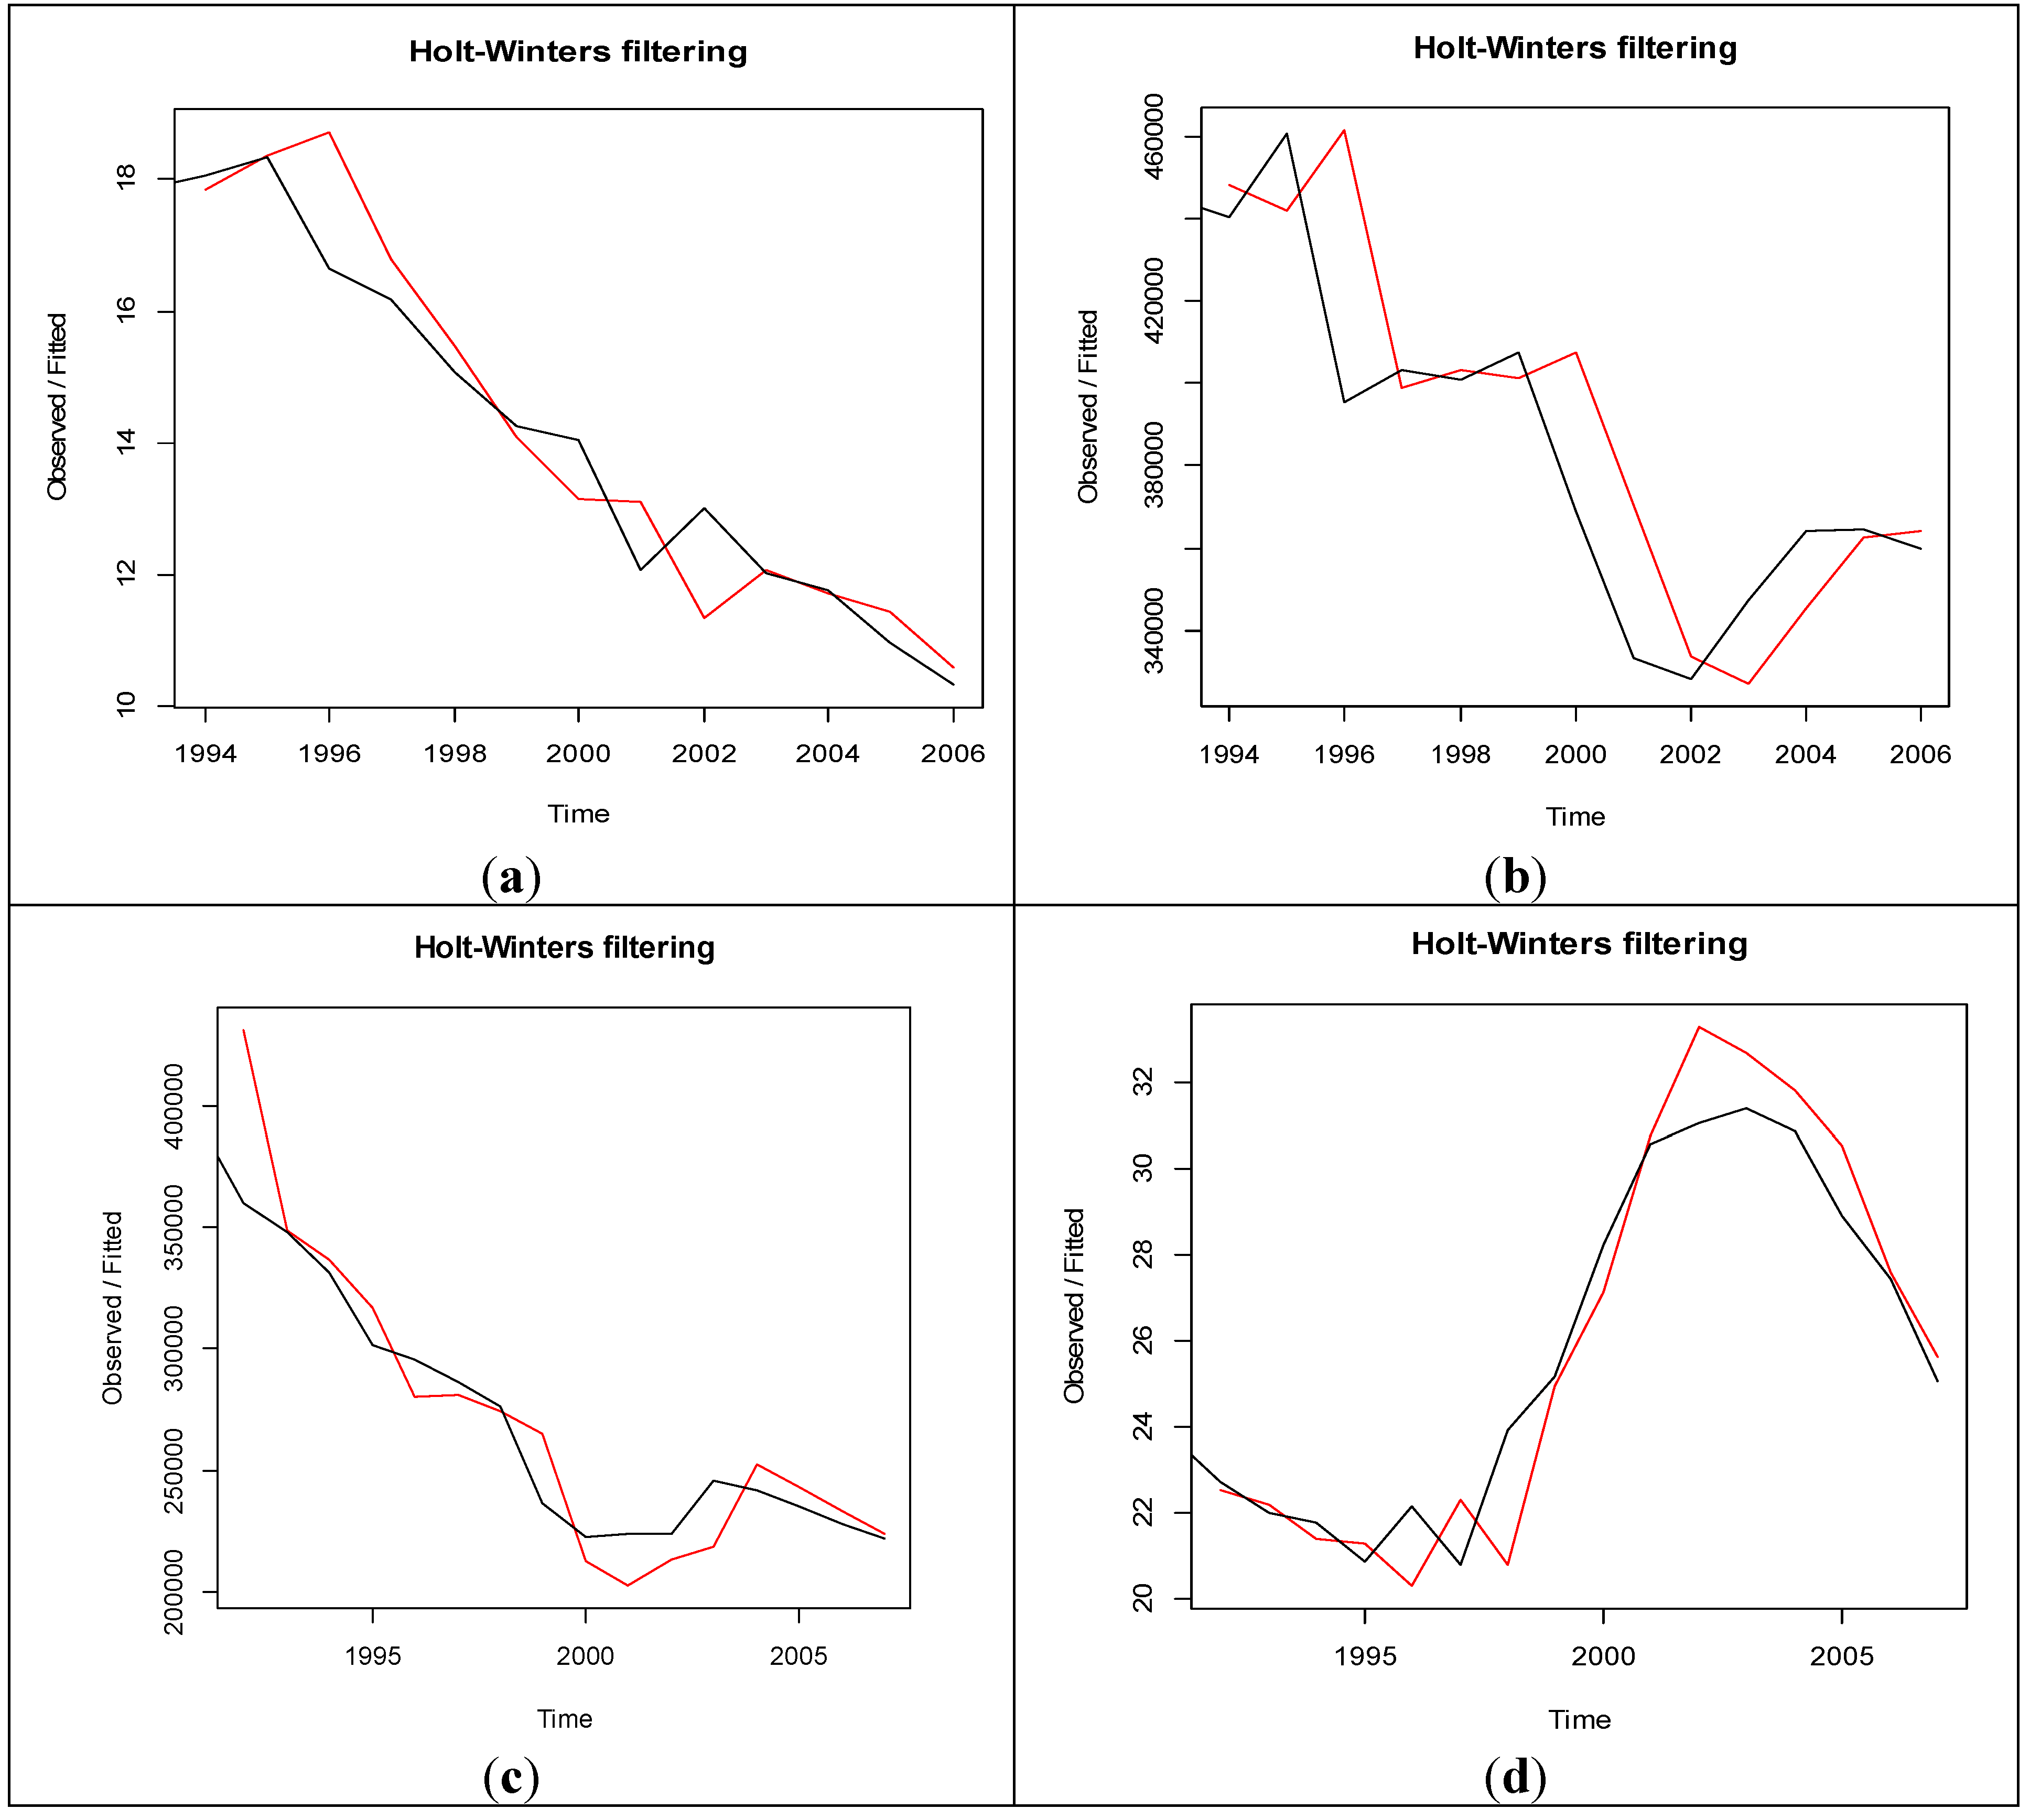
Figure 6a–d plots the original time series as a black line, with the forecasted values as a red line. We can observe that the in-sample forecasts agree pretty well with the observed values, although they tend to lag behind the observed values a little bit.
Figure 6.
(a) Water pollution of the textile industry in Poland; (b) Poland: organic water pollutant (BOD) emissions (kg per day); (c) Romania: organic water pollutant (BOD) emissions (kg per day); (d) water pollution textile industry in Romania.
Figure 6.
(a) Water pollution of the textile industry in Poland; (b) Poland: organic water pollutant (BOD) emissions (kg per day); (c) Romania: organic water pollutant (BOD) emissions (kg per day); (d) water pollution textile industry in Romania.
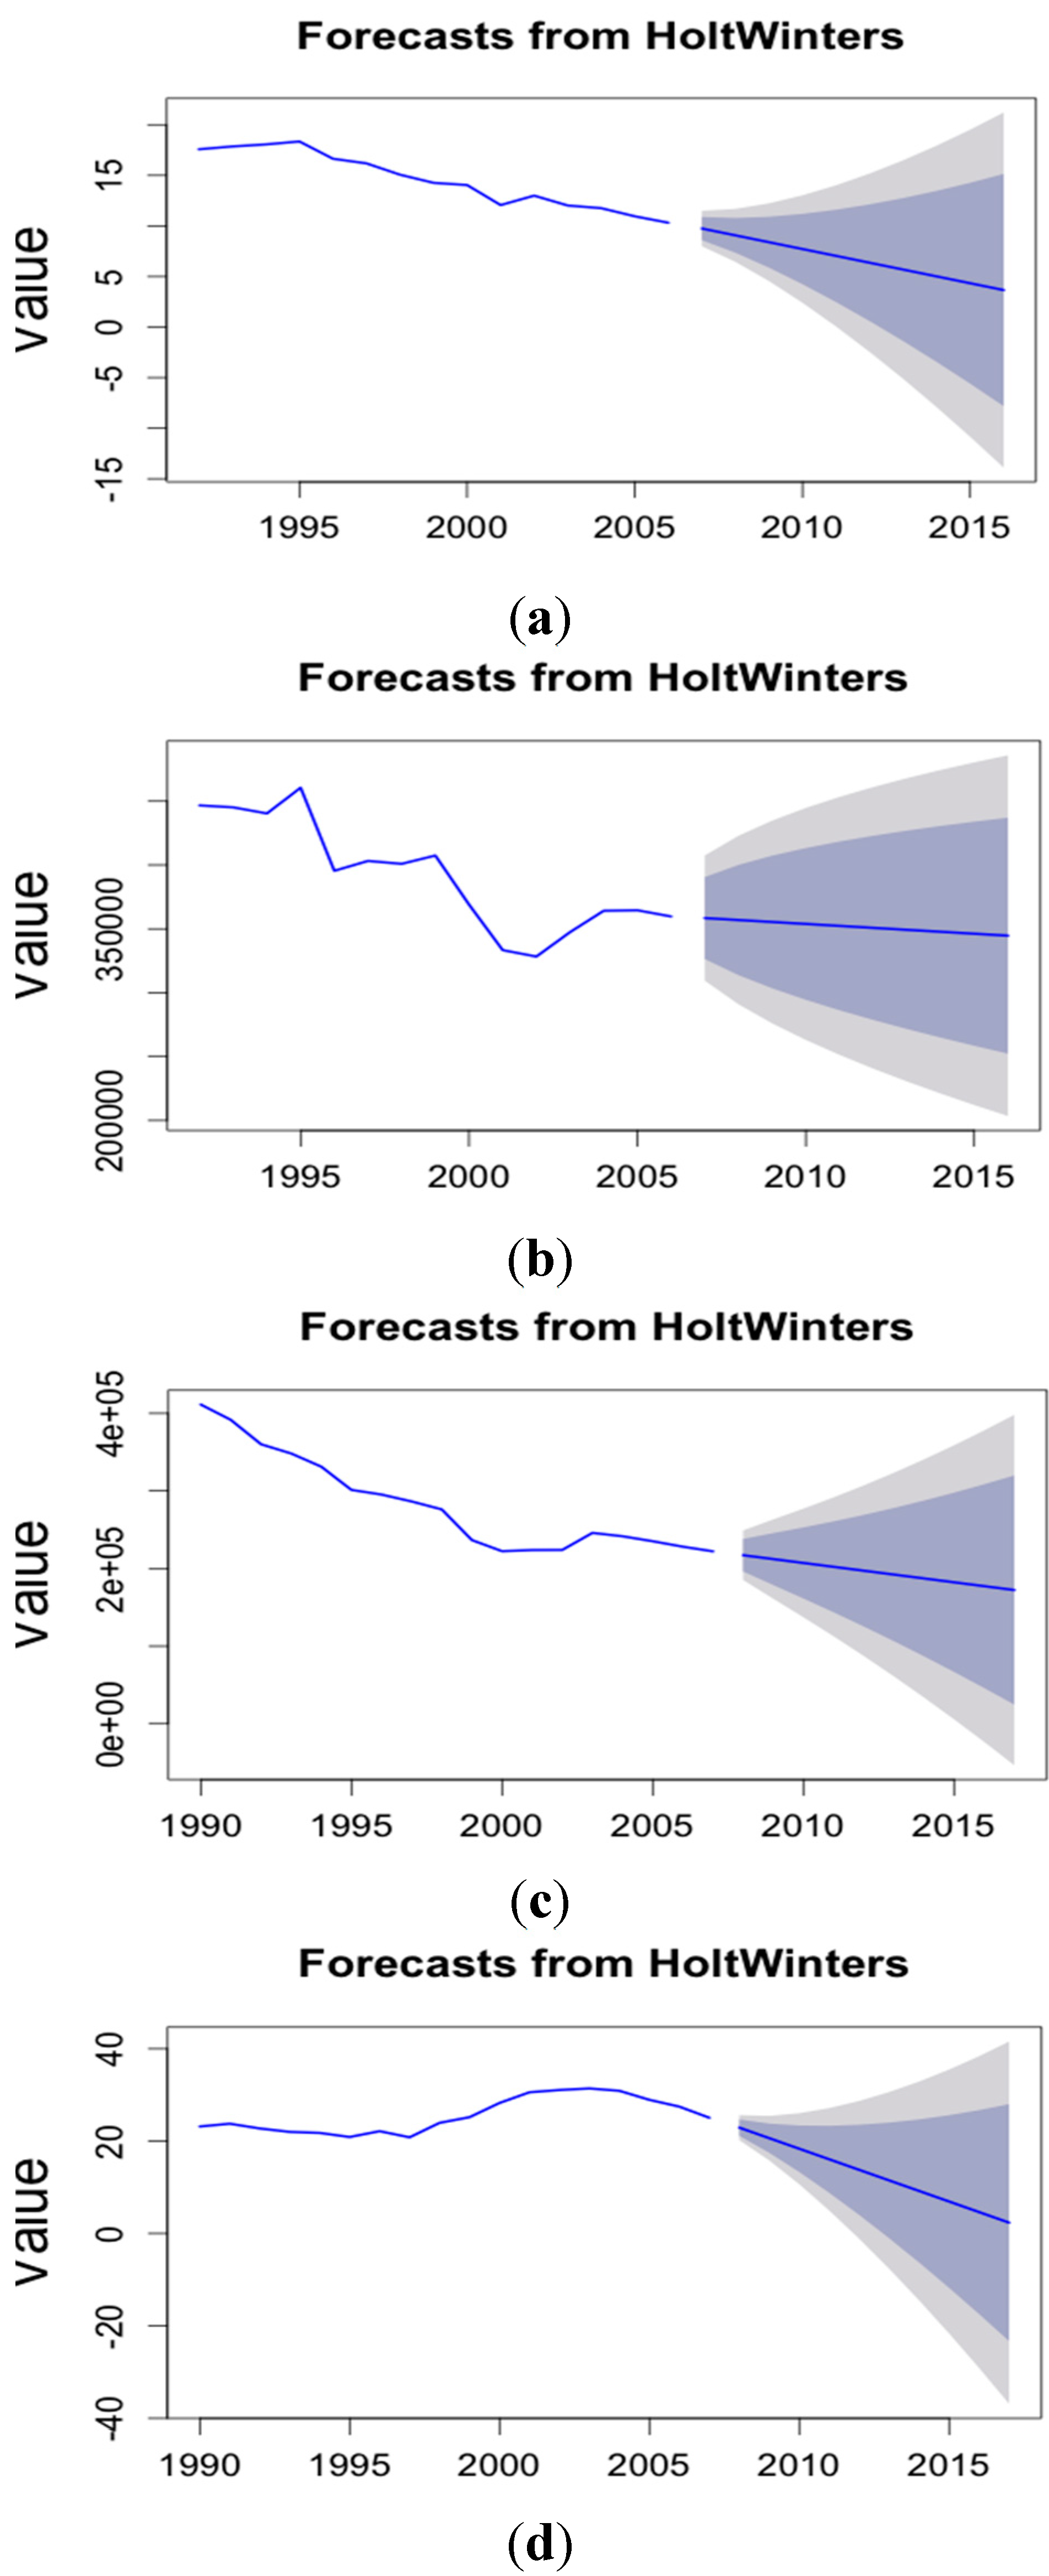
Next, we make forecasts for total organic water pollutant (BOD) emissions and for water pollution caused by the textile industry in Poland and Romania in from 2007–2017.
Figure 7a–d reflects the predictions made by the Holt–Winters model as a blue line, with the 80% prediction interval as a dark shaded area and the 95% prediction interval as a lighter shaded area. The decreasing trend is obvious in all cases. According to our estimates, the contribution of the textile industry to water pollution will be 3.66% by the end of the year 2016 in Poland and 2.35% by the end of 2017 in Romania. Both countries are headed towards complete elimination of pollution caused by the textile industry and, hence, towards a sustainable industrial sector, as Greenpeace intended with the release of its reports.
Figure 7.
(a) Prediction of water pollution caused by the textile industry: Poland; (b) prediction of organic water pollutant (BOD) emissions (kg per day): Poland; (c) prediction of organic water pollutant (BOD) emissions (kg per day): Romania; (d) prediction of water pollution caused by the textile industry: Romania.
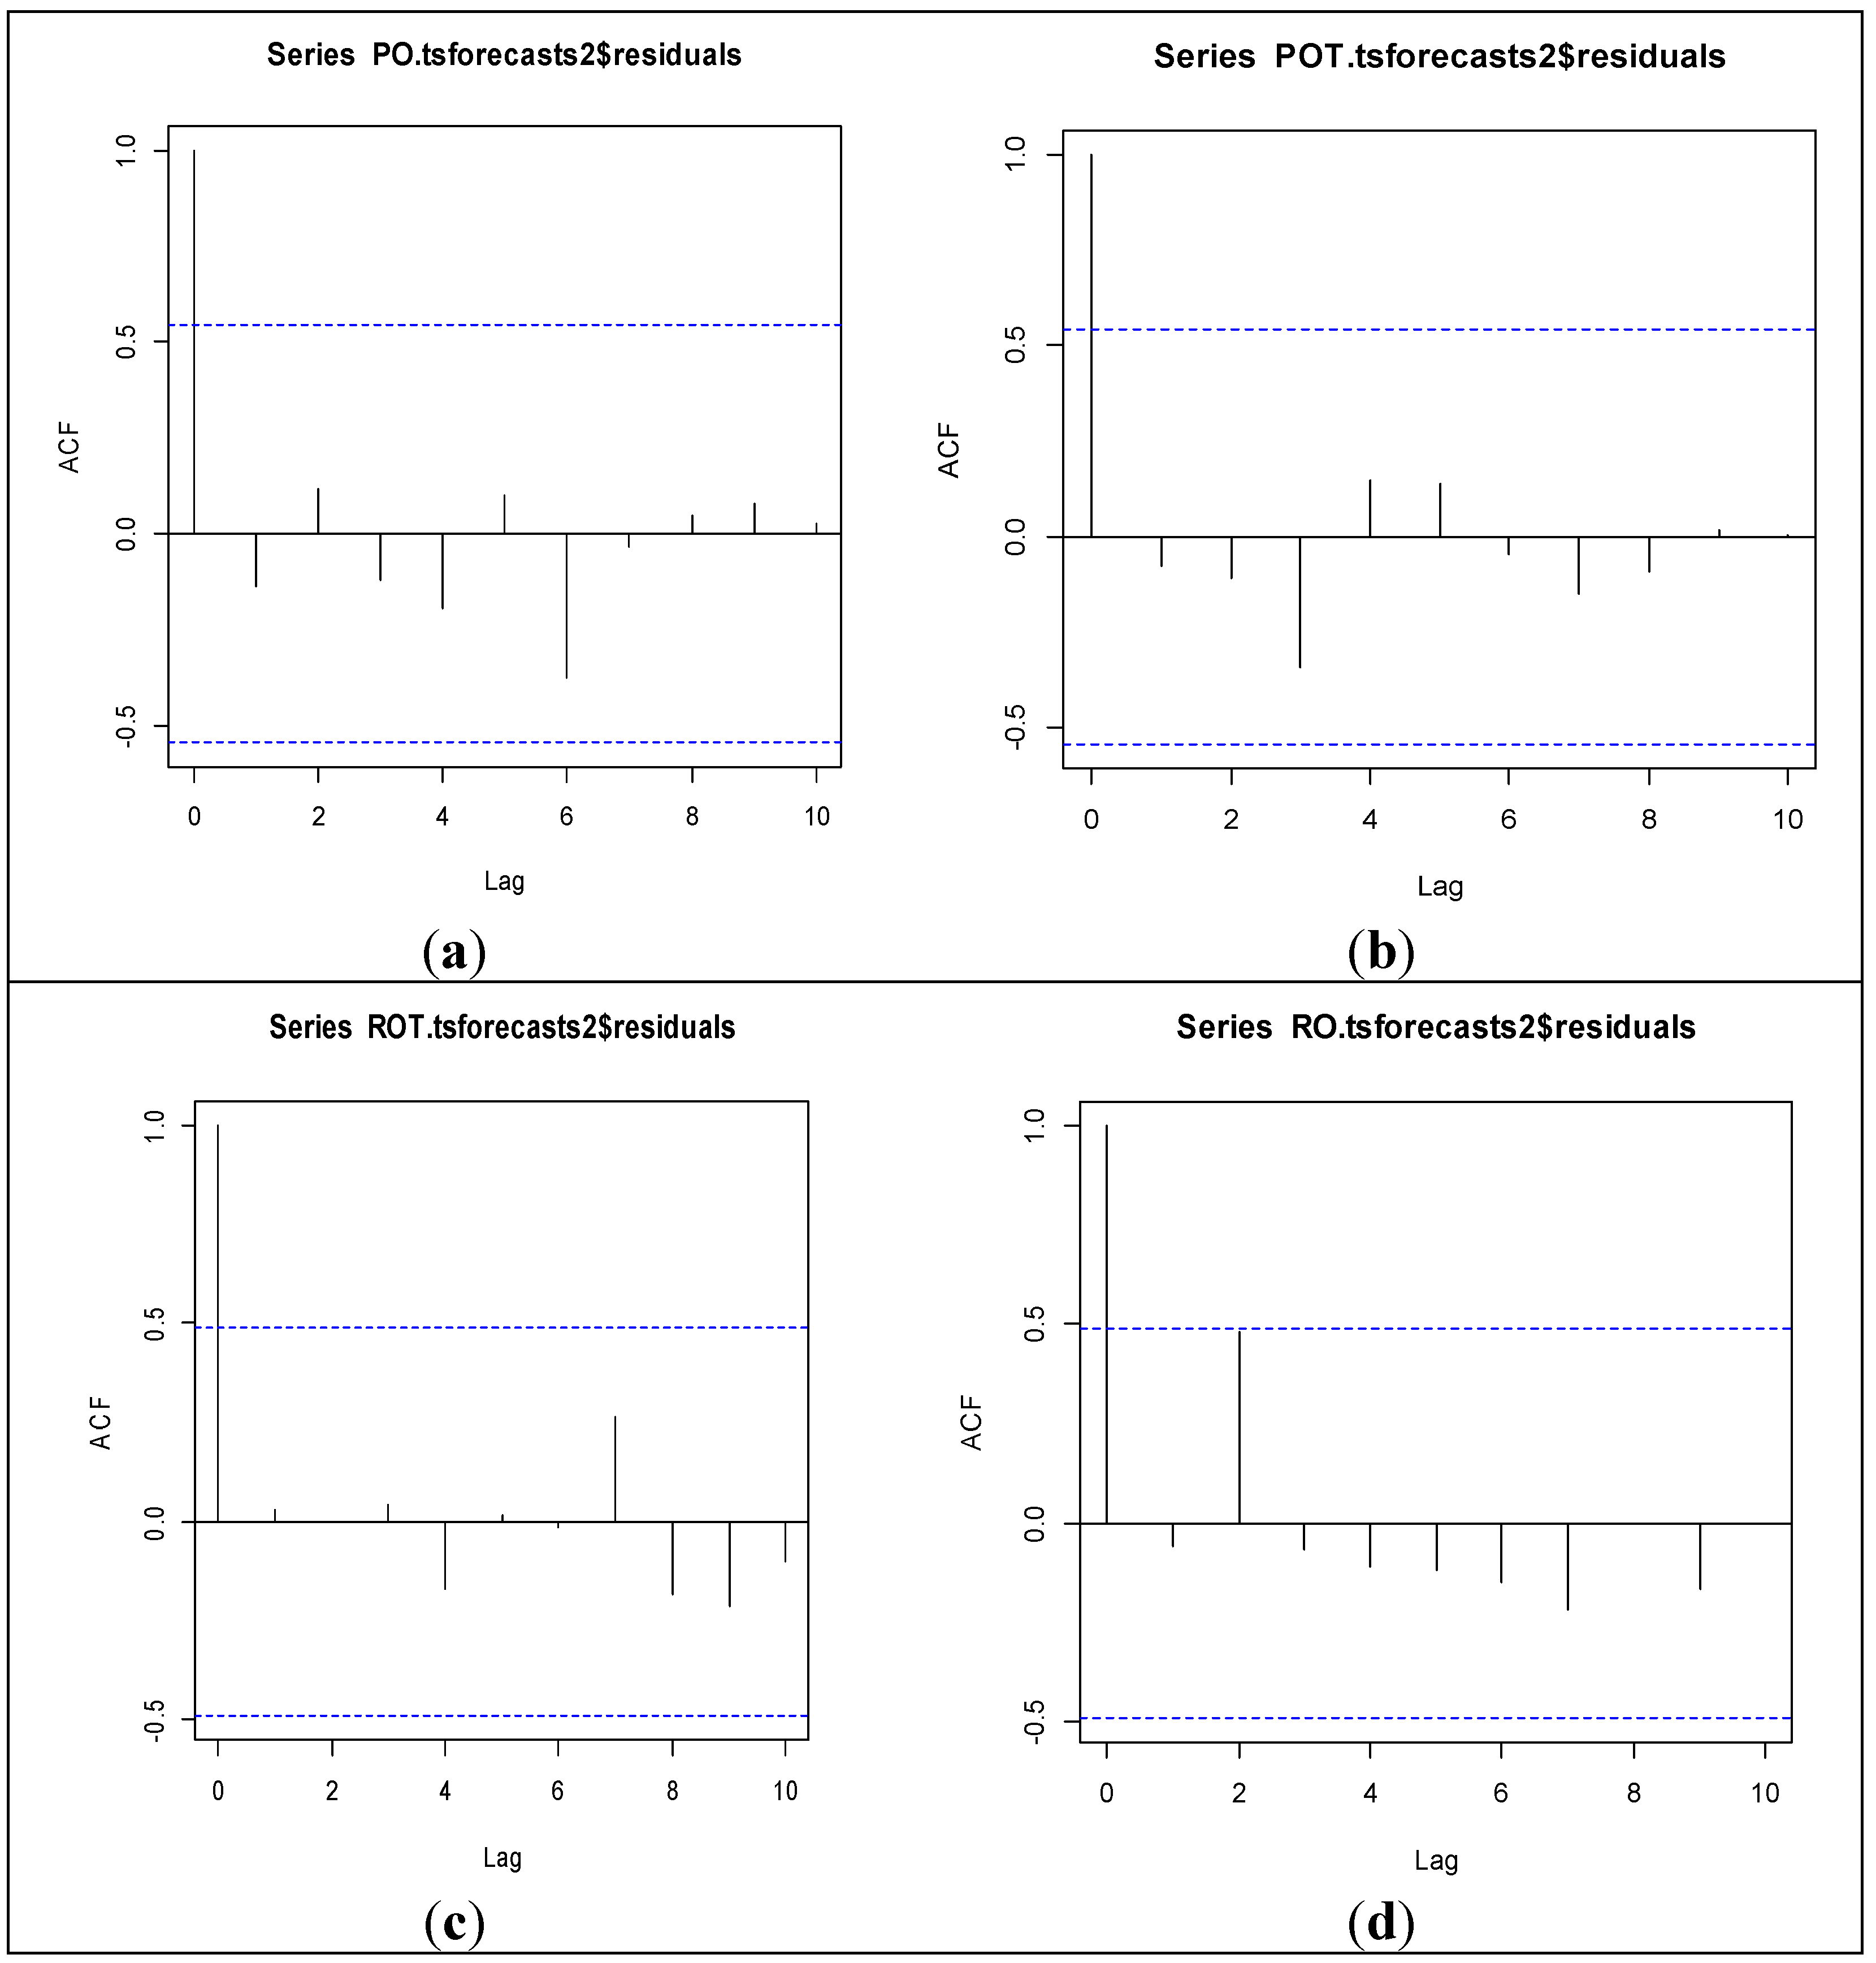
Finally, we check the accuracy of the forecast by calculating a correlogram of the in-sample forecast errors (
Figure 8a–d). We notice from the sample correlograms that the autocorrelations at Lags 1–20 are all within the significance bounds, which proves that our forecast model is correctly specified, as there is no autocorrelation left in the residuals. Further, the Ljung–Box test is carried out in order to test whether there is significant evidence for non-zero correlations at Lags 1–20, and it also confirms the accuracy of the models in all cases (all calculated
p-values are above 0.6, so we conclude that no statistically significant correlations are left, which is required for a well-specified prediction model). The results therefore attest that both Poland and Romania are reducing their total organic water pollutant (BOD) emissions and the water pollution caused by the textile industry.
Figure 8.
(a–d) Correlograms of the in-sample forecast errors for the four time series.
Figure 8.
(a–d) Correlograms of the in-sample forecast errors for the four time series.
4. Conclusions
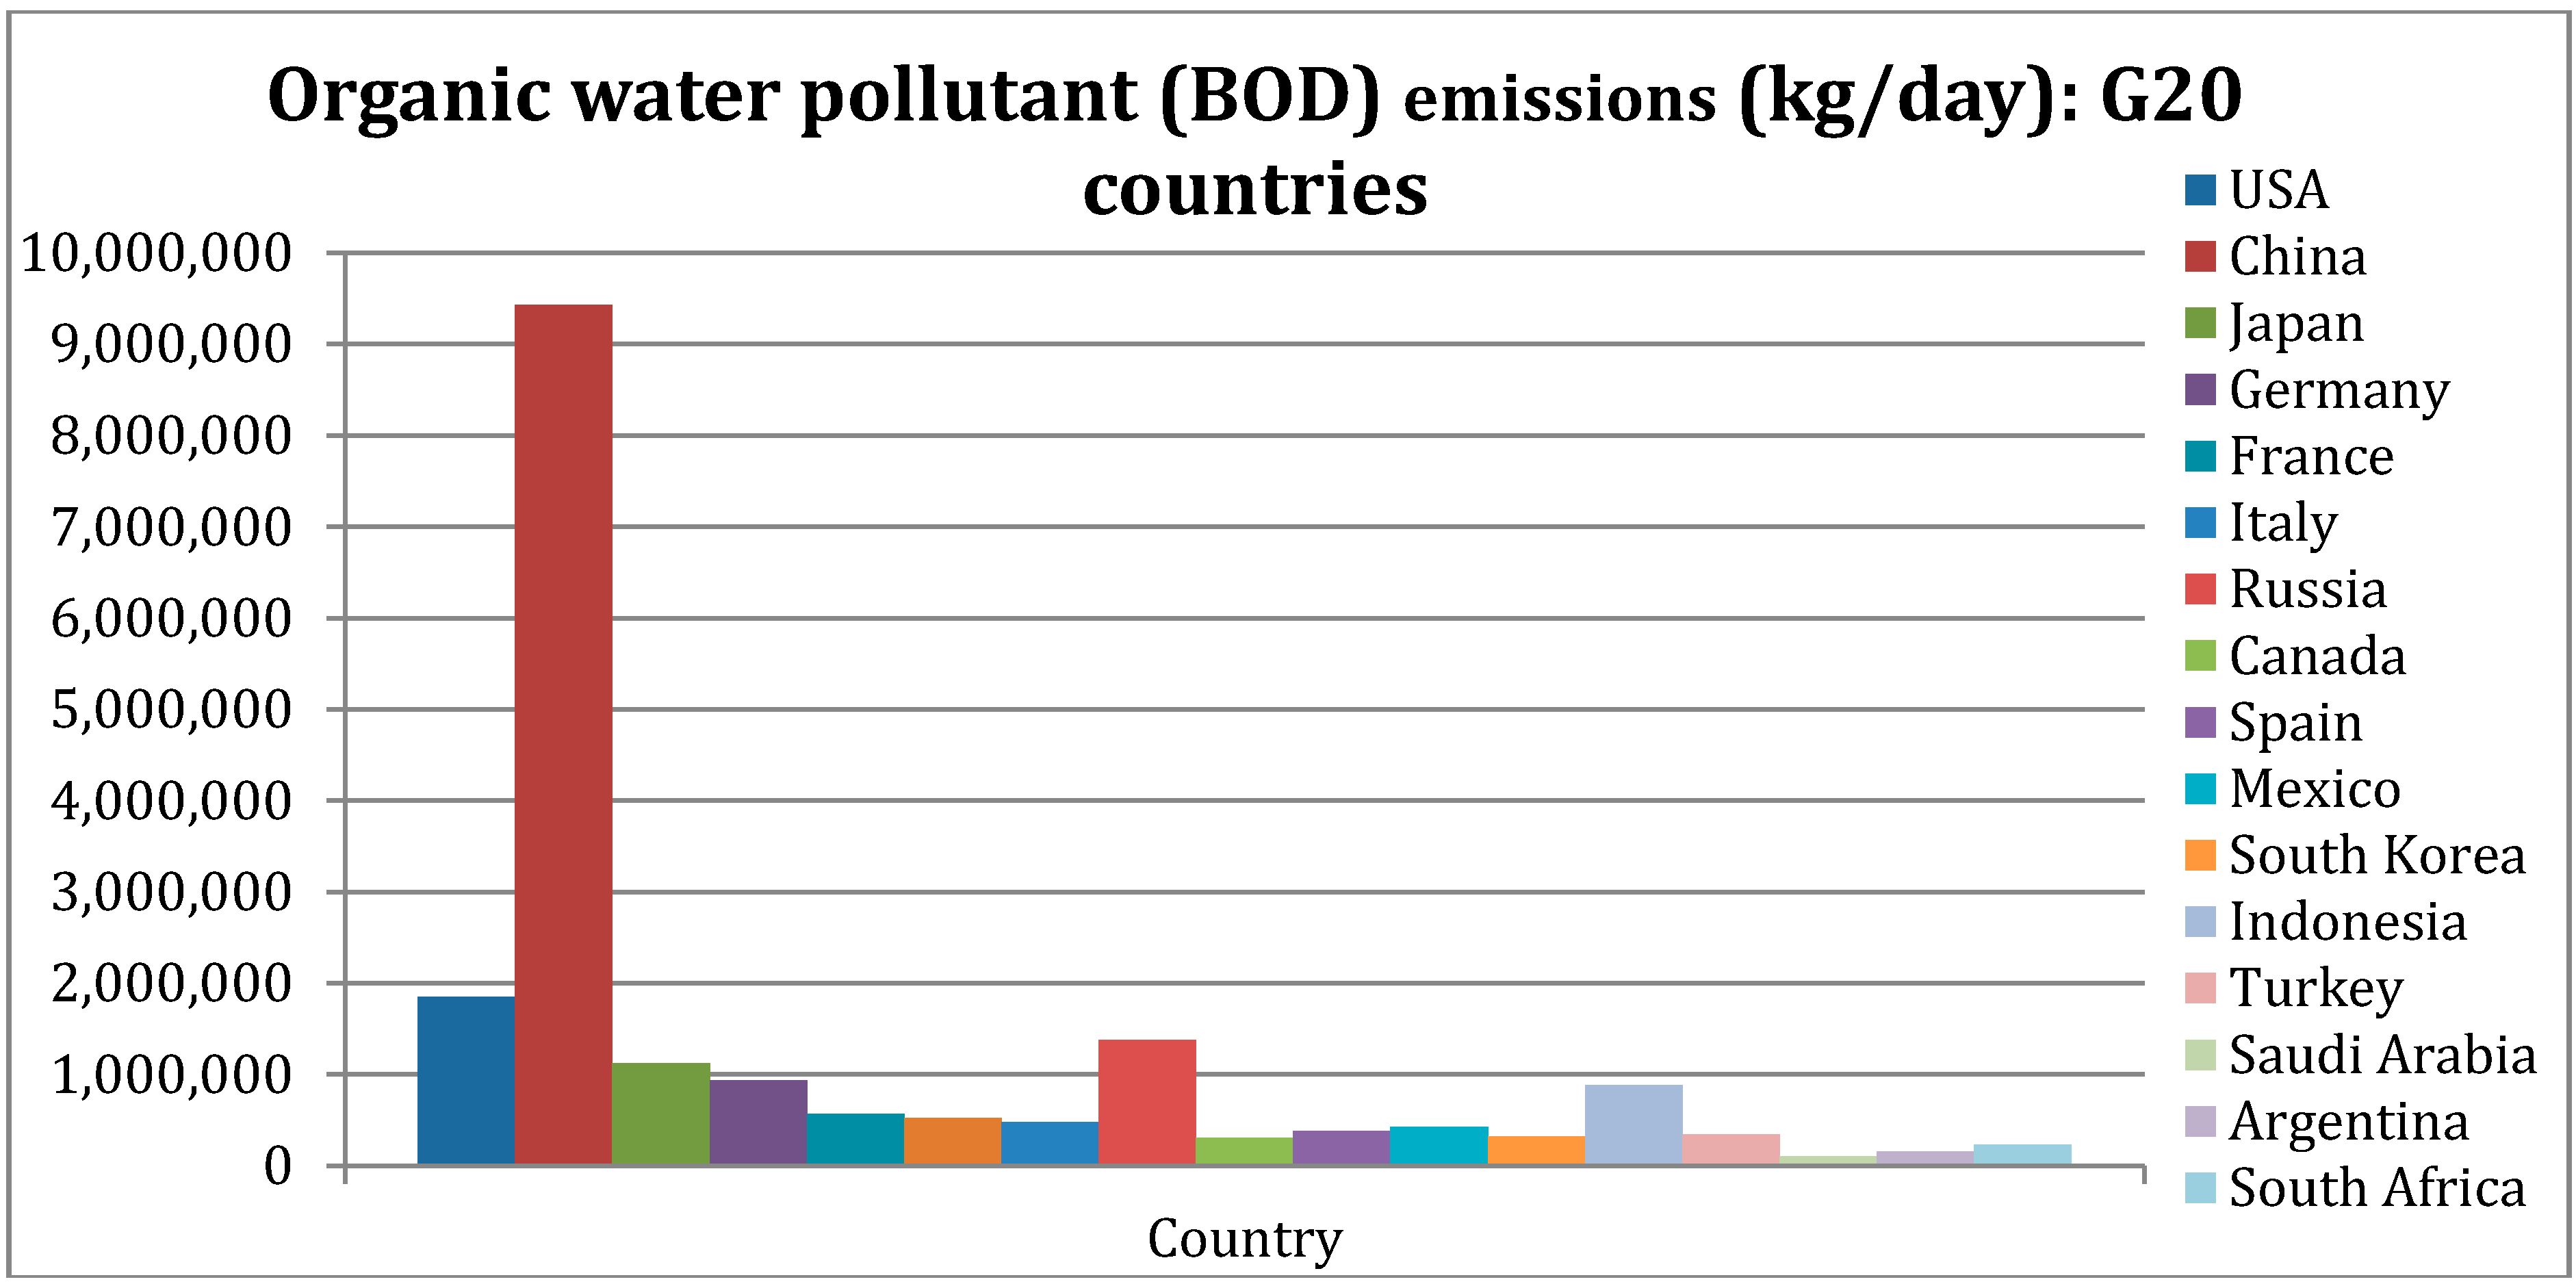
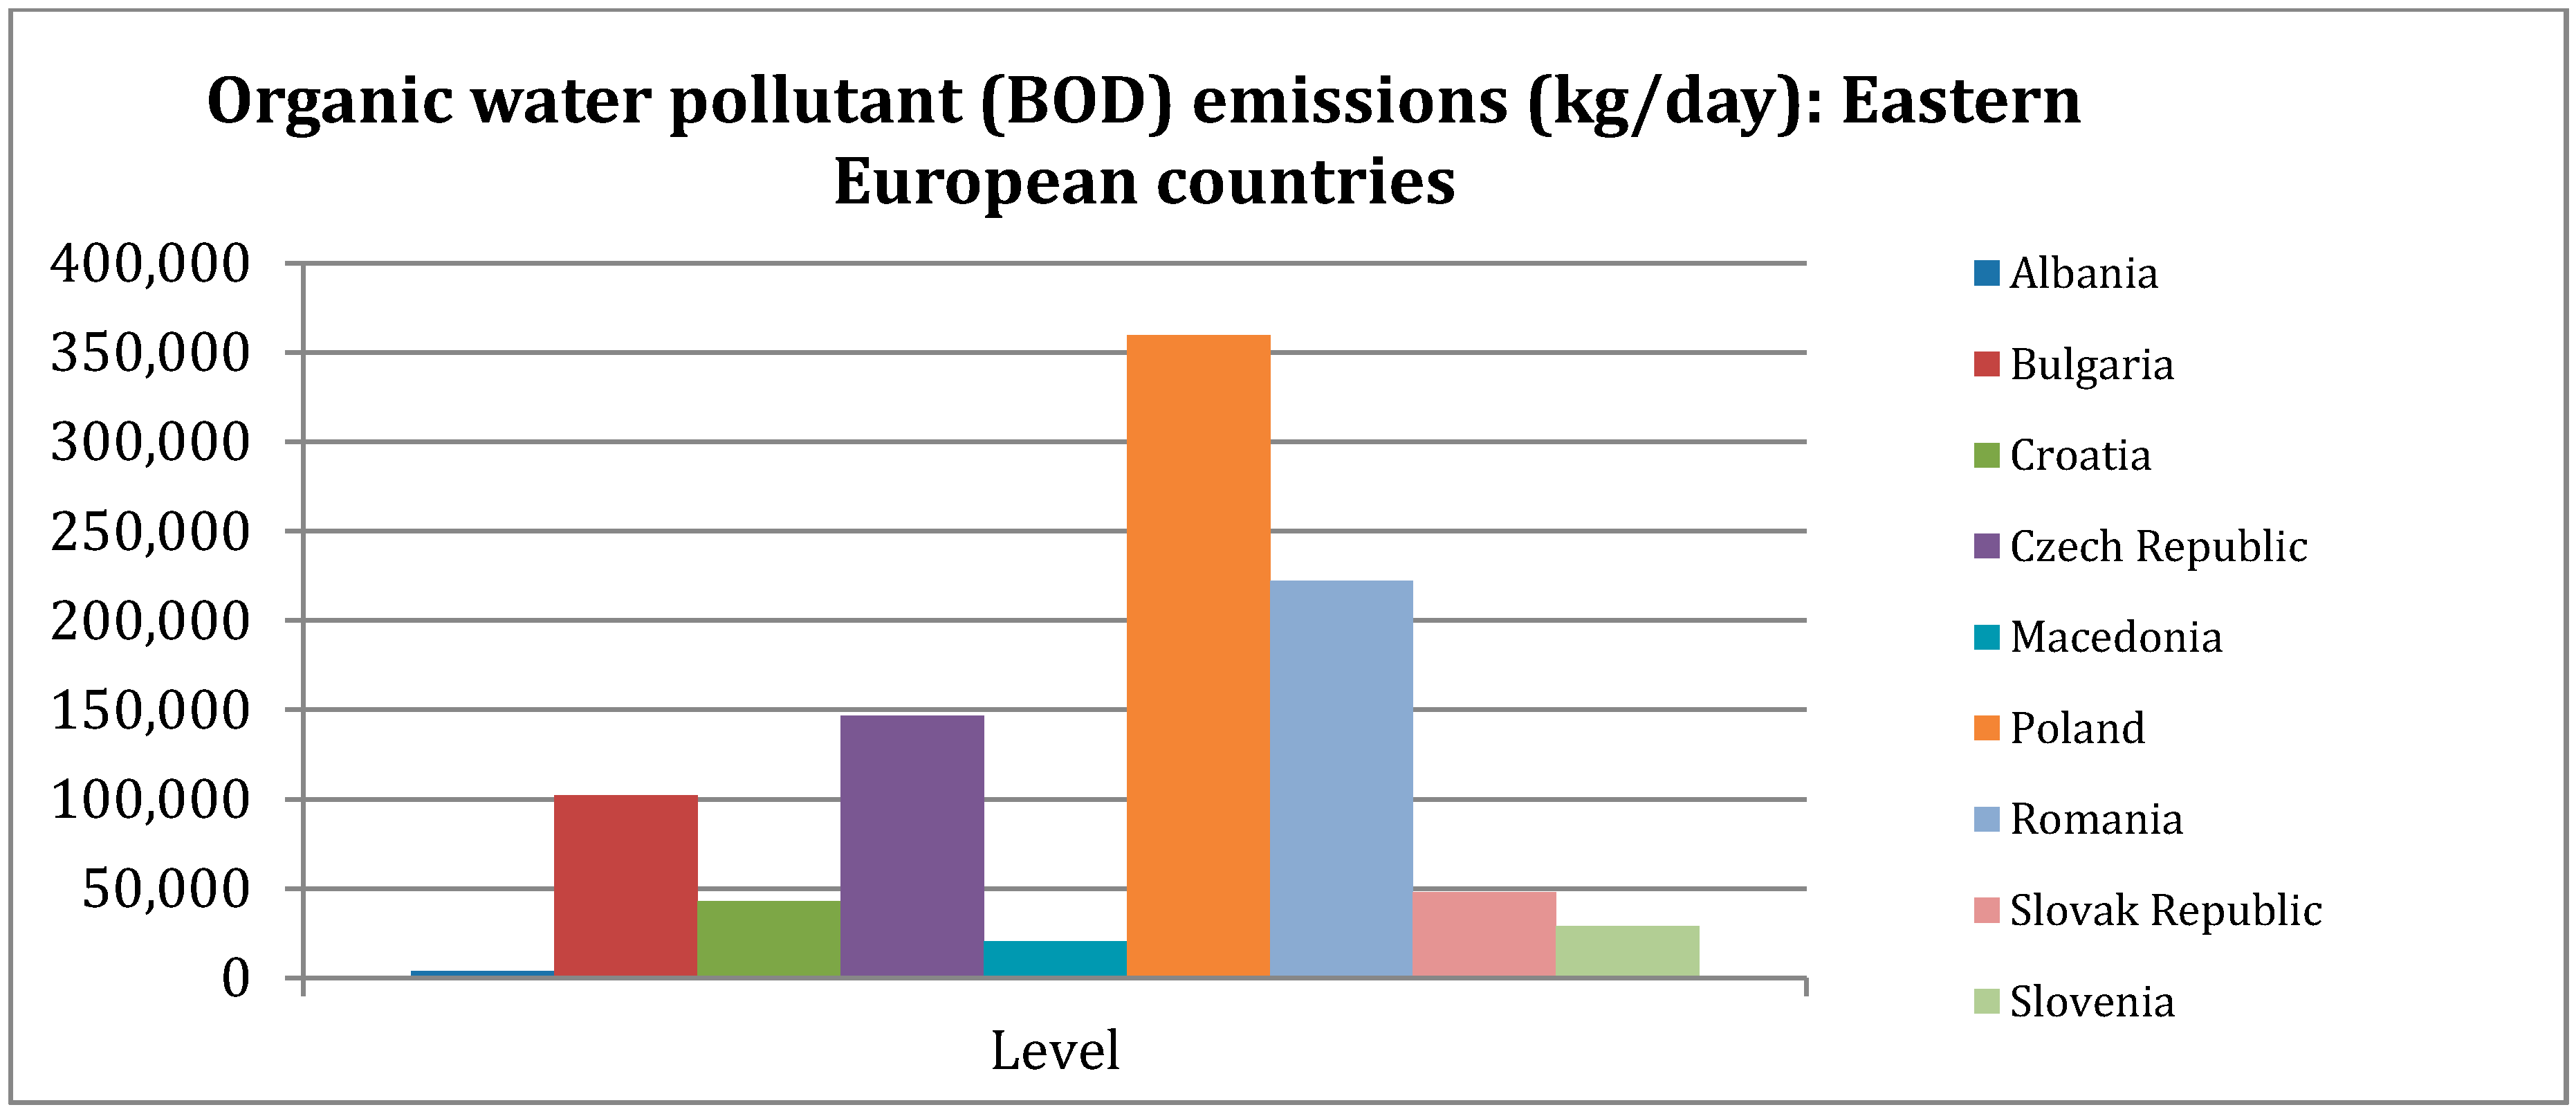
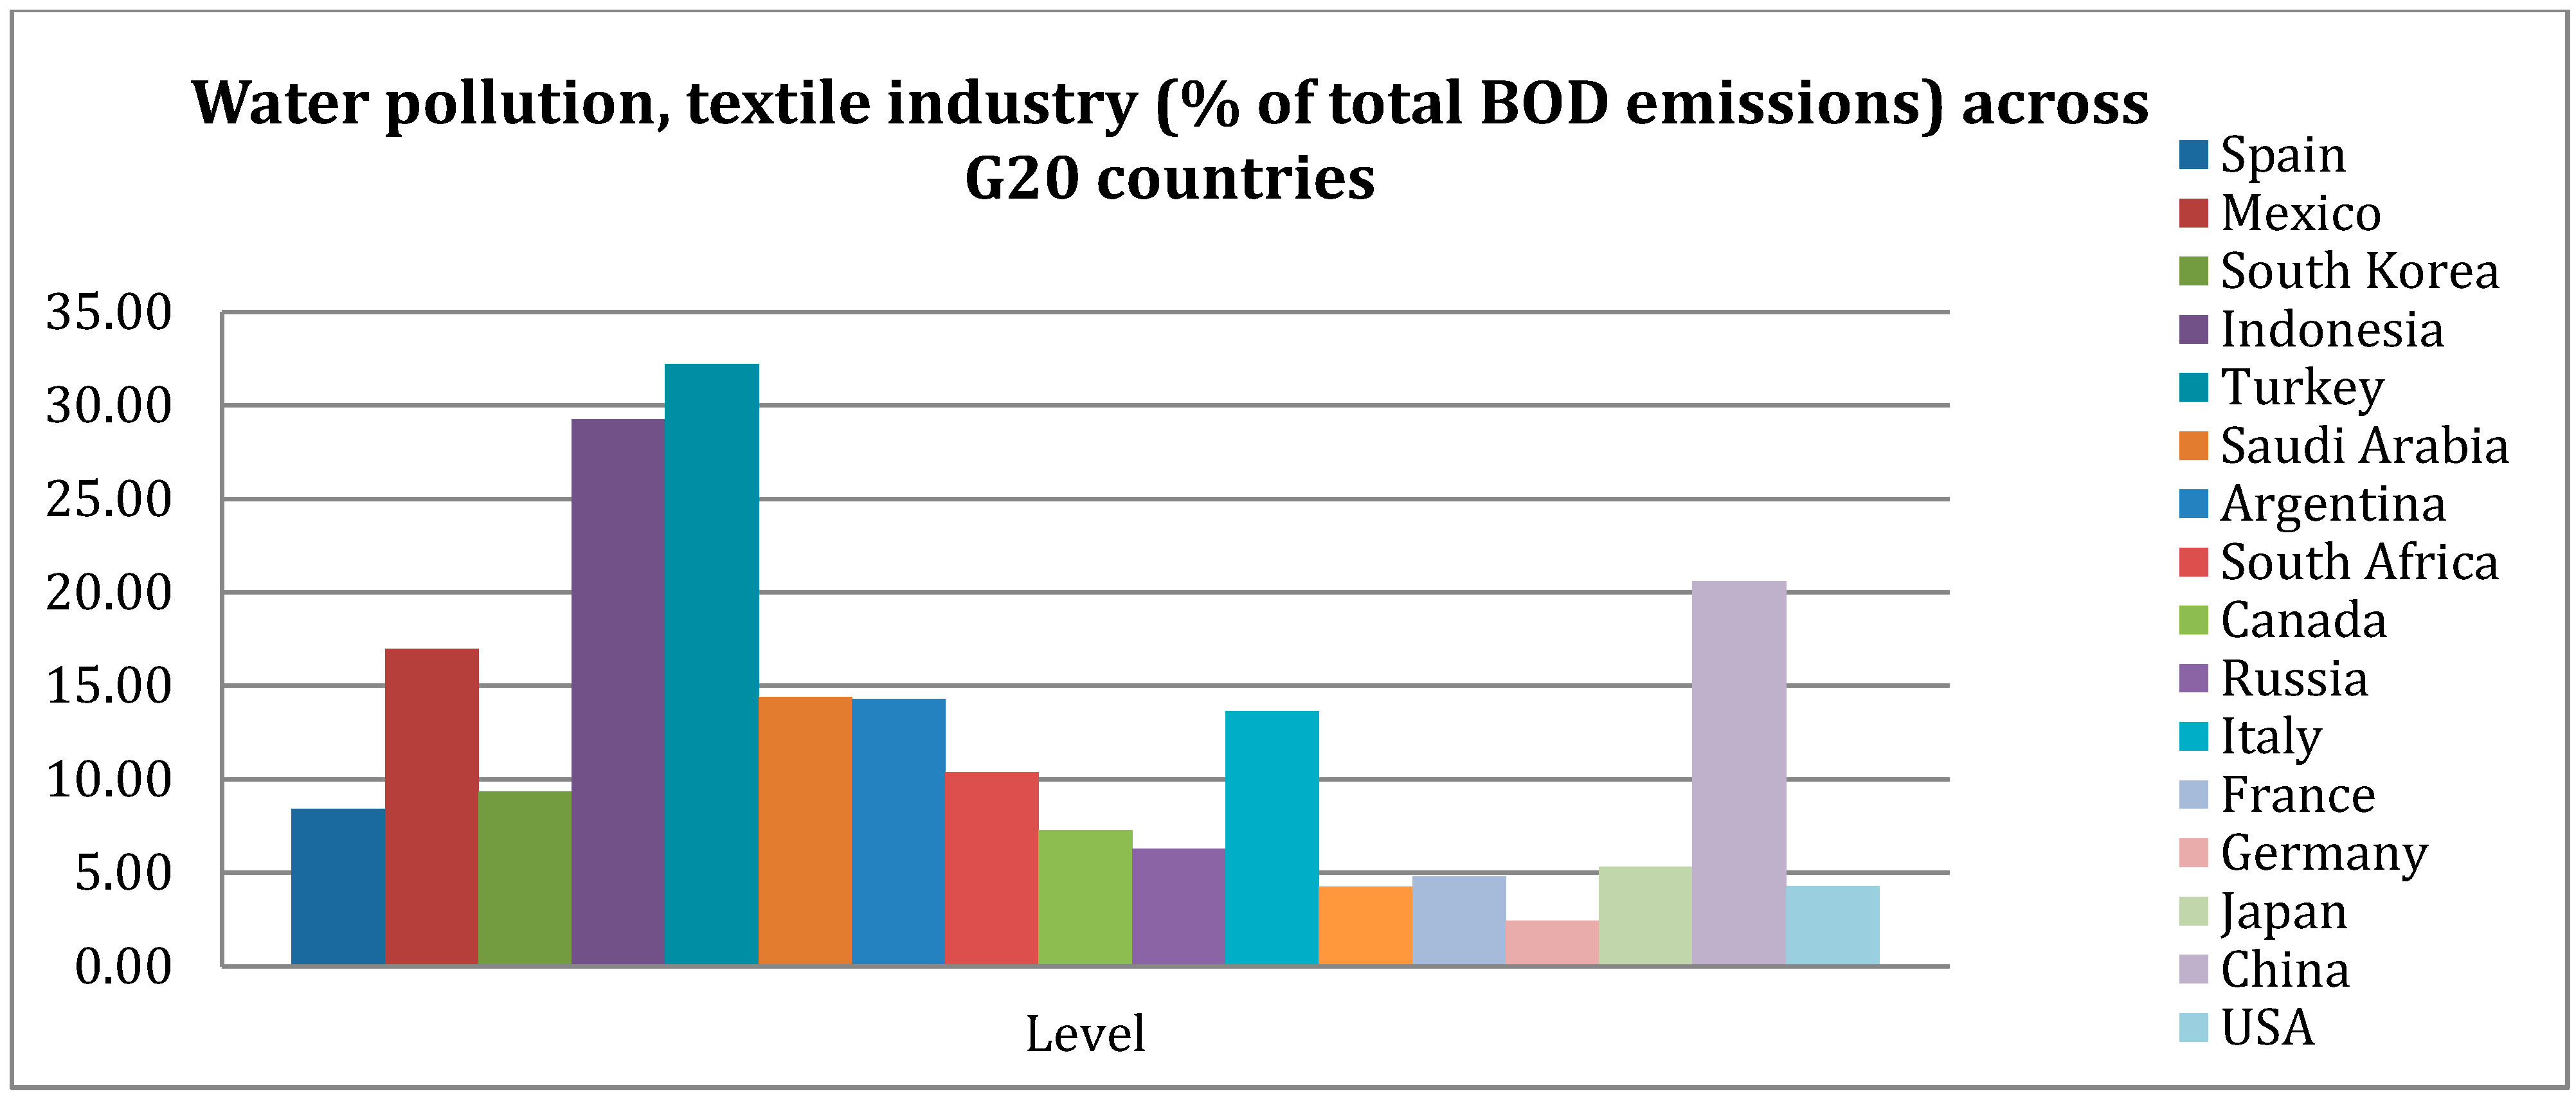
China, the USA and Russia are the biggest emitters of organic water pollutants (BOD) in the world, while Poland and Romania take the first two positions in Eastern Europe. The textile industry is one of the main contributors to water pollution, causing more than 20% of the registered levels of water pollution in countries like Turkey, Indonesia and China (among the G20 group of countries). In Eastern Europe, the percentage of total water pollution that is caused by the textile industry is lowest in the Slovak Republic, Czech Republic and Poland, while in Macedonia, the textile industry is guilty of contributing 44% to this phenomenon. The good news is that compared to the levels achieved in 1990, most Eastern European countries managed to decrease water pollution caused by the textile industry. The only exceptions are Romania (+4.59% as compared to 1990), Bulgaria (+17.24%) and Macedonia (+28.11%), which registered increases in this phenomenon.
Given the controversy created by the textile industry’s contribution to pollution at a global level, this paper forecasts the trend of the total emissions of organic water pollutants, as well as of the textile industry’s contribution to pollution over the next decade for the two Eastern European countries included in the analysis, i.e., the top polluters Poland and Romania. Predictions made with the Holt–Winters forecasting model reflect a continuous decrease of both pollution indicators in both countries, with a point estimate of the contribution of the textile industry to water pollution of 3.66% by the end of the year 2016 in Poland and of 2.35% by the end of 2017 in Romania. All models are correctly specified as attested by standard econometric tests, which allows us to confirm that both countries are headed towards almost complete elimination of pollution caused by the textile industry in the near future.
Corroborated by the fact that, in general, any action plan to foster sustainable development will need to include pollution reduction measures, we conclude that the Eastern European countries analyzed in this research are on their way towards a more sustainable industrial sector.


