1. Introduction
Numerous environmental issues have recently become considerably more threatening, such as global warming and toxic hazes. In particular, the energy crisis and carbon emissions have become two critical and universal concerns which have generated additional loads in the cycles within the natural ecosystem and restricted the sustainable development of the whole world [
1,
2,
3]. The manufacturing industry generates great financial fortunes, but also produces massive amounts of carbon emissions and waste resources. The problem of large amounts of carbon emissions and resource wastes caused by the manufacturing industry is a wide concern across the world, and how to reduce the carbon emissions and resource wastes of the manufacturing industry has become one of the primary questions in the modern manufacturing industry. The thorough study of technologies and methodologies for green product design has important theoretical meaning and practical value.
Reliability tends to be related to the safety of products and its operating performance under specified conditions [
4]. Reliability allocation aims at reasonably planning the reliability of individual elements to optimize the utilization of resources and ensure the design functions of products [
5,
6]. In other words, once a specified reliability target for a system has been determined, the reliability value of every subsystem must be appropriately calculated and balanced [
7,
8]. The quality of products has been greatly enhanced in modern society, and product complexity and functionality have also increased greatly with the enormous development of science and the tough competition of the market. Products are also now required to be beneficial to environmental protection [
9].
Before the processing and manufacturing of products, product quality design with assured product reliability apportionment is mandatory, and optimal reliability design for modern products is a complicated problem. Most traditional reliability optimal design methodologies cannot meet the requirements of long-term and responsible sustainable development for the modern product.
Firstly, most traditional reliability optimal design methodologies fail to consider the carbon emissions of products. Global warming is induced mainly by the growing amount of carbon emissions which can be processed with quantity calculations and have a major influence on the global climate balance [
10,
11]. To realize sustainable development, every country is now trying to implement policies for the reduction of carbon emissions. Unfortunately, sustainable product development is overlooked by conventional reliability apportionment theorists, and previous studies on carbon emissions mainly focused on carbon emissions and climate change, emission calculations, emission decomposition factors, and emissions projections [
12], and the field combining carbon emissions and product reliability apportionment is under-researched.
For instance, Jung et al. [
13] performed an investigation of the effect factors for carbon emissions and provided a case study of a college campus. Robinson et al. [
14] revealed that carbon emissions increased more and more if the velocity of the engine increased and the load of the engine improved. Shi and Zhao [
15] suggested that carbon emission reduction should highlight how to dominate the size of the economy and how to increase the energy density. Wang et al. [
16] proposed that we would have the confidence to achieve the goal of emission reduction related to energy consumption if a series of necessary and reasonable actions were taken. Most scholars did not adequately take carbon emissions into consideration when they were allocating the reliability for the subsystems included in products.
It is universally acknowledged that optimal reliability design is a key step for the preliminary design of important and high-technology products. This has a significant influence on a product’s carbon emissions. Failures of important and high-technology products have a latent influence on the physical security, economic profits, and the harmony between human beings and nature. Hence, product failure is an inevitable aspect of optimization design based on reliability. Usually, the effect of product failure is measured by the failure frequency and failure severity [
17,
18], and some scholars recently [
19,
20,
21,
22,
23] handled the failure effect in product reliability optimal design with risk priority number (RPN) information produced by the qualitative analysis and quantitative calculation of failure mode effects analysis (FMEA). FMEA is defined as an analysis model to recognize various failure modes occurring in a system and the corresponding impacts on the whole product function. It has been widely employed to guarantee the safety and functionality of different domains, but it has two defects. (1) Product failure has a crucial influence on the design and development of products, but the relationship between the product failure analysis and carbon emissions is neglected. Once a product fails, the malfunctioned subsystem would be repaired or dumped, which will result in additional carbon emissions. The amount of carbon emissions caused by these product failures is determined by the failure severity, failure frequency and carbon emissions of the relative subsystems in processing; (2) FMEA classifies product severity and product failure occurrence by crisp numbers, but they cannot reflect and deal with the uncertainty data.
In addition, modern products usually have several functions that are facilitated by the mutual correlations among subsystems to satisfy variable customer demands. The subsystem with a high correlation degree is more important than the subsystem with a low correlation degree. The former should be apportioned with higher reliability than the latter. Products with optimal reliability design contain many different subsystems and the correlations among them are abstract and complex, so the grey correlation analysis is often used to determine the subsystem weight given their mutual correlations [
24,
25,
26,
27]. For many engineering problems, such as observation distortion, resource limitations, system complexity, and so on, it is difficult to collect sufficient information at the early design phase which tends to cause uncertainty in modeling real industrial products. Therefore, product designers often need to manage the treatment of all kinds of uncertainties in reliability optimal design [
28,
29,
30,
31]. Bayesian models and fuzzy theories are basic approaches for handling uncertainties [
32,
33,
34]. Bayesian models rely on subject-reported uncertainty which can result in illogical calculation [
35]. Fuzzy theories require product designers to determine the optimal membership functions in the early design stage, but this is impossible in engineering applications. To solve these problems, interval analysis has been proposed [
36]. Lu et al. [
37] applied interval analysis to the use and management of land resources containing multifarious uncertainties; the numerical example of Suzhou illustrated its advantages in reliability optimal design with uncertainties. Wang et al. [
38] pointed out that the introduction of interval numbers into the product reliability redundancy optimization in the product concept design phase was of important practical value to speed up the product development and reduce the economic cost of product engineering. In order to reasonably conduct product reliability analysis and optimal design, interval analysis is often combined with mixed uncertainty, probability, fuzzy theory, and grey system theory in the optimal reliability design [
24,
39,
40].
Thus, it can be concluded that, to reduce the carbon emissions and promote the sustainable development of the manufacturing industry, the problems discussed above in the traditional reliability optimal design methods must be solved. Therefore, carbon emissions brought about by product failures, uncertainty, and correlation among subsystems all need to be considered in modern product reliability optimal design. Thus, a novel reliability optimal design model with interval product failure analysis and interval grey correlation analysis is proposed in this paper.
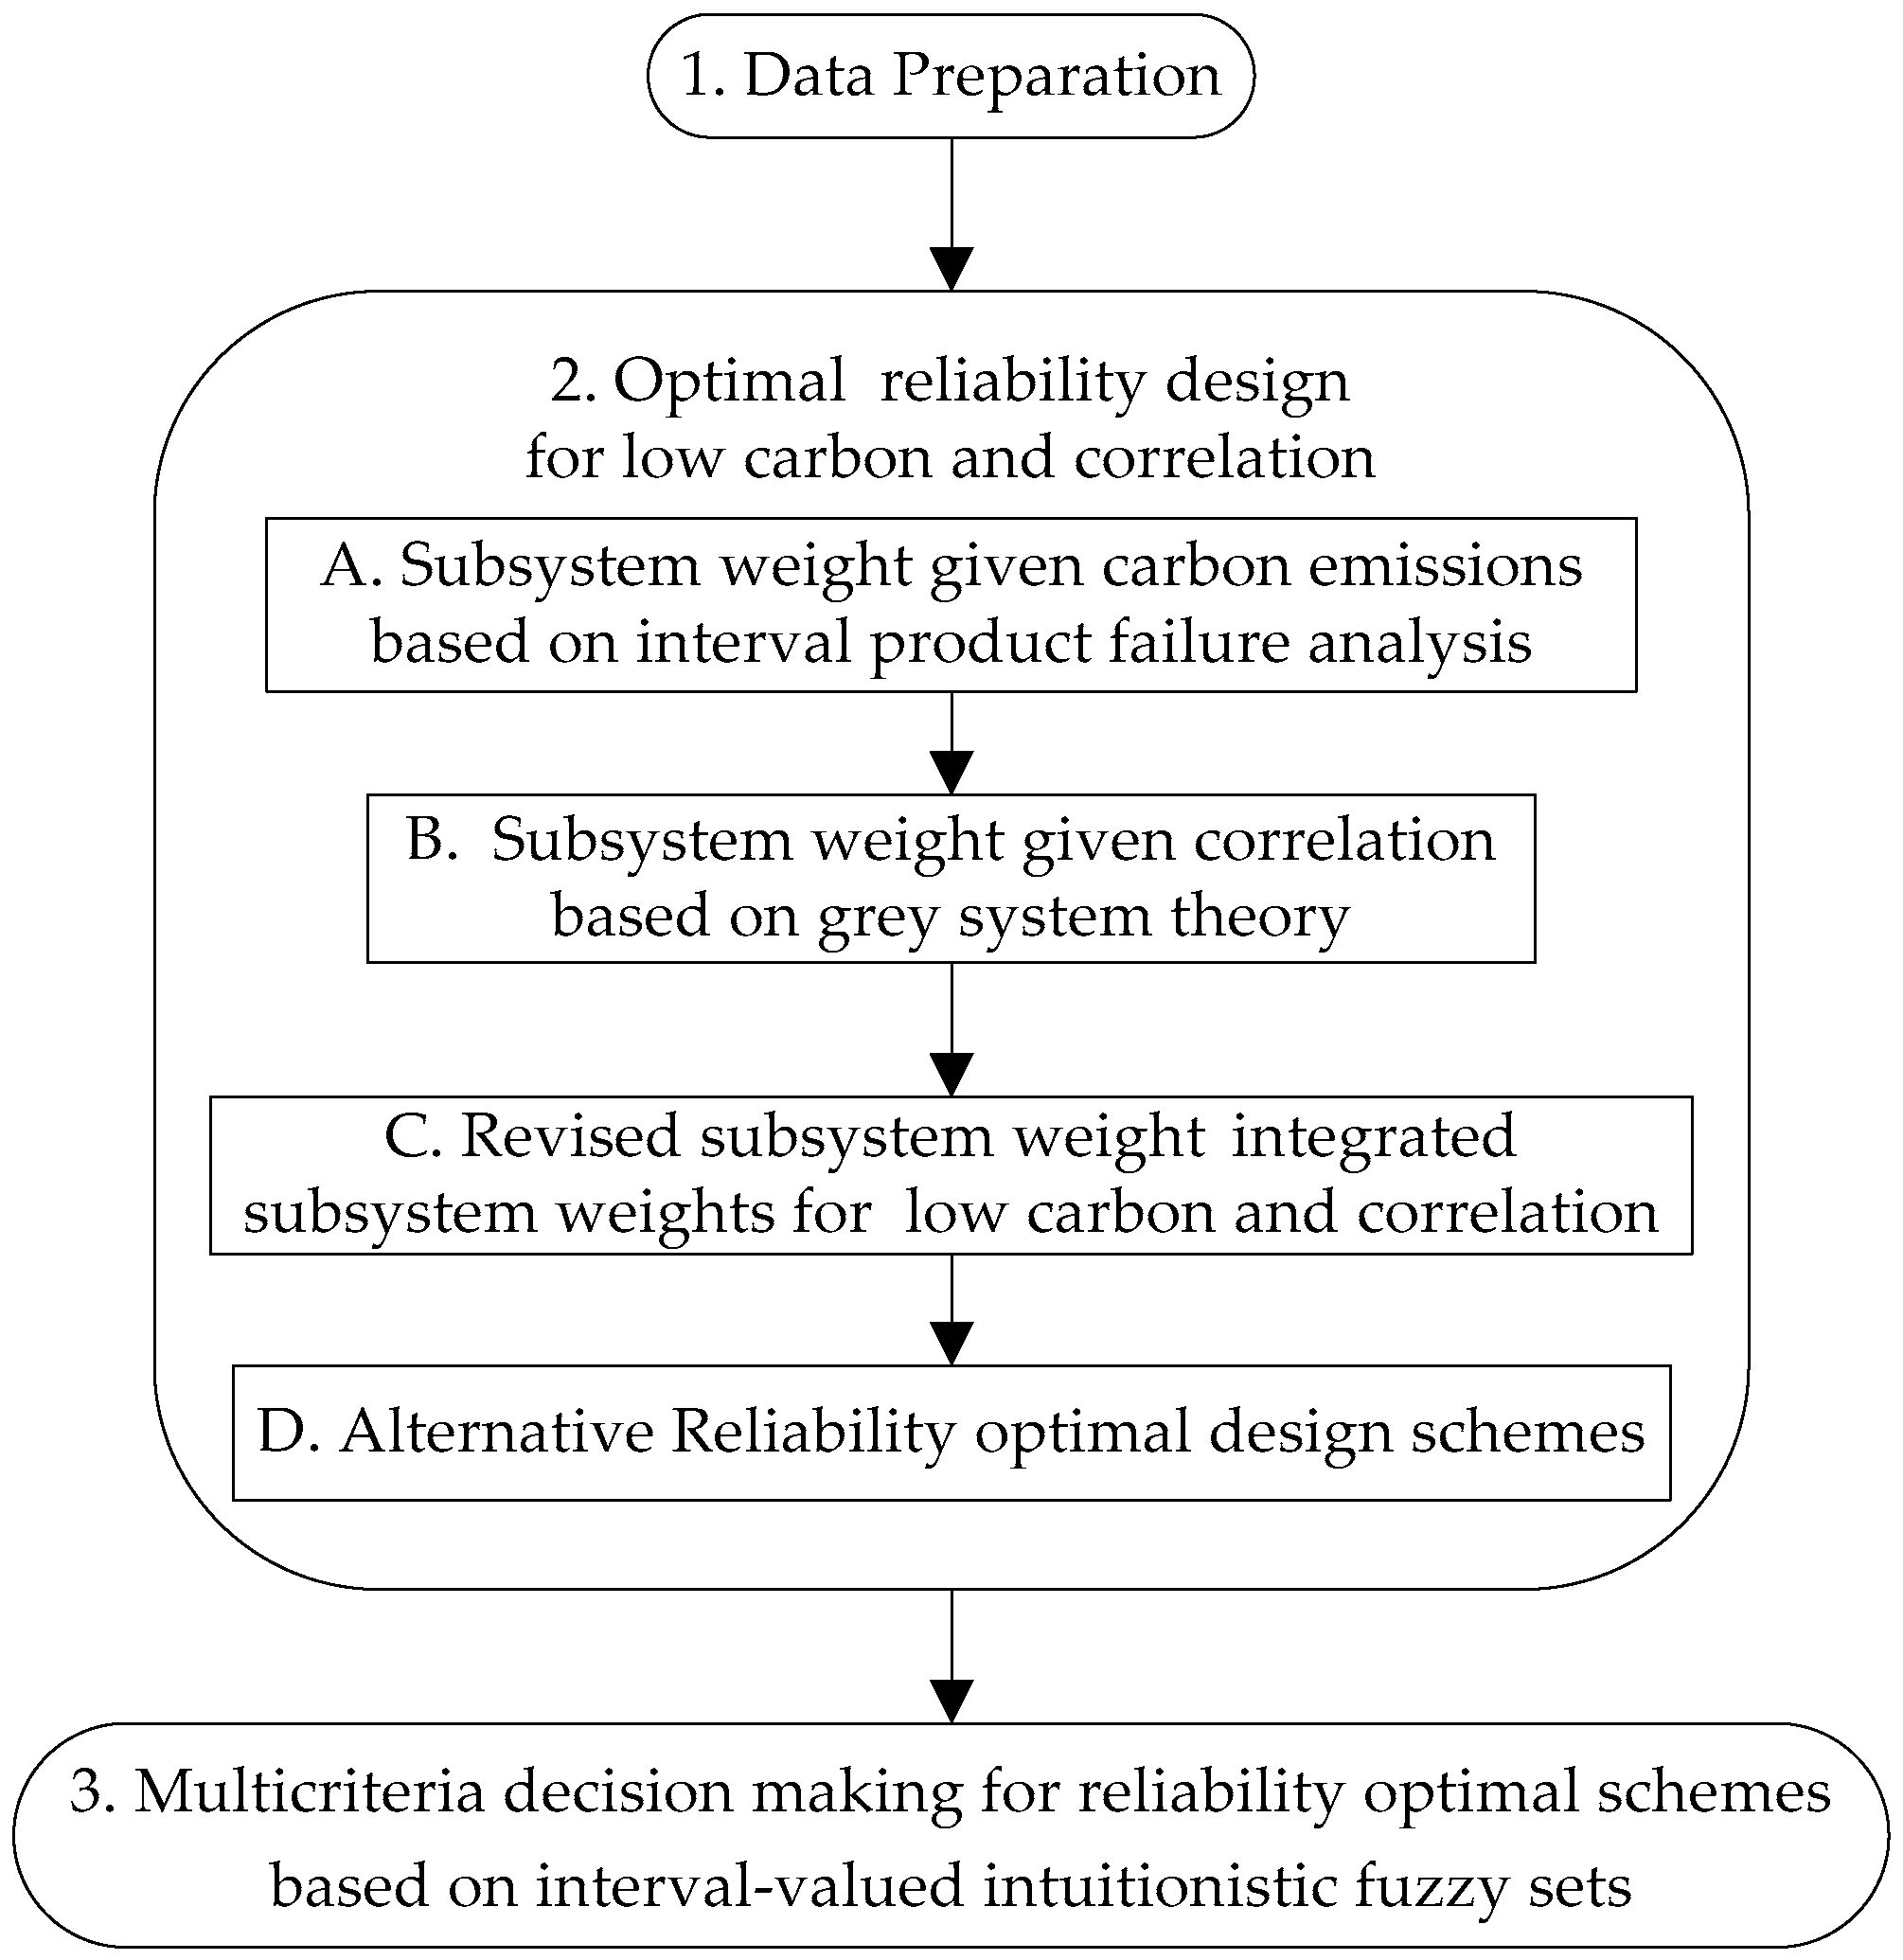
This paper has four sections. In the next section, the framework and detail operators of the proposed methodology are described. In
Section 3, the superiority and rationality of the proposed model are verified by the case study of a modern CNC lathe.
Section 4 presents a summary and the future development directions of the proposed method.
3. Case Study
3.1. Low Carbon-Oriented Reliability Apportionment
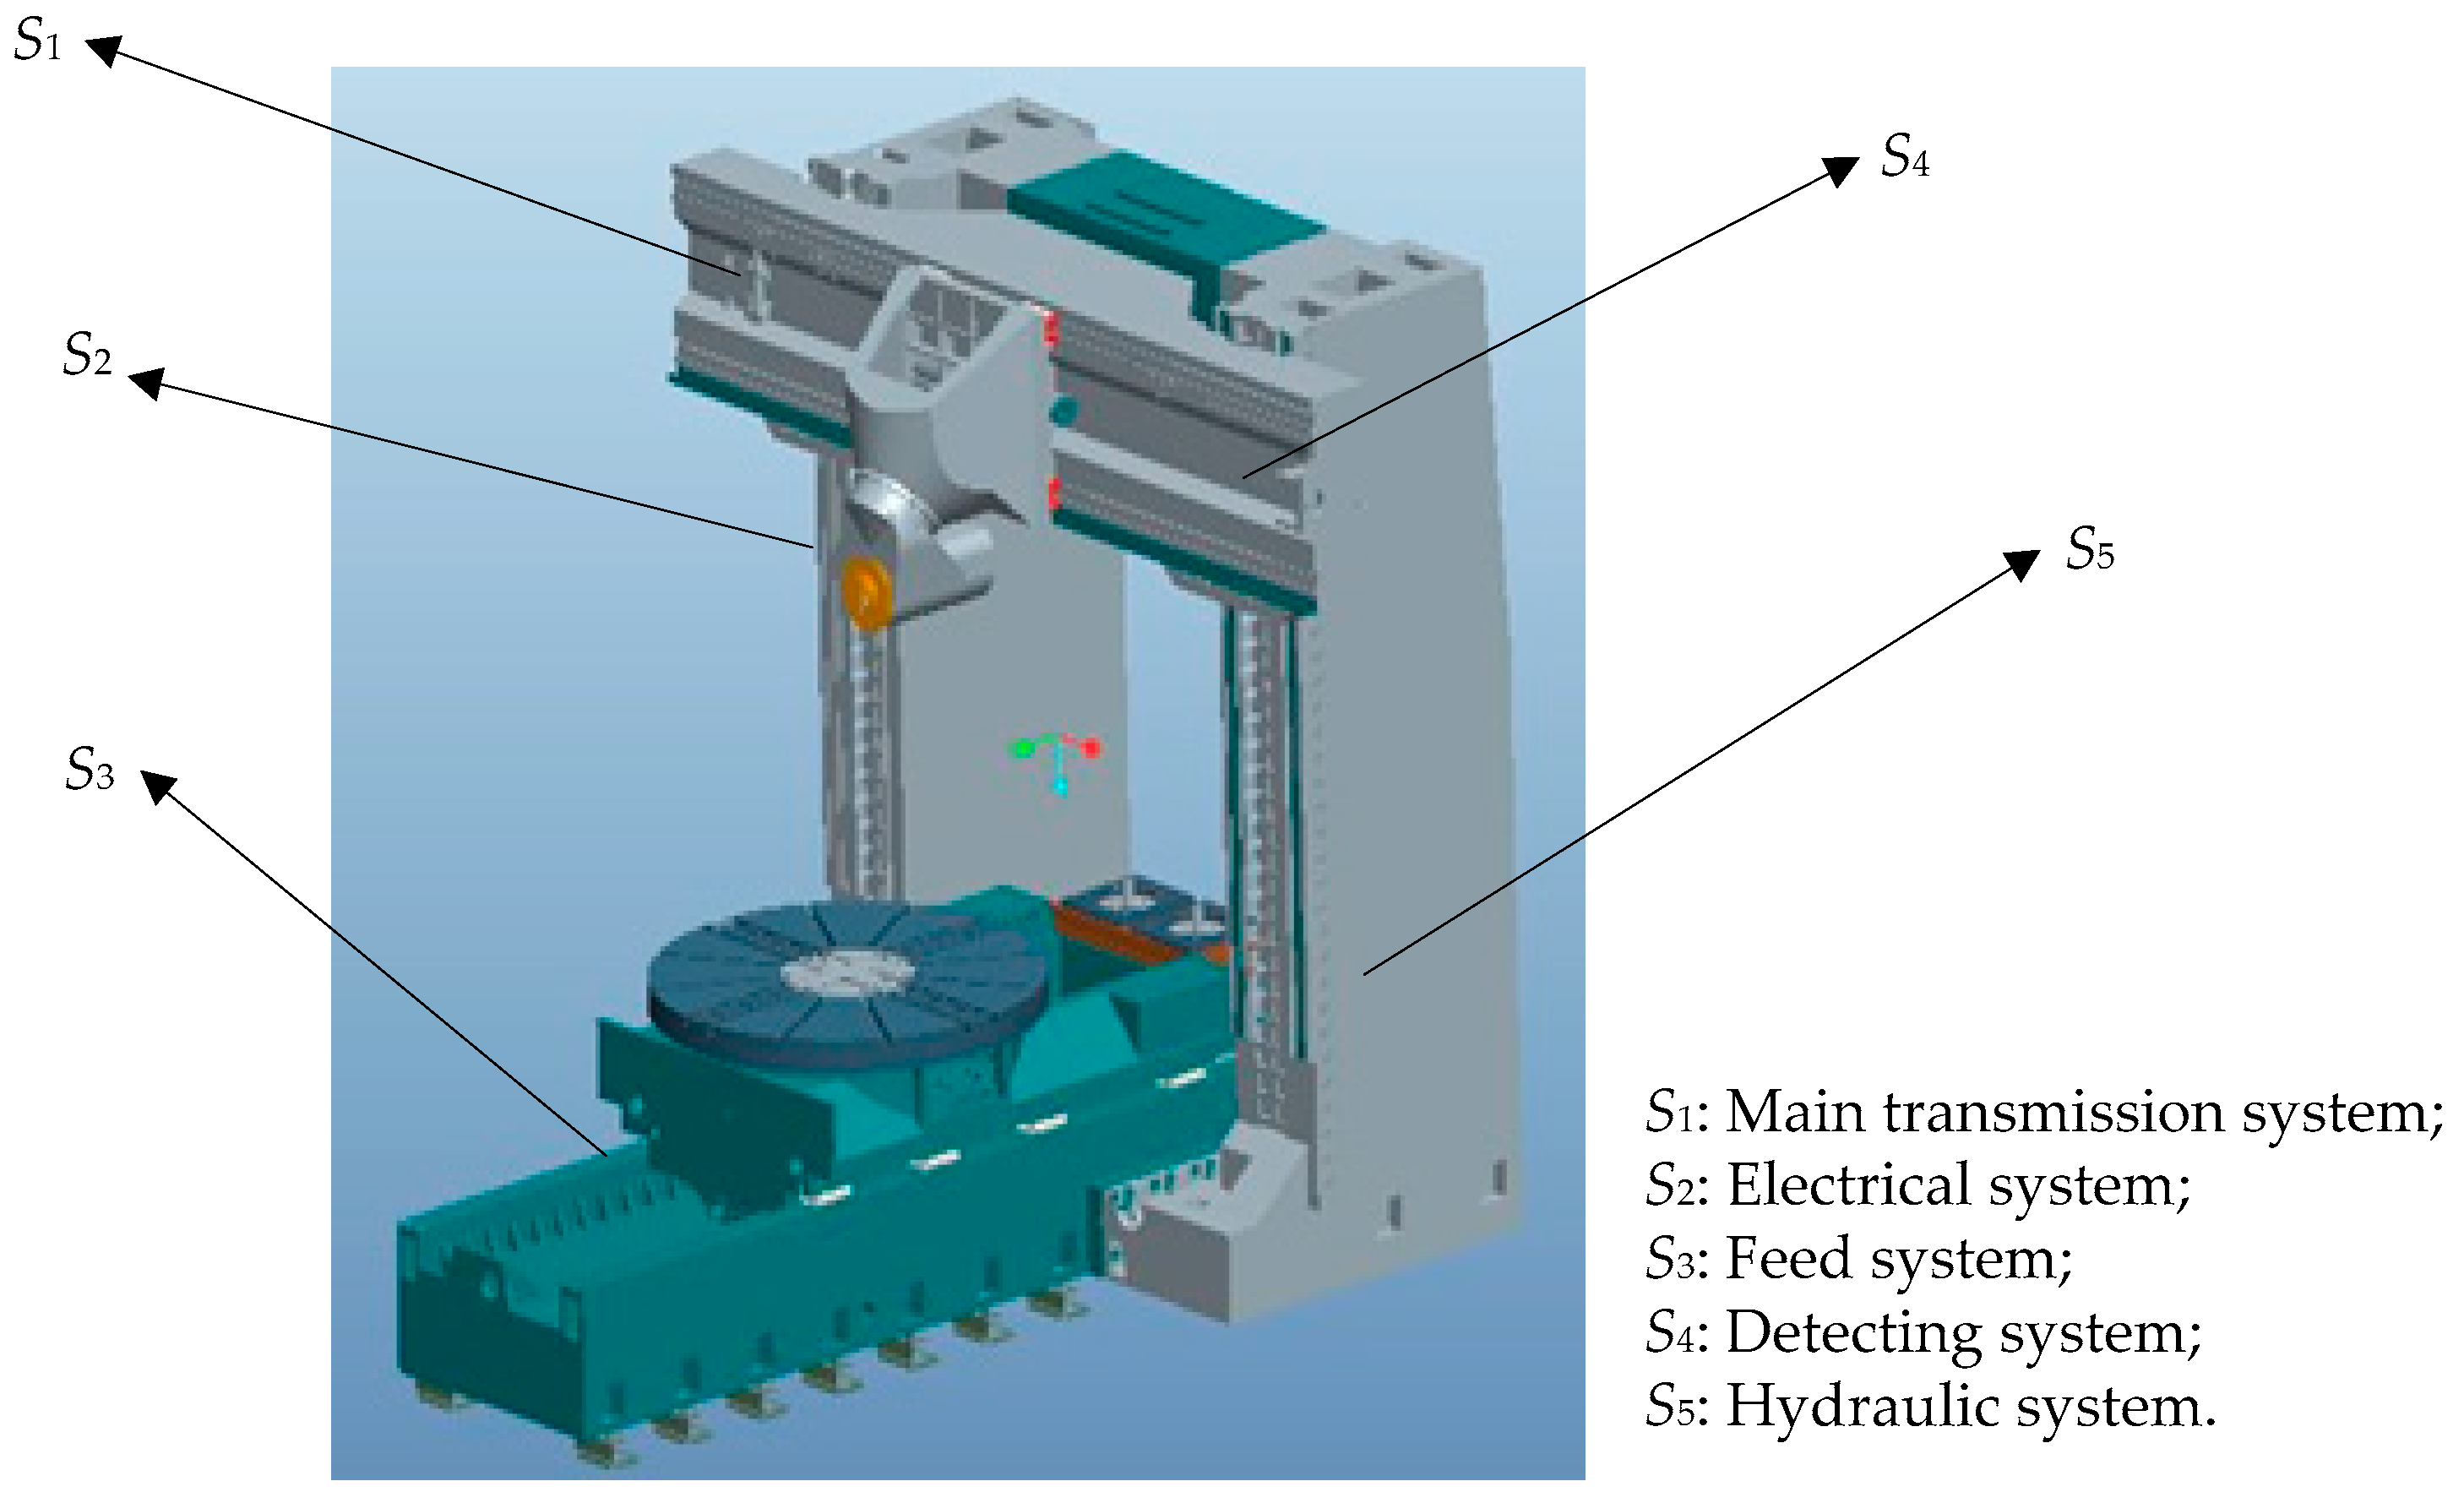
In this section, the numerical example of a computerized numerical controlled (CNC) lathe is presented to demonstrate the potential application of the proposed method. CNC lathes are widely used in the manufacturing industry. In particular, precise and advanced CNC machines account for 65% of the whole equipment investment. Hence, the investigation of CNC lathes for the optimal reliability design is very important [
19,
20,
45]. The target reliability for the vertical CNC lathe is required to be 0.875. As shown in
Figure 2, it is divided into five subsystems. They are: the main transmission system (
S1), the electrical system (
S2), the feed system (
S3), the detecting system (
S4), and the hydraulic system (
S5); The main components and parts of these subsystems are shown in
Table 2.
Table 3 shows the improved product failure analysis for carbon emissions of the vertical CNC lathe.
The interval carbon emissions for product failure of the ith subsystem and the interval vector of subsystem carbon emissions for product failure H can be obtained with the use of Equations (1)–(6). Let v be 0.2, 0.4, 0.6 and 0.8, respectively. Then, the defuzzified vector of subsystem carbon emissions for product failure, H*, and the normalized vector of subsystem carbon emissions for product failure, w&, can be calculated by Equation (7).
H = ([660.8, 1054], [328.5360, 594.6420], [308.2320, 675.5800], [195.8580, 387.2580], [456.1460, 761.7720]).
H*(v = 0.2) = [739.4400, 381.7572, 381.7016, 234.1380, 517.2712];
H*(v = 0.4) = [818.0800, 434.9784, 445.1712, 272.4180, 578.3964];
H*(v = 0.6) = [896.7200, 488.1996, 528.6408, 310.6980, 639.5216];
H*(v = 0.8) = [975.3600, 541.4208, 602.1104, 348.9780, 700.6468];
w&(v = 0.2) = [0.3313, 0.1673, 0.1653, 0.1039, 0.2322];
w&(v = 0.4) = [0.3203, 0.1723, 0.1743, 0.1067, 0.2265];
w&(v = 0.6) = [0.3131, 0.1786, 0.1846, 0.1085, 0.2183];
w&(v = 0.8) = [0.3048, 0.1825, 0.1900, 0.1131, 0.2096].
3.2. Reliability Design Considering Correlation among Subsystems
Five experts were invited to give their assessment about the correlation degree among subsystems based on the interval grey system theory, and the evaluation data is listed in
Table 4. The first step is to calculate the interval grey evaluation matrix.
Let
v be 0.6. Based on
Table 1, the interval feature sequences about the subsystems of the CNC lathe and its defuzzified value can be obtained as
U = {[8.2, 9.6], [7.8, 8.4], [9.2, 9.9], [7.6, 9.0], [8.2, 9.6]} and
U* = {9.04, 8.16, 9.62, 8.44, 9.04}, respectively. The defuzzified sample evaluation matrix for the correlation among the CNC lathe subsystems can be calculated, as shown in
Table 5, and the absolute residual sequences are obtained as shown in
Table 6.
It can be known that
. Let the identification coefficient
be 0.5. From Equation (8), the correlation coefficients of the CNC lathe subsystems are obtained as shown in
Table 7.
With Equation (9), the correlation coefficient vector of the CNC lathe subsystems can be calculated as r = [0.3826, 0.8757, 0.4370, 0.8983, 0.4305]. From Equation (10), the normalized subsystem weight vector for reliability optimal design considering their correlations is obtained as wG(v = 0.6) = [0.1265, 0.2896, 0.1445, 0.2970, 0.1424]. Similarly, let v = 0.2, 0.4, and 0.8. Then we can obtain wG(v = 0.2) = [0.1575, 0.2351, 0.1792, 0.2657, 0.1625], wG(v = 0.4) = [0.1405, 0.2596, 0.1562, 0.2859, 0.1578], and wG(v = 0.8) = [0.1132, 0.3019, 0.1330, 0.3136, 0.1383].
3.3. Reliability Optional Schemes Considering Low Carbon and Correlation among Subsystems
From Equations (11) and (12), the low carbon-oriented reliability optimal design schemes, which are based on the product failure analysis for carbon emissions and interval grey correlation analysis for correlations among subsystems, can be obtained as shown in
Table 8.
3.4. Multiple Attribute Decision-Making for Reliability Apportionment Schemes
The product designer needs to select the optimal reliability design scheme from a series of options according to the attributes including the low carbon
B1, correlations and functions
B2, as well as the economic cost
B3. Take the optional schemes obtained in
Table 8 as objectives, the expert evaluation information for the decision-making of reliability optimal design is obtained, as shown in
Table 9.
The weighted averages of arithmetic and geometry of these optional reliability design schemes can be calculated with Equation (16) and (17), respectively.
ga(F1) = ([0.5203, 0.6282] [0.2866, 0.3075]), ga(F2) = ([0.5124, 0.6405] [0.2882, 0.3515]),
ga(F3) = ([0.4659, 0.5575] [0.3116, 0.3967]), ga(F4) = ([0.5038, 0.5993] [0.3146, 0.3919]);
gg(F1) = ([0.4990, 0.5998] [0.3094, 0.3925]), gg(F2) = ([0.4946, 0.6314] [0.2924, 0.3555]),
gg(F3) = ([0.4880, 0.5495] [0.3045, 0.3910]), gg(F4) = ([0.5061,0.5998] [0.2893, 0.3721]).
Then, the accuracy function of the optional schemes based on the two kinds of weighted averages are obtained with the Equations (18)–(21). They are shown as follows.
G(ga(F1)) = 0.6352, G(ga(F2)) = 0.6424, G(ga(F3)) = 0.5844, G(ga(F4) = 0.6077;
G(gg(F1)) = 0.6084, G(gg(F2)) = 0.6335, G(gg(F3)) = 0.5801, G(gg(F4) = 0.6214.
It can be found that the value of G(ga(F2)) is higher that these of G(ga(F1)), G(ga(F3)) and G(ga(F4)), and the value of G(gg(F2)) is higher that these of G(gg(F1)), G(gg(F3)) and G(gg(F4)). Therefore, the optional scheme F2 is the final reliability optimization design scheme.
4. Conclusions
With the improved product failure analysis for carbon emissions, the proposed method apportions high reliability to subsystems with high carbon emissions brought about by product failures. This method is beneficial in reducing the total carbon emissions of products. With the interval grey correlation analysis, the proposed method takes the correlations among subsystems into consideration and advocates to apportion high reliability to subsystems with a high degree of correlations. This is an important step to guarantee the functioning of the whole product. In addition, the uncertainties in reliability optimal design are handled by the adoption of interval numbers in these steps. Therefore, the proposed method is superior to most traditional reliability optimal design methods because it has taken the carbon emissions brought about by product failures, uncertainties, and correlations among product subsystems into account. Meanwhile, the process of interval numbers contains an important parameter, the caution indicator of the decision maker, which results in a series of reliability optimal design schemes. Given that the reliability optimal design is a MADM problem, the IVIFS is introduced to select the optimal reliability design scheme according to three attributes, including: low carbon, correlations and functions, and economic cost. Thus, the final optimal reliability design scheme is conductive to balance the carbon emissions, functioning and economic cost of products, and this is of great significance to promote the sustainable development of products. The superiority and rationality of the proposed method is illustrated by the case study of a vertical CNC lathe for reliability optimal design. The proposed method can be applied to more large-scale mechanical and electrical equipment, for instance, air separation machines, coal mining machines and vibrating screens, to reduce carbon emissions and promote the sustainable development of the total equipment manufacturing industry.
In addition, this proposed reliability optimal design method is not suitable for use in certain operating conditions without the accuracy and competency of subjective expert evaluation. Thus, the collection of qualified evaluation data is of great significance. In particular, compared with traditional optimal design, the proposed reliability optimal design is prone to causing inaccurate reliability optimal design results at the design phase without accurate expert evaluation. Furthermore, this method usually requires a large number of calculations. Given the efficiency and time costs, improving computational efficiency has become another urgent issue.


