Lead Detection in Polar Oceans—A Comparison of Different Classification Methods for Cryosat-2 SAR Data


Abstract
:1. Introduction
2. Data Sets and Study Areas
2.1. CryoSat-2 Data
2.2. Ground Truth Data
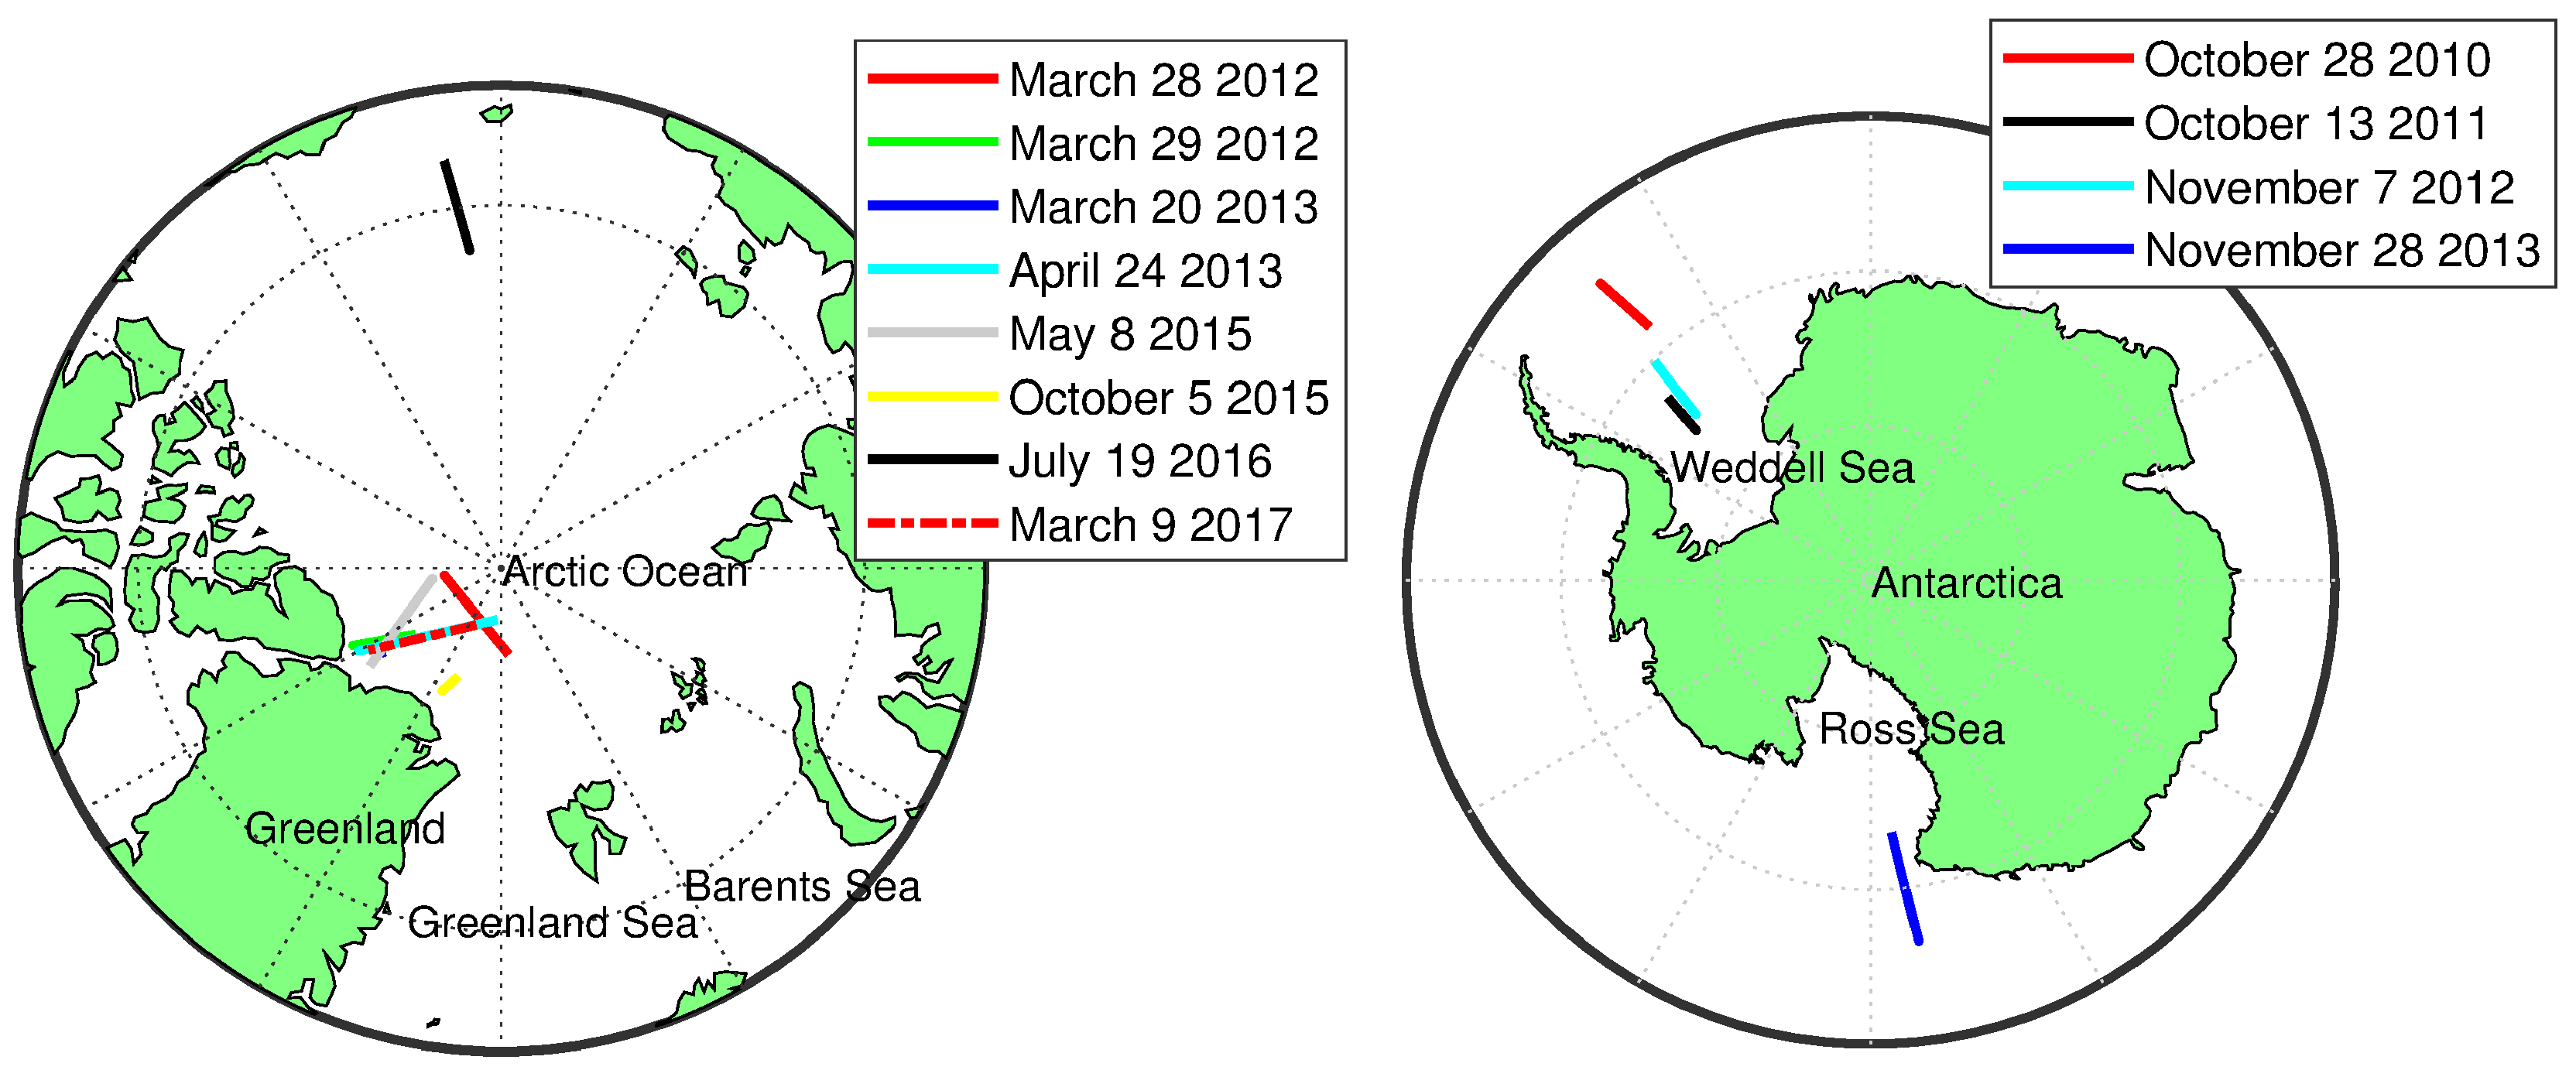
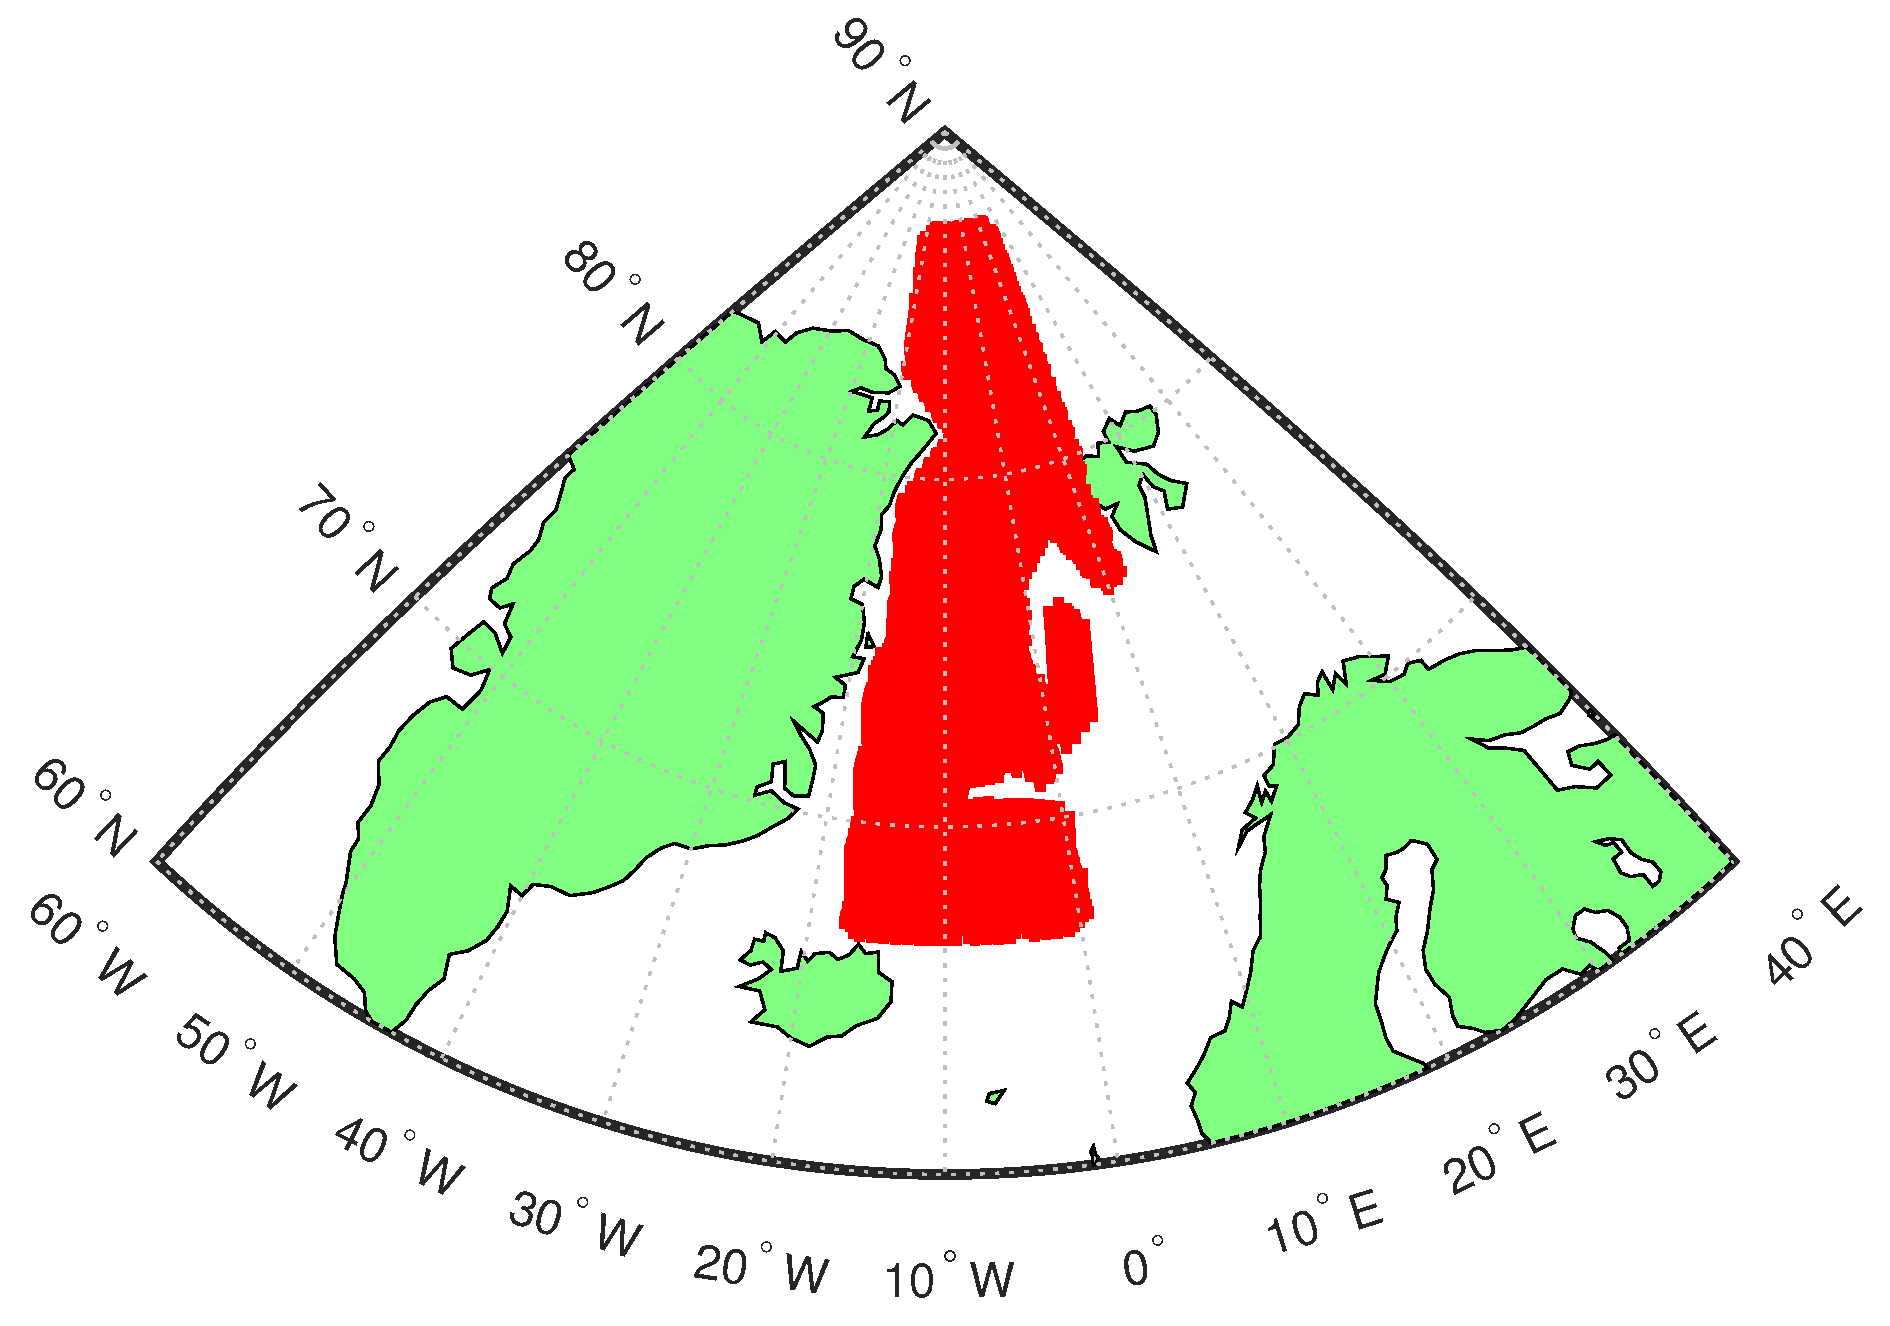
2.3. Flight Lines
3. Methodology
3.1. Maximum Power Classifier (MAX)
3.2. Multi-Parameter Classification Method (MULTI)
- Pulse Peakiness (PP): Defined as the ratio of the waveform maximum power to the accumulated power and also in this case scaled by the number of range bins. Larger values are indicative of the presence of a lead within the altimeter footprint.
- Stack Kurtosis (K): An additional measure of the peakiness of the range integrated stack power [26]. A high value suggests that the distribution is prone to an outlier, e.g., caused by the presence of a lead within the altimeter footprint.
- Stack Standard Deviation (SSD): This value provides information to the variation of surface backscattering power with incidence angle [26]. Therefore, small values of SSD are used as an indicator for the presence of leads.
- Modified PP (two parameters and to consider the bins “left” and “right” of the maximum power bin): This is meant to disregard lead observations which are not at nadir. The assumption here is that off-nadir lead reflections do no show as specular a reflection as an observation at nadir.
- Sea-ice concentration: This is used as a coarse discrimination between ocean and ice areas. Only observations in areas with significant sea-ice concentration (>70%) are allowed as leads in case all other conditions are met.
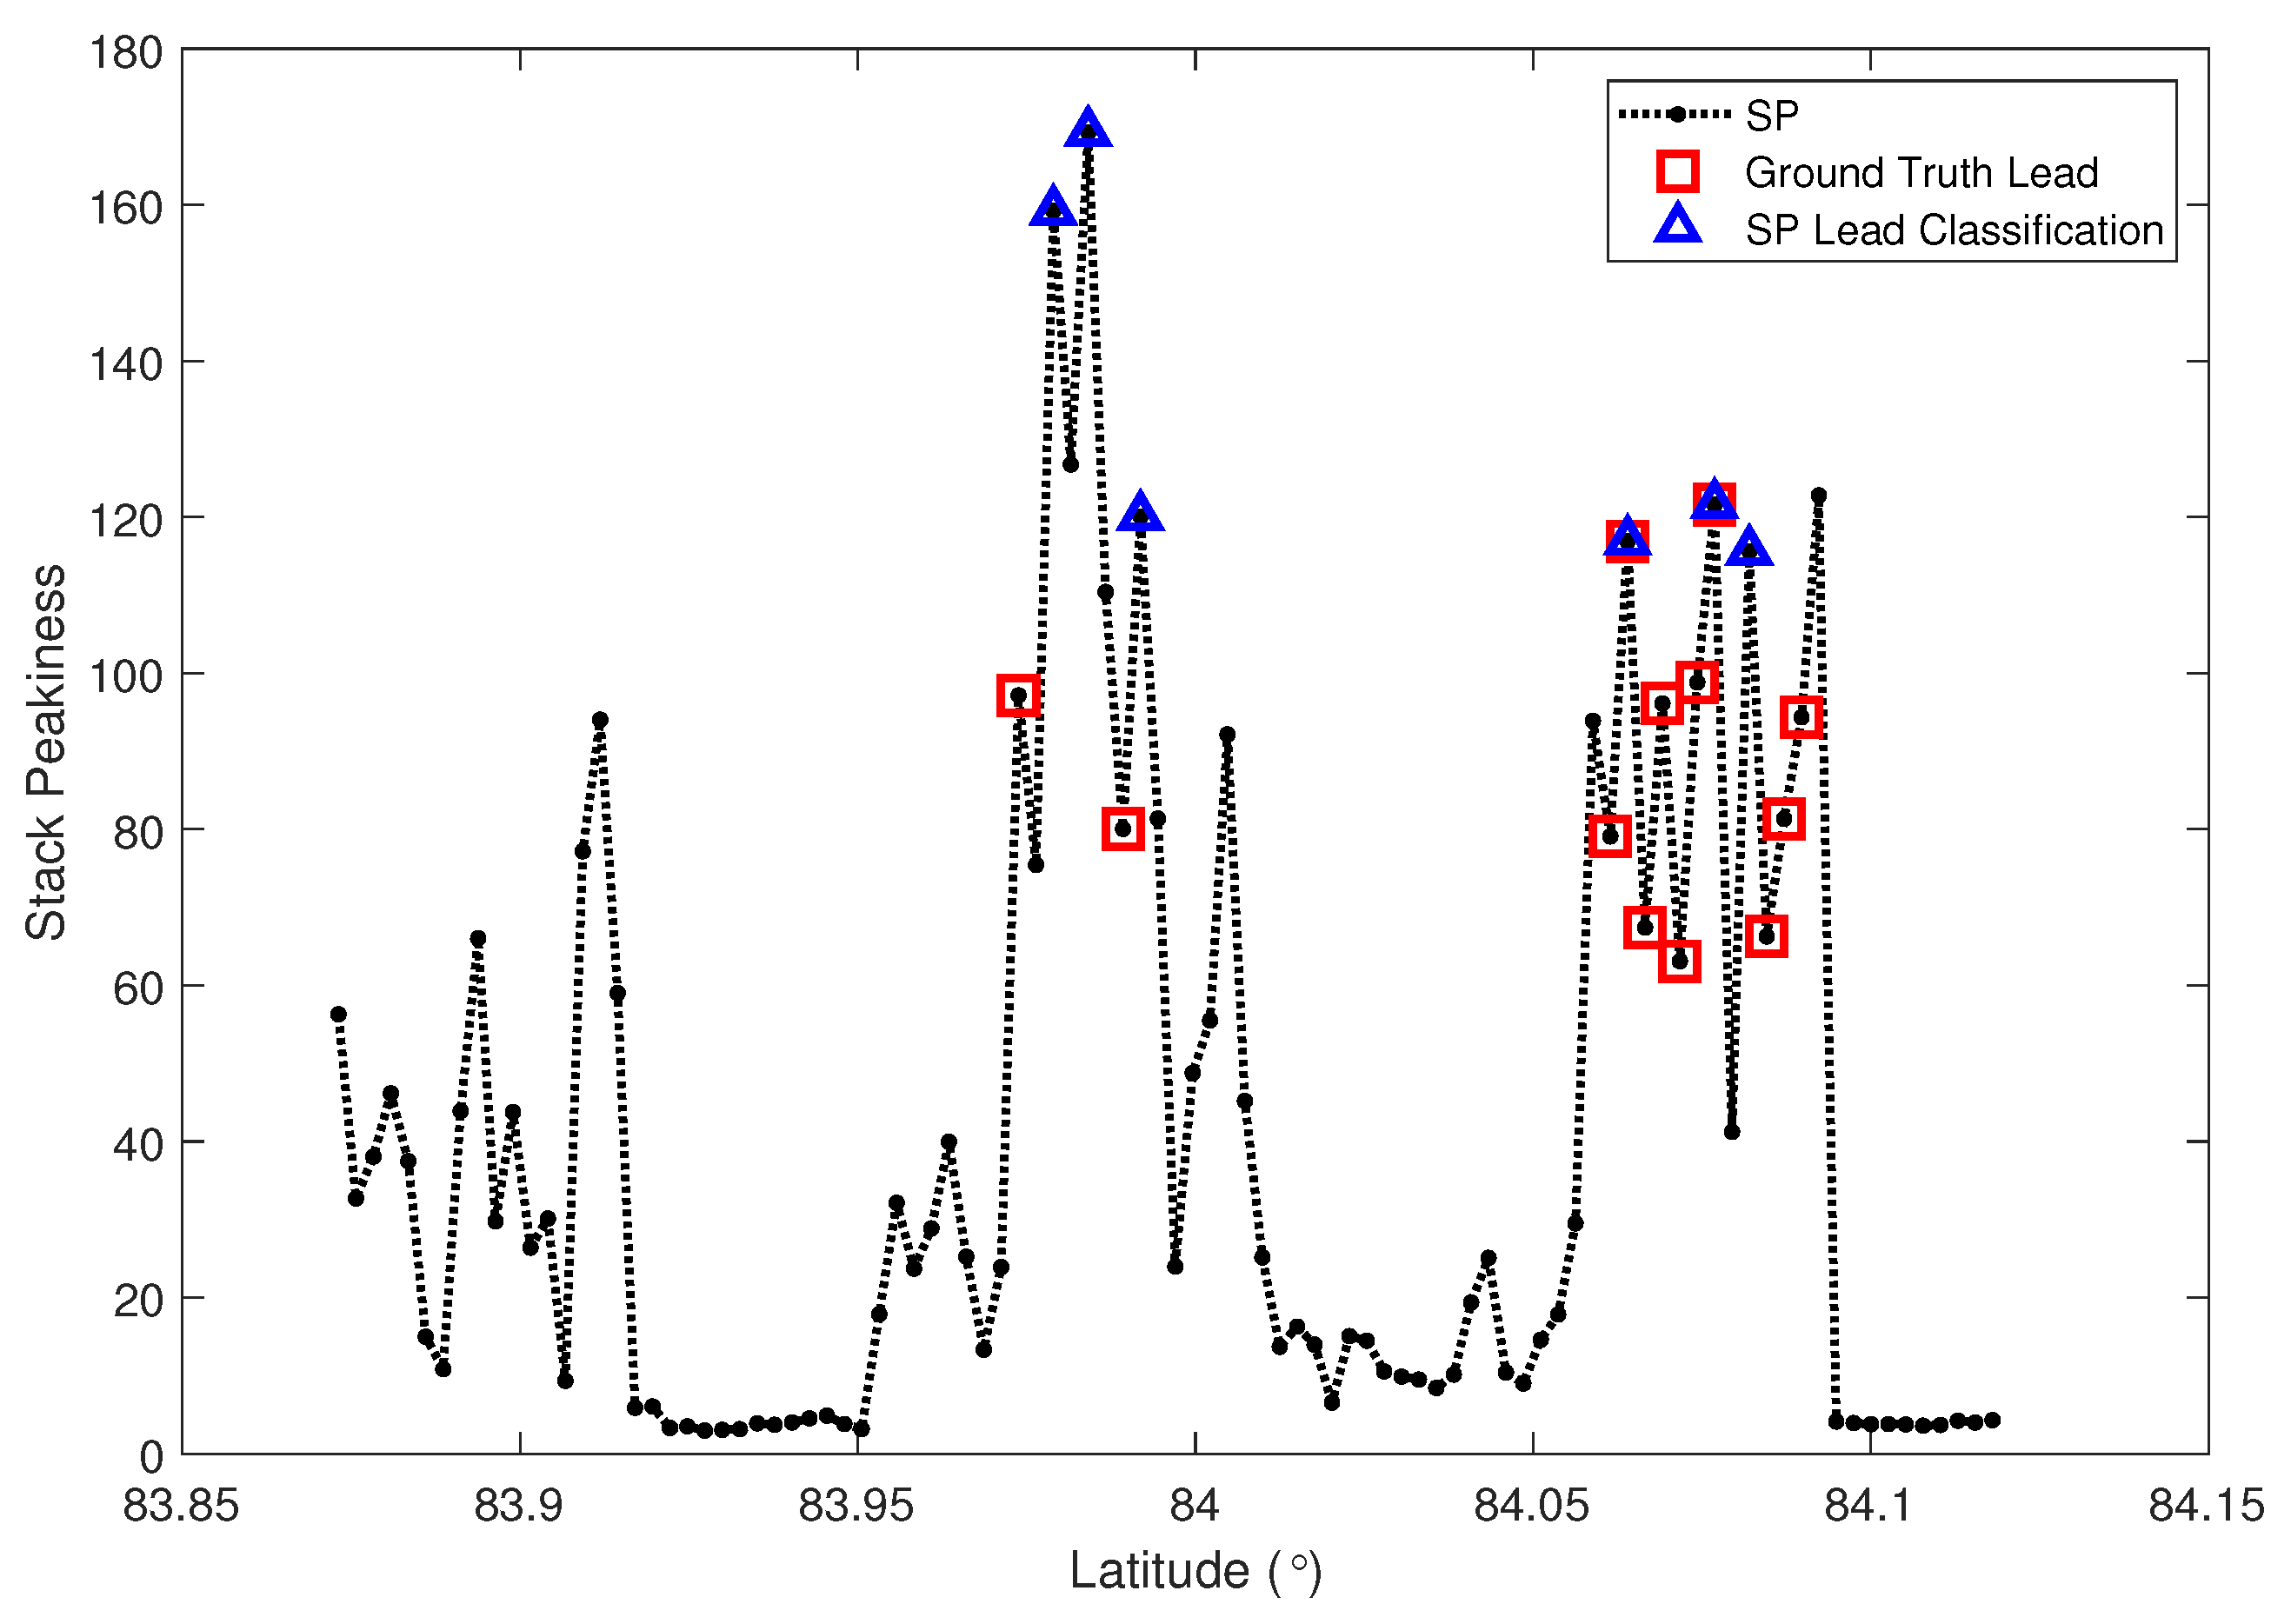
3.3. Stack Peakiness Classifier (STACK)
3.4. Unsupervised Classifier (UNSU)
- Waveform maximum (Wm): As described in Section 3.1, the maximum power can be used to characterize the surface below the satellite altimeter.
- Trailing edge decline (Ted): The Ted is a characterization of the trailing edge of the waveform, i.e., from the maximum power range bin to the last range bin, by means of a fitting to a power series model. A rapid decay (low value) would be associated to the typical waveform shape of a lead.
- Waveform noise (Wn): In the context presented here, the Wn represents the MAD of the residuals to the fitting of the power series model. Very small values for specular lead type returns are expected.
- Waveform width (Ww): The amount of range bins with their power greater than 1% of the waveform maximum is used to determine the waveform width. A small waveform width is expected in the presence of a lead.
- Leading edge slope (Les): The first waveform bin containing more than 12.5% of the waveform maximum power subtracted from the maximum power bin provides relative information regarding the Les. Again, low values are indicative of a lead surface.
- Trailing edge slope (Tes): Conversely, the Tes is obtained by a subtraction of the maximum waveform power bin from the last bin position containing more than 12.5% of the waveform maximum power. The characteristics of the Tes is similar to the Les for single peak waveforms, but it can also be used to identify strong multiple peaks.
3.5. Threshold Optimization
3.6. Ground Truth Image Classification
4. Results and Discussion
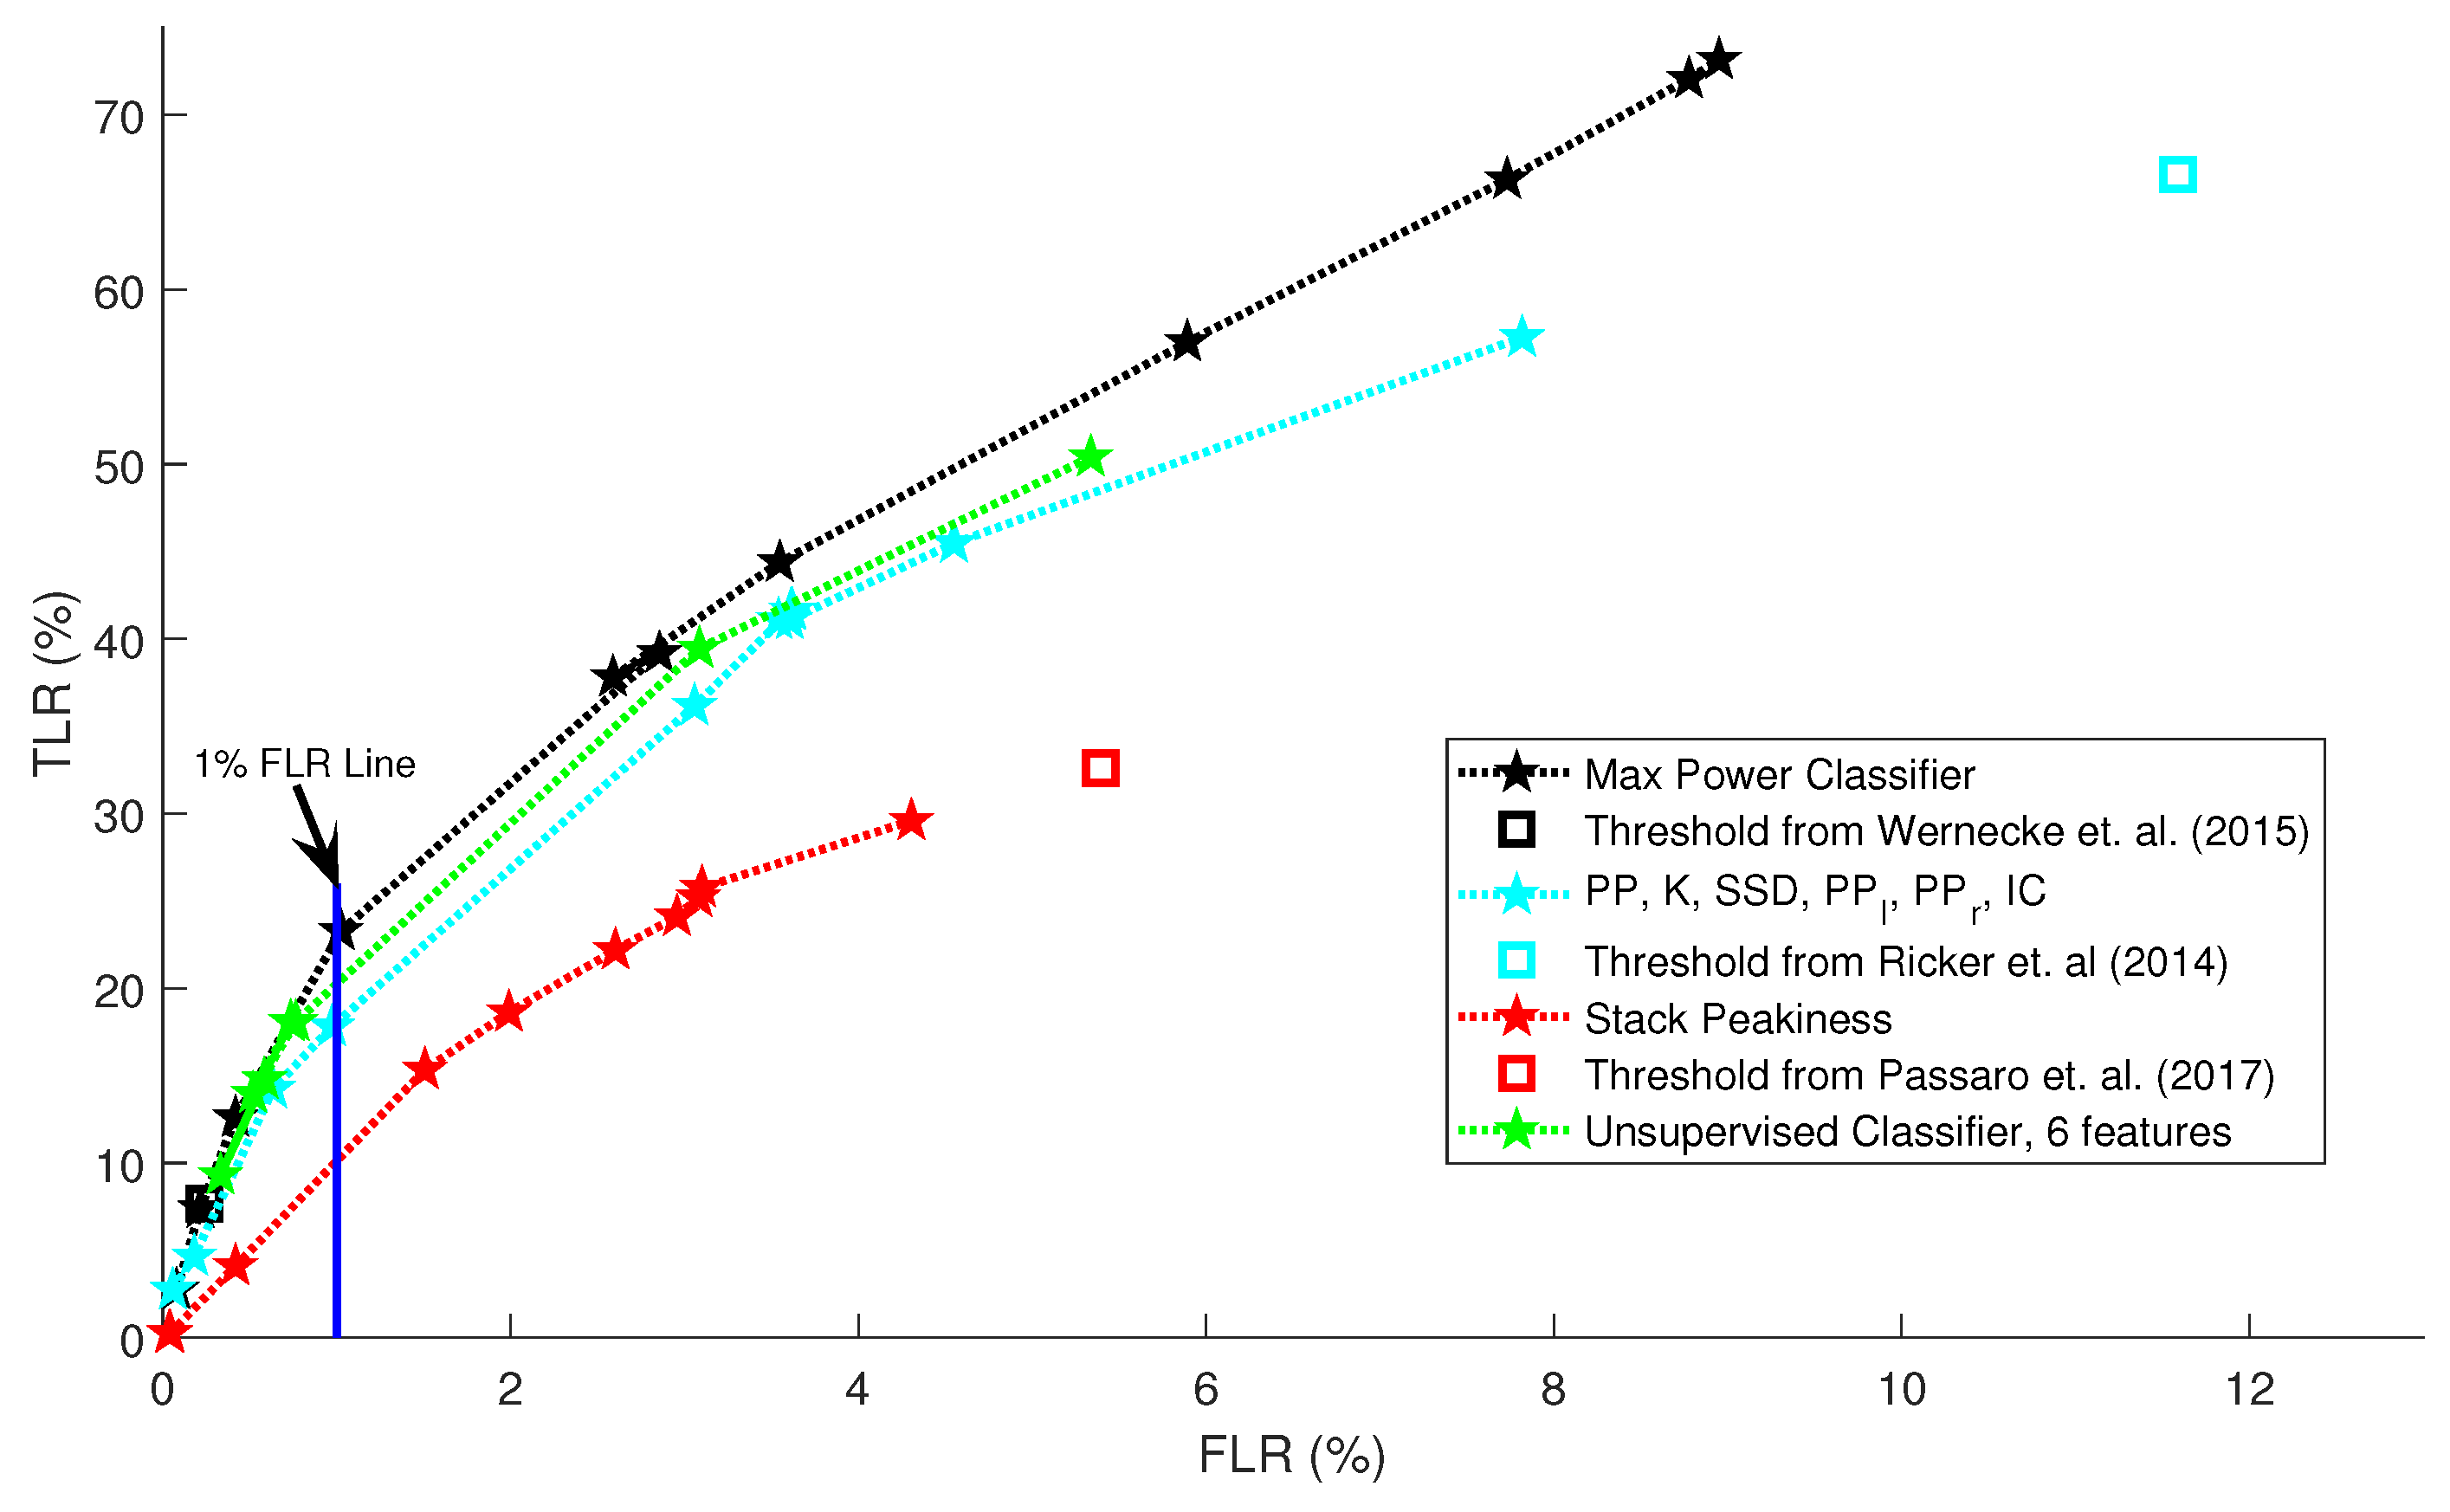
4.1. Quantitative Comparison between Altimeter Classification and Ground Truth
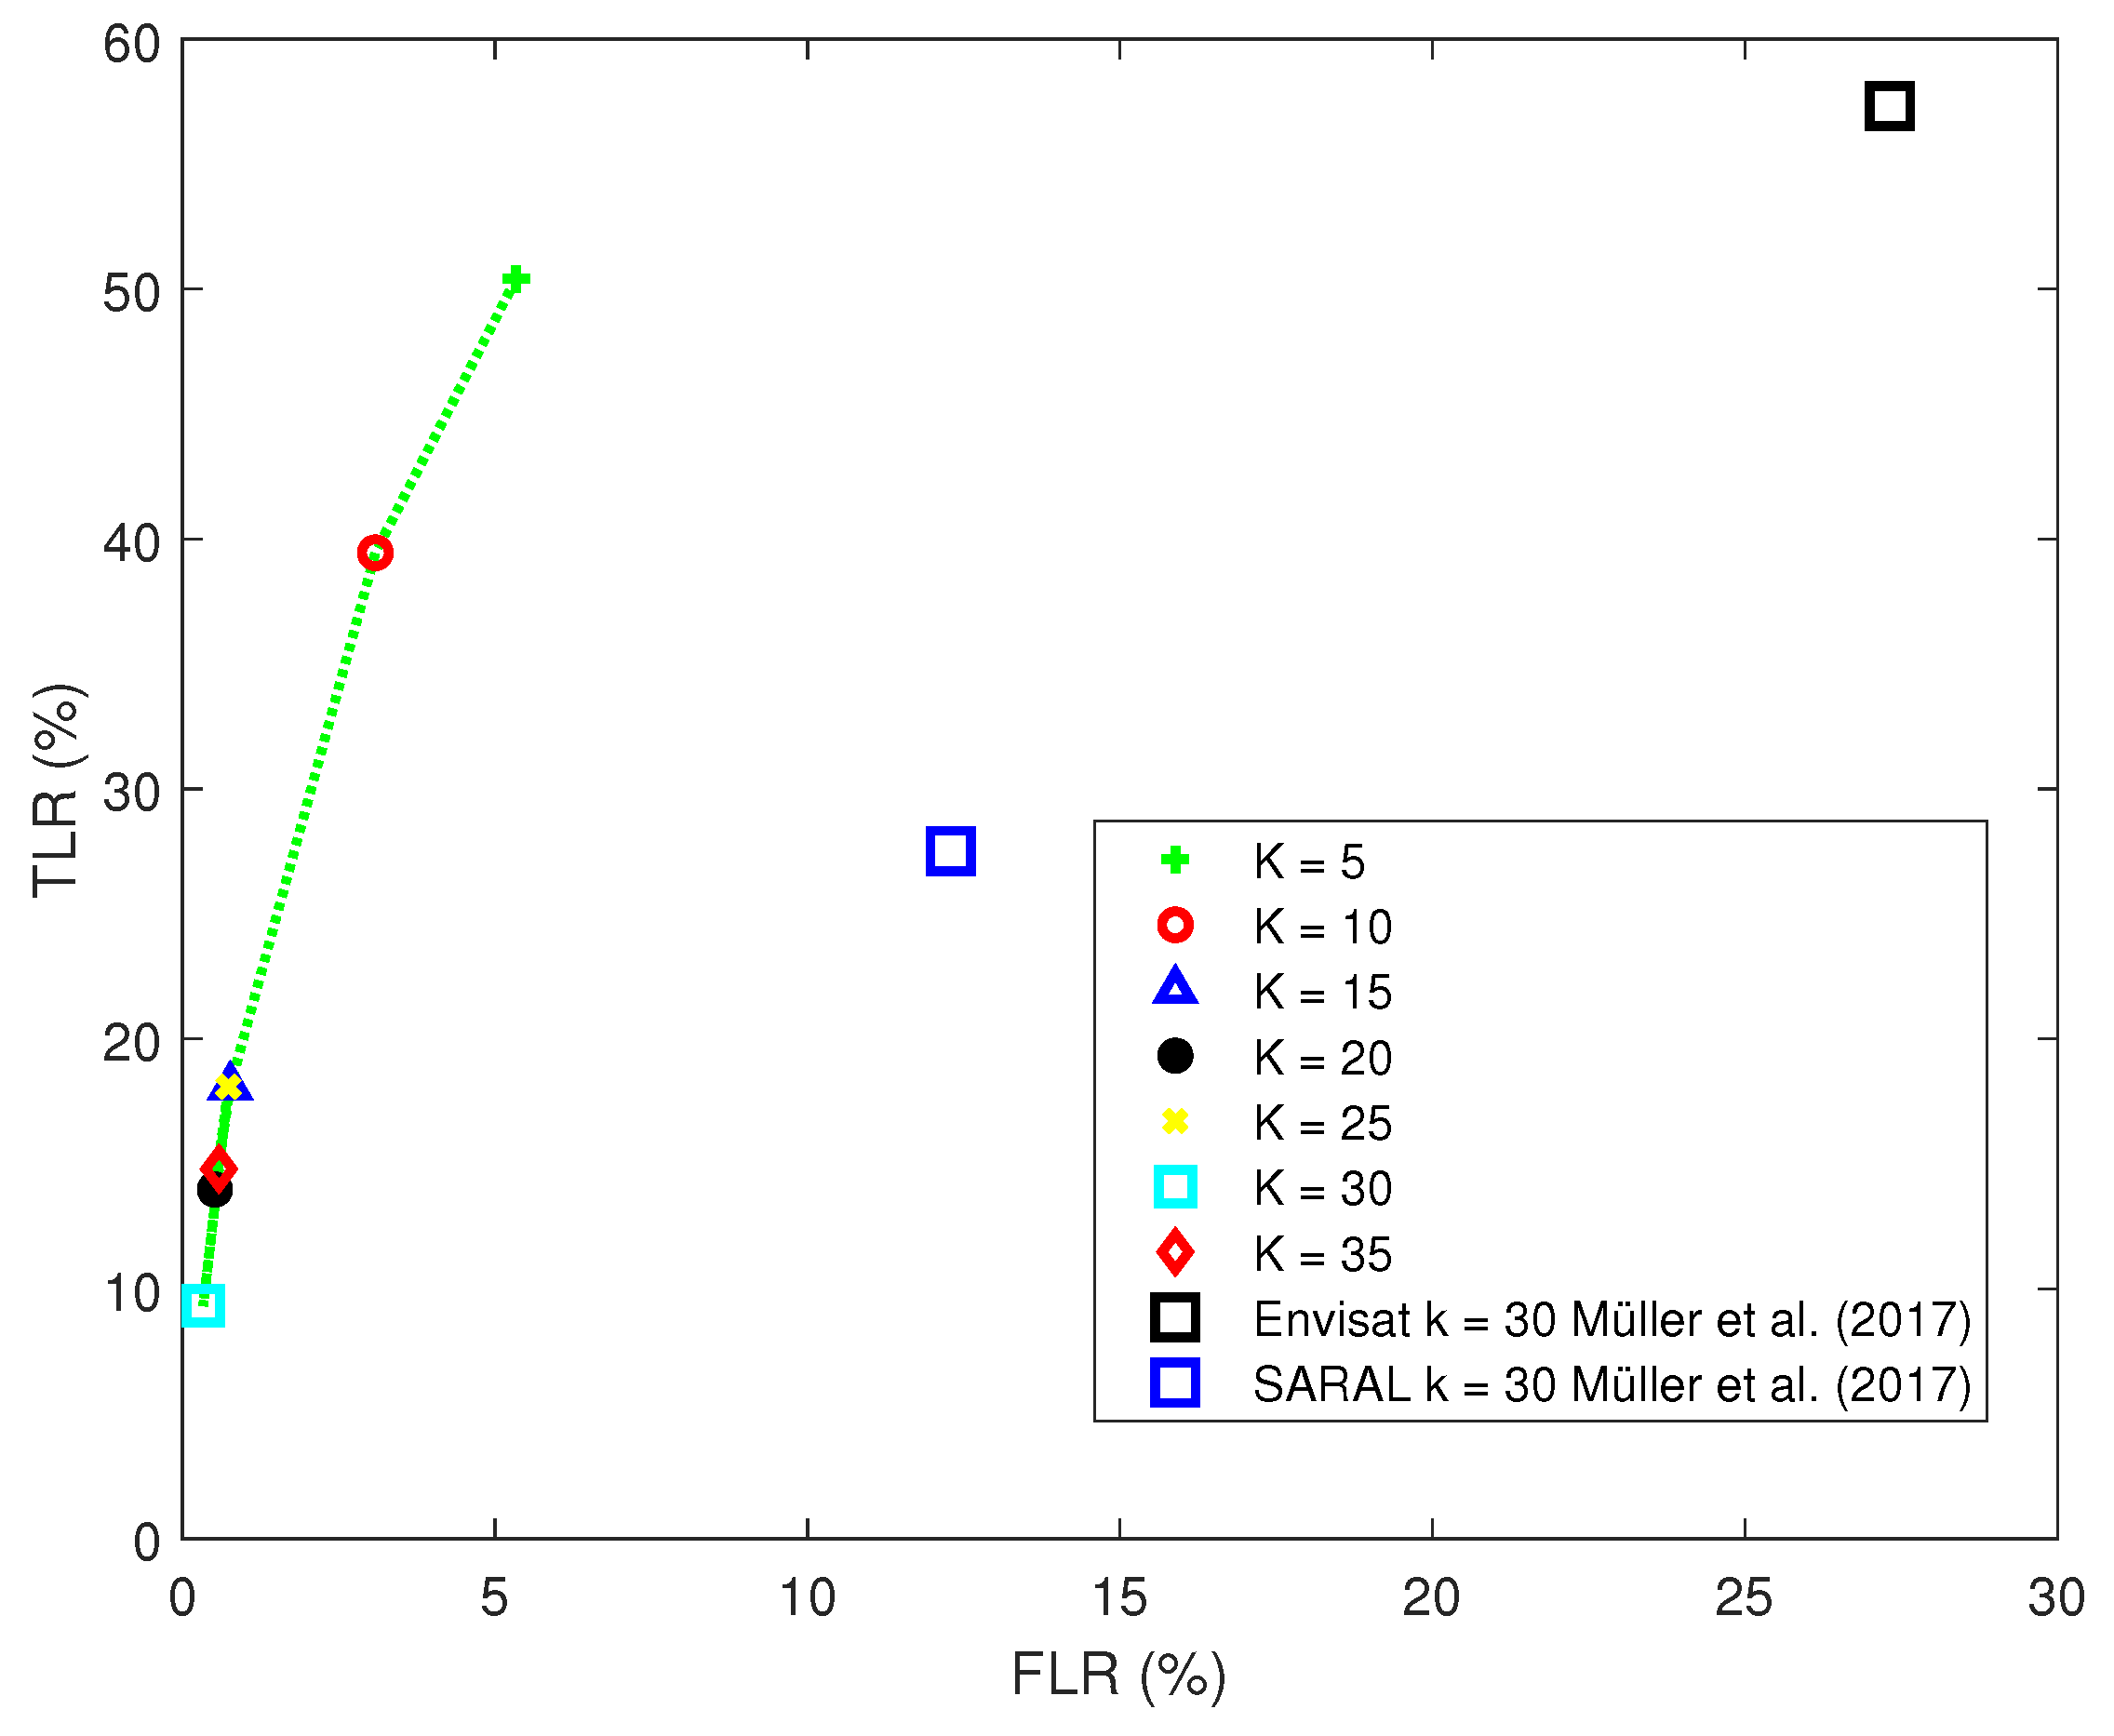
4.2. Comparison to Other Studies
4.3. Discussion of Altimeter Classification Methods
5. Conclusions and Outlook
Author Contributions
Funding
Acknowledgments
Conflicts of Interest
References
- Wernecke, A.; Kaleschke, L. Lead Detection in Arctic Sea Ice from Cryosat-2: Quality Assessment, Lead Area Fraction and Width Distribution. Cryosphere 2015, 9, 2167–2200. [Google Scholar] [CrossRef]
- Laxon, S.; Peacock, N.; Smith, D. High Interannual Variability of Sea Ice Thickness in the Arctic Region. Lett. Nat. 2003, 425, 947–950. [Google Scholar] [CrossRef] [PubMed]
- Farrell, S.L.; Laxon, S.W.; McAdoo, D.C.; Yi, D.; Zwally, H.J. Five Years of Arctic Sea Ice Freeboard Measurements from the Ice, Cloud and land Elevation Satellite. J. Geophys. Res. 2009, 114. [Google Scholar] [CrossRef]
- Dwyer, R.E.; Godin, R.H. Determining Sea-Ice Boundaries and Ice Roughness using GEOS-3 Altimeter Data; Technical Report; NASA Wallops Flight Center: Wallops Island, VA, USA, 1980.
- Laxon, S. Sea Ice Altimeter Processing Scheme at the EODC. Int. J. Remote Sens. 1994, 15, 915–924. [Google Scholar] [CrossRef]
- Connor, L.N.; Laxon, S.W.; Ridout, A.L.; Krabill, W.B.; McAdoo, D.C. Comparison of Envisat Radar and Airborne Laser Altimeter Measurements Over Arctic Sea Ice. Remote Sens. Environ. 2009, 113, 563–570. [Google Scholar] [CrossRef]
- Röhrs, J.; Kaleschke, L. An Algorithm to Detect Sea Ice Leads by Using AMSR-E Passive Microwave Imagery. Cryosphere 2012, 6, 343–352. [Google Scholar] [CrossRef] [Green Version]
- Zygmuntowska, M.; Khvorostovsky, K.; Helm, V.; Sandven, S. Waveform Classification of Airborne Synthetic Aperture Radar Altimeter over Arctic Sea Ice. Cryosphere 2013, 7, 1315–1324. [Google Scholar] [CrossRef] [Green Version]
- Friedman, N.; Kohavi, R. Bayesian Classification. In Handbook of Data Mining and Knowledge Discovery; Oxford University Press: New York, NY, USA, 2002; pp. 282–288. [Google Scholar]
- Passaro, M.; Müller, F.L.; Dettmering, D. Lead Detection using CryoSat-2 Delay Doppler Processing and Sentinel-1 SAR images. Adv. Space Res. 2017. [Google Scholar] [CrossRef]
- Müller, F.L.; Dettmering, D.; Bosch, W.; Seitz, F. Monitoring the Arctic Seas: How Satellite Altimetry can be used to Detect Open Water in Sea-Ice Regions. Remote Sens. 2017, 9, 551. [Google Scholar] [CrossRef]
- Park, H.S.; Jun, C.H. A Simple and Fast Algorithm for K-medoids Clustering. Expert Syst. Appl. 2009, 36, 3336–3341. [Google Scholar] [CrossRef]
- Cover, T.M.; Hart, P.E. Nearest Neighbor Pattern Classification. IEEE Trans. Inf. Theory 1967, 13. [Google Scholar] [CrossRef]
- Shen, X.; Zhang, J.; Zhang, X.; Meng, J.; Ke, C. Sea Ice Classification Using Cryosat-2 Altimeter Data by Optimal Classifier–Feature Assembly. IEEE Geosci. Remote Sens. Lett. 2017, 14, 1948–1952. [Google Scholar] [CrossRef]
- Lee, S.; Kim, H.C.; Im, J. Arctic Lead Detection using a Waveform Mixture Algorithm from CryoSat-2 Data. Cryosphere 2018, 12, 1665–1679. [Google Scholar] [CrossRef]
- Ricker, R.; Hendricks, S.; Helm, V.; Skourup, H.; Davidson, M. Sensitivity of CryoSat-2 Arctic Sea-ice Freeboard and Thickness on Radar-Waveform Interpretation. Cryosphere 2014, 8, 1607–1622. [Google Scholar] [CrossRef] [Green Version]
- Jiang, L.; Schneider, R.; Andersen, O.B.; Bauer-Gottwein, P. CryoSat-2 Altimetry Applications over Rivers and Lakes. Water 2017, 9, 211. [Google Scholar] [CrossRef]
- Raney, R.K. The Delay/Doppler Radar Altimeter. IEEE Trans. Geosci. Remote Sens. 1998, 36, 1578–1588. [Google Scholar] [CrossRef]
- Martin-Puig, C.; Ruffini, G. SAR Altimeter Retracker Performance Bound over Water Surfaces. In Proceedings of the 2009 IEEE International Geoscience and Remote Sensing Symposium, Cape Town, South Africa, 12–17 July 2009; pp. 449–452. [Google Scholar]
- European Space Agency. Cryosat Product Handbook. 2012. Available online: http://emits.sso.esa.int/emits-doc/ESRIN/7158/CryoSat-PHB-17apr2012.pdf (accessed on 21 September 2017).
- Scagliola, M.; Fornari, M. Main Evolutions and Expected Quality Improvements in Baseline C Level 1b Products. Aresys Technical Note, C2-TN-ARS-GS-5154, Issue 1.3. 2015. Available online: https://earth.esa.int/documents/10174/1773005/C2-BaselineC_L1b_improvements_1.3 (accessed on 27 July 2018).
- Dinardo, S. Guidelines for the SAR (Delay-Doppler) L1b Processing; Technical Note, XCRY-GSEG-EOPS-TN- 14-0042 Version 2; European Space Agency, ESRIN: Frascati, Italy, 2013; Available online: https://wiki.services.eoportal.org/tiki-download_wiki_attachment.php?attId=2540 (accessed on 30 September 2017).
- Studinger, M.; Koenig, L.; Martin, S.; Sonntag, J. Operation icebridge: Using instrumented aircraft to bridge the observational gap between icesat and icesat-2. In Proceedings of the 2010 IEEE International Geoscience and Remote Sensing Symposium, Honolulu, HI, USA, 25–30 July 2010; pp. 1918–1919. [Google Scholar]
- Xia, W.; Xie, H. Assessing three waveform retrackers on sea ice freeboard retrieval from Cryosat-2 using Operation IceBridge Airborne altimetry datasets. Remote Sens. Environ. 2018, 204, 456–471. [Google Scholar] [CrossRef]
- Dominguez, R. IceBridge DMS L1B Geolocated and Orthorectified Images, Version 1; Updated 2017; NASA National Snow and Ice Data Center Distributed Active Archive Center: Boulder, CO, USA, 2010.
- Wingham, D.J.; Francis, C.R.; Baker, S.; Bouzinac, C.; Brockley, D.; Cullen, R.; de Chateau-Thierry, P.; Laxon, S.; Mallow, U.; Mavrocordatos, C.; et al. CryoSat: A Mission to Determine the Fluctuations in Earth’s Land and Marine Ice Fields. Adv. Space Res. 2006, 37, 841–871. [Google Scholar] [CrossRef]
- Hastie, T.; Tibshirani, R.; Friedman, J. The Elements of Statistical Learning; Springer-Verlag: New York, NY, USA, 2009; Volume 2. [Google Scholar]
- Durbin, R.; Eddy, S.R.; Krogh, A.; Mitchison, G. Biological Sequence Analysis; Cambridge University Press: Cambridge, UK, 1998. [Google Scholar]
- Banks, D.; House, L.; McMorris, F.; Arabie, P.; Gaul, W. (Eds.) Classification, Clustering, and Data Mining Applications: Proceedings of the Meeting of the International Federation of Classification Societies (IFCS), Illinois Institute of Technology, Chicago, 15–18 July 2004; Studies in Classification, Data Analysis, and Knowledge Organization; Springer: Berlin/Heidelberg, Germany, 2004. [Google Scholar]
- Kvingedal, B. On Sea Ice Variability in the Nordic Seas. Ph.D. Thesis, University of Bergen, Bergen, Norway, 2005. Available online: http://web.gfi.uib.no/publikasjoner/pdf/Kvingedal.pdf (accessed on 3 November 2017).
- Nelder, J.A.; Mead, R. A Simplex Method for Function Minimization. Comput. J. 1965, 7, 308–313. [Google Scholar] [CrossRef]
- Perovich, D.K.; Richter-Menge, J.A. Surface Characteristics of Lead Ice. J. Geophyis. Res. 1994, 99, 16341–16350. [Google Scholar] [CrossRef]
- Onana, V.D.P.; Kurtz, N.T.; Farrell, S.L.; Koenig, L.S.; Studinger, M.; Harbeck, J.P. A Sea-Ice Lead Detection Algorithm for Use With High-Resolution Airborne Visible Imagery. IEEE Trans. Geosci. Remote Sens. 2013, 51. [Google Scholar] [CrossRef]
- Fawcett, T. An Introduction to ROC analysis. Pattern Recogn. Lett. 2006, 27, 861–874. [Google Scholar] [CrossRef]
- Xue, R.; Wunsch, D.C.; IEEE Computational Intelligence Society. Clustering; IEEE Press Series on Computational Intelligence; IEEE Press: Hoboken, NJ, USA; Wiley: Piscataway, NJ, USA, 2009. [Google Scholar]
- Story, M.; Congalton, R.G. Accuracy Assessment: A User’s Perspective. Am. Soc. Photogramm. Remote Sens. Remote Sens. Brief 1986, 52, 397–399. [Google Scholar]
- Galin, N.; Wingham, D.J.; Cullen, R.; Francis, R.; Lawrence, I. Measuring the Pitch of CryoSat-2 Using the SAR Mode of the SIRAL Altimeter. IEEE Geosci. Remote Sens. Lett. 2014, 11, 1399–1403. [Google Scholar] [CrossRef]
- Armitage, T.W.K.; Davidson, M.W.J. Using the Interferometric Capabilities of the ESA CryoSat-2 Mission to Improve the Accuracy of Sea Ice Freeboard Retrievals. IEEE Trans. Geosci. Remote Sens. 2014, 52. [Google Scholar] [CrossRef]


| w | Max. Power | SP | |||
|---|---|---|---|---|---|
| 0.5 | W | 120.75 | 175.08 | 30.84 | 345.02 |
| 1 | W | 116.18 | 152.58 | 158.11 | 300.43 |
| 2 | W | 99.93 | 63.25 | 145.29 | 156.61 |
| 3 | W | 99.67 | 63.38 | 124.28 | 102.86 |
| 4 | W | 96.71 | 66.05 | 69.28 | 91.28 |
| 5 | W | 97.01 | 63.92 | 51.59 | 78.61 |
| 6 | W | 97.03 | 64.15 | 50.89 | 73.47 |
| 7 | W | 97.00 | 62.25 | 56.19 | 71.14 |
| 8 | W | 97.15 | 53.80 | 51.43 | 70.41 |
| 9 | W | 90.18 | 63.20 | 53.98 | 70.41 |
| 10 | W | 80.47 | 57.32 | 30.40 | 54.03 |
| MAX | MULTI | STACK | UNSU | |
|---|---|---|---|---|
| FLR | 1.02 | 0.79 | 1.51 | 0.73 |
| Overall Accuracy | 97.03 | 96.94 | 96.36 | 97.18 |
| Lead User Accuracy | 37.44 | 32.50 | 21.13 | 39.29 |
| Lead Producer Accuracy (TLR) | 23.29 | 17.81 | 15.34 | 18.08 |
| Ice User Accuracy | 98.00 | 97.86 | 97.79 | 97.87 |
| Ice Producer Accuracy | 98.98 | 99.03 | 98.49 | 99.26 |
© 2018 by the authors. Licensee MDPI, Basel, Switzerland. This article is an open access article distributed under the terms and conditions of the Creative Commons Attribution (CC BY) license (http://creativecommons.org/licenses/by/4.0/).
Share and Cite
Dettmering, D.; Wynne, A.; Müller, F.L.; Passaro, M.; Seitz, F. Lead Detection in Polar Oceans—A Comparison of Different Classification Methods for Cryosat-2 SAR Data. Remote Sens. 2018, 10, 1190. https://doi.org/10.3390/rs10081190
Dettmering D, Wynne A, Müller FL, Passaro M, Seitz F. Lead Detection in Polar Oceans—A Comparison of Different Classification Methods for Cryosat-2 SAR Data. Remote Sensing. 2018; 10(8):1190. https://doi.org/10.3390/rs10081190
Chicago/Turabian StyleDettmering, Denise, Alan Wynne, Felix L. Müller, Marcello Passaro, and Florian Seitz. 2018. "Lead Detection in Polar Oceans—A Comparison of Different Classification Methods for Cryosat-2 SAR Data" Remote Sensing 10, no. 8: 1190. https://doi.org/10.3390/rs10081190
APA StyleDettmering, D., Wynne, A., Müller, F. L., Passaro, M., & Seitz, F. (2018). Lead Detection in Polar Oceans—A Comparison of Different Classification Methods for Cryosat-2 SAR Data. Remote Sensing, 10(8), 1190. https://doi.org/10.3390/rs10081190