An Evaluation and Comparison of Four Dense Time Series Change Detection Methods Using Simulated Data


Abstract
:
1. Introduction
2. Materials and Methods
2.1. Change Detection Methods
2.1.1. BFAST
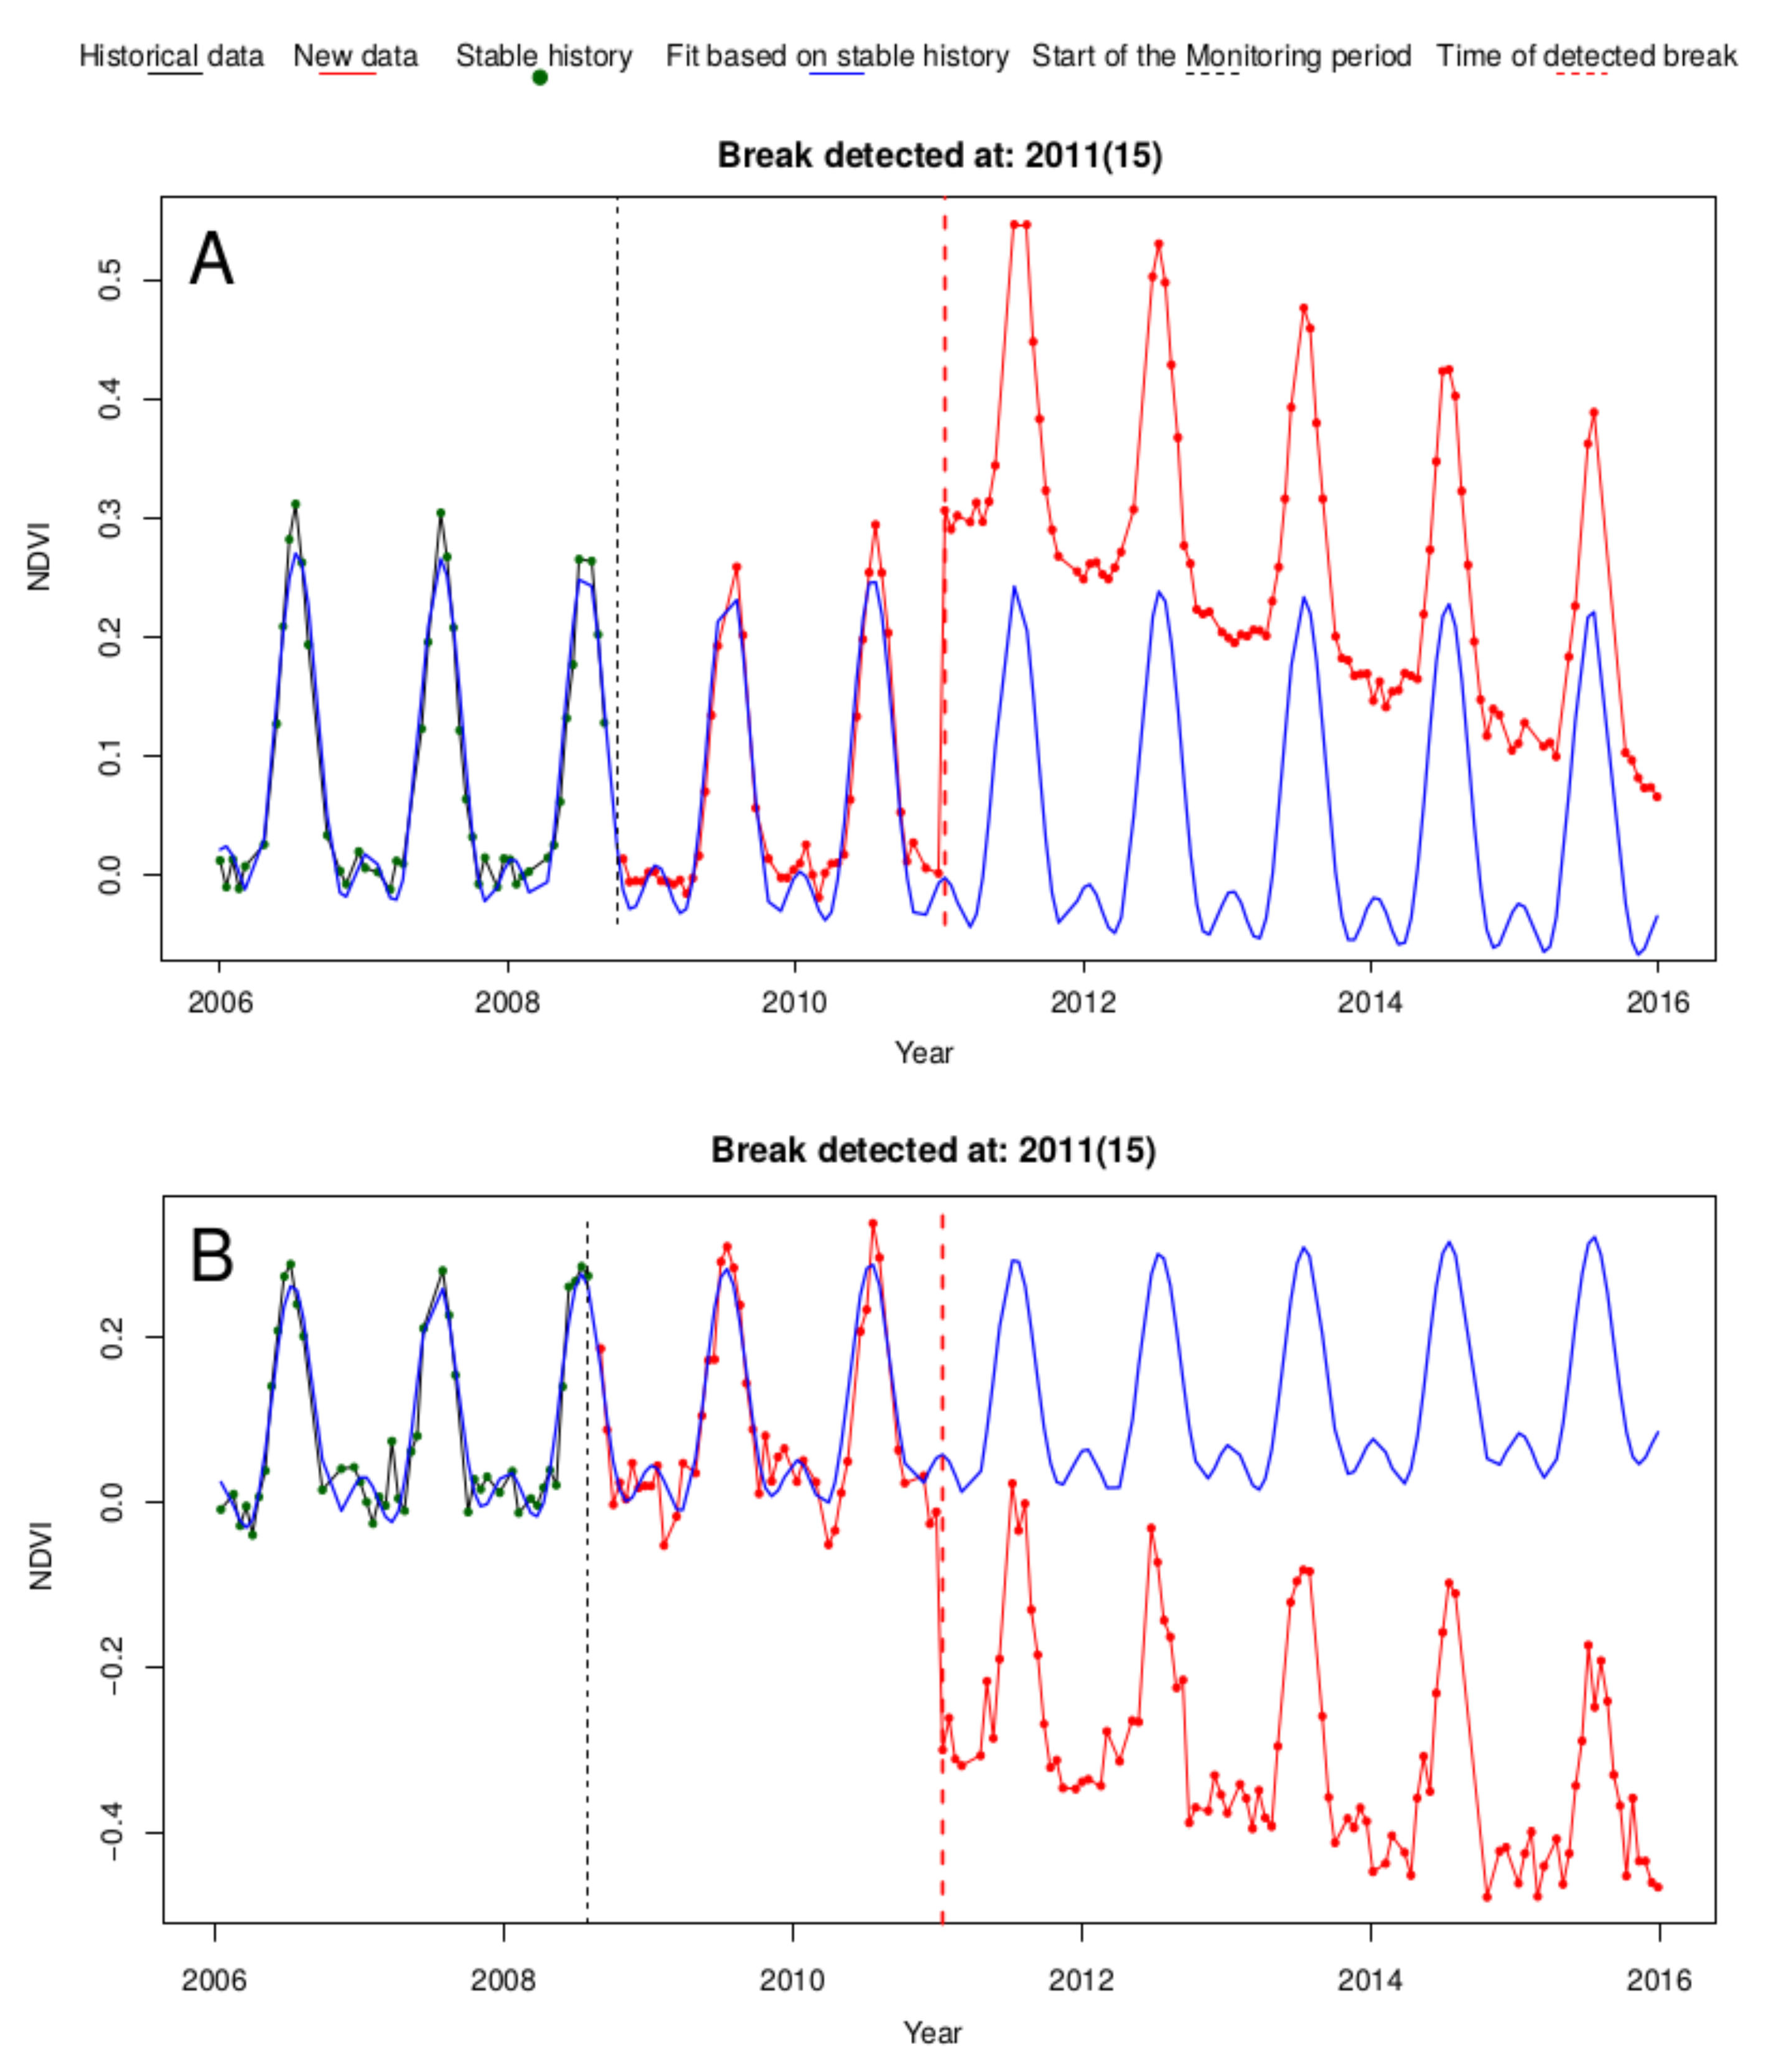
2.1.2. BFAST Monitor
2.1.3. CCDC
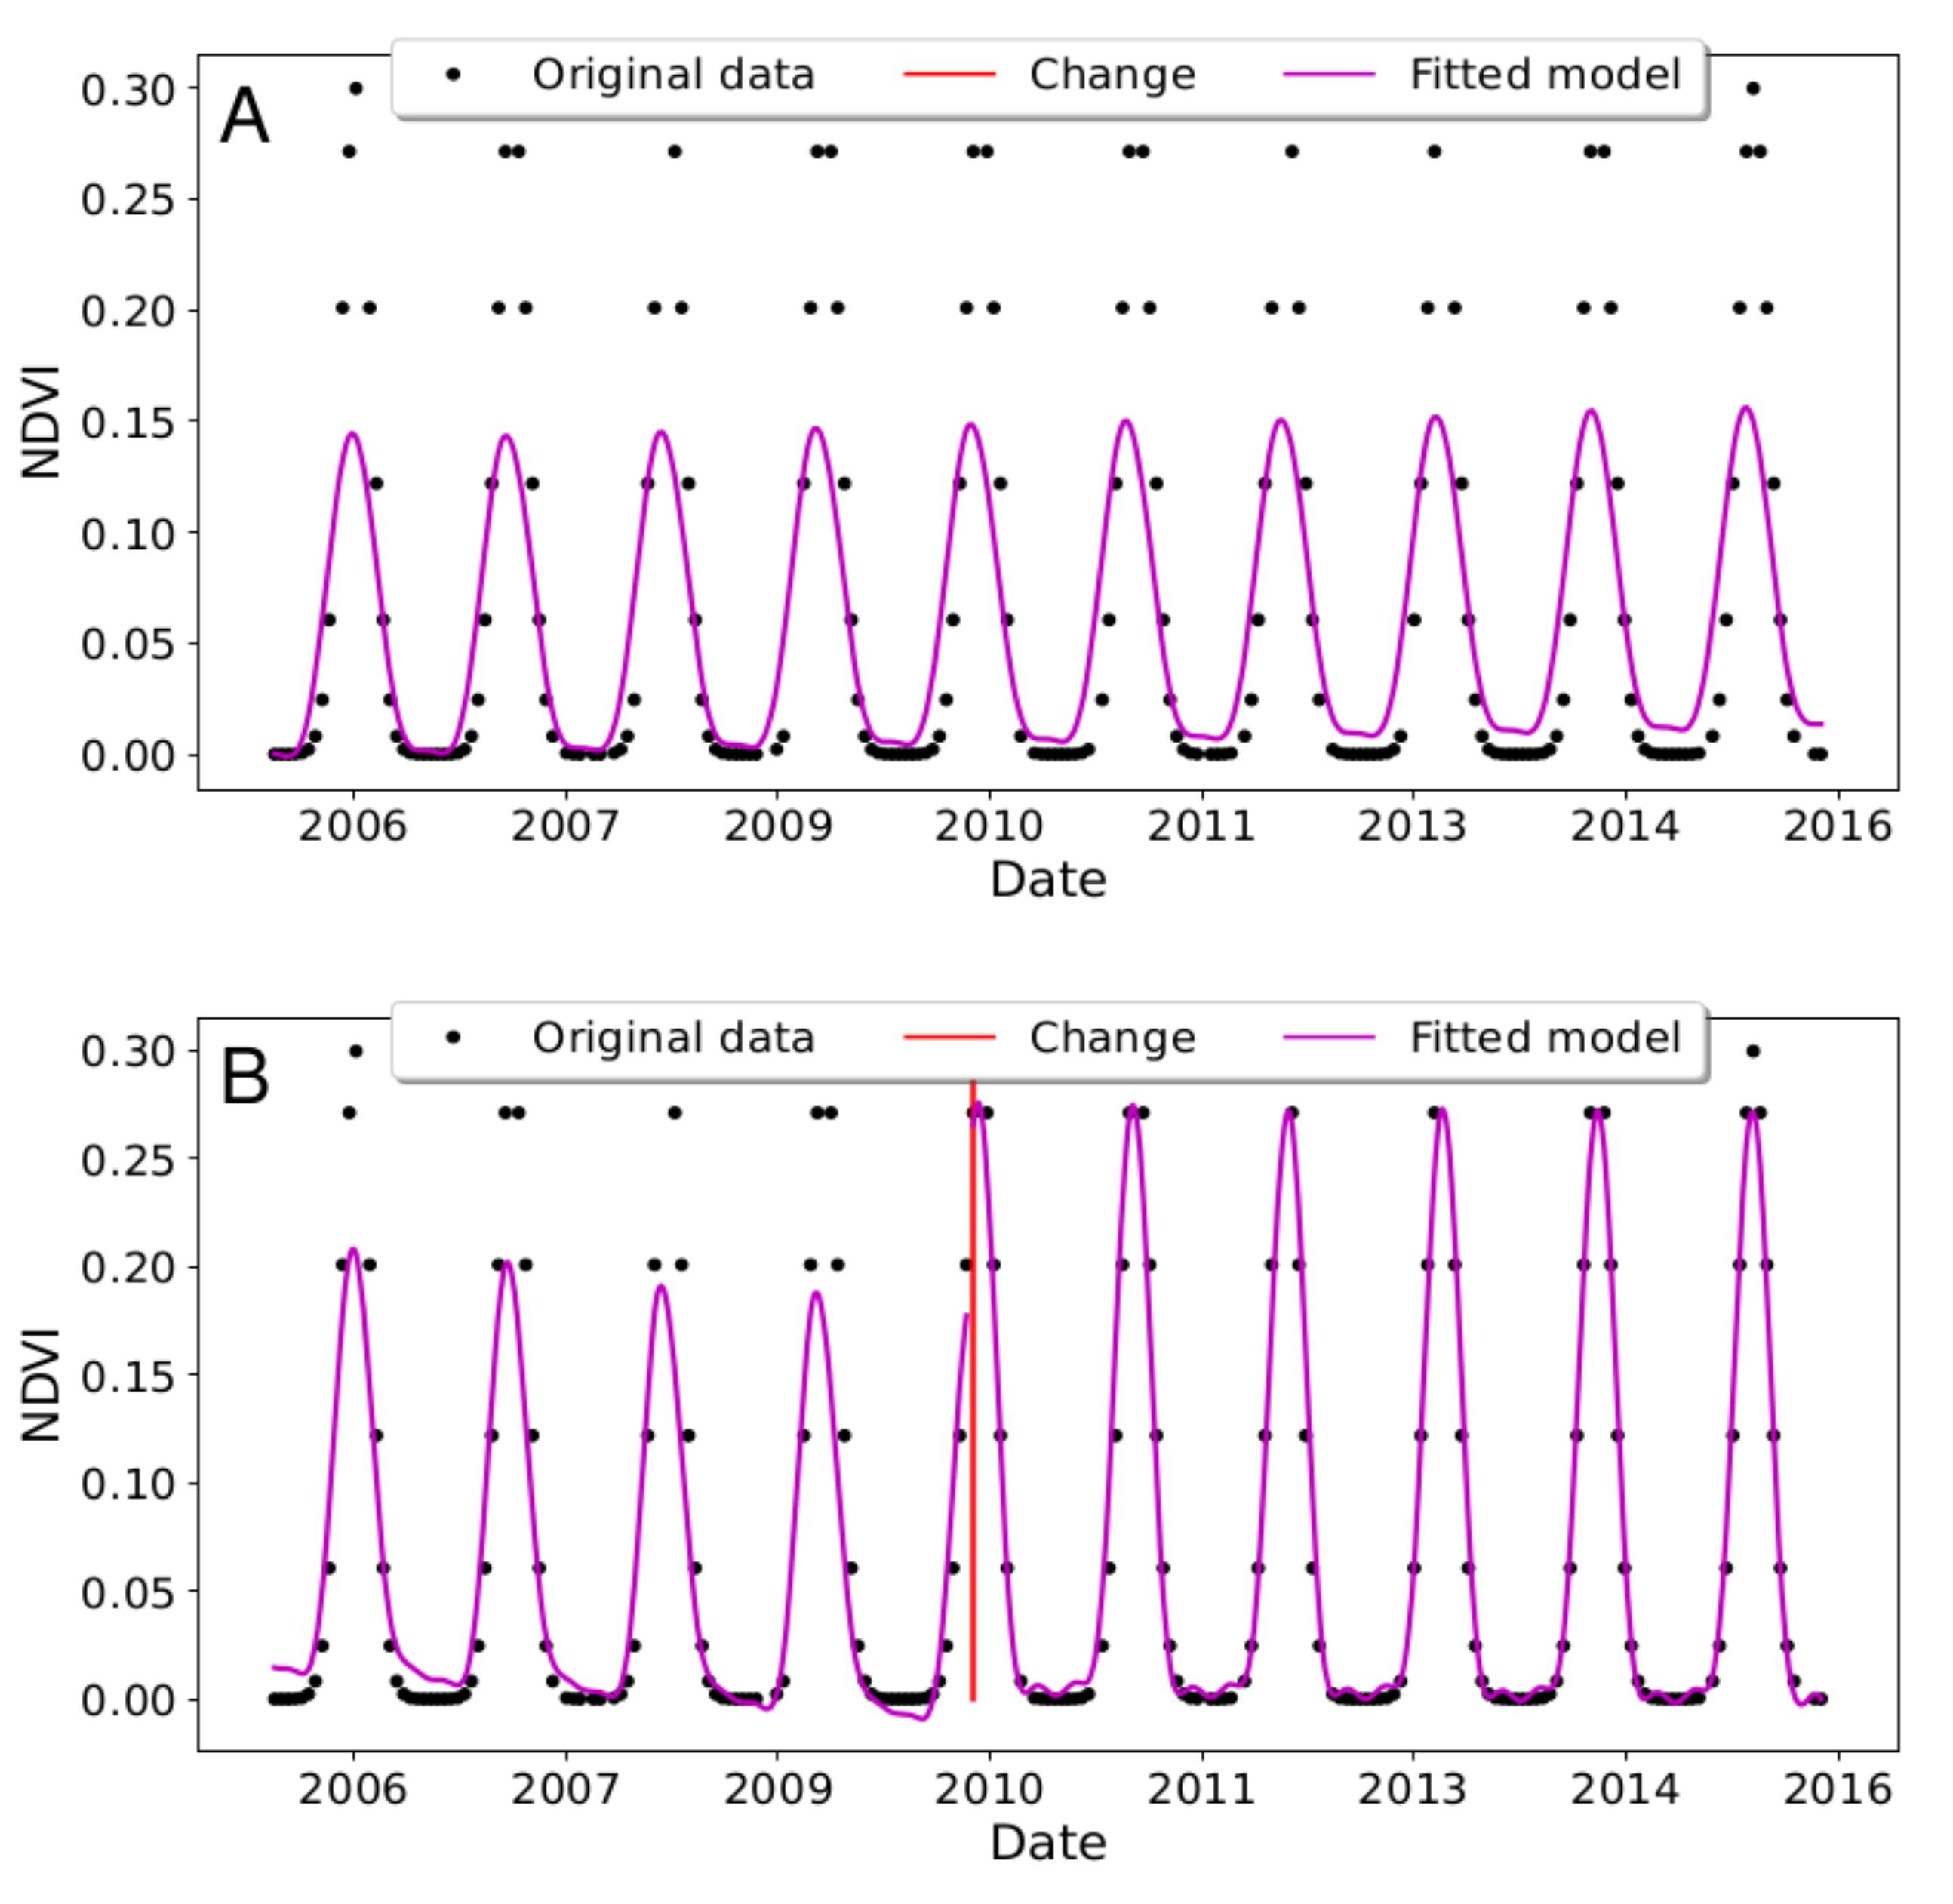
2.1.4. EWMACD
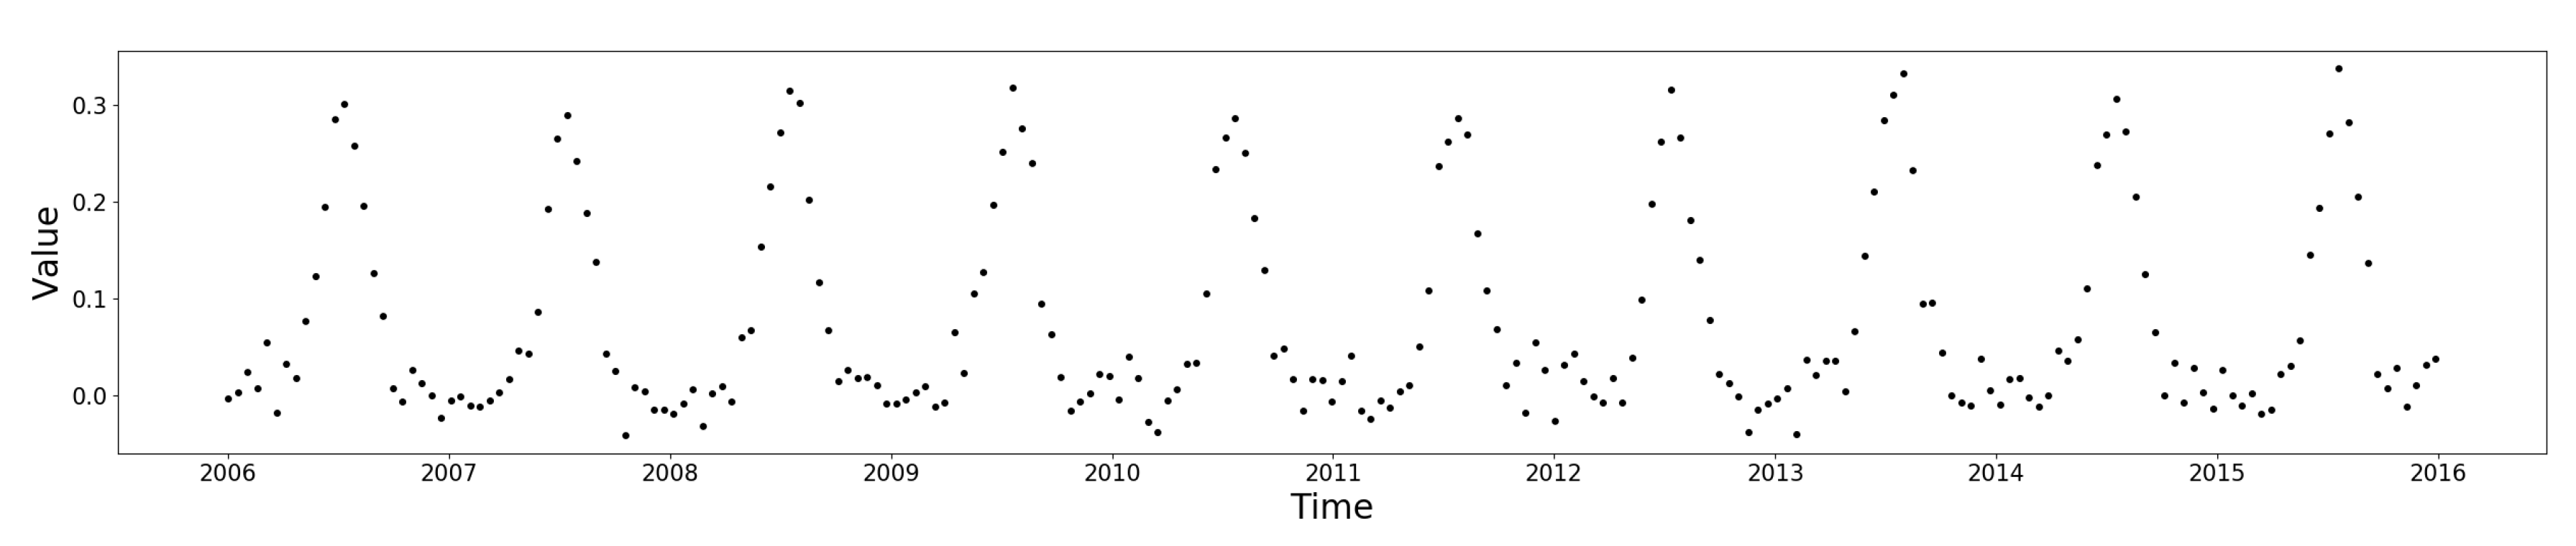
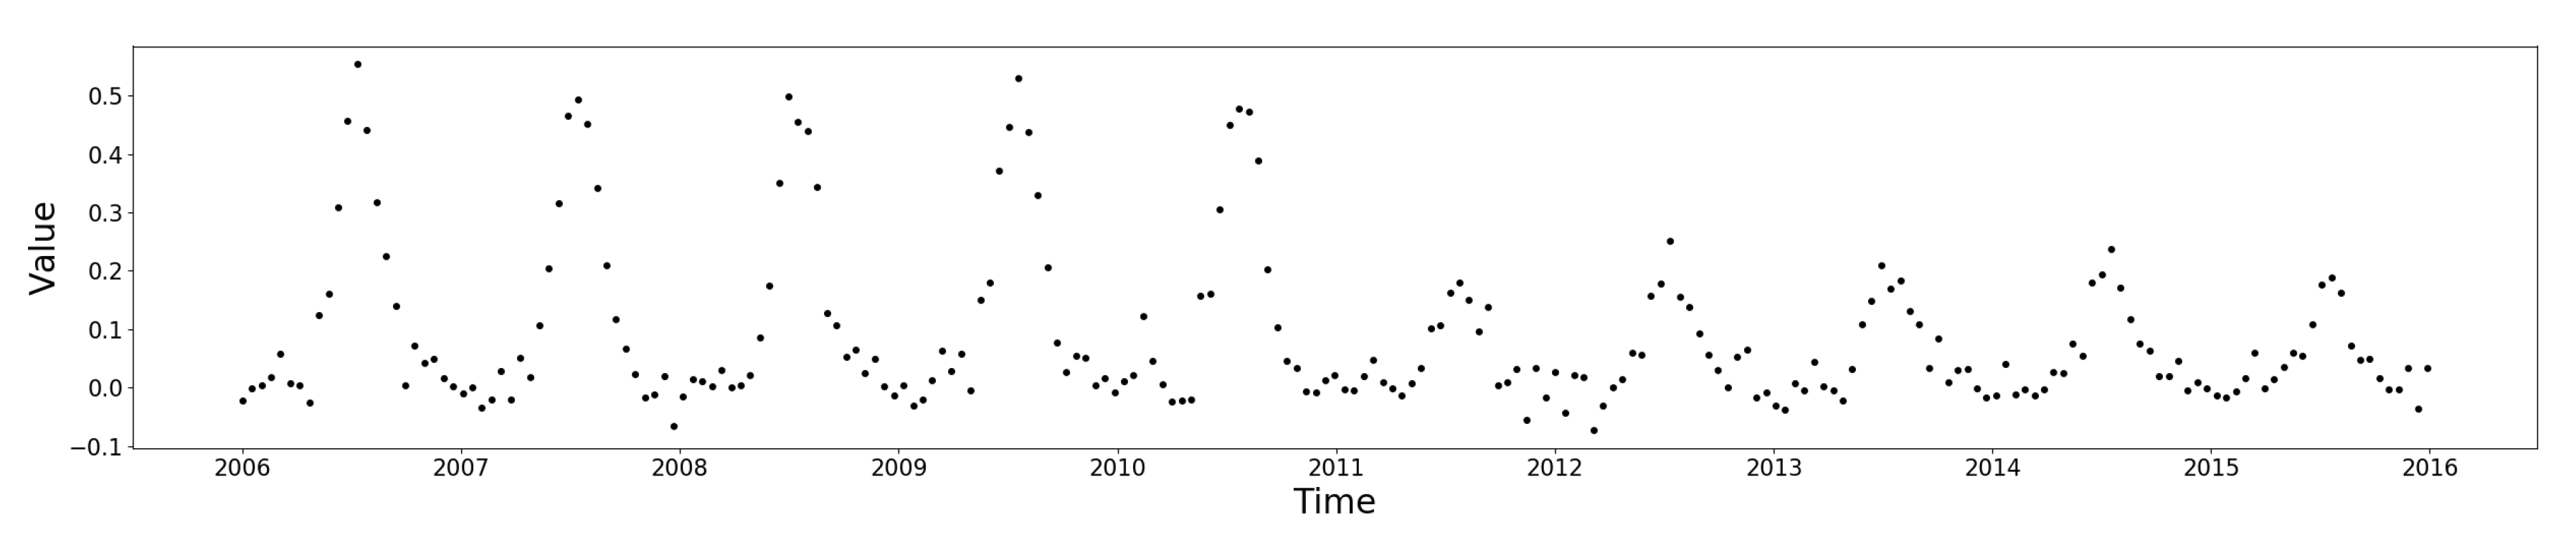
2.2. Simulating Seasonal Time Series
2.3. Noise
2.4. Missing Data
2.5. No Change Set
2.6. Trend Only Set
2.7. Seasonal Change Sets
2.8. Break/Trend Set
2.9. Definition of Change
2.10. Correlation Statistics
2.11. Computer Specifications and Timing
3. Results
3.1. Runtime
3.2. Overall Summary
3.2.1. Definition of Correct/False Trend Results for EWMACD
3.2.2. True vs. False Changes
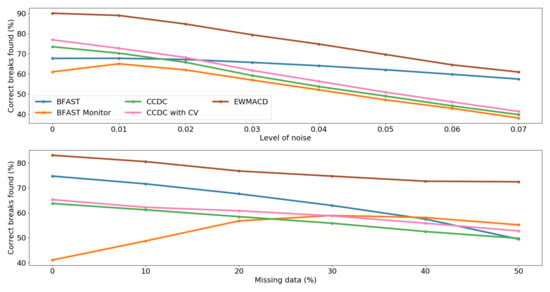
3.3. By Noise Level
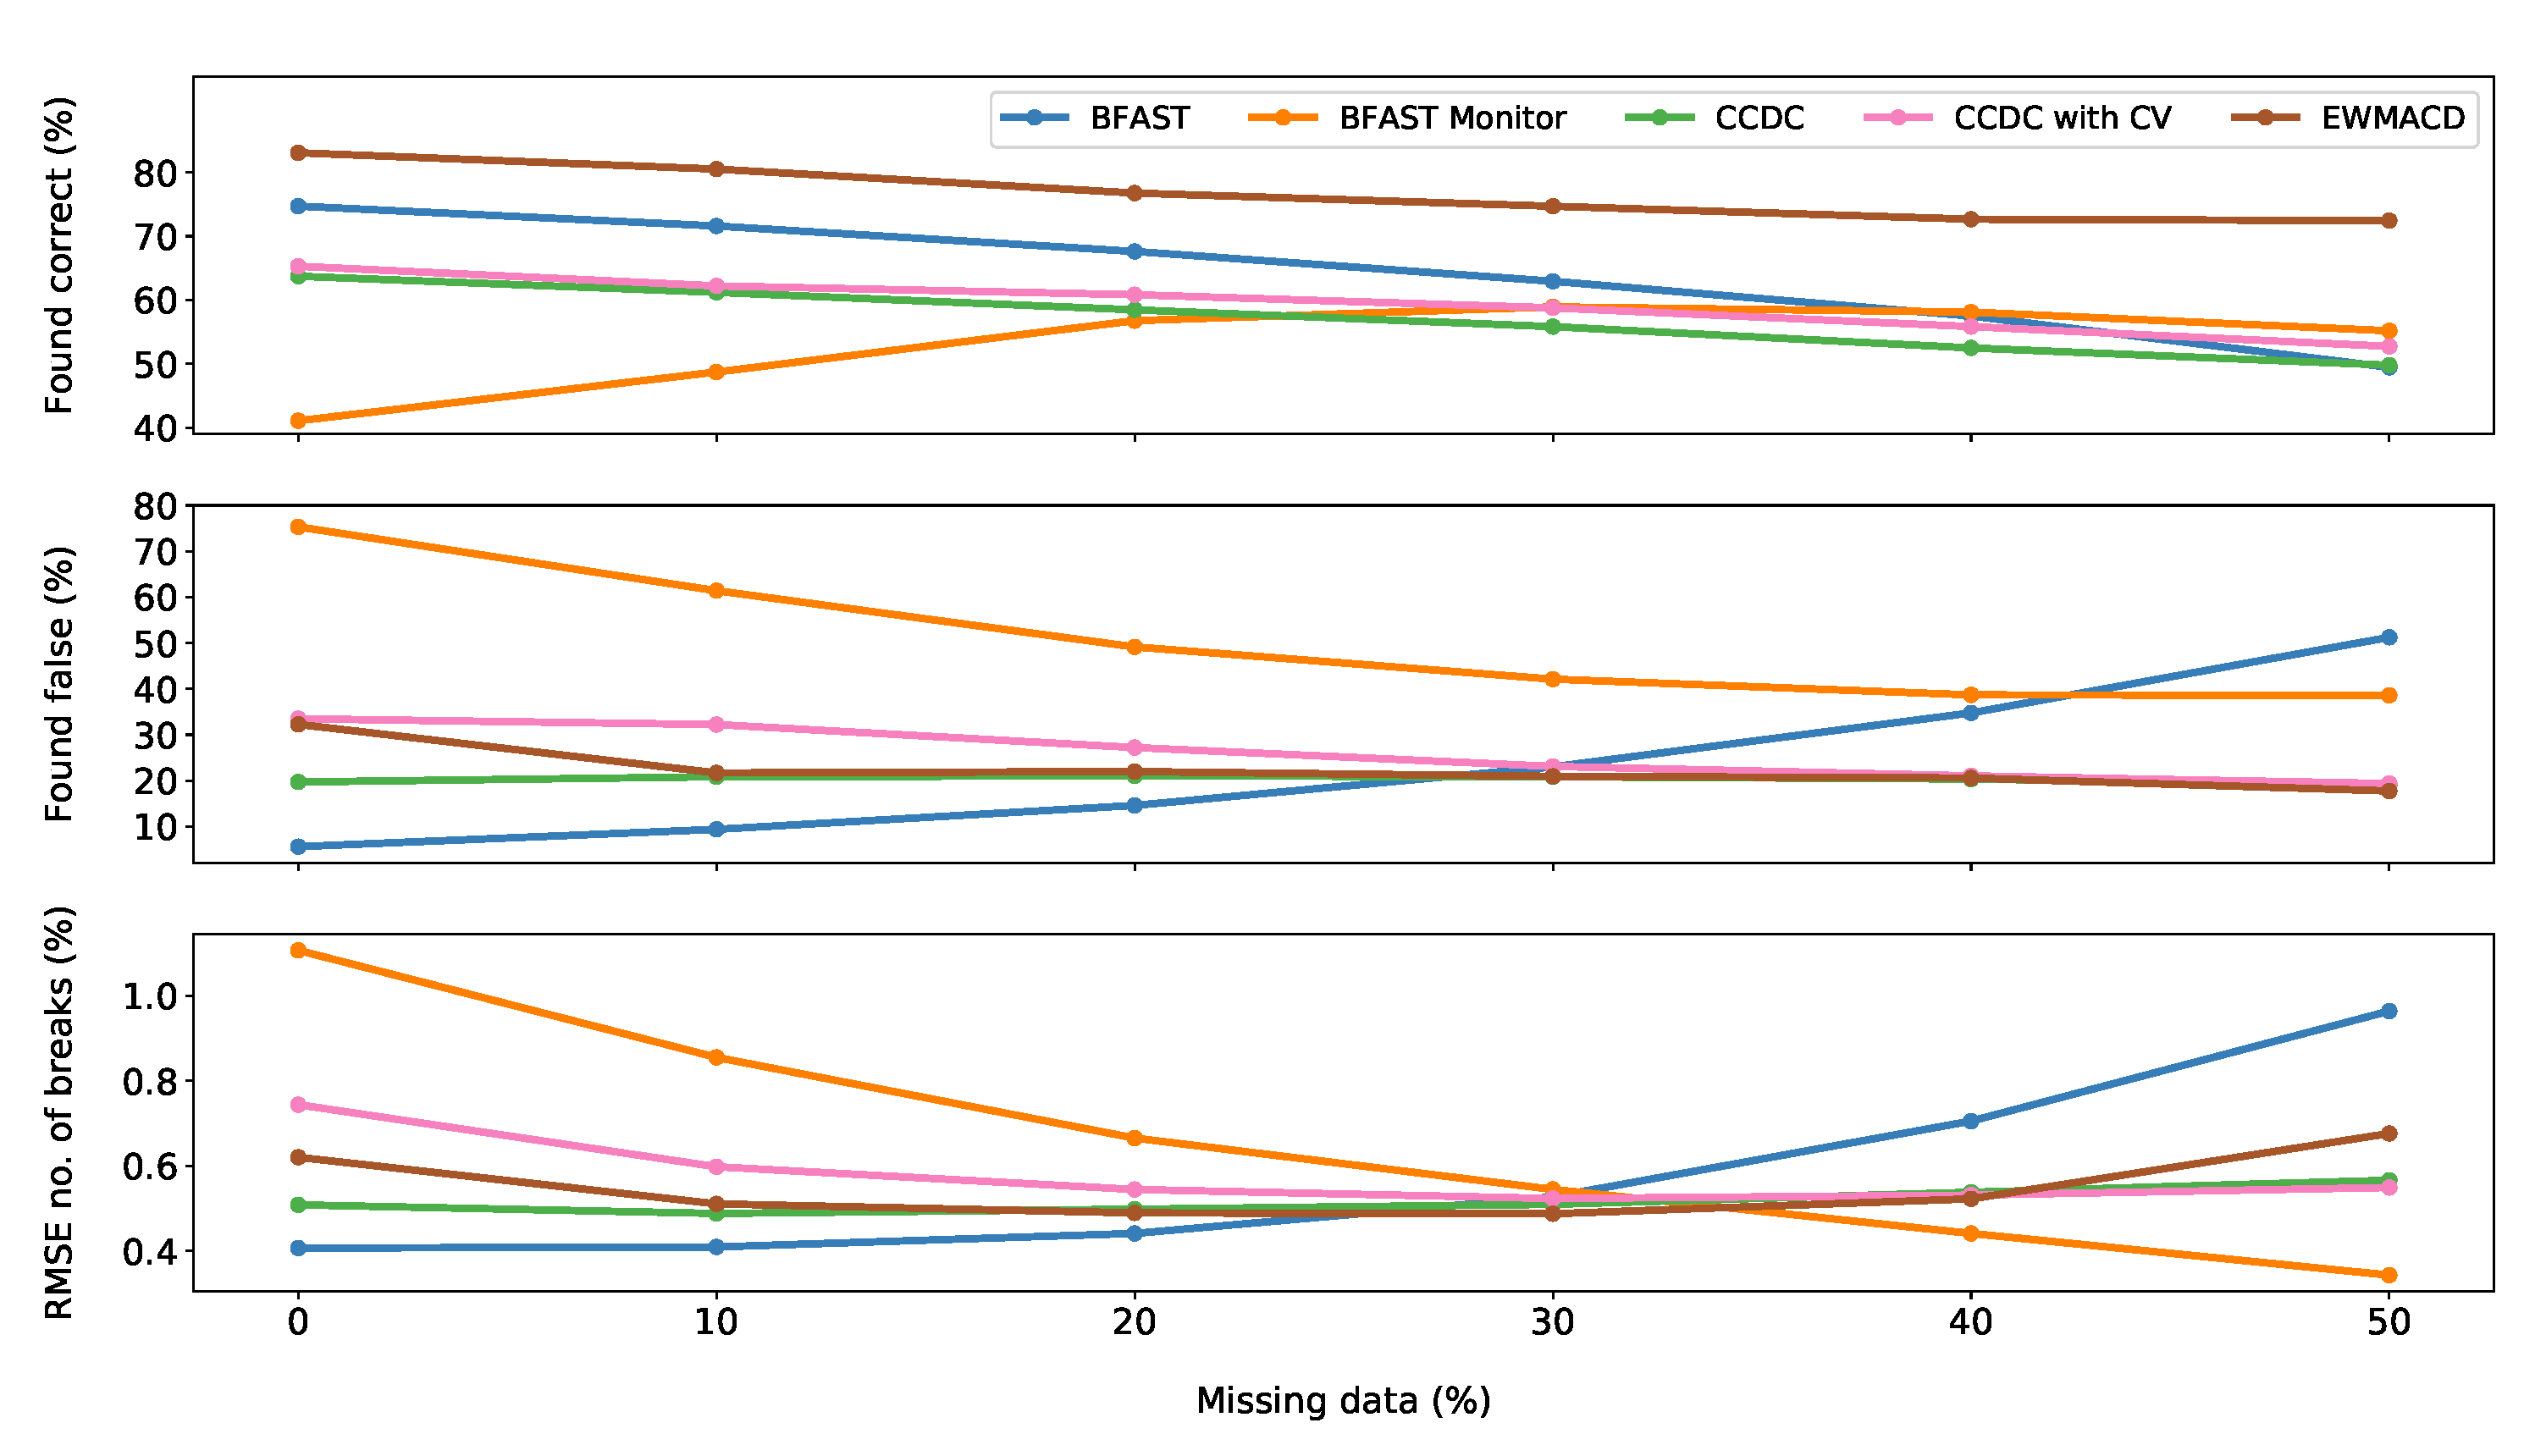
3.4. By Missing Data Level
3.5. Break Magnitude by Noise and Missing Data
3.6. By Break Severity
- Extreme breaks have a large or medium magnitude break (break > 0.1 or break < −0.1) followed by a strong or medium trend (trend > 0.001 or trend < −0.001). .
- Moderate breaks have a large break (break = 0.3 or break = −0.3) with a weak trend (trend = 0.001 or trend = −0.001), a large break with no trend, a small break (break = 0.1 or break = −0.1) with a strong trend (trend = 0.002 or trend = −0.002), or a medium break (break = 0.2 or break = −0.2) with a weak trend (trend = 0.001 or trend = −0.001). .
- Subtle breaks have a small break (break = 0.1 or break = −0.1) with a weak trend (trend = 0.001 or trend = −0.001), a small break with no trend, a small break with a medium trend (trend = 0.0015 or trend = −0.0015), or a medium break (break = 0.2 or break = −0.2) with no trend. .
4. Discussion
4.1. BFAST
4.2. BFAST Monitor
4.3. CCDC
4.4. CCDC with CV
4.5. EWMACD
4.6. Limitations
4.7. Future Work
5. Conclusions
Recommendations
- For smaller magnitude changes such as partial forest harvesting within pixels and for detecting changes in land cover condition (e.g., due to decreasing yield or recovery after fire), EWMACD is likely to be the most effective due to its ability to detect a wide variety of change magnitudes and low false detection rate.
- For studies which aim to robustly detect complete changes in land cover class (e.g., change from forestry to cropland), we recommend CCDC with a fixed . CCDC performed well at detecting larger magnitude changes and tended to ignore or underestimate smaller magnitude changes and seasonal changes. Using fixed greatly increases algorithm runtime, although should be chosen carefully in order to maximise or minimise change detection as appropriate.
- The detection of seasonal changes is a field in itself and software packages such as TIMESAT [42,43] can aid in more detailed reconstruction of seasonal curves. However, of the methods investigated here, we found both EWMACD and BFAST Monitor capable of detecting at least high magnitude seasonal change, such as a change in the number of seasonal peaks present (indicating a change in cropping practices) or a substantial increase in seasonal amplitude (indicating, e.g., a change in yield). Of the two, we would recommend EWMACD due to its lower likelihood of detecting false change.
- If data are known to be noisy, e.g. with many small clouds or cloud shadows present which are difficult to screen out, either EWMACD or BFAST could be suitable. EWMACD was able to find more correct breaks in time series regardless of the level of noise, whereas BFAST was the most consistent method across noise levels for all metrics. However, given the poor performance of BFAST on the seasonal change sets, its use is only recommended here for finding abrupt changes.
- For datasets with high levels of missing observations such as those from areas of the world with high year-round cloud or snow cover, we would recommend CCDC. CCDC gave very consistent performance across missing data levels, probably because it is designed to look for land cover class changes and is less likely to be influenced by single outliers. The adaptive Lasso regression method should also help to correctly estimate seasonal parameters if data are missing.
- As computing power increases, change detection techniques can be applied across larger and larger datasets. Most of the methods discussed here are now available on Google Earth Engine [44]. Initiatives such as the Open Data Cube show the potential of continental scale analysis [45]. However, pixel-level change detection is still computationally expensive. Based on its good overall performance and fast execution time across multiple change types, EWMACD shows potential for large scale analysis.
Author Contributions
Funding
Conflicts of Interest
Abbreviations
| BFAST | Breaks for Additive and Seasonal Trend |
| CCDC | Continuous Change Detection and Classification |
| CUSUM | Cumulative Sum |
| CV | Cross Validation |
| Edyn | Dynamic EWMACD |
| EWMACD | Exponentially Weighted Moving Average Change Detection |
| HANTS | Harmonic Analysis of Time Series |
| LandTrendr | Landsat-based detection of Trends in Disturbance and Recovery |
| LOS | Length of Season |
| MOSUM | Moving Sum |
| NDVI | Normalised Difference Vegetation Index |
| NOS | Number of Seasons |
| OLS | Ordinary Least Squares |
| RMSE | Root Mean Square Error |
| SOS | Start of Season |
References
- Tubiello, F.N.; Salvatore, M.; Ferrara, A.F.; House, J.; Federici, S.; Rossi, S.; Biancalani, R.; Condor Golec, R.D.; Jacobs, H.; Flammini, A.; et al. The Contribution of Agriculture, Forestry and other Land Use activities to Global Warming, 1990–2012. Glob. Chang. Biol. 2015, 21, 2655–2660. [Google Scholar] [CrossRef] [PubMed]
- van der Werf, G.R.; Morton, D.C.; DeFries, R.S.; Olivier, J.G.J.; Kasibhatla, P.S.; Jackson, R.B.; Collatz, G.J.; Randerson, J.T. CO2 emissions from forest loss. Nat. Geosci. 2009, 2, 737–738. [Google Scholar] [CrossRef]
- Roy, D.P.; Wulder, M.A.; Loveland, T.R.; Woodcock, C.E.; Allen, R.G.; Anderson, M.C.; Helder, D.; Irons, J.R.; Johnson, D.M.; Kennedy, R.; et al. Landsat-8: Science and product vision for terrestrial global change research. Remote. Sens. Environ. 2014, 145, 154–172. [Google Scholar] [CrossRef]
- Wulder, M.A.; Masek, J.G.; Cohen, W.B.; Loveland, T.R.; Woodcock, C.E. Opening the archive: How free data has enabled the science and monitoring promise of Landsat. Remote Sens. Environ. 2012, 122, 2–10. [Google Scholar] [CrossRef]
- Kennedy, R.E.; Yang, Z.; Cohen, W.B. Detecting trends in forest disturbance and recovery using yearly Landsat time series: 1. LandTrendr—Temporal segmentation algorithms. Remote Sens. Environ. 2010, 114, 2897–2910. [Google Scholar] [CrossRef]
- Hermosilla, T.; Wulder, M.A.; White, J.C.; Coops, N.C.; Hobart, G.W. An integrated Landsat time series protocol for change detection and generation of annual gap-free surface reflectance composites. Remote Sens. Environ. 2015, 158, 220–234. [Google Scholar] [CrossRef]
- Huang, C.; Goward, S.N.; Schleeweis, K.; Thomas, N.; Masek, J.G.; Zhu, Z. Dynamics of national forests assessed using the Landsat record: Case studies in eastern United States. Remote Sens. Environ. 2009, 113, 1430–1442. [Google Scholar] [CrossRef]
- Moisen, G.G.; Meyer, M.C.; Schroeder, T.A.; Liao, X.; Schleeweis, K.G.; Freeman, E.A.; Toney, C. Shape selection in Landsat time series: A tool for monitoring forest dynamics. Glob. Chang. Biol. 2016, 22, 3518–3528. [Google Scholar] [CrossRef]
- Zhu, Z. Change detection using landsat time series: A review of frequencies, preprocessing, algorithms, and applications. ISPRS J. Photogramm. Remote. Sens. 2017, 130, 370–384. [Google Scholar] [CrossRef]
- Roerink, G.J.; Menenti, M.; Verhoef, W. Reconstructing cloudfree NDVI composites using Fourier analysis of time series. Int. J. Remote. Sens. 2000, 21, 1911–1917. [Google Scholar] [CrossRef]
- Saxena, R.; Watson, L.T.; Wynne, R.H.; Brooks, E.B.; Thomas, V.A.; Zhiqiang, Y.; Kennedy, R.E. Towards a polyalgorithm for land use change detection. ISPRS J. Photogramm. Remote. Sens. 2018, 144, 217–234. [Google Scholar] [CrossRef]
- Cohen, W.B.; Yang, Z.; Kennedy, R. Detecting trends in forest disturbance and recovery using yearly Landsat time series: 2. TimeSync—Tools for calibration and validation. Remote Sens. Environ. 2010, 114, 2911–2924. [Google Scholar] [CrossRef]
- Dutrieux, L.P.; Verbesselt, J.; Kooistra, L.; Herold, M. Monitoring forest cover loss using multiple data streams, a case study of a tropical dry forest in Bolivia. ISPRS J. Photogramm. Remote. Sens. 2015, 107, 112–125. [Google Scholar] [CrossRef]
- Cohen, W.B.; Healey, S.P.; Yang, Z.; Stehman, S.V.; Brewer, C.K.; Brooks, E.B.; Gorelick, N.; Huang, C.; Hughes, M.J.; Kennedy, R.E.; et al. How Similar Are Forest Disturbance Maps Derived from Different Landsat Time Series Algorithms? Forests 2017, 8, 98. [Google Scholar] [CrossRef]
- Verbesselt, J.; Hyndman, R.; Zeileis, A.; Culvenor, D. Phenological change detection while accounting for abrupt and gradual trends in satellite image time series. Remote Sens. Environ. 2010, 114, 2970–2980. [Google Scholar] [CrossRef]
- Forkel, M.; Carvalhais, N.; Verbesselt, J.; Mahecha, M.D.; Neigh, C.S.; Reichstein, M. Trend Change detection in NDVI time series: Effects of inter-annual variability and methodology. Remote Sens. 2013, 5, 2113–2144. [Google Scholar] [CrossRef]
- Awty-Carroll, K. Scripts Used for Evaluating and Comparing a Range of Dense Time Series Change Detection Methods. Available online: https://github.com/klh5/season-trend-comparison (accessed on 12 November 2019).
- Verbesselt, J.; Zeileis, A.; Hyndman, R. Package ‘Bfast’. Available online: https://cran.r-project.org/web/packages/bfast/bfast.pdf (accessed on 29 April 2019).
- Schmidt, M.; Lucas, R.; Bunting, P.; Verbesselt, J.; Armston, J. Multi-resolution time series imagery for forest disturbance and regrowth monitoring in Queensland, Australia. Remote Sens. Environ. 2015, 158, 156–168. [Google Scholar] [CrossRef]
- Grogan, K.; Pflugmacher, D.; Hostert, P.; Verbesselt, J.; Fensholt, R. Mapping clearances in tropical dry forests using breakpoints, trend, and seasonal components from modis time series: Does forest type matter? Remote Sens. 2016, 8, 657. [Google Scholar] [CrossRef]
- Watts, L.M.; Laffan, S.W. Effectiveness of the BFAST algorithm for detecting vegetation response patterns in a semi-arid region. Remote Sens. Environ. 2014, 154, 234–245. [Google Scholar] [CrossRef]
- Che, X.; Feng, M.; Yang, Y.; Xiao, T.; Huang, S.; Xiang, Y.; Chen, Z. Mapping extent dynamics of small lakes using downscaling MODIS surface reflectance. Remote Sens. 2017, 9, 82. [Google Scholar] [CrossRef]
- Platt, R.V.; Manthos, D.; Amos, J. Estimating the Creation and Removal Date of Fracking Ponds Using Trend Analysis of Landsat Imagery. Environ. Manag. 2018, 61, 310–320. [Google Scholar] [CrossRef] [PubMed]
- Verbesselt, J.; Zeileis, A.; Herold, M. Near real-time disturbance detection using satellite image time series. Remote Sens. Environ. 2012, 123, 98–108. [Google Scholar] [CrossRef]
- DeVries, B.; Verbesselt, J.; Kooistra, L.; Herold, M. Robust monitoring of small-scale forest disturbances in a tropical montane forest using Landsat time series. Remote Sens. Environ. 2015, 161, 107–121. [Google Scholar] [CrossRef]
- Schultz, M.; Shapiro, A.; Clevers, J.; Beech, C.; Herold, M.; Schultz, M.; Shapiro, A.; Clevers, J.G.P.W.; Beech, C.; Herold, M. Forest Cover and Vegetation Degradation Detection in the Kavango Zambezi Transfrontier Conservation Area Using BFAST Monitor. Remote Sens. 2018, 10, 1850. [Google Scholar] [CrossRef]
- Murillo-Sandoval, P.J.; Hilker, T.; Krawchuk, M.A.; Van Den Hoek, J. Detecting and attributing drivers of forest disturbance in the Colombian andes using landsat time-series. Forests 2018, 9, 269. [Google Scholar] [CrossRef]
- Zhu, Z.; Woodcock, C.E. Continuous change detection and classification of land cover using all available Landsat data. Remote Sens. Environ. 2014, 144, 152–171. [Google Scholar] [CrossRef]
- Zhu, Z.; Woodcock, C.E.; Holden, C.; Yang, Z. Generating synthetic Landsat images based on all available Landsat data: Predicting Landsat surface reflectance at any given time. Remote Sens. Environ. 2015, 162, 67–83. [Google Scholar] [CrossRef]
- Deng, C.; Zhu, Z. Continuous subpixel mapping of impervious surface area using Landsat time series. Remote Sens. Environ. 2018. [Google Scholar] [CrossRef]
- Zhu, Z.; Zhang, J.; Yang, Z.; Aljaddani, A.H.; Cohen, W.B.; Qiu, S.; Zhou, C. Continuous monitoring of land disturbance based on Landsat time series. Remote Sens. Environ. 2019. [Google Scholar] [CrossRef]
- Brooks, E.B.; Wynne, R.H.; Thomas, V.A.; Blinn, C.E.; Coulston, J.W. On-the-fly massively multitemporal change detection using statistical quality control charts and landsat data. IEEE Trans. Geosci. Remote. Sens. 2014, 52, 3316–3332. [Google Scholar] [CrossRef]
- Brooks, E.B.; Wynne, R.H.; Thomas, V.A.; Blinn, C.E.; Coulston, J. Exponentially Weighted Moving Average Change Detection—Script and Sample Data. Available online: http://vtechworks.lib.vt.edu/handle/10919/50544 (accessed on 29 April 2019). [CrossRef]
- Brooks, E.B.; Yang, Z.; Thomas, V.A.; Wynne, R.H. Edyn: Dynamic signaling of changes to forests using exponentially weighted moving average charts. Forests 2017, 8, 304. [Google Scholar] [CrossRef] [Green Version]
- White, M.A.; Thornton, P.E.; Running, S.W. A continental phenology model for monitoring vegetation responses to interannual climatic variability. Glob. Biogeochem. Cycles 1997, 11, 217–234. [Google Scholar] [CrossRef]
- De Jong, R.; Verbesselt, J.; Schaepman, M.E.; de Bruin, S. Trend changes in global greening and browning: Contribution of short-term trends to longer-term change. Glob. Chang. Biol. 2012, 18, 642–655. [Google Scholar] [CrossRef]
- Verbesselt, J.; Hyndman, R.; Newnham, G.; Culvenor, D. Detecting trend and seasonal changes in satellite image time series. Remote Sens. Environ. 2010, 114, 106–115. [Google Scholar] [CrossRef]
- DeVries, B.; Decuyper, M.; Verbesselt, J.; Zeileis, A.; Herold, M.; Joseph, S. Tracking disturbance-regrowth dynamics in tropical forests using structural change detection and Landsat time series. Remote Sens. Environ. 2015, 169, 320–334. [Google Scholar] [CrossRef]
- Zeileis, A. A unified approach to structural change tests based on ML scores, F statistics, and OLS residuals. Econom. Rev. 2005, 24, 445–466. [Google Scholar] [CrossRef]
- Tang, X.; Bullock, E.L.; Olofsson, P.; Estel, S.; Woodcock, C.E. Near real-time monitoring of tropical forest disturbance: New algorithms and assessment framework. Remote Sens. Environ. 2019, 224, 202–218. [Google Scholar] [CrossRef]
- Awty-Carroll, K. Simulated NDVI Time Series Repository. Available online: osf.io/taf9y (accessed on 29 April 2019). [CrossRef]
- Jönsson, P.; Eklundh, L. Seasonality extraction by function fitting to time-series of satellite sensor data. IEEE Trans. Geosci. Remote. Sens. 2002, 40, 1824–1832. [Google Scholar] [CrossRef]
- Jönsson, P.; Eklundh, L. TIMESAT—A program for analyzing time-series of satellite sensor data. Comput. Geosci. 2004, 30, 833–845. [Google Scholar] [CrossRef] [Green Version]
- Gorelick, N.; Hancher, M.; Dixon, M.; Ilyushchenko, S.; Thau, D.; Moore, R. Google Earth Engine: Planetary-scale geospatial analysis for everyone. Remote Sens. Environ. 2017, 202, 18–27. [Google Scholar] [CrossRef]
- Lewis, A.; Lymburner, L.; Purss, M.B.J.; Brooke, B.; Evans, B.; Ip, A.; Dekker, A.G.; Irons, J.R.; Minchin, S.; Mueller, N.; et al. Rapid, high-resolution detection of environmental change over continental scales from satellite data—The Earth Observation Data Cube. Int. J. Digit. Earth 2016, 9, 106–111. [Google Scholar] [CrossRef]


| SOS | |
|---|---|
| 5 | −13 |
| 10 | −22 |
| 15 | −30 |
| 20 | −37 |
| 25 | −43 |
| 30 | −49 |
| Simulation Type | Levels | No. Simulations |
|---|---|---|
| No change | — | 2400 |
| Trend only | 0.002, 0.0015, 0.001, −0.001, −0.0015, −0.002 | 14,400 |
| Break/trend | 0.3, 0.2, 0.1, −0.1, −0.2, −0.3 | 100,800 |
| Amplitude change | 0.3, 0.2, 0.1, −0.1, −0.2, −0.3 | 14,400 |
| LOS change | 5, 10, 15, 20, 25, 30 | 14,400 |
| NOS change | One to two, two to one | 4800 |
| Total | — | 151,200 |
| Simulation Type | BFAST | BFAST Monitor | CCDC | CCDC (CV) | EWMACD |
|---|---|---|---|---|---|
| No change | 0.274 | 0.033 | 0.130 | 1.781 | 0.012 |
| Trend only | 0.281 | 0.040 | 0.131 | 1.893 | 0.097 |
| Break/trend | 1.010 | 0.058 | 0.108 | 1.353 | 0.042 |
| Amplitude change | 0.753 | 0.045 | 0.127 | 1.563 | 0.050 |
| LOS change | 0.725 | 0.041 | 0.136 | 1.523 | 0.035 |
| NOS change | 0.149 | 0.043 | 0.140 | 1.309 | 0.054 |
| Overall, mean | 0.534 | 0.043 | 0.129 | 1.570 | 0.048 |
| Simulation Set | |||||||
|---|---|---|---|---|---|---|---|
| Method | None | Trend | Amplitude | LOS | NOS | Break/Trend | |
| Correct breaks (%) | BFAST | 81.8 | 81.2 | 04.9 | 02.9 | 01.5 | 81.2 |
| BFASTM | 40.4 | 40.4 | 53.7 | 28.8 | 71.3 | 57.8 | |
| CCDC | 97.5 | 97.6 | 14.6 | 09.3 | 32.9 | 64.1 | |
| CCDC (CV) | 87.3 | 96.3 | 20.3 | 13.5 | 51.5 | 65.8 | |
| EWMACD | 80.0 | 99.7 | 66.8 | 37.2 | 64.1 | 84.3 | |
| False breaks (%) | BFAST | 18.3 | 18.8 | 53.3 | 39.4 | 05.5 | 29.2 |
| BFASTM | 59.6 | 59.6 | 49.7 | 46.1 | 43.3 | 50.7 | |
| CCDC | 02.5 | 02.4 | 10.2 | 12.7 | 37.6 | 25.0 | |
| CCDC (CV) | 12.8 | 03.7 | 14.3 | 16.1 | 31.4 | 32.5 | |
| EWMACD | 20.0 | 00.3 | 39.9 | 39.5 | 50.2 | 17.6 | |
| Method | Extreme | Moderate | Subtle | ||
|---|---|---|---|---|---|
| Correct breaks (%) | BFAST | 85.8 | 82.0 | 74.2 | |
| BFAST Monitor | 67.1 | 59.6 | 43.2 | ||
| CCDC | 81.3 | 67.8 | 36.9 | ||
| CCDC with CV | 78.8 | 68.2 | 45.8 | ||
| EWMACD | 88.4 | 84.9 | 77.9 | ||
| False breaks (%) | BFAST | 25.7 | 28.5 | 34.5 | |
| BFAST Monitor | 43.3 | 49.4 | 61.9 | ||
| CCDC | 18.1 | 26.3 | 32.8 | ||
| CCDC with CV | 27.9 | 34.1 | 36.6 | ||
| EWMACD | 13.5 | 15.1 | 20.4 | ||
| RMSE magnitude | BFAST | 0.02 | 0.02 | 0.02 | |
| BFAST Monitor | 0.12 | 0.08 | 0.06 | ||
| CCDC | 0.04 | 0.04 | 0.03 | ||
| CCDC with CV | 0.04 | 0.04 | 0.03 | ||
| EWMACD | 0.04 | 0.04 | 0.04 | ||
© 2019 by the authors. Licensee MDPI, Basel, Switzerland. This article is an open access article distributed under the terms and conditions of the Creative Commons Attribution (CC BY) license (http://creativecommons.org/licenses/by/4.0/).
Share and Cite
Awty-Carroll, K.; Bunting, P.; Hardy, A.; Bell, G. An Evaluation and Comparison of Four Dense Time Series Change Detection Methods Using Simulated Data. Remote Sens. 2019, 11, 2779. https://doi.org/10.3390/rs11232779
Awty-Carroll K, Bunting P, Hardy A, Bell G. An Evaluation and Comparison of Four Dense Time Series Change Detection Methods Using Simulated Data. Remote Sensing. 2019; 11(23):2779. https://doi.org/10.3390/rs11232779
Chicago/Turabian StyleAwty-Carroll, Katie, Pete Bunting, Andy Hardy, and Gemma Bell. 2019. "An Evaluation and Comparison of Four Dense Time Series Change Detection Methods Using Simulated Data" Remote Sensing 11, no. 23: 2779. https://doi.org/10.3390/rs11232779
APA StyleAwty-Carroll, K., Bunting, P., Hardy, A., & Bell, G. (2019). An Evaluation and Comparison of Four Dense Time Series Change Detection Methods Using Simulated Data. Remote Sensing, 11(23), 2779. https://doi.org/10.3390/rs11232779